
Alzheimer DataLENS: An Open Data Analytics Portal for Alzheimer’s Disease Research
Abstract
Background:
Recent Alzheimer’s disease (AD) discoveries are increasingly based on studies from a variety of omics technologies on large cohorts. Currently, there is no easily accessible resource for neuroscientists to browse, query, and visualize these complex datasets in a harmonized manner.
Objective:
Create an online portal of public omics datasets for AD research.
Methods:
We developed Alzheimer DataLENS, a web-based portal, using the R Shiny platform to query and visualize publicly available transcriptomics and genetics studies of AD on human cohorts. To ensure consistent representation of AD findings, all datasets were processed through a uniform bioinformatics pipeline.
Results:
Alzheimer DataLENS currently houses 2 single-nucleus RNA sequencing datasets, over 30 bulk RNA sequencing datasets from 19 brain regions and 3 cohorts, and 2 genome-wide association studies (GWAS). Available visualizations for single-nucleus data include bubble plots, heatmaps, and UMAP plots; for bulk expression data include box plots and heatmaps; for pathways include protein-protein interaction network plots; and for GWAS results include Manhattan plots. Alzheimer DataLENS also links to two other knowledge resources: the AD Progression Atlas and the Astrocyte Atlas.
Conclusions:
Alzheimer DataLENS is a valuable resource for investigators to quickly and systematically explore omics datasets and is freely accessible at https://alzdatalens.partners.org.
Introduction
Research studies into Alzheimer’s disease (AD) and related dementias have historically been constrained by the lack of deep phenotyping. Histopathological examination of brain tissue was often limited by the number of quantifiable proteins or transcripts and small sample sizes. In recent years, however, the advent of new omics technologies— including transcriptomics (e.g., bulk, single-cell, single-nucleus, and spatial RNA sequencing [RNA-seq]), proteomics (e.g., multiplexed immunohistochemistry, mass spectrometry), and genomics (e.g., genome-wide association studies [GWAS], whole exome and whole genome sequencing)— has enabled deep phenotyping of the molecular and cellular changes that underlie AD across many modalities and large patient cohorts. In particular, single-cell technologies have begun to illuminate the heterogeneous states of the various brain cell types and their responses to AD pathology [1–6], their spatial relationships [7–9], and their genomic and epigenomic landscapes [10, 11]. As datasets generated by these methods increase in dimensionality and complexity, the barrier to new insights in AD research is no longer just the acquisition of sufficient data; rather, neuroscientists must also make sense of these high dimensional and multimodal datasets, which may span an array of technological platforms, inclusion criteria, disease stages, and brain regions studied. Only by visualizing and summarizing results across these diverse experimental conditions may we begin to appreciate the key changes driving AD.
To that end, there is a need for publicly available tools for neuroscientists to query omics studies from AD cohorts. Online portals and application programming interfaces (APIs) exist to store and share AD-related data: these include the Gene Expression Omnibus (GEO) repository [12, 13] and associated GEOquery software [14], the AD Knowledge Portal with the associated Synapse platform by Sage Bionetworks [15], and the National Institute on Aging Genetics of Alzheimer’s Disease Data Storage Site (NIAGADS) [16]. Although these repositories are valuable for computational scientists to access and analyze raw files, they remain inaccessible to neuroscientists who seek to investigate a gene or pathway of interest. Other data explorers have also been developed to host and visualize data from control and AD brains, such as the Seattle Alzheimer’s Disease Brain Cell Atlas (SEA-AD, http://sea-ad.org) [17], http://adsn.ddnetbio.com [1] and https://www.brainrnaseq.org [18]. These web tools, however, are specific to individual studies or platforms, and there remains no general reference platform for neuroscientists to easily access, analyze, and visualize AD omics data across a range of studies.
To address this need, we developed Alzheimer DataLENS, a data analytics portal that aims to advance research in AD and related dementias by democratizing AD omics data access and making consistent data analysis pipelines available to all neuroscientists. DataLENS features bioinformatics pipelines for the analysis of omics data on AD and related dementias as well as streamlined web interfaces which allow neuroscientists to browse and query the results of those analyses.
MATERIALS AND METHODS
Overall architecture
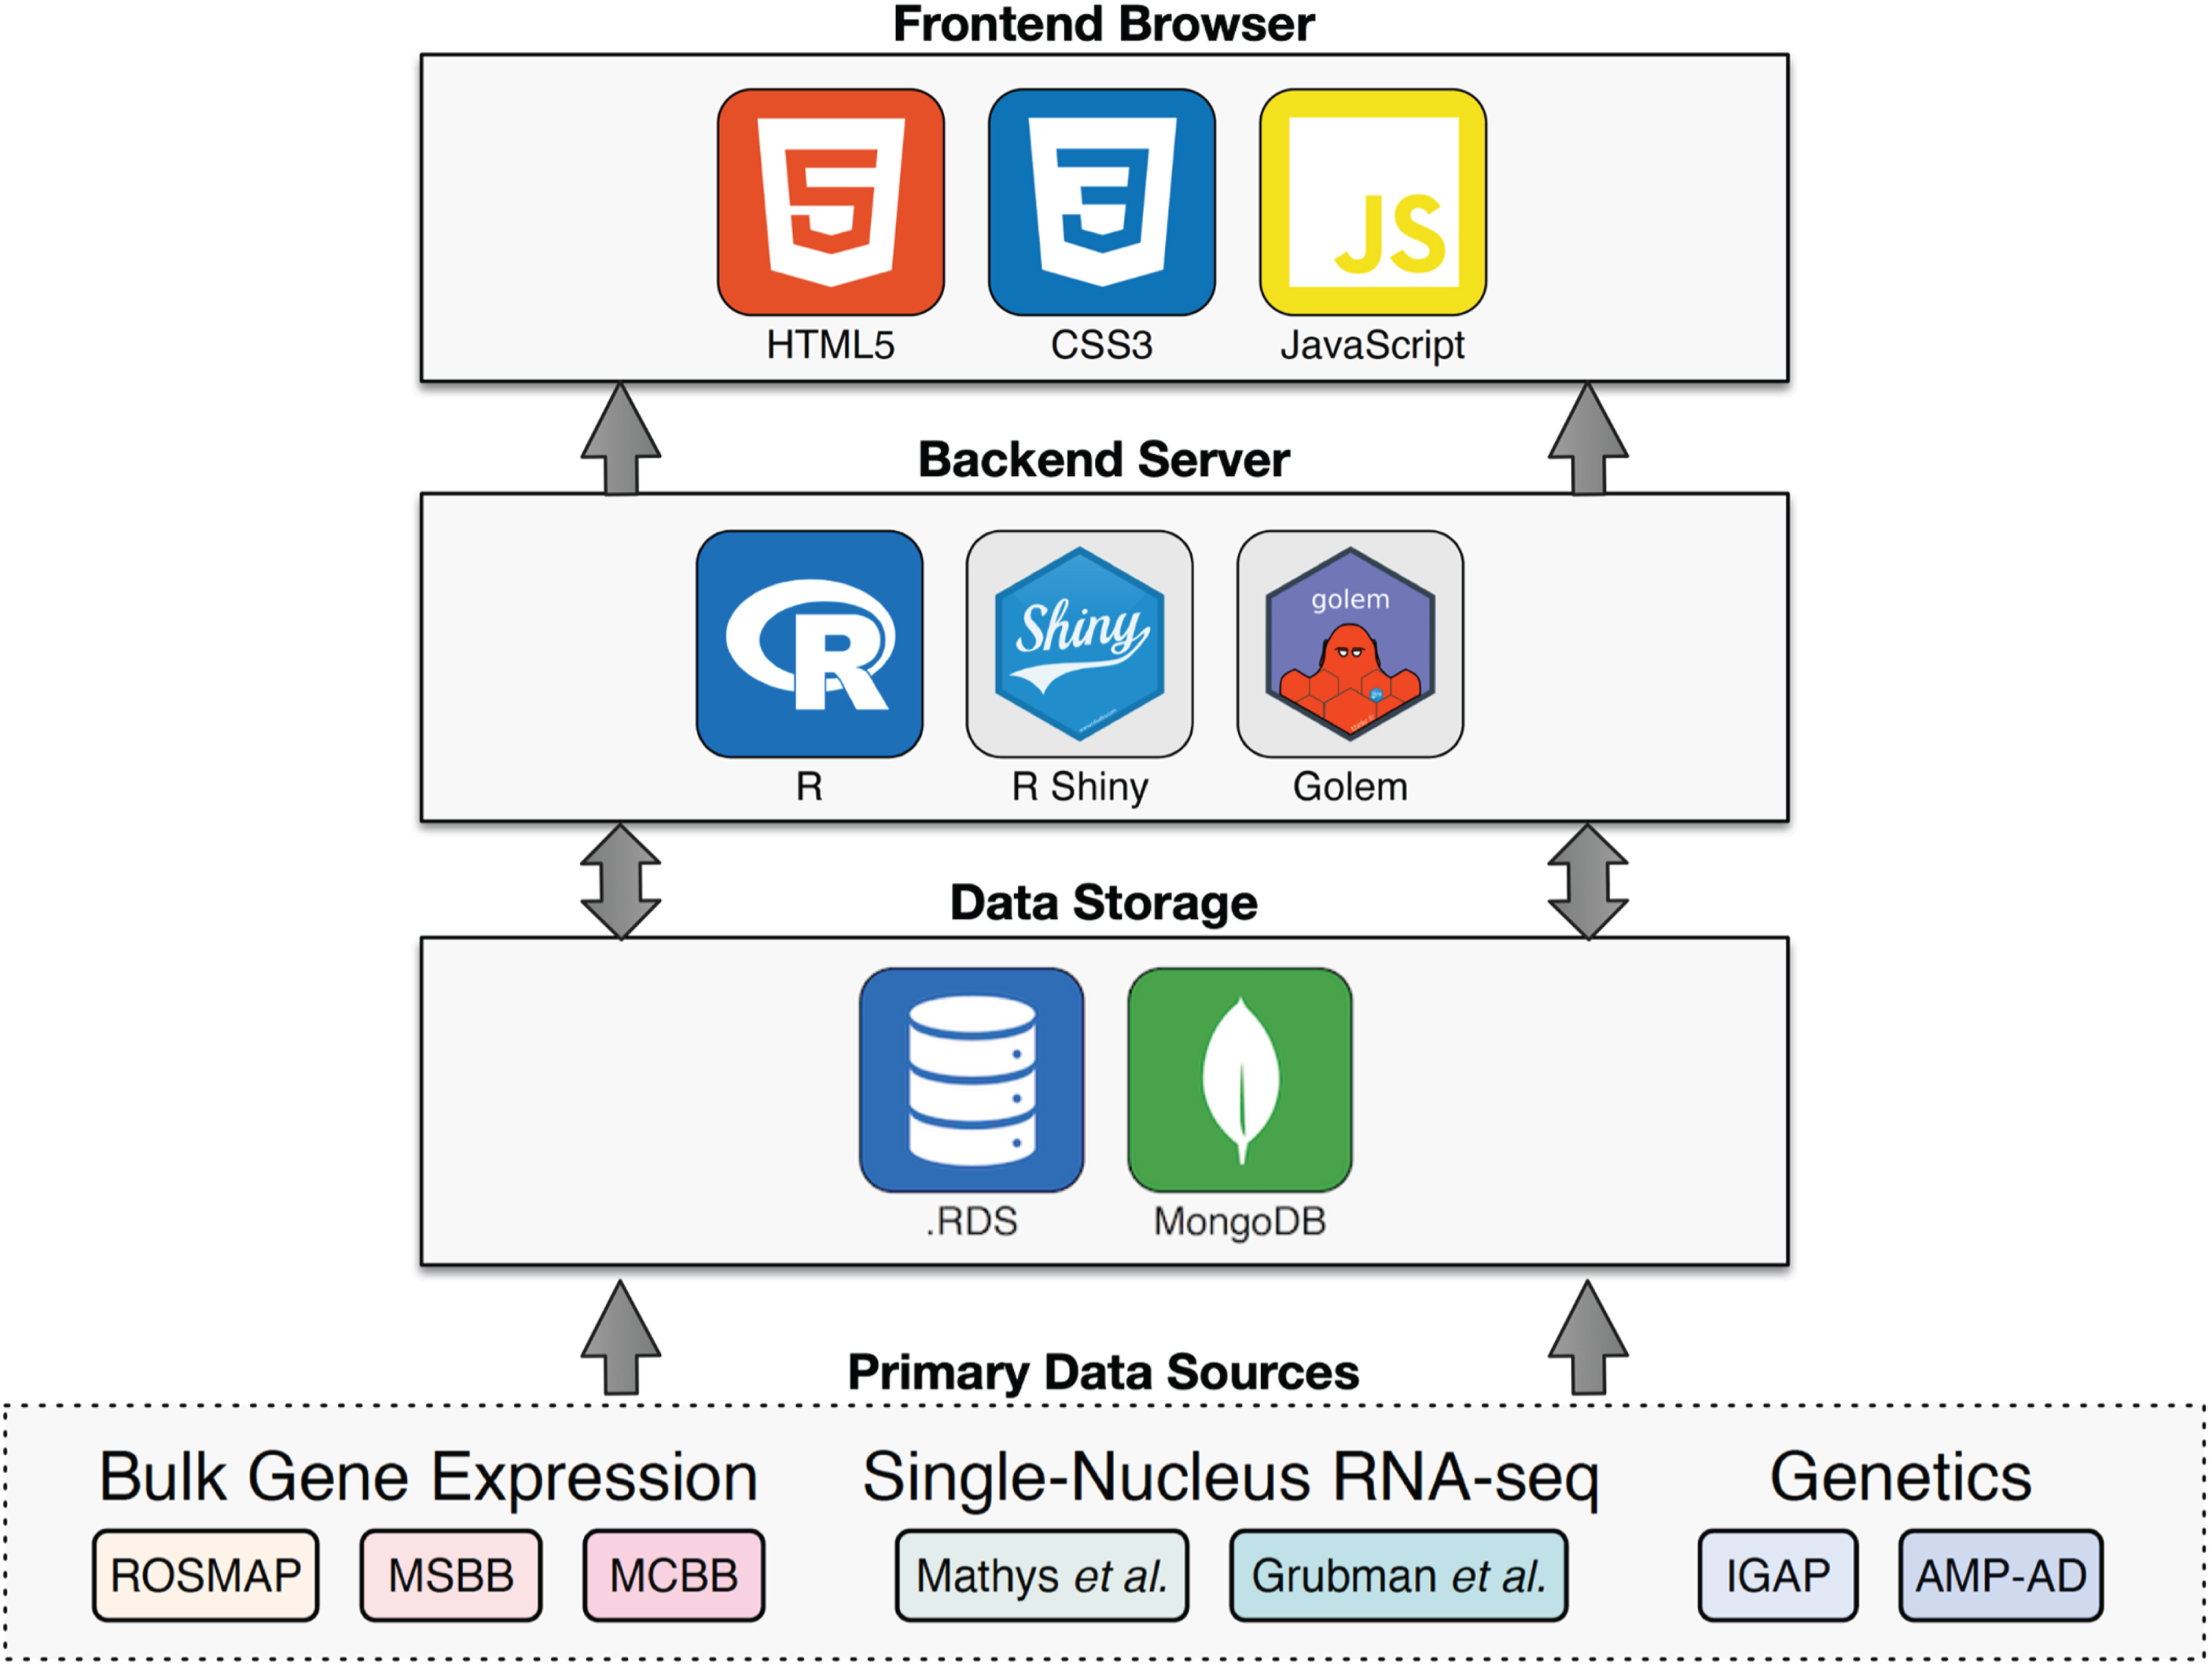
DataLENS is an R Shiny web application with an HTML, CSS, and JavaScript front-end, an R back-end, and a MongoDB database. Specifically, the golem framework for building high performance production-grade Shiny applications [19] was used. Web pages within DataLENS correspond to individual Shiny modules, each with its own namespace, UI, and server functions. We selected a document-oriented database such as MongoDB to accommodate different relational architectures among datasets included in DataLENS, and permit datasets to be deposited in DataLENS while retaining their original schemas. For instances where fast retrieval was required, datasets were also stored in the native R data file format. All required data pre-processing was performed in R prior to insertion into the database. The overall architecture of DataLENS is shown in Fig. 1.
Fig. 1
Architecture overview. Summary of the technology stack used in Alzheimer DataLENS. Primary data is processed by consistent pipelines and stored either in a MongoDB database or as.RDS files. The R Shiny server queries and processes the data to display on the front-end web browser.
Bulk gene expression dataset retrieval and processing
Bulk gene expression (RNA-seq and microarray) data was obtained from three Accelerating Medicines Partnership Program for Alzheimer’s Disease (AMP-AD) studies: the Religious Orders Study and Memory and Aging Project (ROSMAP), the Mount Sinai Brain Bank (MSBB) study, and the Mayo Clinic Brain Bank (MCBB), as described previously [20]. The ROSMAP study included RNA-seq data from the dorsolateral prefrontal cortex of 638 donors [21, 22]. Clinical and demographic covariates, including sex, race, age of death, APOE status, and clinical and neuropathological scores, were available for all donors. The ROSMAP study also provides microarray data [23]. The MSBB study contains RNA-seq data from 301 individuals across four brain regions: inferior frontal gyrus, superior temporal gyrus, parahippocampal gyrus, and frontal pole [24]. Covariates, including sex, race, age of death, APOE status, and clinical and neuropathological scores, were reported. The MSBB study also contains microarray data from 19 different brain regions [25]. For MCBB, RNA-seq data was collected from 275 cerebellar and 276 temporal cortex samples [26] and microarray data was also obtained from the cerebellar and temporal cortices [27].
All transcriptomics data was processed in a consistent manner as described previously [20]. Differential gene expression analysis was performed using the limma voom package. No prior filtering was performed, neither on variance nor intensity. If the data was available as raw counts, trimmed mean of M values (TMM) normalization was performed with the edgeR package [28]. Counts per million (CPM) and fragments per kilobase of transcript per million (FPKM) data were directly analyzed with limma following a log-transformation. For microarray datasets, the probe annotation file was downloaded from the Gene Expression Omnibus (GEO) repository; poor quality Illumina mRNA probes were identified and removed. Multiple comparison adjustments were performed using the Benjamin-Hochberg method for both RNA-seq and microarray datasets. After differential expression analysis results were generated, all results for each gene, including fold change with confidence intervals, p value, and adjusted p value, along with the respective study information, were recorded in a MongoDB database for easy query and visualization.
Single-nucleus RNA-sequencing dataset retrieval and processing
The single nucleus RNA-seq (snRNA-seq) datasets from the Mathys et al. [4] and Grubman et al. [1] studies were downloaded. The downloaded data was processed with the Seurat R package (version 4.0.0) [29], which is often used for analysis of single-nucleus studies. Subsequently, the ShinyCell package [30] was used to convert the results to.RDS objects that were then loaded into DataLENS. For the aggregate analysis, average expression across all cells and the proportion of cells where the gene is expressed were computed for each gene by user-specified variable of interest (e.g., different cell types). For the cell level analysis, if processed data was not available, we removed cells with fewer than 200 genes, greater than 20,000 unique molecular identifiers, and/or greater than 15% mitochondrial genes, and used reciprocal principal component analysis integration based on the top 2,000 highly variable genes to remove donor-specific effects. Gene expression data was log-normalized, scaled, and subjected to principal component analysis to choose the number of principal components for clustering, which was followed by non-linear dimensionality reduction via uniform manifold approximation and projection (UMAP). Cell level UMAP embeddings were created using the RunUMAP function from Seurat. The proportion of cells across user-specified variables of interest (e.g., cell types in disease versus control donors) was also computed.
Query and visualization
Queries for results of bulk transcriptomics analysis and GWAS studies were made to the MongoDB database using the mongolite library in R. The results were processed in R using the data.table package and were rendered using the reactable package, which is based on React Table, a front-end JavaScript library to allow interactive table sorting, filtering, and pagination.
All plots were first created in R using the ggplot2 package, an open-source data visualization toolkit based on The Grammar of Graphics; subsequently, plots were made interactive using functionality from the plotly and ggiraph packages. Visualization of transcriptomics data was performed using the ggplot function. The bubble charts, heatmaps, proportion plots, box plots, and violin plots were created with the geom_point, geom_tile, geom_col, geom_box, and geom_violin functions, respectively. The colors in the bubble charts and heatmaps represent average expression, while bubble size represents the proportion of cells where the queried gene is expressed. UMAP plots were created with the geom_scatter function and the Manhattan plot was created using the geom_point function. The protein-protein interaction network plot was created using the geom_point_interactive and geom_edge_link functions from the ggraph package, an extension of ggplot2 to support relational data structures like graphs. Finally, the visualization of brain regions was created using the Desikan-Killiany and automatic subcortical segmentation atlases from the ggseg package, an extension of ggplot2 to support the plotting of brain atlases.
Results
Alzheimer DataLENS is a unified portal of omics data
Alzheimer DataLENS (https://alzdatalens.partners.org) is an open data analytics platform that aims to advance research in AD and related dementias by making omics data accessible to everyday neuroscience researchers through (i) consistent pipelines to process and analyze public omics data from AMP-AD and other sources; (ii) easy-to-use web interfaces for query and visualization of these analytics; (iii) information from multiple heterogenous modalities to present an integrated view of molecular mechanisms to a neuroscientist; and (iv) tools and methods open to all bioinformatics researchers. Alzheimer DataLENS allows the exploration of single-cell transcriptomics studies, including cell-level and aggregate queries of public datasets; bulk transcriptomics studies, including the query and visualization of public human datasets spanning multiple brain regions and cohorts; and GWAS studies, including the query and visualization of the International Genomics of Alzheimer’s Project (IGAP) meta-analysis [31] and AMP-AD GWAS results [32].
Bulk RNA-sequencing query and visualization
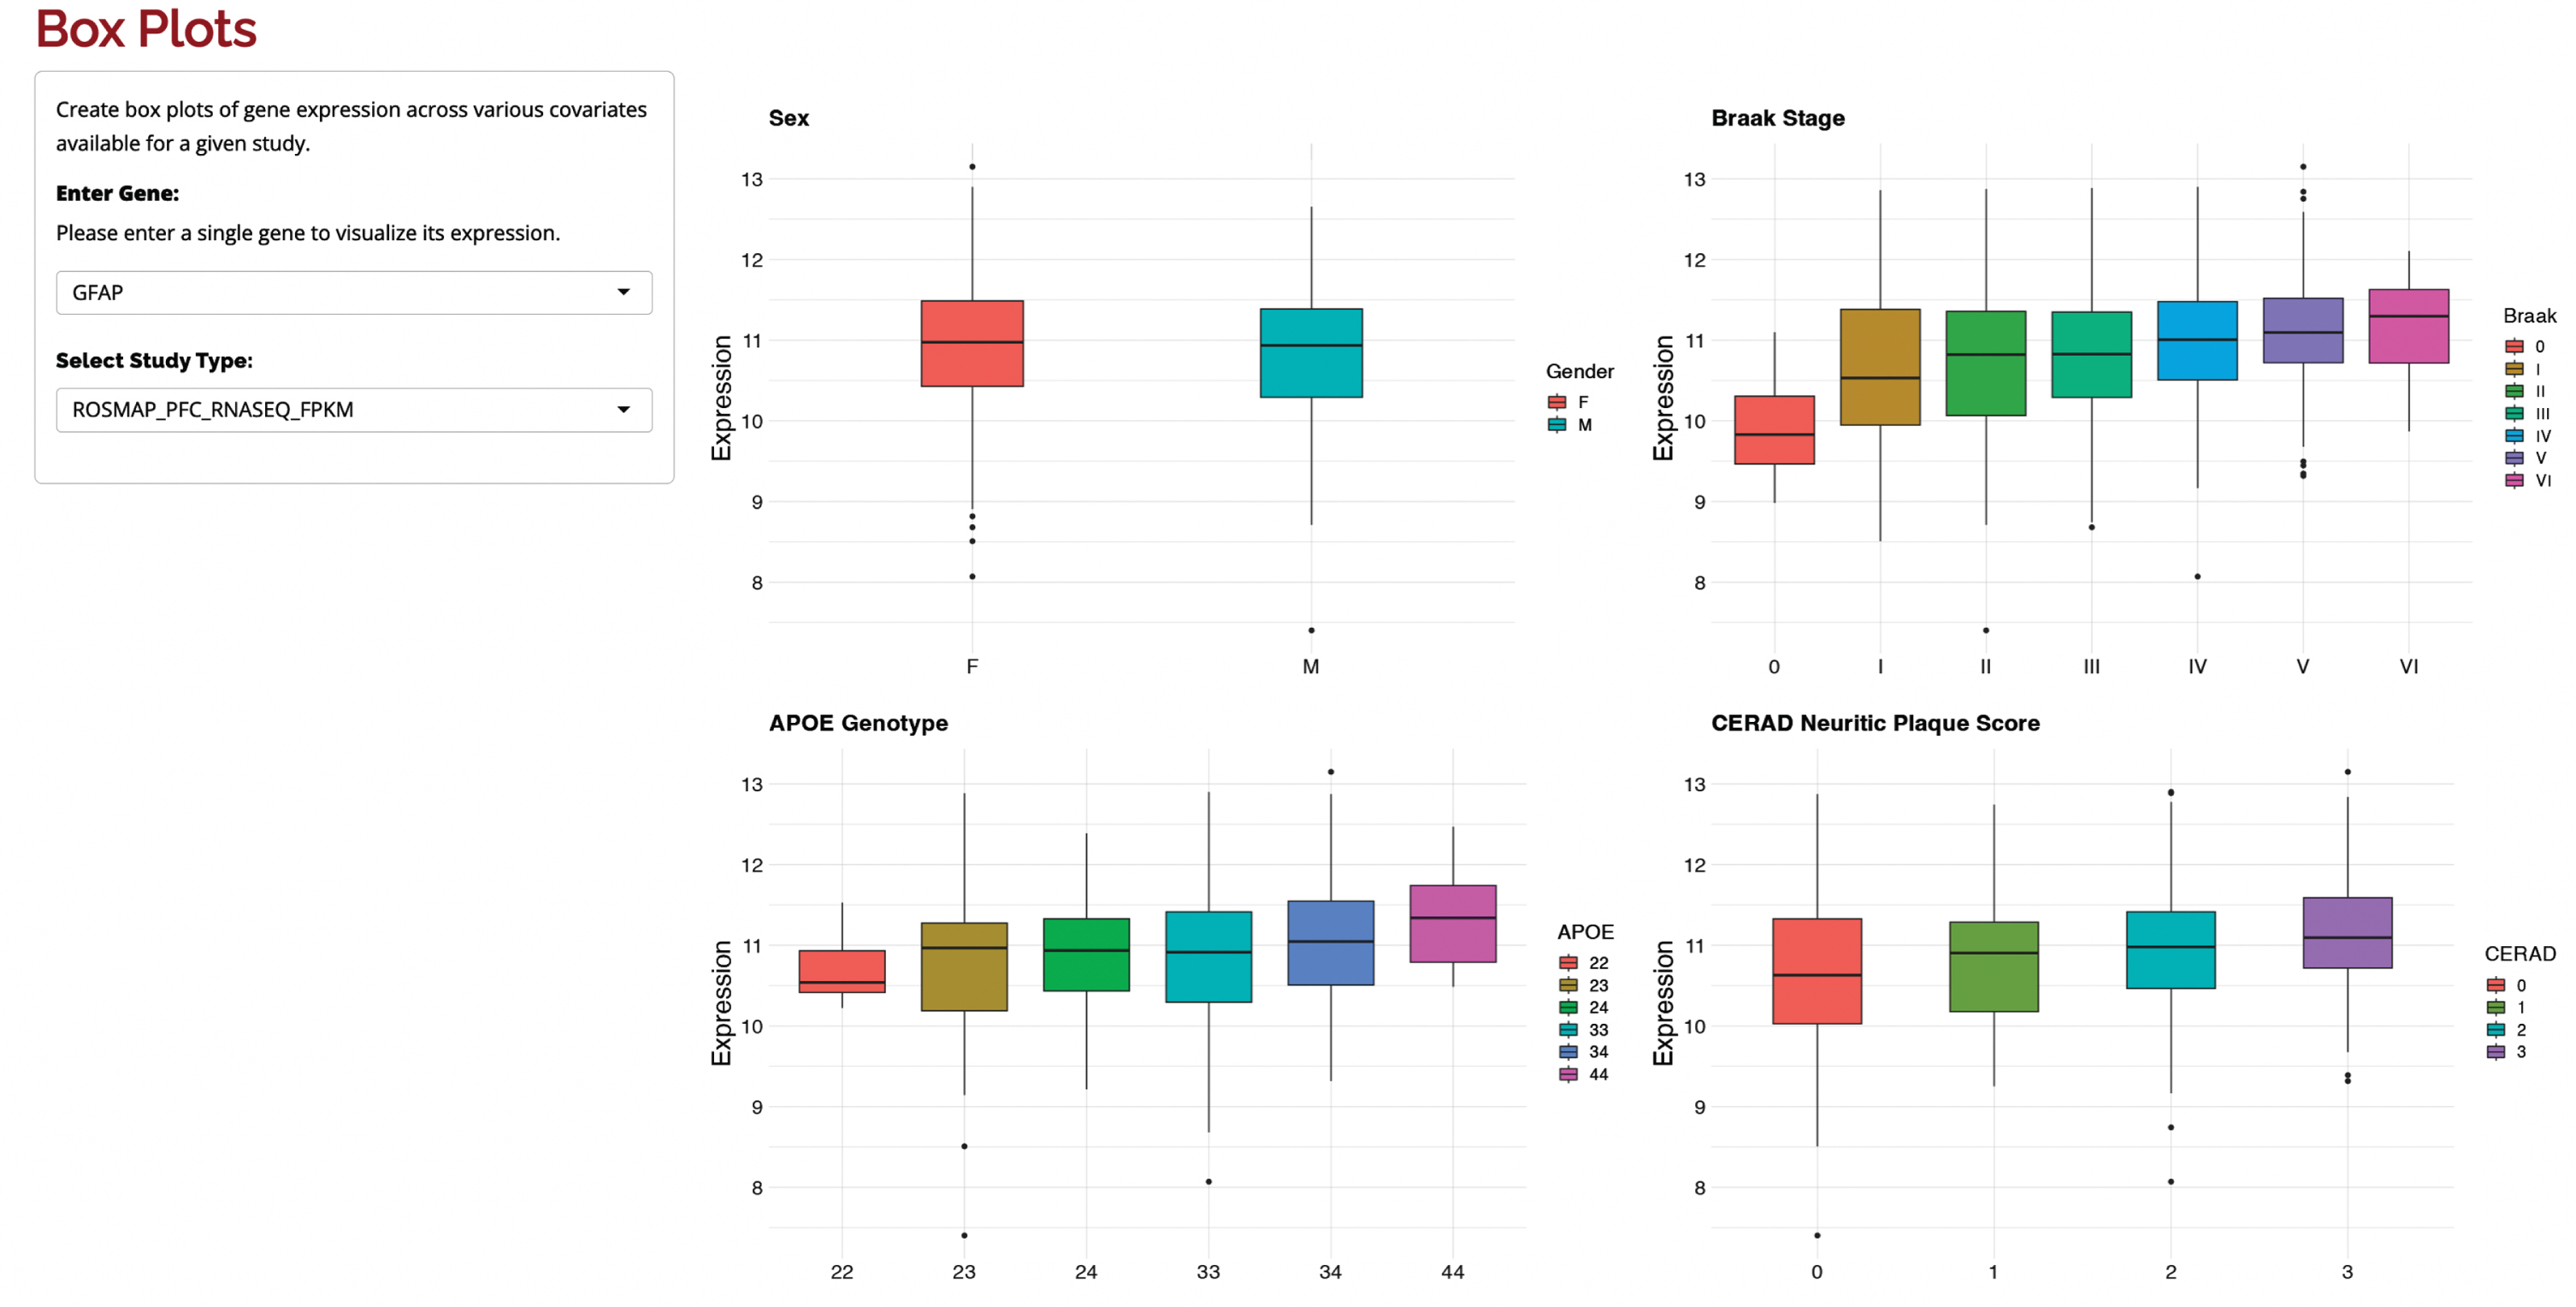
Bulk RNA-seq results can be explored via several avenues, including regional analysis, interaction network plots, box plots, and heatmaps. In regional analyses, the transcriptomic datasets available for the brain regions of interest can be explored and visualized, and accession codes (e.g., GEO and Synapse IDs) are made available for downstream query and retrieval. In network analysis, relationships between genes of interest are shown as edges in a graph, which is constructed based on the STRING database of known and predicted protein-protein interactions. Nodes in the PPI network are colored according to the fold-change in the selected dataset, node size represents statistical significance, and edge thickness represents the combined score of evidence for interaction between two nodes. Differential gene expression results across various covariates available for a given study can be easily queried using a list of gene symbols. Top differentially expressed genes with effect size, confidence intervals, significance (both adjusted and unadjusted p-values), and other details are shown in a table that can be sorted, filtered, and downloaded as a comma-separated file. To further investigate gene expression changes, users can also create box plots and heatmaps of gene expression across sex, APOE genotype, Braak neurofibrillary tangle stage, CERAD neuritic plaque score, and/or diagnosis (e.g., AD, progressive supranuclear palsy, pathologic aging, or elderly controls). Example plots for GFAP, a gene expressed in astrocytes that is upregulated in AD in the ROSMAP dataset, are shown in Fig. 2.
Fig. 2
Box plots of GFAP in the ROSMAP dataset. GFAP expression shown across sex, APOE genotype, Braak stage, and CERAD neuritic plaque score. The box plots on the right illustrate the rise in GFAP expression with increasing AD neuropathology.
Single-nucleus RNA-sequencing query and visualization
The single-nucleus transcriptomics section in Alzheimer DataLENS includes both aggregate and cell-level analyses of two publicly available snRNA-seq datasets [1, 4].
The aggregate-level analysis page offers researchers the ability to visualize average gene expression using both bubble plots and heatmaps across various available factors, including cell types, subclusters, and AD disease/pathology. In the bubble plot, researchers can observe both the average gene expression (represented by bubble color) and the proportion of cells expressing a gene in a particular group (indicated by bubble size). On the other hand, the heatmap displays only the average gene expression (represented again by color) for each group. Figure 3 presents an illustrative example of several cell type-specific genes plotted using this approach.
Fig. 3
Aggregate gene expression of several cell-type marker genes. The bubble plot shows gene expression of several cell types. Color represents average gene expression, while bubble size indicates the proportion of cells expressing each gene.
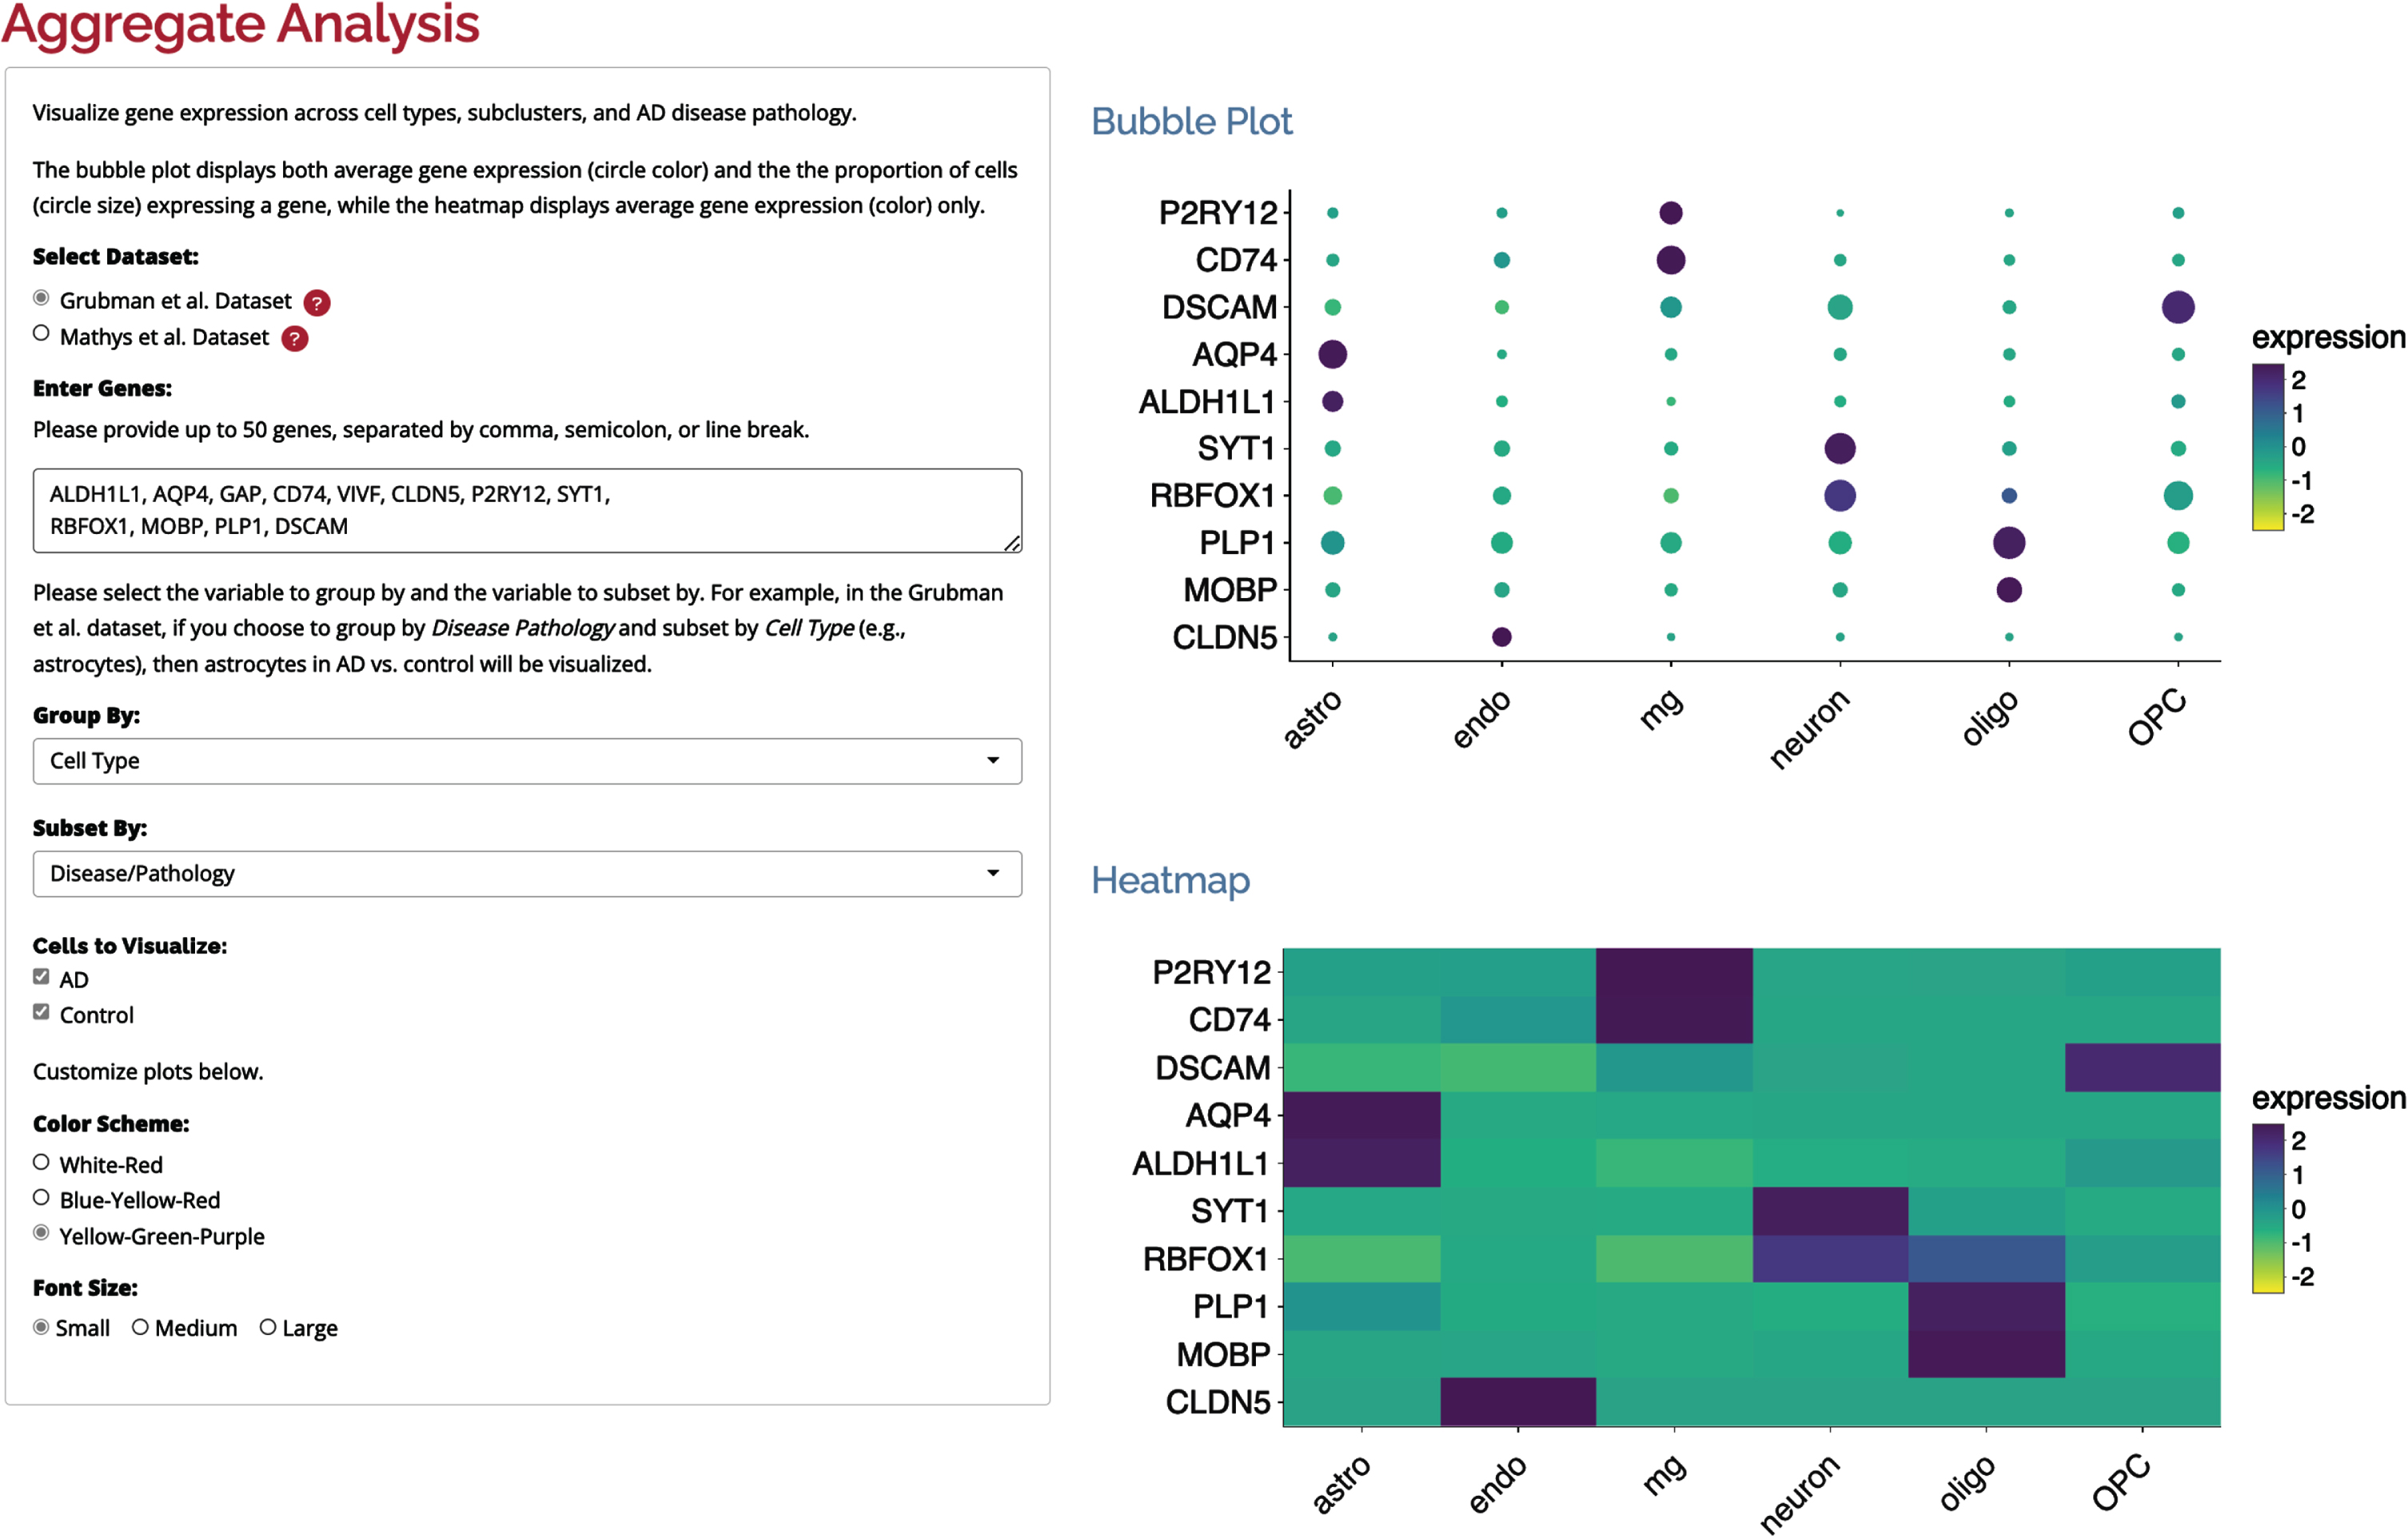
Researchers have the flexibility to choose the variables by which the data is grouped and subset. For instance, in the Grubman et al. dataset, if users choose to group by Disease Pathology and subset by Cell Type (e.g., astrocytes), then astrocytes in AD versus control are visualized. Moreover, users can personalize the color scheme and font size according to their preferences. To enhance the user experience, the plots are interactive, allowing researchers to interact with the visualizations for a more in-depth exploration. Additionally, these plots can be downloaded as portable network graphic (PNG) files, enabling users to include them in their presentations, publications, or further analyses as needed. This comprehensive and user-friendly approach empowers researchers to gain valuable insights into gene expression patterns across different sample parameters and contributes to a deeper understanding of the underlying biology in AD.
Cell-level analysis, on the other hand, offers a powerful approach to visualize and explore cell proportions and cell-level information using dimensionality reduction plots. The proportion plot displays cell proportions based on cell types, subclusters, and disease/pathology. For instance, in the Grubman et al. dataset, one can plot Disease Pathology on the x-axis and group by Astrocyte Subclusters to observe the proportion of each astrocyte subcluster in both AD and control samples. Additionally, by filtering data based on specific attributes like Sex and selecting Female, for example, the plot will exclusively visualize the proportion of cells from female donors. On the UMAP tab, the top plot serves to explore cell-level information across cell types, subclusters, and disease pathology. Each dot on the UMAP plot represents an individual cell, and the proximity of two dots signifies similar transcriptomic profiles. This allows a deep understanding of the cellular landscape and its relation to various factors. The UMAP plot at the bottom depicts gene expression for the selected gene. This feature enables researchers to investigate gene expression patterns at the cellular level and compare them, for example, to the disease pathology patterns, providing valuable insights into the underlying molecular mechanisms. In summary, the cell-level analysis features facilitate the exploration of complex cellular compositions, their proportions, and their gene expression profiles, aiding in the identification of critical relationships between cell types, subclusters, disease pathology, and gene expression patterns in AD.
Genetics
GWAS studies are essential in understanding the genetic basis of complex diseases like AD. Alzheimer DataLENS goes beyond bulk transcriptomics and cell-level analysis and also provides access to valuable genetic data through its integration of two GWAS datasets: the IGAP meta-analysis [31] and the AMP-AD GWAS results [32].
With Alzheimer DataLENS, researchers have the ability to query and visualize these GWAS datasets using either the gene or single nucleotide polymorphism (SNP) identifiers. This flexibility allows users to explore specific genetic variants of interest or investigate the association of particular genes with AD. GWAS studies frequently visualize their results using Manhattan plots; thus, Alzheimer DataLENS also offers an interactive Manhattan plot that displays the associations between genetic variants (SNPs) and the disease (in this case, AD) across the entire genome. Each SNP is represented as a point on the plot, with its position on the x-axis corresponding to its genomic location, and the –log10 (p-value) of its association with the disease on the y-axis. The plot typically shows peaks (indicative of significant associations) rising above a horizontal line representing the significance threshold. By offering an interactive version of the Manhattan plot, Alzheimer DataLENS allows researchers to delve deeper into the genetic associations by zooming in on specific genomic regions of interest, inspecting individual SNP details, and adjusting significance thresholds to identify potential genetic markers related to AD.
Case study
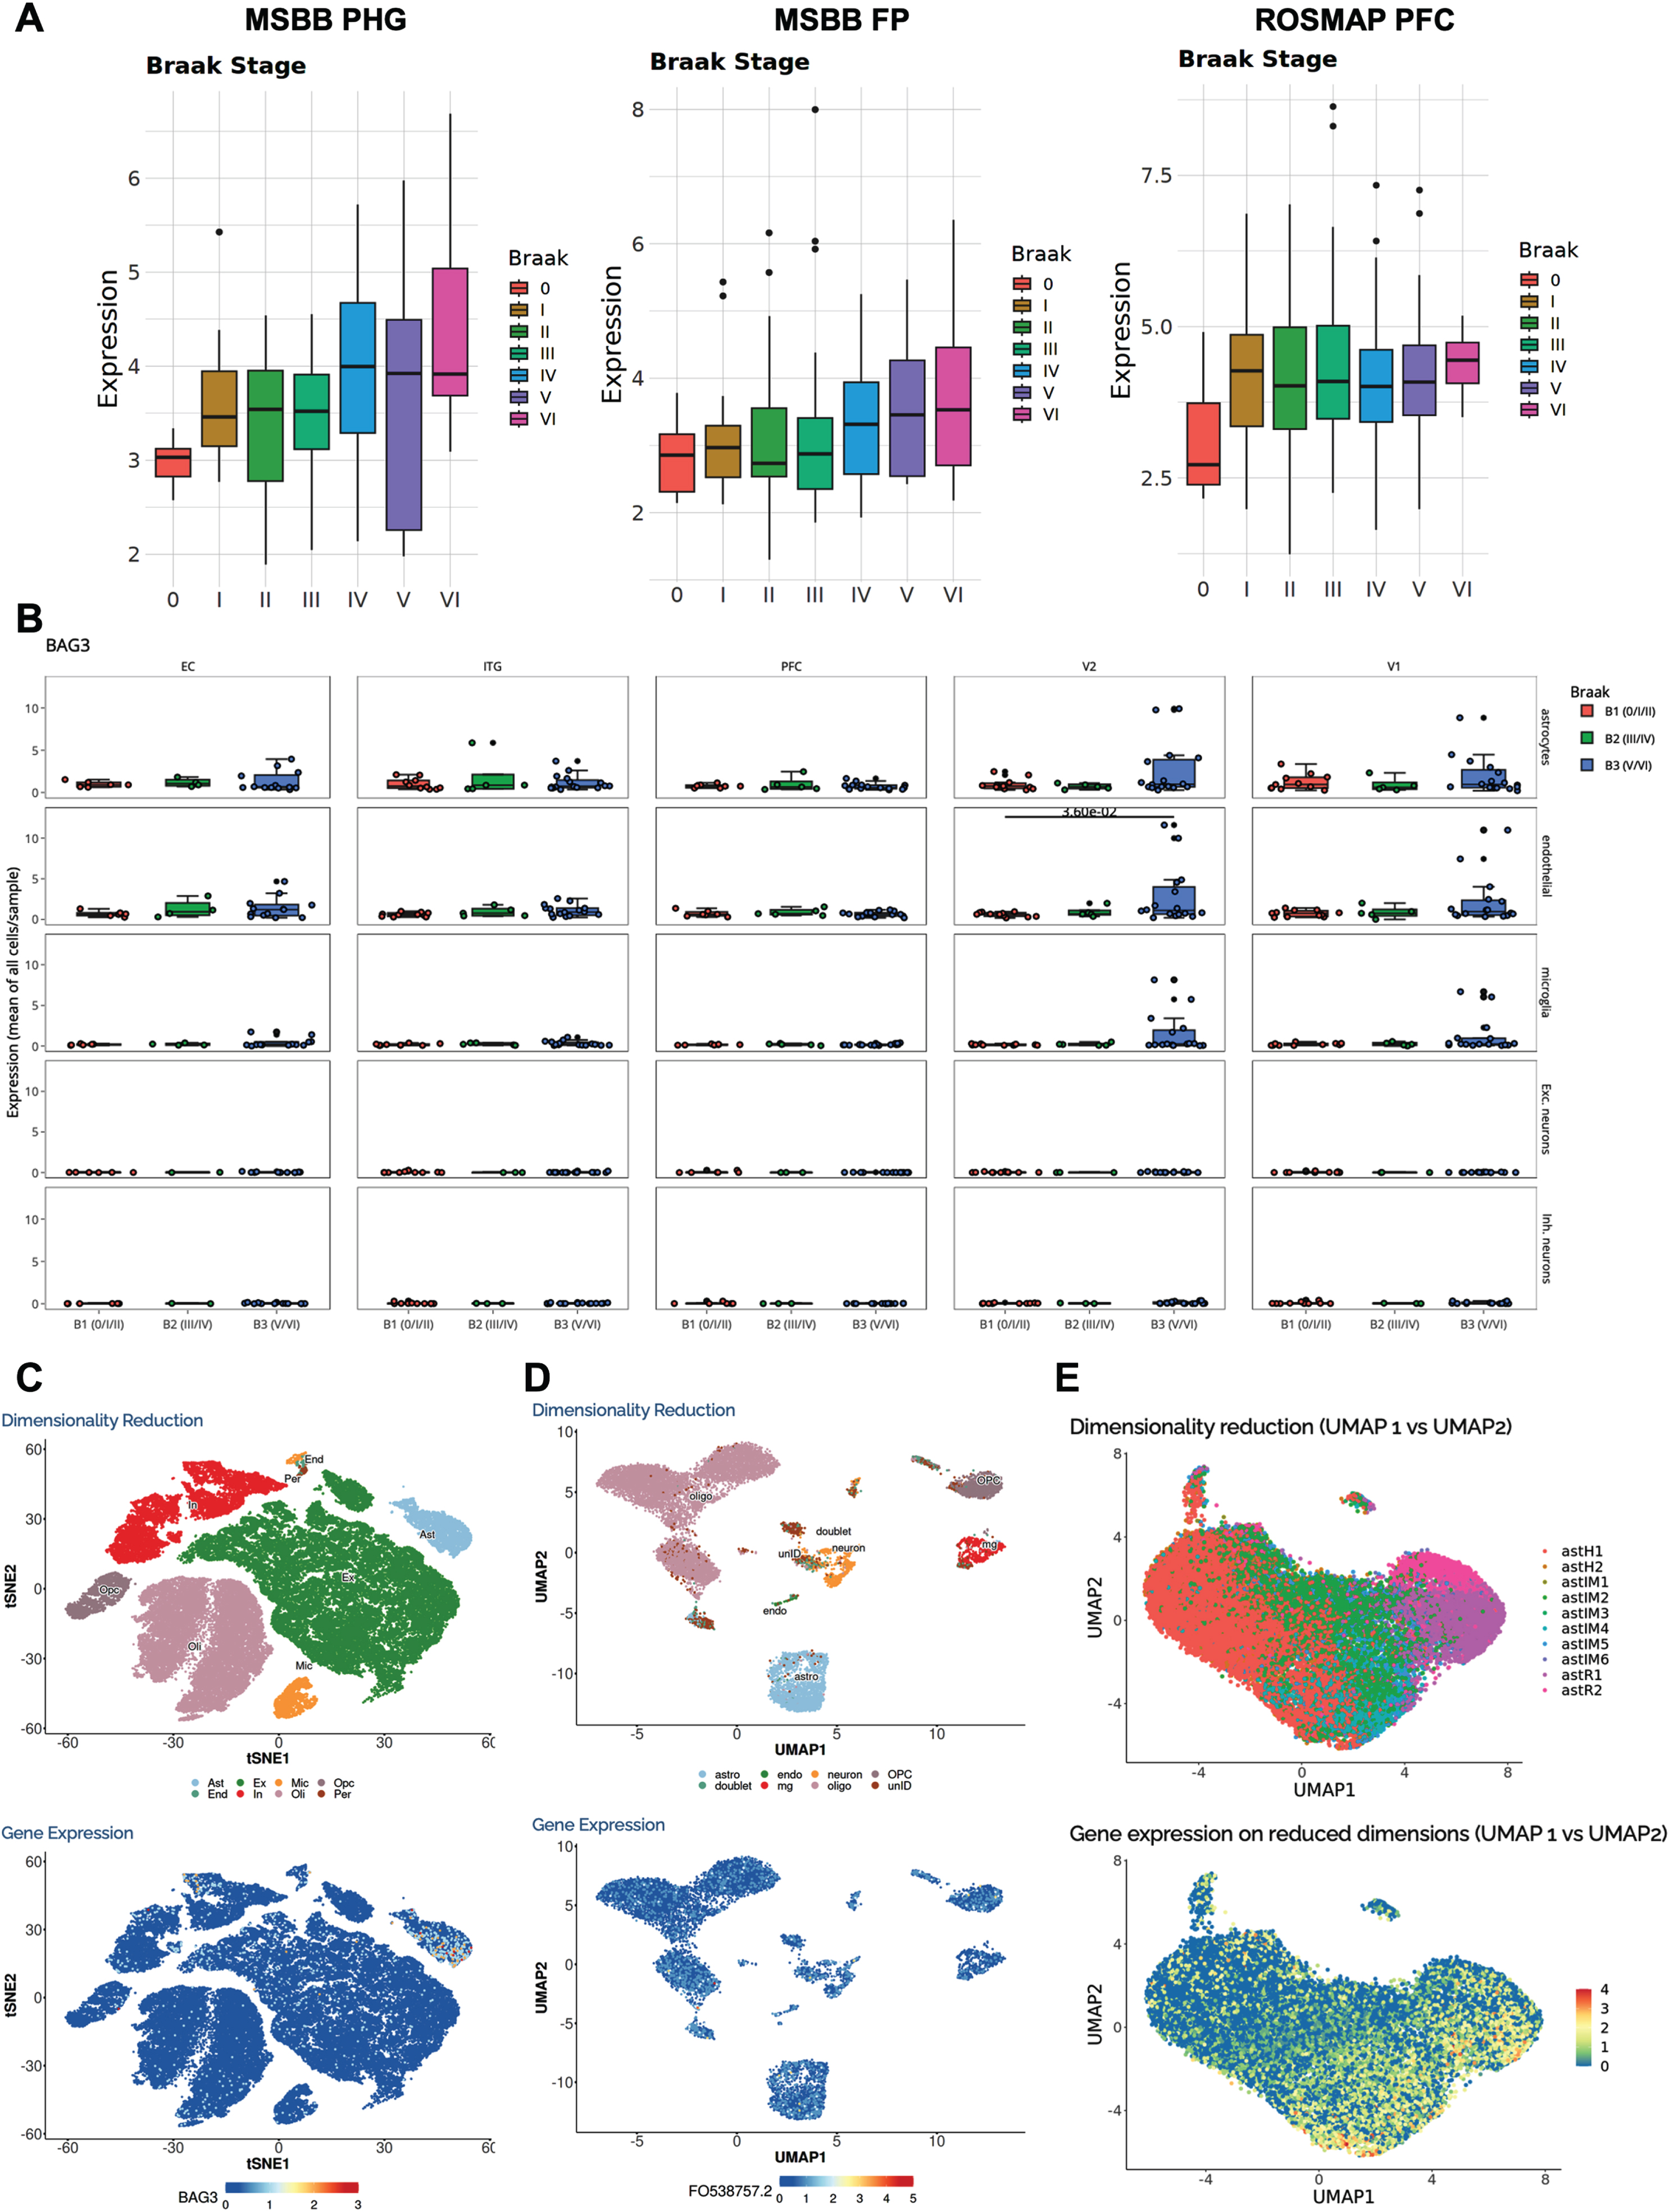
One of the most altered functional pathways in AD and other neurodegenerative proteinopathies is proteostasis, which encompasses the ubiquitin-proteasome and autophagy systems [33, 34]. Consider the BCL2-associated athanogene 3 (BAG3), a cochaperone critical for autophagy that has been reported to clear tau in primary neurons [35, 36] and mouse models of tauopathy [37]. Indeed, the box plots from various bulk RNA-seq datasets obtained by selecting BAG3 in the “Transcriptomics” tab indicate that BAG3 expression increases along Braak neurofibrillary tangle stages in multiple brain regions, supporting the idea that BAG3 may be implicated in the degradation of misfolded tau aggregates by neurons via autophagy (Fig. 4A). However, selecting BAG3 in the snRNA-seq “Sample Level Analysis” tab and “Box Plot Across Braak Stages” in the “Plot Type” menu reveals that the BAG3 upregulation paralleling Braak stages is surprisingly driven mainly by astrocytes, followed by endothelial and microglial cells (oligodendrocytes are not available), whereas both excitatory and inhibitory neurons express BAG3 at very low levels even at advanced Braak stages (Fig. 4B). The “Cell Level Analysis” in the “Transcriptomics Single Nucleus” tab permits the exploration of BAG3 expression at the individual nucleus level in the Mathys et al. and Grubman et al. snRNA-seq datasets (Fig. 4C, D). Overlaying the cell type UMAP with the BAG3 expression level UMAP confirms the astrocyte-predominant expression of BAG3 in both datasets (besides a subset of oligodendrocytes in the Grubman et al. dataset). Moreover, selecting BAG3 and “Astrocyte Subclusters” in the “Cell Level Analysis” tab of AD Progression Atlas— a related knowledge resource recently developed by our group that is linked from the AlzDataLENS website— reveals that the astR2 cluster of reactive astrocytes is driving BAG3 expression, as they exhibit higher levels relative to the homeostatic astrocyte clusters (astH1 and astH2) (Fig. 4E). Remarkably, a recent study has discovered a key role of astrocyte BAG3 in tau and α-synuclein clearance [38].
Fig. 4
BAG3 case study. A) Expression of the autophagy gene BAG3 parallels Braak neurofibrillary tangle stages in several brain regions and bulk RNA-seq datasets, lending support to the hypothesis that it has a key role in tau degradation, as suggested by in vitro studies in primary mouse neurons. B) However, an snRNA-seq study visualized in the AD Progression Atlas— a related knowledge resource linked from AlzDataLENS— demonstrates that it is mainly astrocytes that drive BAG3 upregulation along Braak stages, followed by endothelial cells and microglia. In good agreement, interrogation of BAG3 in Mathys et al. (C) and Grubman et al. (D) snRNA-seq datasets confirms predominant expression of BAG3 in astrocytes as indicated by cell type UMAPs. E) The astrocyte UMAP visualized in the AD Progression Atlas shows increased BAG3 expression specifically in the astR2 cluster of reactive astrocytes.
Discussion
Alzheimer DataLENS is a valuable and comprehensive resource that addresses the growing need for an easily accessible and harmonized platform for exploring omics datasets in AD research. By integrating multiple omics data types, including transcriptomics and genetics from diverse studies and cohorts, DataLENS provides neuroscientists with a unified portal to query and visualize complex datasets. Thus, DataLENS provides a one-stop shop for AD datasets. As we continue to expand our dataset collection within DataLENS, this unique advantage over other platforms will be reinforced.
One of the key strengths of Alzheimer DataLENS is its consistent bioinformatics pipeline for processing and analyzing omics data. By applying standardized methods to all datasets, DataLENS ensures that the results are comparable and interpretable across different studies. This harmonization is crucial in overcoming the challenges posed by the vast heterogeneity in experimental conditions, disease stages, and brain regions studied in AD research. Overall, Alzheimer DataLENS is a user-friendly and versatile tool that democratizes access to omics data in AD research. Its streamlined web interfaces and interactive features enable neuroscientists to explore, analyze, and visualize data without the need for extensive bioinformatics expertise. By facilitating data exploration and knowledge discovery, DataLENS holds the potential to accelerate advancements in AD research and foster collaborations among researchers in the field. The case study illustrated in Fig. 5 is a typical example of how DataLENS can help generate or confirm hypotheses.
The bulk RNA-seq analysis in DataLENS allows researchers to explore gene expression patterns across different brain regions and cohorts. The ability to visualize results in various ways, such as regional analyses, interaction network plots, box plots, and heatmaps, facilitates the identification of key gene expression changes associated with increasing AD pathology and clinical characteristics. Further, the display of known and predicted protein-protein interactions in a network diagram provides additional insight into the molecular interactions that underlie AD. The inclusion of snRNA-seq datasets in DataLENS is a significant advancement in understanding the cellular heterogeneity of AD. The aggregate and cell-level analysis features enable researchers to explore gene expression patterns in different cell types, subclusters, and disease pathology states. The interactive bubble plots and UMAP visualizations offer an intuitive way to navigate through the complex single-cell data landscape and identify potential biomarkers and cell-type-specific alterations associated with AD. Moreover, the integration of GWAS datasets in DataLENS provides a valuable resource for investigating the genetic basis of AD. The interactive Manhattan plots empower researchers to explore genetic associations and identify potential risk loci for further investigation.
As with any resource, there are some limitations to consider. While DataLENS includes valuable datasets, it is essential to recognize that the datasets are collected from different studies and cohorts, which may introduce inherent biases and limitations. The cross-study comparisons should be interpreted with caution due to potential differences in sample sizes, demographics, and experimental protocols. Additionally, DataLENS is currently limited to public omics datasets, and researchers should be aware of the data availability policies and any access restrictions imposed by the original studies. Finally, some pages that analyze or visualize large datasets may be slow to load.
We have linked Alzheimer DataLens to two other knowledge resources produced by our group in recent years: the AD Progression Atlas (https://ad-progression-atlas.partners.org), a large snRNA-seq study of five brain regions across 32 brain donors spanning the normal aging-AD continuum [39, 40], and the Astrocyte Atlas (https://www.astrocyteatlas.org), a compendium of markers of AD reactive astrocytes extracted from a systematic review of the neuropathological literature [41]. As more omics datasets become available, both from our own and others’ research, we will provide continued updates and improvements to DataLENS (with support from external funding) to extend its life cycle and further enhance its utility and impact in the scientific community. In the future, we will also include other data types such as proteomics and metabolomics data, as well as develop visualizations of multi-omics data.
In conclusion, Alzheimer DataLENS represents a significant contribution to AD research by providing a unified and easily accessible platform for querying and visualizing omics datasets. The harmonized analysis pipelines, diverse visualization tools, and integration of single-cell and genetic data make the Alzheimer DataLENS portal a valuable resource for neuroscientists investigating the molecular and cellular mechanisms underlying AD pathogenesis.
ACKNOWLEDGMENTS
The authors would like to thank Jonathan Hamill and Mass General Brigham (MGB) Research Information Science and Computing (RISC). The results published here are in whole or in part based on data obtained from the AD Knowledge Portal.
FUNDING
Alzheimer DataLENS was initiated by funding from the Massachusetts Center for Alzheimer Therapeutics Science (MassCATS), which is a public-private partnership to discover new treatments for Alzheimer’s disease, organized through the Massachusetts Life Sciences Center. Alzheimer DataLENS is currently supported by IOS Press and MassCATS. This work was also supported by NIH NIA-P30AG062421 (to Drs. Serrano-Pozo, Hyman, and Das).
CONFLICT OF INTEREST
Sudeshna Das served as a guest editor for the Journal of Alzheimer’s Disease special issue on “Omics approaches in AD research” but was not involved in the peer-review process nor had access to any information regarding its peer review. The other authors declare no conflict of interest.
DATA AVAILABILITY
Not applicable, no data was generated as part of the study.
REFERENCES
[1] | Grubman A , Chew G , Ouyang JF , Sun G , Choo XY , McLean C , Simmons RK , Buckberry S , Vargas-Landin DB , Poppe D , Pflueger J , Lister R , Rackham OJL , Petretto E , Polo JM ((2019) ) A single-cell atlas of entorhinal cortex from individuals with Alzheimer’s disease reveals cell-type-specific gene expression regulation. Nat Neurosci 22: , 2087–2097. |
[2] | Lau SF , Cao H , Fu AKY , Ip NY ((2020) ) Single-nucleus transcriptome analysis reveals dysregulation of angiogenic endothelial cells and neuroprotective glia in Alzheimer’s disease. Proc Natl Acad Sci U S A 117: , 25800–25809. |
[3] | Leng K , Li E , Eser R , Piergies A , Sit R , Tan M , Neff N , Li SH , Rodriguez RD , Suemoto CK , Leite REP , Ehrenberg AJ , Pasqualucci CA , Seeley WW , Spina S , Heinsen H , Grinberg LT , Kampmann M ((2021) ) Molecular characterization of selectively vulnerable neurons in Alzheimer’s disease. Nat Neurosci 24: , 276–287. |
[4] | Mathys H , Davila-Velderrain J , Peng Z , Gao F , Mohammadi S , Young JZ , Menon M , He L , Abdurrob F , Jiang X , Martorell AJ , Ransohoff RM , Hafler BP , Bennett DA , Kellis M , Tsai LH ((2019) ) Single-cell transcriptomic analysis of Alzheimer’s disease. Nature 570: , 332–337. |
[5] | Sun N , Akay LA , Murdock MH , Park Y , Galiana-Melendez F , Bubnys A , Galani K , Mathys H , Jiang X , Ng AP , Bennett DA , Tsai LH , Kellis M ((2023) ) Single-nucleus multiregion transcriptomic analysis of brain vasculature in Alzheimer’s disease. Nat Neurosci 26: , 970–982. |
[6] | Zhou Y , Song WM , Andhey PS , Swain A , Levy T , Miller KR , Poliani PL , Cominelli M , Grover S , Gilfillan S , Cella M , Ulland TK , Zaitsev K , Miyashita A , Ikeuchi T , Sainouchi M , Kakita A , Bennett DA , Schneider JA , Nichols MR , Beausoleil SA , Ulrich JD , Holtzman DM , Artyomov MN , Colonna M ((2020) ) Human and mouse single-nucleus transcriptomics reveal TREM2-dependent and TREM2-independent cellular responses in Alzheimer’s disease. Nat Med 26: , 131–142. |
[7] | Chen S , Chang Y , Li L , Acosta D , Li Y , Guo Q , Wang C , Turkes E , Morrison C , Julian D , Hester ME , Scharre DW , Santiskulvong C , Song SX , Plummer JT , Serrano GE , Beach TG , Duff KE , Ma Q , Fu H ((2022) ) Spatially resolved transcriptomics reveals genes associated with the vulnerability of middle temporal gyrus in Alzheimer’s disease. Acta Neuropathol Commun 10: , 188. |
[8] | Chen WT , Lu A , Craessaerts K , Pavie B , Sala Frigerio C , Corthout N , Qian X , Lalakova J , Kuhnemund M , Voytyuk I , Wolfs L , Mancuso R , Salta E , Balusu S , Snellinx A , Munck S , Jurek A , Fernandez Navarro J , Saido TC , Huitinga I , Lundeberg J , Fiers M , De Strooper B ((2020) ) Spatial transcriptomics and in situ sequencing to study Alzheimer’s disease. Cell 182: , 976–991.e919. |
[9] | Navarro JF , Croteau DL , Jurek A , Andrusivova Z , Yang B , Wang Y , Ogedegbe B , Riaz T , Stoen M , Desler C , Rasmussen LJ , Tonjum T , Galas MC , Lundeberg J , Bohr VA ((2020) ) Spatial transcriptomics reveals genes associated with dysregulated mitochondrial functions and stress signaling in Alzheimer disease. iScience 23: , 101556. |
[10] | Miller MB , Huang AY , Kim J , Zhou Z , Kirkham SL , Maury EA , Ziegenfuss JS , Reed HC , Neil JE , Rento L , Ryu SC , Ma CC , Luquette LJ , Ames HM , Oakley DH , Frosch MP , Hyman BT , Lodato MA , Lee EA , Walsh CA ((2022) ) Somatic genomic changes in single Alzheimer’s disease neurons. Nature 604: , 714–722. |
[11] | Corces MR , Shcherbina A , Kundu S , Gloudemans MJ , Fresard L , Granja JM , Louie BH , Eulalio T , Shams S , Bagdatli ST , Mumbach MR , Liu B , Montine KS , Greenleaf WJ , Kundaje A , Montgomery SB , Chang HY , Montine TJ ((2020) ) Single-cell epigenomic analyses implicate candidate causal variants at inherited risk loci for Alzheimer’s and Parkinson’s diseases. Nat Genet 52: , 1158–1168. |
[12] | Barrett T , Wilhite SE , Ledoux P , Evangelista C , Kim IF , Tomashevsky M , Marshall KA , Phillippy KH , Sherman PM , Holko M , Yefanov A , Lee H , Zhang N , Robertson CL , Serova N , Davis S , Soboleva A ((2013) ) NCBI GEO: Archive for functional genomics data sets–update. Nucleic Acids Res 41: , D991–995. |
[13] | Edgar R , Domrachev M , Lash AE ((2002) ) Gene Expression Omnibus: NCBI gene expression and hybridization array data repository. Nucleic Acids Res 30: , 207–210. |
[14] | Davis S , Meltzer PS ((2007) ) GEOquery: A bridge between the Gene Expression Omnibus (GEO) and Bio Conductor. Bioinformatics 23: , 1846–1847. |
[15] | Greenwood AK , Montgomery KS , Kauer N , Woo KH , Leanza ZJ , Poehlman WL , Gockley J , Sieberts SK , Bradic L , Logsdon BA , Peters MA , Omberg L , Mangravite LM ((2020) ) The AD Knowledge Portal: A repository for multi-omic data on Alzheimer’s disease and aging. Curr Protoc Hum Genet 108: , e105. |
[16] | Kuksa PP , Liu CL , Fu W , Qu L , Zhao Y , Katanic Z , Clark K , Kuzma AB , Ho PC , Tzeng KT , Valladares O , Chou SY , Naj AC , Schellenberg GD , Wang LS , Leung YY ((2022) ) Alzheimer’s disease variant portal: A catalog of genetic findings for Alzheimer’s disease. J Alzheimers Dis 86: , 461–477. |
[17] | Miller JA , Hawrylycz MJ , Aitken M , Ariza J , Chakrabarty R , Ding SL , Ding Y , Ferrer R , Goldy J , Gratiy S , Guilford N , Guzman J , Kaplan ES , Mei N , Melief EJ , Nyhus J , Pham T , Rachleff VM , Samson J , Smith K , Torkelson A , Travaglini KJ , Wakeman W , Close J , Crane PK , Darvas M , Gabitto MI , Grabowski TJ , Hodge RD , Jayadev S , Latimer CS , Levi BP , Long B , MacDonald C , Mukherjee S , Larson EB , Keene CD , Lein ES ((2023) ) SEA · AD: Scientificanalysis and open access resources targeting early changes in Alzheimer’s disease. Alzheimers Dement 19: , e063478. |
[18] | Clarke LE , Liddelow SA , Chakraborty C , Munch AE , Heiman M , Barres BA ((2018) ) Normal aging induces A1-like astrocyte reactivity. , E1896-E. Proc Natl Acad Sci U S A 115: , 1905. |
[19] | Fay C , Guyader V , Rochette S , Girard C golem: A Framework for Robust Shiny Applications, https://github.com/ThinkR-open/golem. Last updated June 5, 2023, Accessed on October 6, 2022. |
[20] | Bihlmeyer NA , Merrill E , Lambert Y , Srivastava GP , Clark TW , Hyman BT , Das S ((2019) ) Novel methods for integration and visualization of genomics and genetics data in Alzheimer’s disease. Alzheimers Dement 15: , 788–798. |
[21] | De Jager PL , Ma Y , McCabe C , Xu J , Vardarajan BN , Felsky D , Klein HU , White CC , Peters MA , Lodgson B , Nejad P , Tang A , Mangravite LM , Yu L , Gaiteri C , Mostafavi S , Schneider JA , Bennett DA ((2018) ) A multi-omic atlas of the human frontal cortex for aging and Alzheimer’s disease research. Sci Data 5: , 180142. |
[22] | Mostafavi S , Gaiteri C , Sullivan SE , White CC , Tasaki S , Xu J , Taga M , Klein HU , Patrick E , Komashko V , McCabe C , Smith R , Bradshaw EM , Root DE , Regev A , Yu L , Chibnik LB , Schneider JA , Young-Pearse TL , Bennett DA , De Jager PL ((2018) ) A molecular network of the aging human brain provides insights into the pathology and cognitive decline of Alzheimer’s disease. Nat Neurosci 21: , 811–819. |
[23] | Myers AJ , Gibbs JR , Webster JA , Rohrer K , Zhao A , Marlowe L , Kaleem M , Leung D , Bryden L , Nath P , Zismann VL , Joshipura K , Huentelman MJ , Hu-Lince D , Coon KD , Craig DW , Pearson JV , Holmans P , Heward CB , Reiman EM , Stephan D , Hardy J ((2007) ) A survey of genetic human cortical gene expression. Nat Genet 39: , 1494–1499. |
[24] | Wang M , Beckmann ND , Roussos P , Wang E , Zhou X , Wang Q , Ming C , Neff R , Ma W , Fullard JF , Hauberg ME , Bendl J , Peters MA , Logsdon B , Wang P , Mahajan M , Mangravite LM , Dammer EB , Duong DM , Lah JJ , Seyfried NT , Levey AI , Buxbaum JD , Ehrlich M , Gandy S , Katsel P , Haroutunian V , Schadt E , Zhang B ((2018) ) The Mount Sinai cohort of large-scale genomic, transcriptomic and proteomic data in Alzheimer’s disease. Sci Data 5: , 180185. |
[25] | Wang M , Roussos P , McKenzie A , Zhou X , Kajiwara Y , Brennand KJ , De Luca GC , Crary JF , Casaccia P , Buxbaum JD , Ehrlich M , Gandy S , Goate A , Katsel P , Schadt E , Haroutunian V , Zhang B ((2016) ) Integrative network analysis of nineteen brain regions identifies molecular signatures and networks underlying selective regional vulnerability to Alzheimer’s disease. Genome Med 8: , 104. |
[26] | Allen M , Carrasquillo MM , Funk C , Heavner BD , Zou F , Younkin CS , Burgess JD , Chai HS , Crook J , Eddy JA , Li H , Logsdon B , Peters MA , Dang KK , Wang X , Serie D , Wang C , Nguyen T , Lincoln S , Malphrus K , Bisceglio G , Li M , Golde TE , Mangravite LM , Asmann Y , Price ND , Petersen RC , Graff-Radford NR , Dickson DW , Younkin SG , Ertekin-Taner N ((2016) ) Human whole genome genotype and transcriptome data for Alzheimer’s and other neurodegenerative diseases. Sci Data 3: , 160089. |
[27] | Zou F , Chai HS , Younkin CS , Allen M , Crook J , Pankratz VS , Carrasquillo MM , Rowley CN , Nair AA , Middha S , Maharjan S , Nguyen T , Ma L , Malphrus KG , Palusak R , Lincoln S , Bisceglio G , Georgescu C , Kouri N , Kolbert CP , Jen J , Haines JL , Mayeux R , Pericak-Vance MA , Farrer LA , Schellenberg GD Alzheimer’s Disease Genetics Consortium Petersen RC , Graff-Radford NR , Dickson DW , Younkin SG , Ertekin-Taner N ((2012) ) Brain expression genome-wide association study (eGWAS) identifies human disease-associated variants. PLoS Genet 8: , e1002707. |
[28] | Robinson MD , McCarthy DJ , Smyth GK ((2010) ) edgeR: A Bioconductor package for differential expression analysis of digital gene expression data. Bioinformatics 26: , 139–140. |
[29] | Cao Y , Fu L , Wu J , Peng Q , Nie Q , Zhang J , Xie X ((2022) ) Integrated analysis of multimodal single-cell data with structural similarity. Nucleic Acids Res 50: , e121. |
[30] | Ouyang JF , Kamaraj US , Cao EY , Rackham OJL ((2021) ) ShinyCell: Simple and sharable visualization of single-cell gene expression data. Bioinformatics 37: , 3374–3376. |
[31] | Lambert JC , Ibrahim-Verbaas CA , Harold D , Naj AC , Sims R , Bellenguez C , DeStafano AL , Bis JC , Beecham GW , Grenier-Boley B et al. ((2013) ) Meta-analysis of 74,046 individuals identifies 11 new susceptibility loci for Alzheimer’s disease. Nat Genet 45: , 1452–1458. |
[32] | Hodes RJ , Buckholtz N ((2016) ) Accelerating Medicines Partnership: Alzheimer’s Disease (AMP-AD) knowledge portal aids Alzheimer’s drug discovery through open data sharing. Expert Opin Ther Targets 20: , 389–391. |
[33] | Kurtishi A , Rosen B , Patil KS , Alves GW , Moller SG ((2019) ) Cellular proteostasis in neurodegeneration. Mol Neurobiol 56: , 3676–3689. |
[34] | Noori A , Mezlini AM , Hyman BT , Serrano-Pozo A , Das S ((2021) ) Systematic review and meta-analysis of human transcriptomics reveals neuroinflammation, deficient energy metabolism, and proteostasis failure across neurodegeneration. Neurobiol Dis 149: , 105225. |
[35] | Fu H , Possenti A , Freer R , Nakano Y , Hernandez Villegas NC , Tang M , Cauhy PVM , Lassus BA , Chen S , Fowler SL , Figueroa HY , Huey ED , Johnson GVW , Vendruscolo M , Duff KE ((2019) ) A tau homeostasis signature is linked with the cellular and regional vulnerability of excitatory neurons to tau pathology. Nat Neurosci 22: , 47–56. |
[36] | Lei Z , Brizzee C , Johnson GV ((2015) ) BAG3 facilitates the clearance of endogenous tau in primary neurons. Neurobiol Aging 36: , 241–248. |
[37] | Lin H , Deaton CA , Johnson GVW ((2023) ) Commentary: BAG3 as a mediator of endosome function and tau clearance. Neuroscience 518: , 4–9. |
[38] | Sheehan PW , Nadarajah CJ , Kanan MF , Patterson JN , Novotny B , Lawrence JH , King MW , Brase L , Inman CE , Yuede CM , Lee J , Patel TK , Harari O , Benitez BA , Davis AA , Musiek ES ((2023) ) An astrocyte BMAL1-BAG3 axis protects against alpha-synuclein and tau pathology. Neuron 111: , 2383–2398 e2387. |
[39] | Bryant A , Li Z , Jayakumar R , Serrano-Pozo A , Woost B , Hu M , Woodbury ME , Wachter A , Lin G , Kwon T , Talanian RV , Biber K , Karran EH , Hyman BT , Das S , Bennett RE ((2023) ) Endothelial cells are heterogeneous in different brain regions and are dramatically altered in Alzheimer’s disease. J Neurosci 43: , 4541–4557. |
[40] | Serrano-Pozo A , Li Z , Woodbury ME , Munoz-Castro C , Wachter A , Jayakumar R , Bryant AG , Noori A , Welikovitch LA , Hu M , Liao F , Lin G , Pastika T , Tamm J , Abdourahman A , Kwon T , Bennett RE , Talanian RV , Biber K , Karran EH , Hyman BT , Das S (2022) Astrocyte transcriptomic changes along the spatiotemporal progression of Alzheimer’s disease. bioRxiv, doi: 10.1101/2022.12.03.518999 [Preprint]. Posted December 07, 2022. |
[41] | Viejo L , Noori A , Merrill E , Das S , Hyman BT , Serrano-Pozo A ((2022) ) Systematic review of human post-mortem immunohistochemical studies and bioinformatics analyses unveil the complexity of astrocyte reaction in Alzheimer’s disease. Neuropathol Appl Neurobiol 48: , e12753. |


