
Genetic Insights into the Risk of Metabolic Syndrome and Its Components on Dementia: A Mendelian Randomization
Abstract
Background:
The role of metabolic syndrome (MetS) on dementia is disputed.
Objective:
We conducted a Mendelian randomization to clarify whether the genetically predicted MetS and its components are casually associated with the risk of different dementia types.
Methods:
The genetic predictors of MetS and its five components (waist circumference, hypertension, fasting blood glucose, triglycerides, and high-density lipoprotein cholesterol [HDL-C]) come from comprehensive public genome-wide association studies (GWAS). Different dementia types are collected from the GWAS in the European population. Inverse variance weighting is utilized as the main method, complemented by several sensitivity approaches to verify the robustness of the results.
Results:
Genetically predicted MetS and its five components are not causally associated with the increasing risk of dementia (all p > 0.05). In addition, no significant association between MetS and its components and Alzheimer’s disease, vascular dementia, frontotemporal dementia, dementia with Lewy bodies, and dementia due to Parkinson’s disease (all p > 0.05), except the association between HDL-C and dementia with Lewy bodies. HDL-C may play a protective role in dementia with Lewy bodies (OR: 0.81, 95% CI: 0.72–0.92, p = 0.0010).
Conclusions:
From the perspective of genetic variants, our study provides novel evidence that MetS and its components are not associated with different dementia types.
INTRODUCTION
Dementia is characterized by a chronic and progressive decline affecting cognitive function in aged adults [1]. Generally, the main types of dementia consist of Alzheimer’s disease (AD), vascular dementia, frontotemporal dementia, dementia with Lewy bodies, and dementia in Parkinson’s disease. It is estimated that there have 50 million patients around the world [2]. More seriously, the number of cases is dramatically increasing due to the increasing life expectancy and risk factors [3], which puts a heavy burden on individuals, families, health care, and society. Therefore, strategies for preventing and alleviating dementia are priorities in healthcare.
Metabolic syndrome (MetS) is a cluster of pathological conditions based on the World Health Organization’s (WHO) definition, including glucose abnormalities, hyperlipidemia, central obesity, and hypertension [4]. At present, the incidence of MetS is increasing rapidly, and approximately 25% adults have MetS [5]. Some studies have shown that MetS has a positive association with the risk of dementia [6, 7], while no association is observed, even the inverse relationship in other studies [8, 9]. In addition, obvious confounding factors such as the study design and retrospective features are inherent shortcomings in these observational studies, which may interfere with the understanding of these conclusions.
Mendelian randomization (MR), as a genetic approach, is a robust statistical analysis using genetic variants to make a causal inference, which can overcome the limitation of observational studies [10]. During gestation, single nucleotide polymorphism (SNP), a genomic variant at a single base position in the deoxyribonucleic acid (DNA), is assorted randomly in forming a zygote [11]. However, no study has been conducted to investigate the causal association of MetS and its five components on dementia. Therefore, we performed this MR analysis to illustrate their causal links.
METHODS
Study design
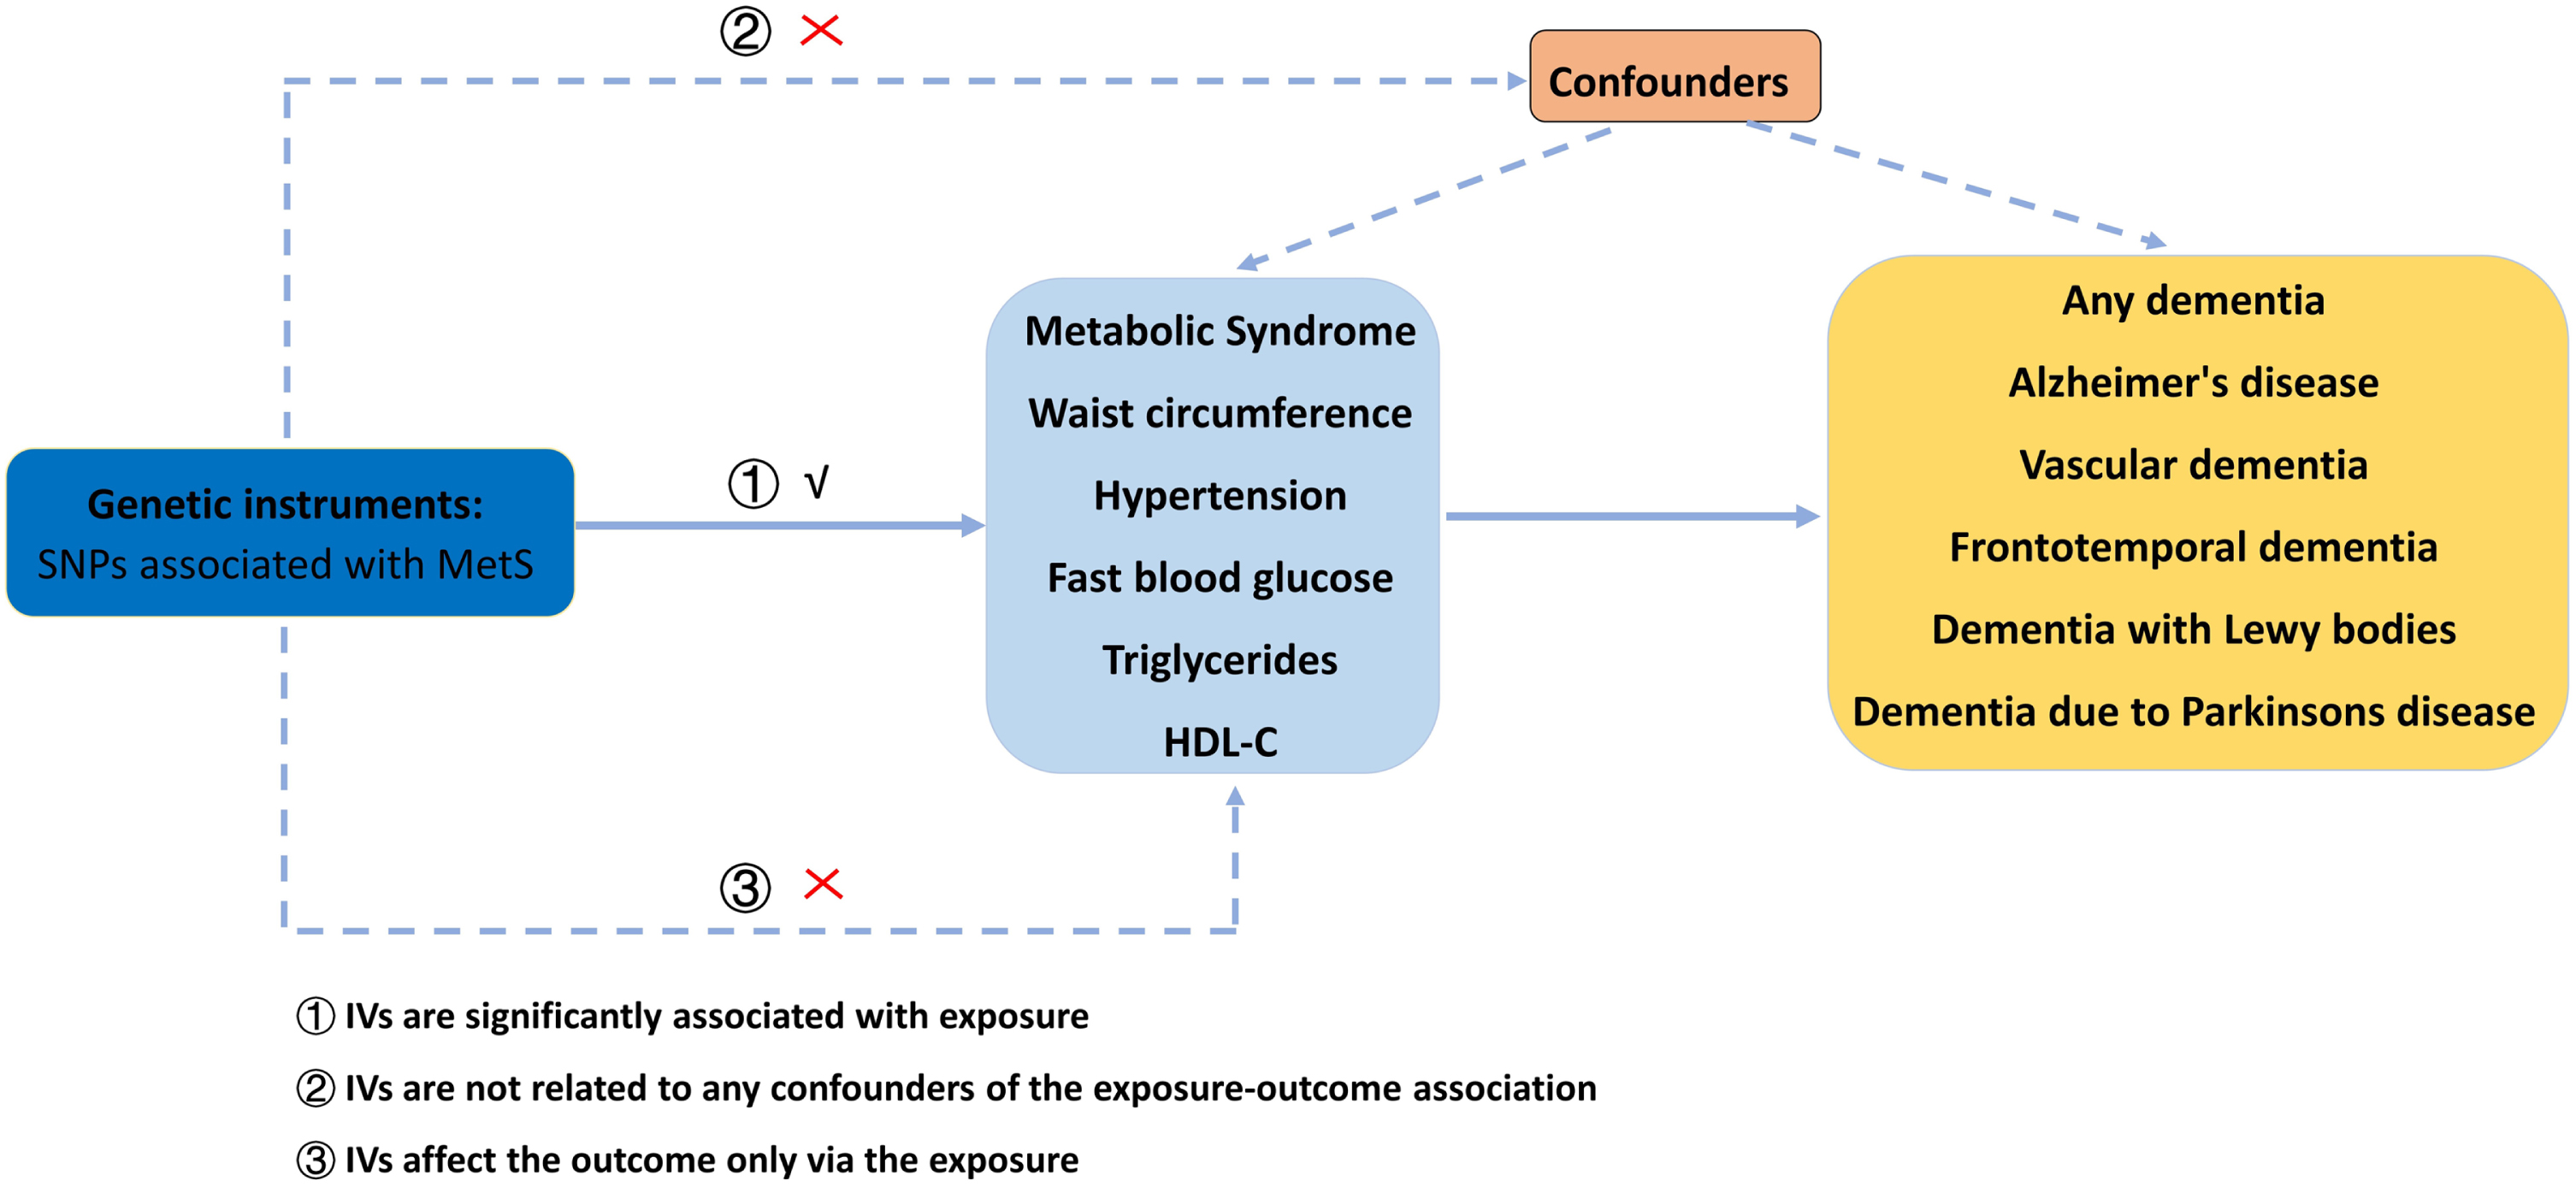
The overview of our MR study is shown in Fig. 1. In our study, we explored the causal relationship between MetS, waist circumference (WC), hypertension, fasting blood glucose (FBG), triglycerides (TG), high-density lipoprotein cholesterol (HDL-C), and different dementia types, including AD, vascular dementia, frontotemporal dementia, dementia with Lewy bodies, and dementia due to Parkinson’s disease. No ethical approval is required due to the analysis of the public summary-level datasets.
Fig. 1
The flow chart of our MR analysis. MetS, metabolic syndrome; MR, Mendelian randomization; SNP, single nucleotide polymorphism; HDL-C, high-density lipoprotein cholesterol.
Date sources of exposures and outcomes
All exposure datasets are originated from public databases. MetS (N = 291,107 samples), WC (N = 462,166 samples), hypertension (N = 463,010 samples), TG (441,016 samples), and HDL-C (403,943 samples) are obtained from the UK biobank [12, 13]. Genetic predictors for FBG (281,416 participants) are available from the Meta-Analyses Glucose and Insulin-related traits Consortium (MAGIC) [14]. The detailed sources of these datasets utilized in our MR study are described in Table 1.
Table 1
The R2 and F-statistics for the genetic instruments in the MR analyses
| Exposure | Outcome | No. SNP | R2 | F-statistic |
| Mets | Any Dementia | 122 | 3.04% | 66.77 |
| WC | Any Dementia | 561 | 7.21% | 53.67 |
| Hypertension | Any Dementia | 66 | 0.85% | 46.78 |
| FBG | Any Dementia | 108 | 4.37% | 101.31 |
| TG | Any Dementia | 749 | 17.90% | 110.95 |
| HDL-C | Any Dementia | 900 | 29.50% | 161.96 |
| Mets | Alzheimer’s disease | 119 | 3.07% | 68.89 |
| WC | Alzheimer’s disease | 565 | 7.23% | 53.89 |
| Hypertension | Alzheimer’s disease | 66 | 0.84% | 46.24 |
| FBG | Alzheimer’s disease | 107 | 4.33% | 102.01 |
| TG | Alzheimer’s disease | 789 | 19.77% | 118.26 |
| HDL-C | Alzheimer’s disease | 951 | 30.53% | 159.49 |
| Mets | Vascular dementia | 124 | 3.13% | 67.69 |
| WC | Vascular dementia | 564 | 7.26% | 53.76 |
| Hypertension | Vascular dementia | 66 | 0.85% | 46.78 |
| FBG | Vascular dementia | 108 | 4.37% | 101.31 |
| TG | Vascular dementia | 757 | 18.43% | 113.44 |
| HDL-C | Vascular dementia | 906 | 29.70% | 162.42 |
| Mets | Frontotemporal dementia | 46 | 1.27% | 75.39 |
| WC | Frontotemporal dementia | 227 | 3.14% | 57.51 |
| Hypertension | Frontotemporal dementia | 23 | 0.27% | 50.25 |
| FBG | Frontotemporal dementia | 32 | 1.06% | 79.91 |
| TG | Frontotemporal dementia | 199 | 5.25% | 109.23 |
| HDL-C | Frontotemporal dementia | 237 | 8.63% | 146.18 |
| Mets | Dementia with Lewy bodies | 114 | 2.96% | 69.56 |
| WC | Dementia with Lewy bodies | 516 | 6.66% | 53.54 |
| Hypertension | Dementia with Lewy bodies | 63 | 0.82% | 47.14 |
| FBG | Dementia with Lewy bodies | 101 | 4.20% | 102.97 |
| TG | Dementia with Lewy bodies | 698 | 18.16% | 121.05 |
| HDL-C | Dementia with Lewy bodies | 831 | 27.99% | 161.51 |
| Mets | Dementia due to Parkinson’s disease | 125 | 3.19% | 68.12 |
| WC | Dementia due to Parkinson’s disease | 565 | 7.28% | 53.88 |
| Hypertension | Dementia due to Parkinson’s disease | 66 | 0.85% | 46.78 |
| FBG | Dementia due to Parkinson’s disease | 108 | 4.37% | 101.31 |
| TG | Dementia due to Parkinson’s disease | 758 | 18.74% | 115.63 |
| HDL-C | Dementia due to Parkinson’s disease | 907 | 29.90% | 163.85 |
MetS, metabolic syndrome; WC, waist circumference; FBG, fasting blood glucose; TG, triglycerides; HDL-C, high-density lipoprotein cholesterol.
All outcome datasets are derived from European ancestry. The summary-level dataset for AD are taken from the MR study including 954 cases and 487,331 controls [15]. The dataset for vascular dementia is extracted from the FinnGen consortium, consisting of 212,389 samples (881 cases and 211,508 controls). As to frontotemporal dementia, its dataset includes 515 cases and 2,509 controls [16]. Summary statistics for dementia with Lewy bodies are collected from an independent GWAS multicenter study with 2,591 cases and 4,027 controls [17]. Dementia due to Parkinson’s disease consists of 212,389 samples (267 cases and 216,628 controls) from the FinnGen consortium. The detailed resources of our datasets are visualized in Table 1.
Genetic instrument selection
Genetic instruments are usually collected as those having statistically robust associations with the risk factor in a MR analysis [18]. The genetic instrument selection undertaken the following procedures. All the genetic instrumental variables (IVs) associated with MetS and its five components must meet a significance level at a genome-wide statistical threshold of p < 5×10⁻⁸. Then, the independent SNPs are identified using the linkage disequilibrium (LD) with the threshold of LD r2 < 0.05 at a window size of 10,000 Kb [19, 20]. In addition, Mendelian Randomization Pleiotropy RESidual Sum and Outlier (MR-PRESSO) analysis is used to detect the potential outlier SNPs accounting for possible pleiotropy [21]. The SNPs will be removed when the outlier SNPs are detected. The qualified SNPs of MetS and its five components are displayed in Table 1.
Main statistical analyses
The inverse variance weighting (IVW) approach is deemed as the main method in our MR study because it can obtain a robust result by integrating the Wald ratio of each SNP into an overall weighted effect [22]. The Bonferroni-corrected p < 0.0013 (0.05/36) is regarded as the statistical significance. All analyses are performed using R packages including “TwoSampleMR”, “mr.raps”, and “cause”, in R software (version: 4.1.2, The R Foundation, Vienna, Austria).
Sensitivity analyses
We also chosen five methods to perform sensitivity analyses, including MR robust adjusted profile score (MR.RAPS), MR-PRESSO, weighted median, MR-Egger, and Maximum likelihood. When there were weak IVs that led to horizontal pleiotropy, the results of MR.RAPS could remain stable [23]. Significant outliers could be detected using MR-PRESSO and then removed for pleiotropy [21]. The weighted median approach could obtain consistent results even though 50% of SNPs were invalid [24]. The results of the comparison between the egger intercept term and zero were introduced in MR-Egger analysis, which represented the directional pleiotropy [25]. In the maximum likelihood analysis, a relatively low standard error existed, and it might be deviated by a small sample [26]. Furthermore, the egger intercept term in MR-Egger analysis and the p value in MR-PRESSO analysis were introduced into the regression model to test the directional pleiotropy. Cochran’s Q test was performed to identify possible heterogeneity. In addition, leave-one-out analysis was utilized to explain the robustness of the results when removing SNPs in turn.
RESULTS
The casual effects of genetically predicted MetS and its components on dementia
The results of this MR study are presented in Table 2. The demographic characteristics for dementia are displayed in Tables 3–5.
Table 2
The causal effect of MetS and its components on different types of dementia
| Exposure | Outcome | Methods | OR (95%) | p | Egger_intercept | p-Egger intercept | Cochran’s | Cochran’s p |
| MetS | Any Dementia | IVW | 0.98 (0.92,1.06) | 0.7564 | 128.71 | 0.2985 | ||
| MR-Egger | 0.90 (0.77,1.07) | 0.2574 | 0.0062 | 0.2678 | 127.40 | 0.3046 | ||
| Weighted median | 0.95 (0.85,1.05) | 0.3646 | ||||||
| Maximum likelihood | 0.98 (0.92,1.06) | 0.7537 | ||||||
| RAPS | 0.97 (0.90,1.05) | 0.5708 | ||||||
| WC | Any Dementia | IVW | 1.07 (0.93,1.22) | 0.3128 | 562.58 | 0.4613 | ||
| MR-Egger | 1.48 (0.99,2.22) | 0.0544 | –0.0051 | 0.0923 | 559.73 | 0.4832 | ||
| Weighted median | 1.11 (0.87,1.41) | 0.3627 | ||||||
| Maximum likelihood | 1.07 (0.93,1.22) | 0.3086 | ||||||
| RAPS | 1.04 (0.91,1.21) | 0.5050 | ||||||
| Hypertension | Any Dementia | IVW | 0.97 (0.31,3.02) | 0.9590 | 69.91 | 0.3159 | ||
| MR-Egger | 1.28 (0.02,5.46) | 0.9048 | –0.0015 | 0.8890 | 69.89 | 0.2862 | ||
| Weighted median | 1.48 (0.28,7.79) | 0.6416 | ||||||
| Maximum likelihood | 0.97 (0.32,2.93) | 0.9574 | ||||||
| RAPS | 1.00 (0.31,3.16) | 0.9975 | ||||||
| FBG | Any Dementia | IVW | 1.26 (1.01,1.57) | 0.0394 | 111.27 | 0.3444 | ||
| MR-Egger | 1.08 (0.72,1.60) | 0.7039 | 0.0045 | 0.3525 | 111.36 | 0.3417 | ||
| Weighted median | 1.29 (0.91,1.84) | 0.1474 | ||||||
| Maximum likelihood | 1.27 (1.02,1.58) | 0.0321 | ||||||
| RAPS | 1.23 (0.97,1.57) | 0.0780 | ||||||
| TG | Any Dementia | IVW | 0.94 (0.86,1.02) | 0.1481 | 829.31 | 0.0202 | ||
| MR-Egger | 0.87 (0.76,0.99) | 0.0470 | 0.0024 | 0.1628 | 827.15 | 0.0216 | ||
| Weighted median | 0.93 (0.80,1.07) | 0.3398 | ||||||
| Maximum likelihood | 0.94 (0.87,1.01) | 0.1300 | ||||||
| RAPS | 0.94 (0.86,1.02) | 0.1799 | ||||||
| HDL-C | Any Dementia | IVW | 1.04 (0.97,1.12) | 0.1751 | 931.91 | 0.2169 | ||
| MR-Egger | 1.03 (0.93,1.15) | 0.4753 | 0.0002 | 0.8435 | 931.87 | 0.2103 | ||
| Weighted median | 0.96 (0.85,1.09) | 0.6065 | ||||||
| Maximum likelihood | 1.04 (0.98,1.11) | 0.1693 | ||||||
| RAPS | 1.03 (0.96,1.10) | 0.3650 | ||||||
| MetS | Alzheimer’s disease | IVW | 1.00 (0.99,1.00) | 0.9354 | 107.68 | 0.7415 | ||
| MR-Egger | 0.99 (0.99,1.00) | 0.8255 | 6.82e-06 | 0.7737 | 107.60 | 0.7215 | ||
| Weighted median | 1.00 (0.99,1.00) | 0.7967 | ||||||
| Maximum likelihood | 1.00 (0.99,1.00) | 0.9354 | ||||||
| RAPS | 1.00 (0.99,1.00) | 0.9205 | ||||||
| WC | Alzheimer’s disease | IVW | 1.00 (0.99,1.00) | 0.0628 | 563.75 | 0.4949 | ||
| MR-Egger | 1.00 (1.00,1.00) | 0.0143 | –2.61e-05 | 0.0534 | 560.01 | 0.5276 | ||
| Weighted median | 1.00 (1.00,1.00) | 0.0227 | ||||||
| Maximum likelihood | 1.00 (0.99,1.00) | 0.0628 | ||||||
| RAPS | 1.00 (0.99,1.00) | 0.0875 | ||||||
| Hypertension | Alzheimer’s disease | IVW | 1.00 (0.99,1.01) | 0.1914 | 57.11 | 0.7461 | ||
| MR-Egger | 1.01 (0.99,1.02) | 0.2078 | –4.51e-05 | 0.3491 | 56.22 | 0.7445 | ||
| Weighted median | 1.00 (0.99,1.01) | 0.4181 | ||||||
| Maximum likelihood | 1.00 (0.99,1.01) | 0.1914 | ||||||
| RAPS | 1.00 (0.99,1.01) | 0.2233 | ||||||
| FBG | Alzheimer’s disease | IVW | 1.00 (0.99,1.00) | 0.5977 | 104.17 | 0.5318 | ||
| MR-Egger | 1.00 (0.99,1.00) | 0.4385 | –1.24e-05 | 0.5615 | 103.84 | 0.5136 | ||
| Weighted median | 1.00 (0.99,1.00) | 0.4037 | ||||||
| Maximum likelihood | 1.00 (0.99,1.00) | 0.5989 | ||||||
| RAPS | 1.00 (0.99,1.00) | 0.6898 | ||||||
| TG | Alzheimer’s disease | IVW | 0.99 (0.99,1.00) | 0.7071 | 824.29 | 0.1795 | ||
| MR-Egger | 1.00 (0.99,1.00) | 0.6987 | –5.82e-06 | 0.4371 | 823.65 | 0.1770 | ||
| Weighted median | 1.00 (0.99,1.00) | 0.9353 | ||||||
| Maximum likelihood | 0.99 (0.99,1.00) | 0.7023 | ||||||
| RAPS | 0.99 (0.99,1.00) | 0.8574 | ||||||
| HDL-C | Alzheimer’s disease | IVW | 1.00 (0.99,1.00) | 0.9896 | 974.46 | 0.2837 | ||
| MR-Egger | 1.00 (0.99,1.00) | 0.9293 | –6.79e-07 | 0.9170 | 974.45 | 0.2761 | ||
| Weighted median | 1.00 (0.99,1.00) | 0.9875 | ||||||
| Maximum likelihood | 1.00 (0.99,1.00) | 0.9895 | ||||||
| RAPS | 0.99 (0.99,1.00) | 0.9850 | ||||||
| MetS | Vascular dementia | IVW | 1.05 (0.89,1.24) | 0.5115 | 121.13 | 0.5305 | ||
| MR-Egger | 1.04 (0.73,1.50) | 0.7929 | 0.0004 | 0.9726 | 121.13 | 0.5050 | ||
| Weighted median | 1.18 (0.91,1.53) | 0,1970 | ||||||
| Maximum likelihood | 1.05 (0.89,1.24) | 0.5076 | ||||||
| RAPS | 1.06 (0.89,1.25) | 0.4906 | ||||||
| WC | Vascular dementia | IVW | 1.30 (0.94,1.79) | 0.1028 | 539.81 | 0.7520 | ||
| MR-Egger | 1.32 (0.50,3.43) | 0.5652 | –0.0002 | 0.9757 | 539.81 | 0.7424 | ||
| Weighted median | 1.26 (0.70,2.24) | 0.4304 | ||||||
| Maximum likelihood | 1.31 (0.95,1.81) | 0.0955 | ||||||
| RAPS | 1.27 (0.91,1.78) | 0.1516 | ||||||
| Hypertension | Vascular dementia | IVW | 4.17 (0.23,75.75) | 0.3336 | 80.22 | 0.0966 | ||
| MR-Egger | 1.56 (4.71e-05,51732.67) | 0.9332 | 0.0055 | 0.8476 | 80.18 | 0.0833 | ||
| Weighted median | 12.82 (0.26,628.59) | 0.1987 | ||||||
| Maximum likelihood | 4.37 (0.31,61.56) | 0.2740 | ||||||
| RAPS | 6.69 (0.32,136.52) | 0.2165 | ||||||
| FBG | Vascular dementia | IVW | 1.09 (0.63,1.87) | 0.7435 | 114.96 | 0.2819 | ||
| MR-Egger | 0.67 (0.26,1.76) | 0.4275 | 0.0137 | 0.2389 | 113.46 | 0.2922 | ||
| Weighted median | 1.16 (0.51,2.63) | 0.7138 | ||||||
| Maximum likelihood | 1.09 (0.64,1.84) | 0.7362 | ||||||
| RAPS | 1.06 (0.60,1.87) | 0.8399 | ||||||
| TG | Vascular dementia | IVW | 0.97 (0.81,1.17) | 0.8242 | 737.33 | 0.6796 | ||
| MR-Egger | 0.92 (0.68,1.24) | 0.6011 | 0.0019 | 0.6250 | 737.10 | 0.6726 | ||
| Weighted median | 1.14 (0.82,1.59) | 0.4237 | ||||||
| Maximum likelihood | 0.97 (0.81,1.17) | 0.8251 | ||||||
| RAPS | 1.01 (0.83,1.22) | 0.9121 | ||||||
| HDL-C | Vascular dementia | IVW | 0.93 (0.79,1.09) | 0.3940 | 838.12 | 0.9448 | ||
| MR-Egger | 0.93 (0.72,1.19) | 0.5739 | 8.37e-05 | 0.9807 | 838.12 | 0.9421 | ||
| Weighted median | 0.81 (0.61,1.07) | 0.1495 | ||||||
| Maximum likelihood | 0.93 (0.79,1.09) | 0.3960 | ||||||
| RAPS | 0.93 (0.79,1.10) | 0.4526 | ||||||
| MetS | Frontotemporal dementia | IVW | 1.26 (0.81,1.95) | 0.2926 | 67.29 | 0.0172 | ||
| MR-Egger | 2.76 (0.85,8.94) | 0.0965 | –0.0535 | 0.1667 | 64.39 | 0.0240 | ||
| Weighted median | 1.55 (0.89,2.71) | 0.1155 | ||||||
| Maximum likelihood | 1.26 (0.88,1.81) | 0.1929 | ||||||
| RAPS | 1.31 (0.82,2.06) | 0.2470 | ||||||
| WC | Frontotemporal dementia | IVW | 0.88 (0.45,1.73) | 0.7227 | 235.42 | 0.3196 | ||
| MR-Egger | 0.70 (0.10,4.65) | 0.7140 | 0.0031 | 0.8267 | 235.37 | 0.3038 | ||
| Weighted median | 1.00 (0.31,3.20) | 0.9941 | ||||||
| Maximum likelihood | 0.88 (0.45,1.71) | 0.7160 | ||||||
| RAPS | 0.84 (0.42,1.69) | 0.6413 | ||||||
| Hypertension | Frontotemporal dementia | IVW | 9.15 (0.01,7.77e+03) | 0.5200 | 28.00 | 0.1756 | ||
| MR-Egger | 1.95e+08 (0.001,2.35e+19) | 0.1573 | –0.0925 | 0.1937 | 25.78 | 0.2146 | ||
| Weighted median | 9.66e+02 (0.13,6.86e+06) | 0.1287 | ||||||
| Maximum likelihood | 1.01e+01 (0.02,4.33e+03) | 0.4533 | ||||||
| RAPS | 3.37e+01 (0.02,4.03e+04) | 0.3305 | ||||||
| FBG | Frontotemporal dementia | IVW | 0.49 (0.08,2.98) | 0.4446 | 39.37 | 0.1437 | ||
| MR-Egger | 0.20 (0.01,32.55) | 0.5440 | 0.0174 | 0.7153 | 39.19 | 0.1213 | ||
| Weighted median | 1.49 (0.13,16.66) | 0.7417 | ||||||
| Maximum likelihood | 0.50 (0.10,2.50) | 0.4034 | ||||||
| RAPS | 0.58 (0.09,3.43) | 0.5492 | ||||||
| TG | Frontotemporal dementia | IVW | 1.40 (0.86,2.28) | 0.1675 | 220.16 | 0.1338 | ||
| MR-Egger | 2.45 (1.08,5.52) | 0.0317 | –0.0164 | 0.0975 | 217.11 | 0.1552 | ||
| Weighted median | 1.61 (0.76,3.42) | 0,2079 | ||||||
| Maximum likelihood | 1.40 (0.88,2.23) | 0.1450 | ||||||
| RAPS | 1.47 (0.91,2.37) | 0.1135 | ||||||
| HDL-C | Frontotemporal dementia | IVW | 0.91 (0.61,1.35) | 0.6463 | 244.24 | 0.3424 | ||
| MR-Egger | 0.75 (0.40,1.42) | 0.3888 | 0.0060 | 0.4596 | 243.67 | 0.3350 | ||
| Weighted median | 0.65 (0.33,1.29) | 0.2209 | ||||||
| Maximum likelihood | 0.90 (0.61,1.34) | 0.6380 | ||||||
| RAPS | 0.87 (0.58,1.31) | 0.5139 | ||||||
| MetS | Dementia with Lewy bodies | IVW | 1.15 (1.01,1.30) | 0.0252 | 114.09 | 0.4533 | ||
| MR-Egger | 1.19 (0.90,1.59) | 0.2149 | 0.0098 | 0.7750 | 114.01 | 0.4292 | ||
| Weighted median | 1.21 (1.01,1.46) | 0.0422 | ||||||
| Maximum likelihood | 1.15 (1.01,1.31) | 0.0242 | ||||||
| RAPS | 1.14 (0.99,1.31) | 0.0530 | ||||||
| WC | Dementia with Lewy bodies | IVW | 0.94 (0.73,1.21) | 0.6346 | 522.79 | 0.3965 | ||
| MR-Egger | 0.85 (0.40,1.80) | 0.6814 | 0.0014 | 0.7902 | 522.72 | 0.3854 | ||
| Weighted median | 0.98 (0.64,1.51) | 0.9278 | ||||||
| Maximum likelihood | 0.94 (0.73,1.21) | 0.6445 | ||||||
| RAPS | 0.96 (0.73,1.25) | 0.7733 | ||||||
| Hypertension | Dementia with Lewy bodies | IVW | 1.02 (9.75e-02,10.83) | 0.9817 | 86.68 | 0.0209 | ||
| MR-Egger | 0.04 (7.97e-06,273.56) | 0.4914 | 0.0170 | 0.4706 | 85.94 | 0.0193 | ||
| Weighted median | 1.74 (8.96e-02,34.00) | 0.7129 | ||||||
| Maximum likelihood | 1.02 (1.36e-01,7.76) | 0.9781 | ||||||
| RAPS | 1.02 (8.49e-02,12.36) | 0.9845 | ||||||
| FBG | Dementia with Lewy bodies | IVW | 1.50 (1.01,2.24) | 0.0423 | 94.59 | 0.6339 | ||
| MR-Egger | 1.13 (0.56,2.30) | 0.7173 | 0.0080 | 0.3467 | 93.69 | 0.6316 | ||
| Weighted median | 1.19 (0.63,2.26) | 0.5789 | ||||||
| Maximum likelihood | 1.51 (1.01,2.25) | 0.0420 | ||||||
| RAPS | 1.49 (0.98,2.25) | 0.0561 | ||||||
| TG | Dementia with Lewy bodies | IVW | 1.07 (0.93,1.23) | 0.3290 | 748.16 | 0.0875 | ||
| MR-Egger | 1.04 (0.83,1.31) | 0.7078 | 0.0009 | 0.7670 | 748.06 | 0.0838 | ||
| Weighted median | 0.99 (0.78,1.25) | 0.9756 | ||||||
| Maximum likelihood | 1.07 (0.93,1.23) | 0.3144 | ||||||
| RAPS | 1.05 (0.91,1.22) | 0.4502 | ||||||
| HDL-C | Dementia with Lewy bodies | IVW | 0.81 (0.72,0.92) | 0.0010 | 836.34 | 0.4318 | ||
| MR-Egger | 0.71 (0.59,0.87) | 0.0007 | 0.0045 | 0.0918 | 833.48 | 0.4497 | ||
| Weighted median | 0.78 (0.63,0.97) | 0.0257 | ||||||
| Maximum likelihood | 0.81 (0.72,0.92) | 0.0010 | ||||||
| RAPS | 0.82 (0.72,0.93) | 0.0026 | ||||||
| MetS | Dementia due to Parkinson’s disease | IVW | 0.84 (0.63,1.12) | 0.2546 | 125.51 | 0.4451 | ||
| MR-Egger | 0.60 (0.31,1.14) | 0.1270 | 0.0254 | 0.2527 | 124.17 | 0.4532 | ||
| Weighted median | 0.74 (0.48,1.12) | 0.1600 | ||||||
| Maximum likelihood | 0.84 (0.63,1.12) | 0.2517 | ||||||
| RAPS | 0.84 (0.62,1.13) | 0.2661 | ||||||
| WC | Dementia due to Parkinson’s disease | IVW | 0.65 (0.36,1.17) | 0.1542 | 592.46 | 0.1966 | ||
| MR-Egger | 0.72 (0.12,4.04) | 0.7112 | –0.0015 | 0.9092 | 592.45 | 0.1886 | ||
| Weighted median | 0.91 (0.36,2.29) | 0.8494 | ||||||
| Maximum likelihood | 0.66 (0.37,1.17) | 0.1628 | ||||||
| RAPS | 0.68 (0.37,1.24) | 0.2105 | ||||||
| Hypertension | Dementia due to Parkinson’s disease | IVW | 0.05 (4.11e-04,6.36) | 0.2270 | 70.94 | 0.2861 | ||
| MR-Egger | 0.01 (2.04e-10,2.09e+05) | 0.5704 | 0.0115 | 0.8087 | 70.88 | 0.2590 | ||
| Weighted median | 0.02 (2.44e-05,28.70) | 0.3137 | ||||||
| Maximum likelihood | 0.04 (4.51e-04,5.13e) | 0.2029 | ||||||
| RAPS | 0.01 (1.09e-04,1.77e) | 0.0841 | ||||||
| FBG | Dementia due to Parkinson’s disease | IVW | 1.79 (0.71,4.48) | 0.2100 | 96.64 | 0.7536 | ||
| MR-Egger | 1.14 (0.22,5.84) | 0.8744 | 0.0130 | 0.5124 | 96.21 | 0.7414 | ||
| Weighted median | 1.89 (0.43,8.33) | 0.3962 | ||||||
| Maximum likelihood | 1.79 (0.71,4.50) | 0.2113 | ||||||
| RAPS | 1.81 (0.70,4.68) | 0.2165 | ||||||
| TG | Dementia due to Parkinson’s disease | IVW | 1.01 (0.73,1.39) | 0.9441 | ||||
| MR-Egger | 0.99 (0.59,1.68) | 0.9900 | 0.0004 | 0.9442 | ||||
| Weighted median | 1.25 (0.71,2.23) | 0.4296 | ||||||
| Maximum likelihood | 1.01 (0.73,1.39) | 0.9444 | ||||||
| RAPS | 1.01 (0.72,1.41) | 0.9389 | ||||||
| HDL-C | Dementia due to Parkinson’s disease | IVW | 1.07 (0.80,1.42) | 0.6446 | 982.43 | 0.0389 | ||
| MR-Egger | 1.67 (1.07,2.63) | 0.0239 | –0.0162 | 0.0107 | 975.39 | 0.0516 | ||
| Weighted median | 1.45 (0.86,2.45) | 0.1621 | ||||||
| Maximum likelihood | 1.07 (0.81,1.41) | 0.6326 | ||||||
| RAPS | 1.09 (0.81,1.47) | 0.5292 |
MetS, metabolic syndrome; WC, waist circumference; FBG, fasting blood glucose; TG, triglycerides; HDL-C, high-density lipoprotein cholesterol; IVW, inverse-variance weighted; RAPS, robust adjusted profile score; OR, odds ratio.
Table 3
The demographic characteristics for any dementia, vascular dementia, dementia due to Parkinson’s disease
| Exposure | Female | Male | Mean age at first event (year-old) | Absolute risk (15 years) |
| Any dementia | 4,281 | 5,441 | 77.53 | 0.02 |
| Vascular dementia | 567 | 1,035 | 78.53 | 0.01 |
| Dementia due to Parkinson’s disease | 128 | 262 | 75.53 | – |
Table 4
The demographic characteristics for frontotemporal dementia
| Exposure | Female | Male | Mean age of onset (year-old) | Mean age of death (year-old) | Motor neuron disease (present) | Family history |
| Frontotemporal dementia | 227 | 286 | 59.8 | 67.6 | 104 | 169 |
Table 5
The demographic characteristics for dementia with Lewy bodies
| Exposure | Female | Male | Clinically ascertained | Pathologically diagnosed | Mean age (year-old) |
| Dementia with Lewy bodies | 948 | 1,643 | 802 | 1,789 | 75 |
As to any dementia, it can be found that MetS, WC, hypertension, FBG, TG, and HDL-C are not causally associated with the risk of any dementia (all p > 0.0016, Table 2, Fig. 2). The results of Cochran’s Q analysis show a visible heterogeneity between TG and any dementia (Table 2), while a symmetry of MR results in the funnel plot (Fig. 3) is observed. In the MR-Egger and MR-PRESSO analyses, no pleiotropy is identified (MR-Egger: all p > 0.05; MR-PRESSO: all p > 0.05, Table 2). Additionally, no influential SNPs are detected in the leave-one-out analysis when excluding any one of the SNP in turn (Fig. 4). Figure 5 presents the results of the causal estimate of every SNP on any dementia.
Fig. 2
The scatter plots of the association between genetically predicted MetS and its components on dementia in the MR analysis. MetS, metabolic syndrome; WC, waist circumference; FBG, fasting blood glucose; TG, triglycerides; HDL-C, high-density lipoprotein cholesterol; AD, Alzheimer’s disease; VD, vascular dementia; FD, frontotemporal dementia; DLB, dementia with Lewy bodies; D-PD, dementia due to Parkinson’s disease.
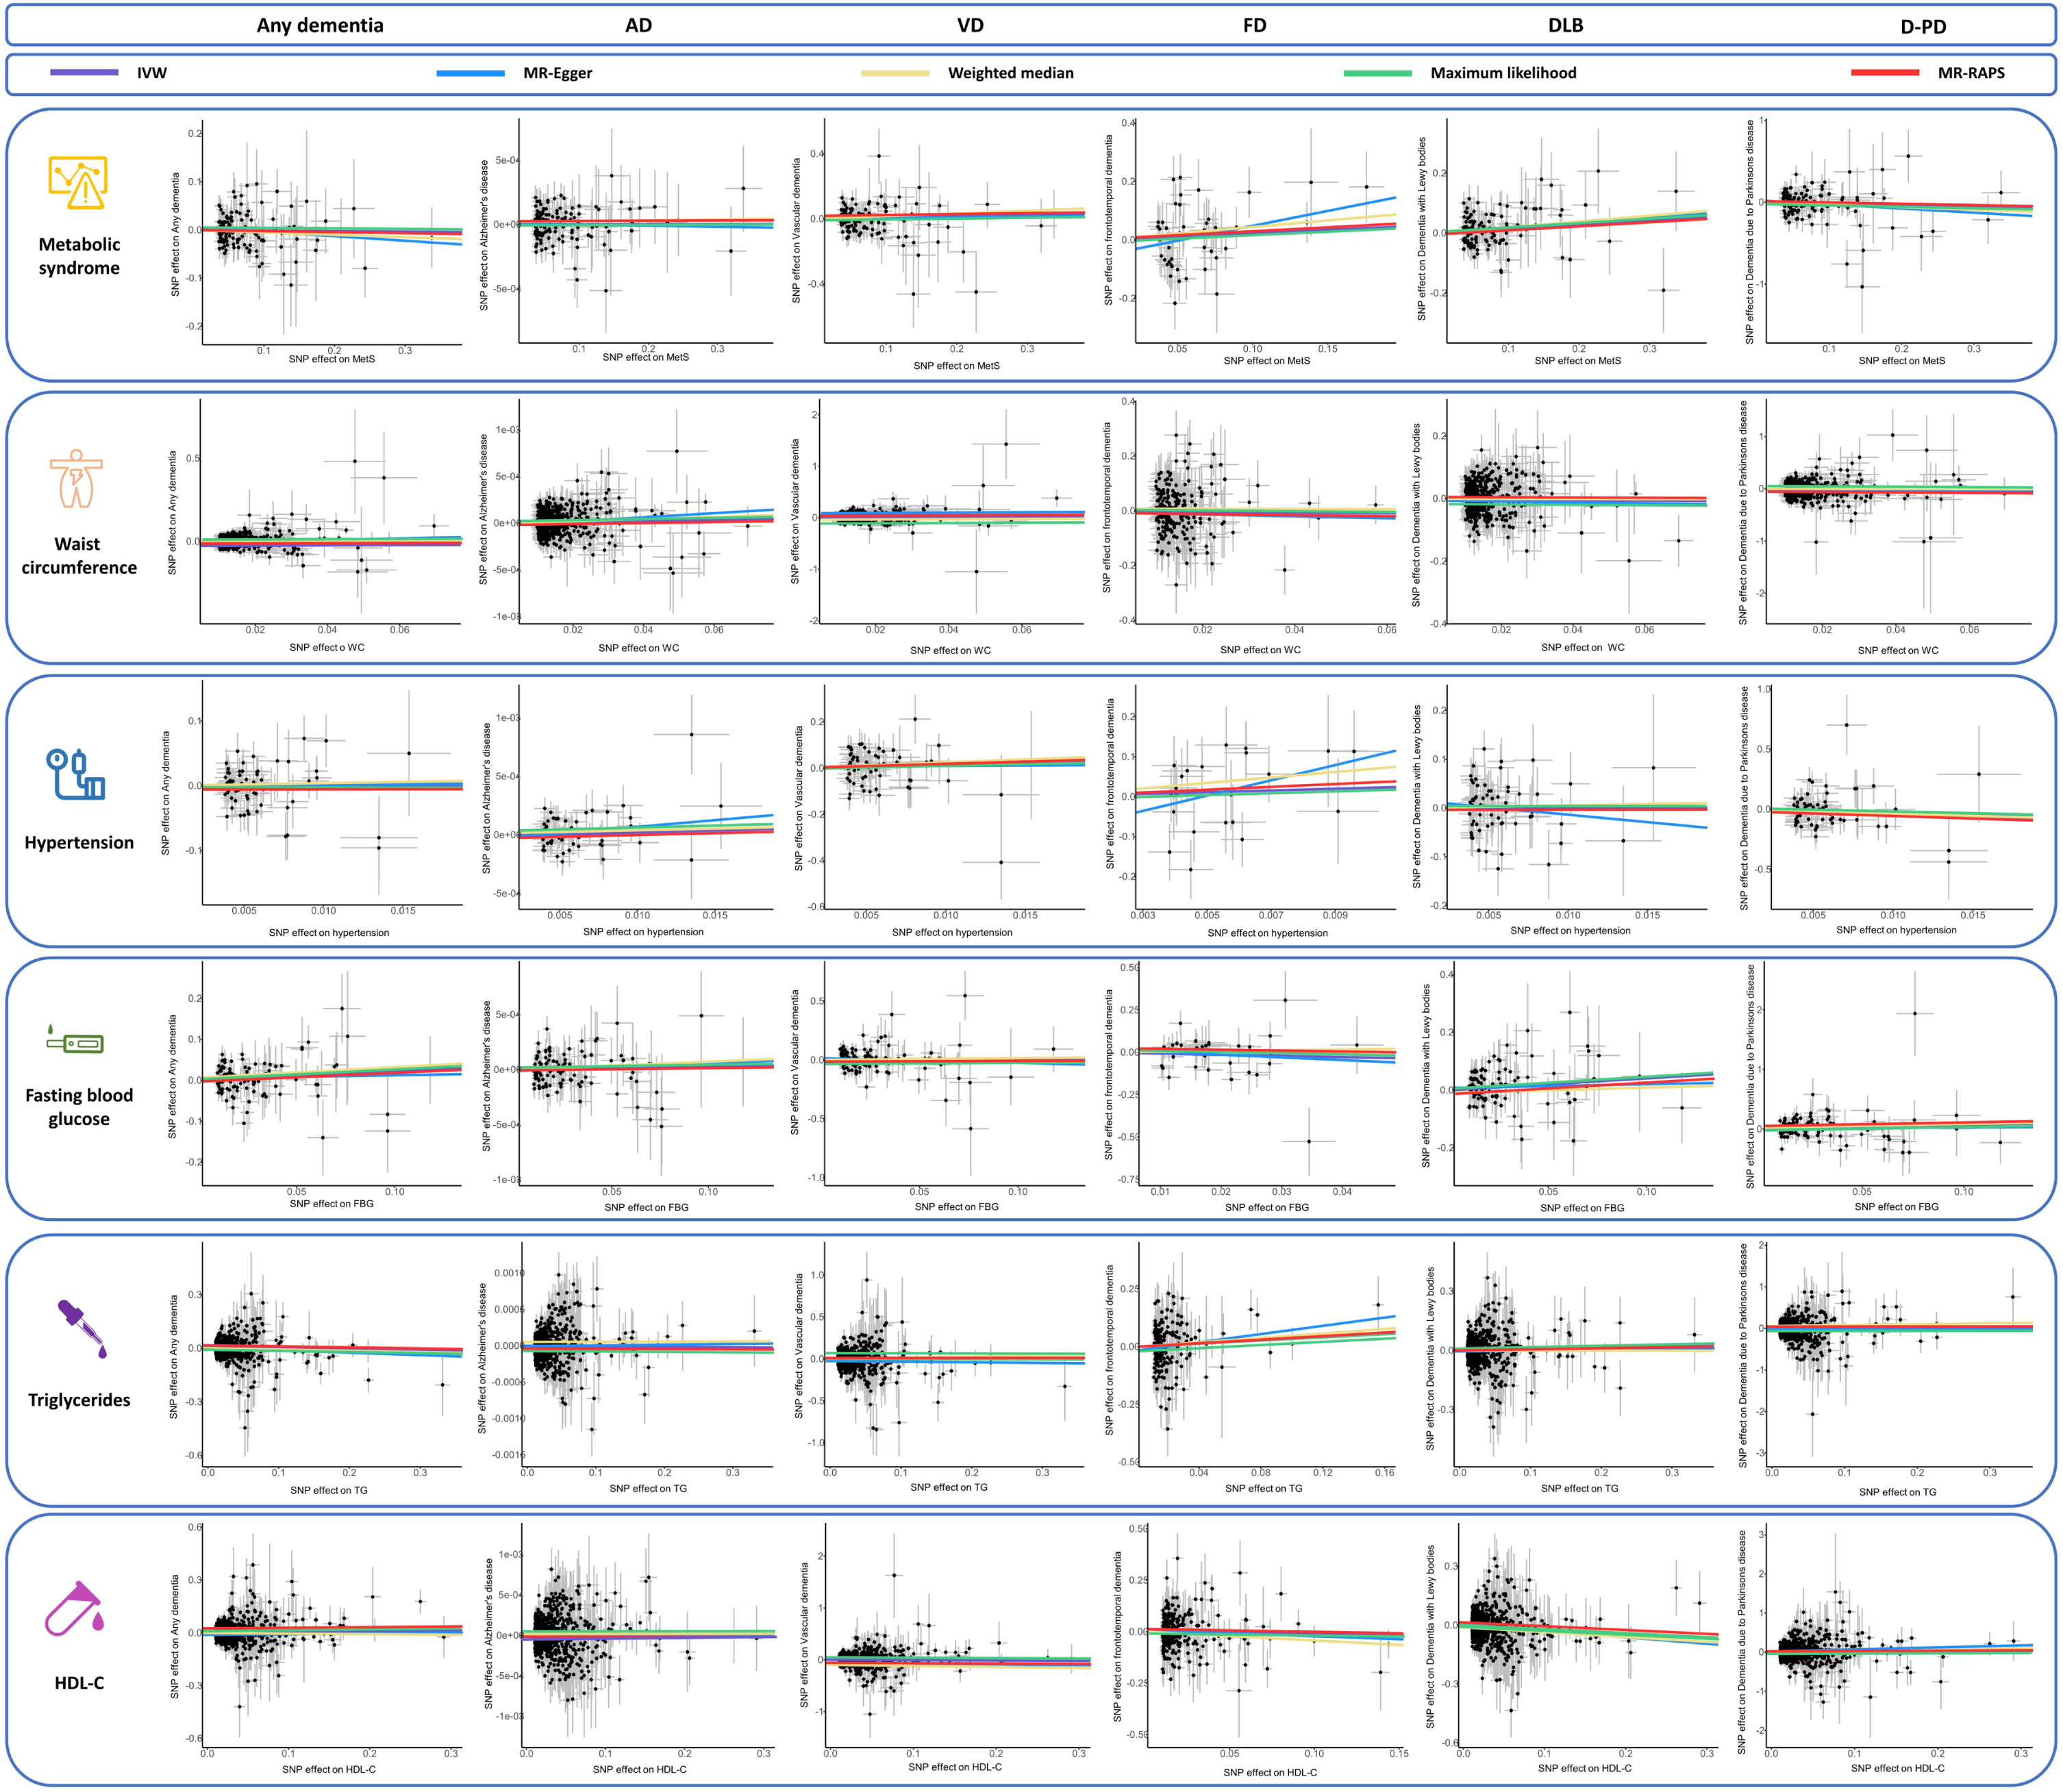
Fig. 3
The funnel plots of the association between genetically predicted MetS and its components on dementia in the MR analysis. AD, Alzheimer’s disease; VD, vascular dementia; FD, frontotemporal dementia; DLB, dementia with Lewy bodies; HDL-C, high-density lipoprotein cholesterol; MR, Mendelian randomization; D-PD, dementia due to Parkinson’s disease.
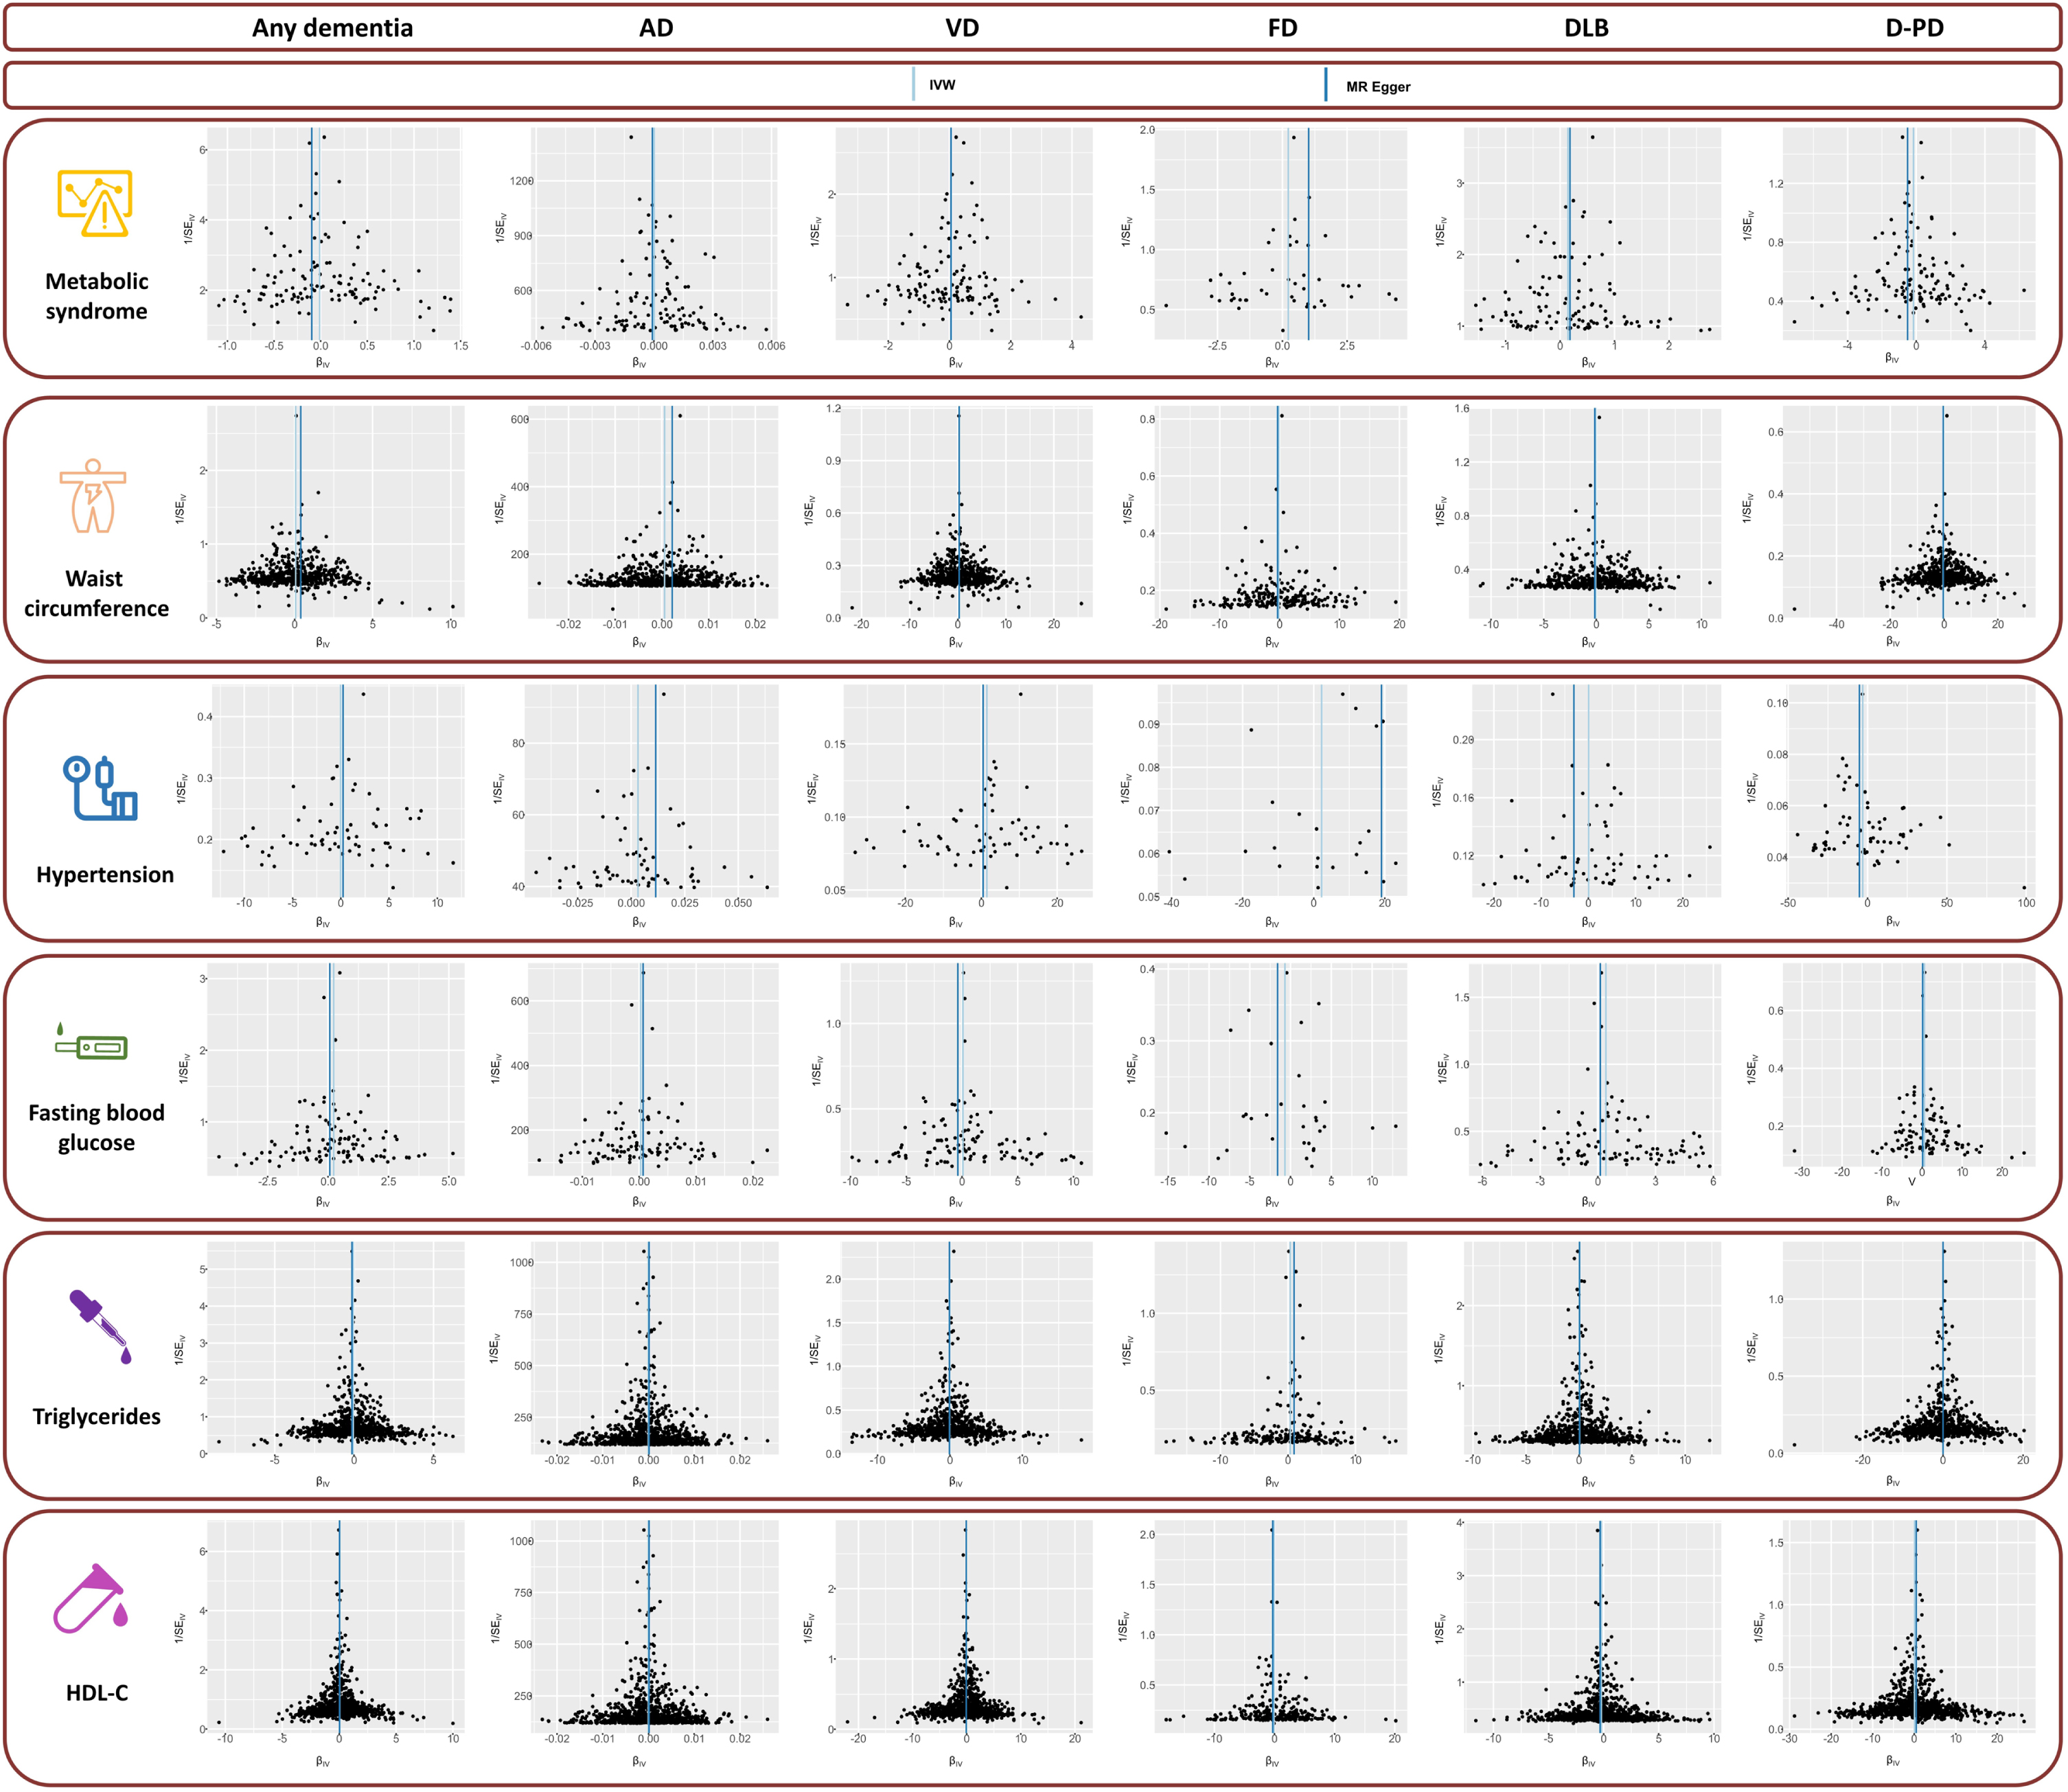
Fig. 4
The leave-one-out analysis of the association between genetically MetS and its components on dementia in the MR analysis. AD, Alzheimer’s disease; VD, vascular dementia; FD, frontotemporal dementia; DLB, dementia with Lewy bodies; HDL-C, high-density lipoprotein cholesterol; MR, Mendelian randomization; D-PD, dementia due to Parkinson’s disease.
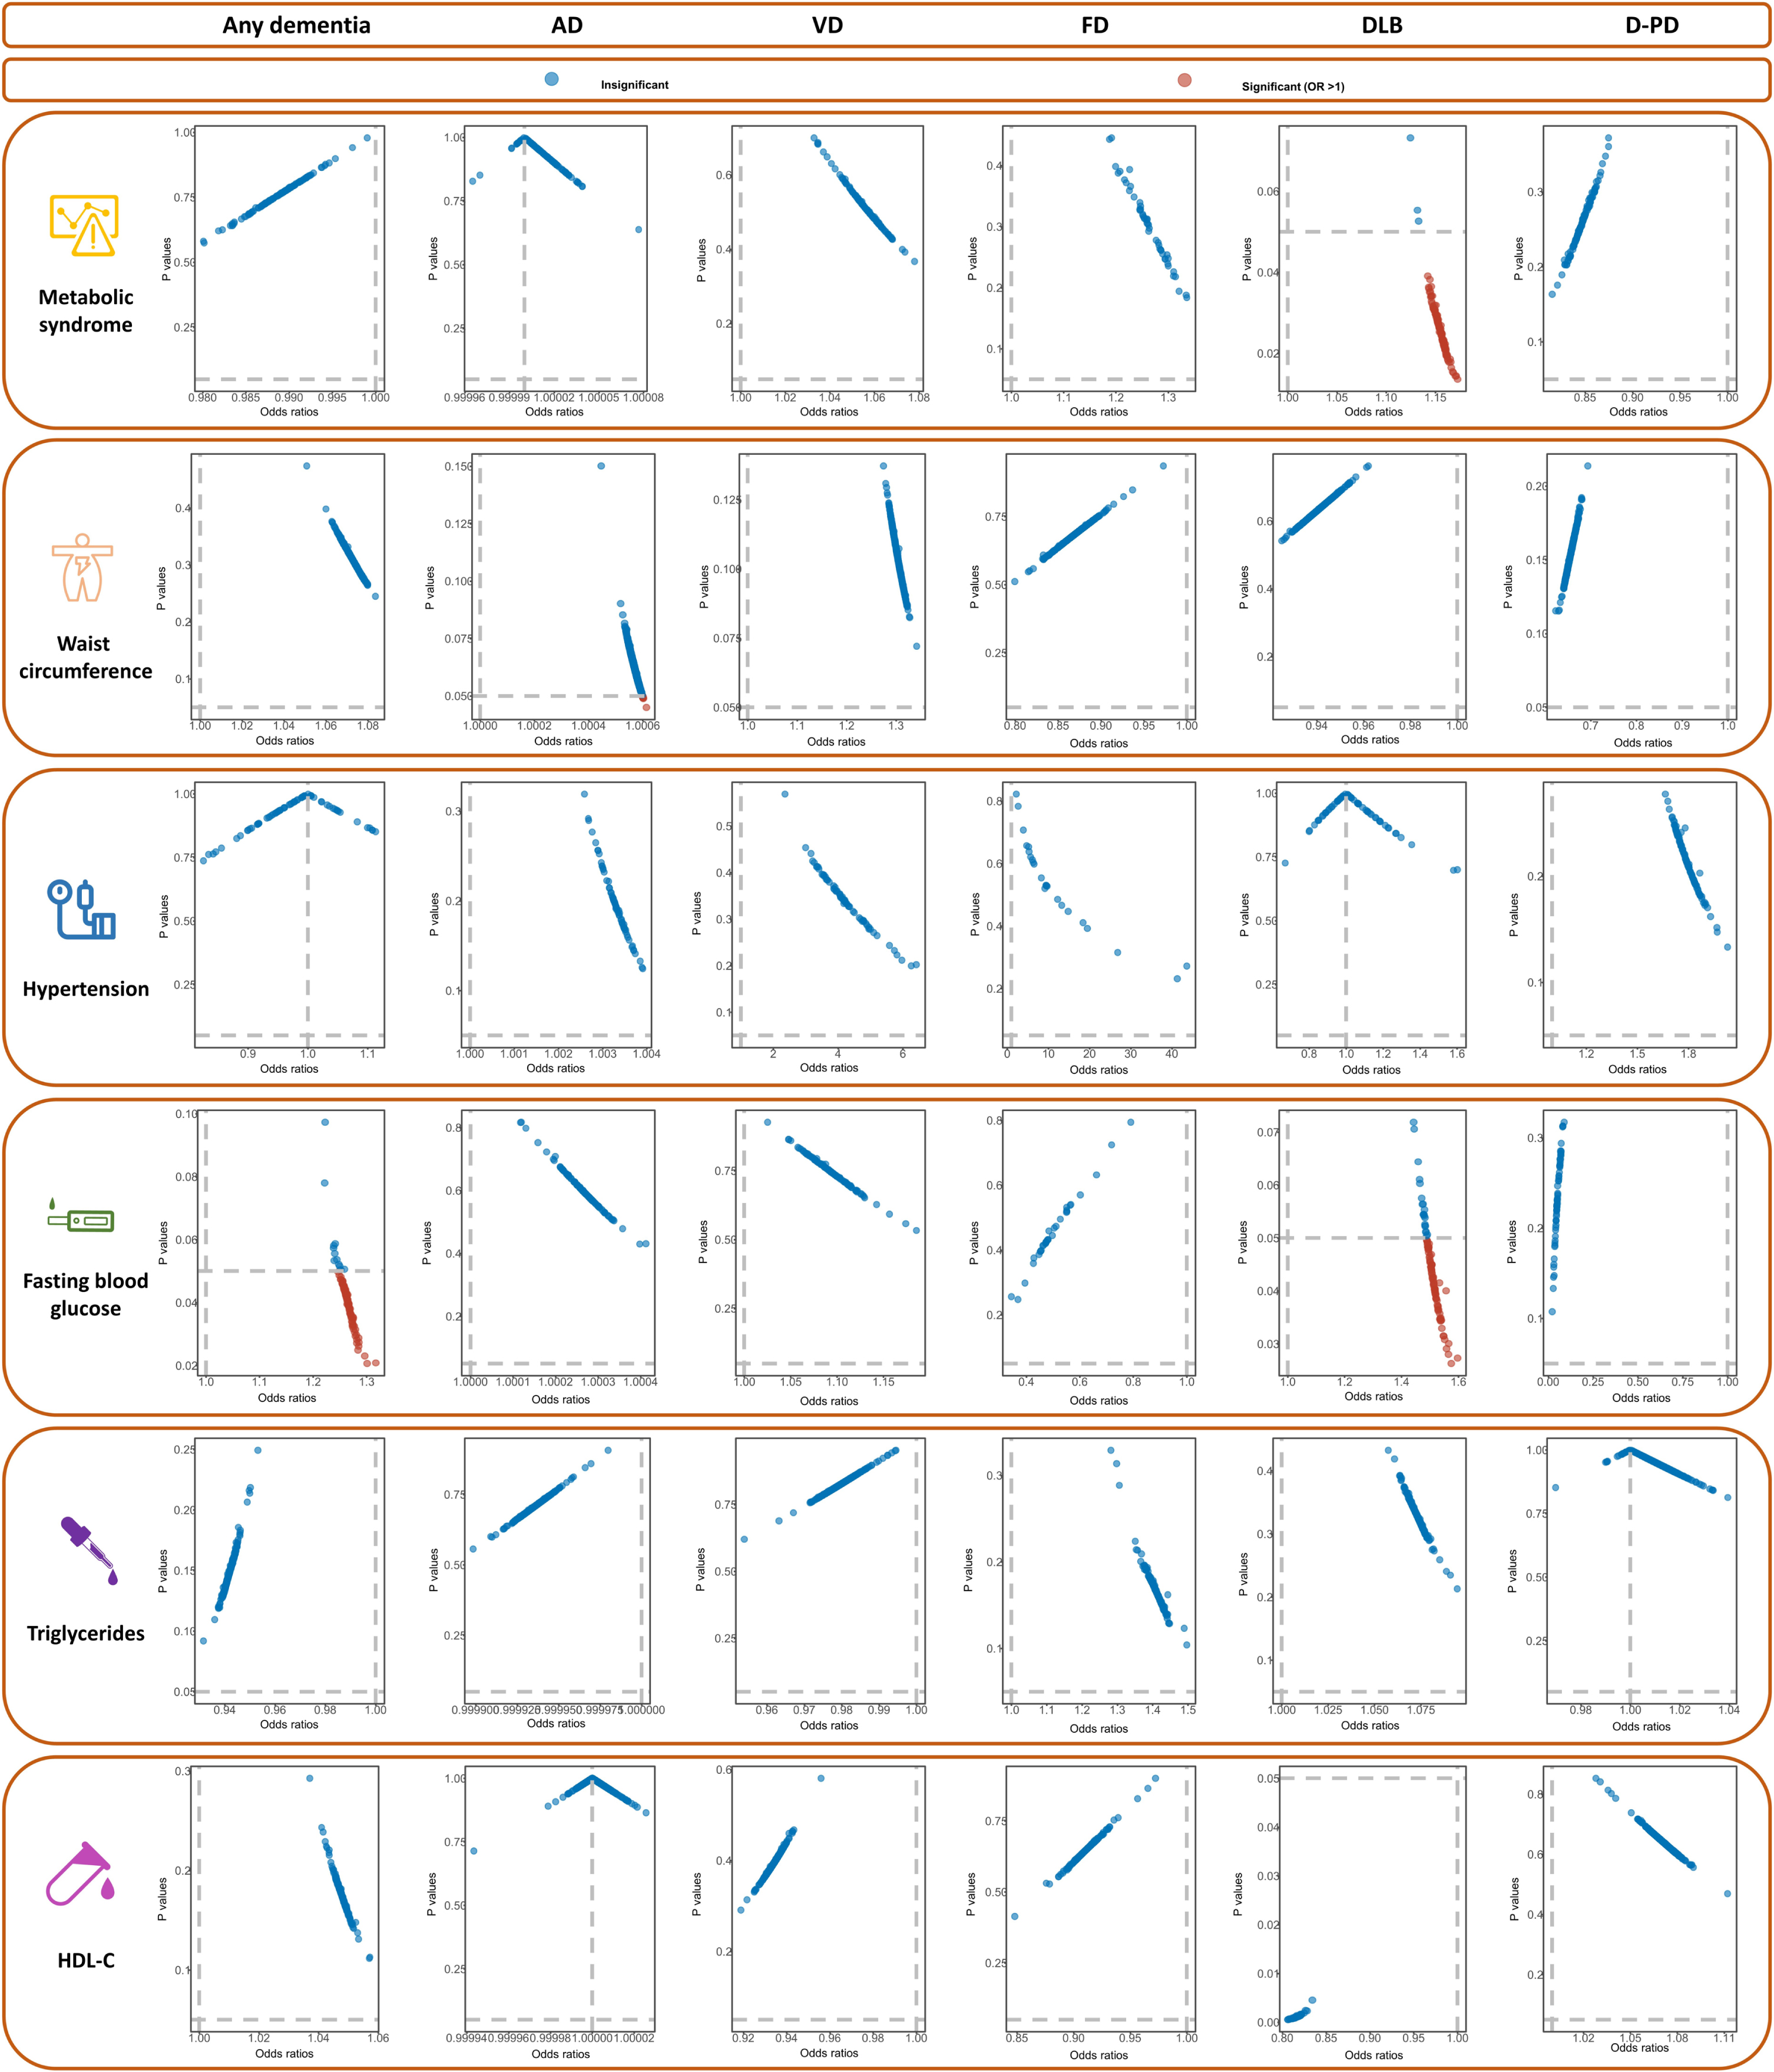
Fig. 5
The frost plots of the association between genetically MetS and its components on dementia in the MR analysis. AD, Alzheimer’s disease; VD, vascular dementia; FD, frontotemporal dementia; DLB, dementia with Lewy bodies; HDL-C, high-density lipoprotein cholesterol; MR, mendelian randomization; D-PD, dementia due to Parkinson’s disease.
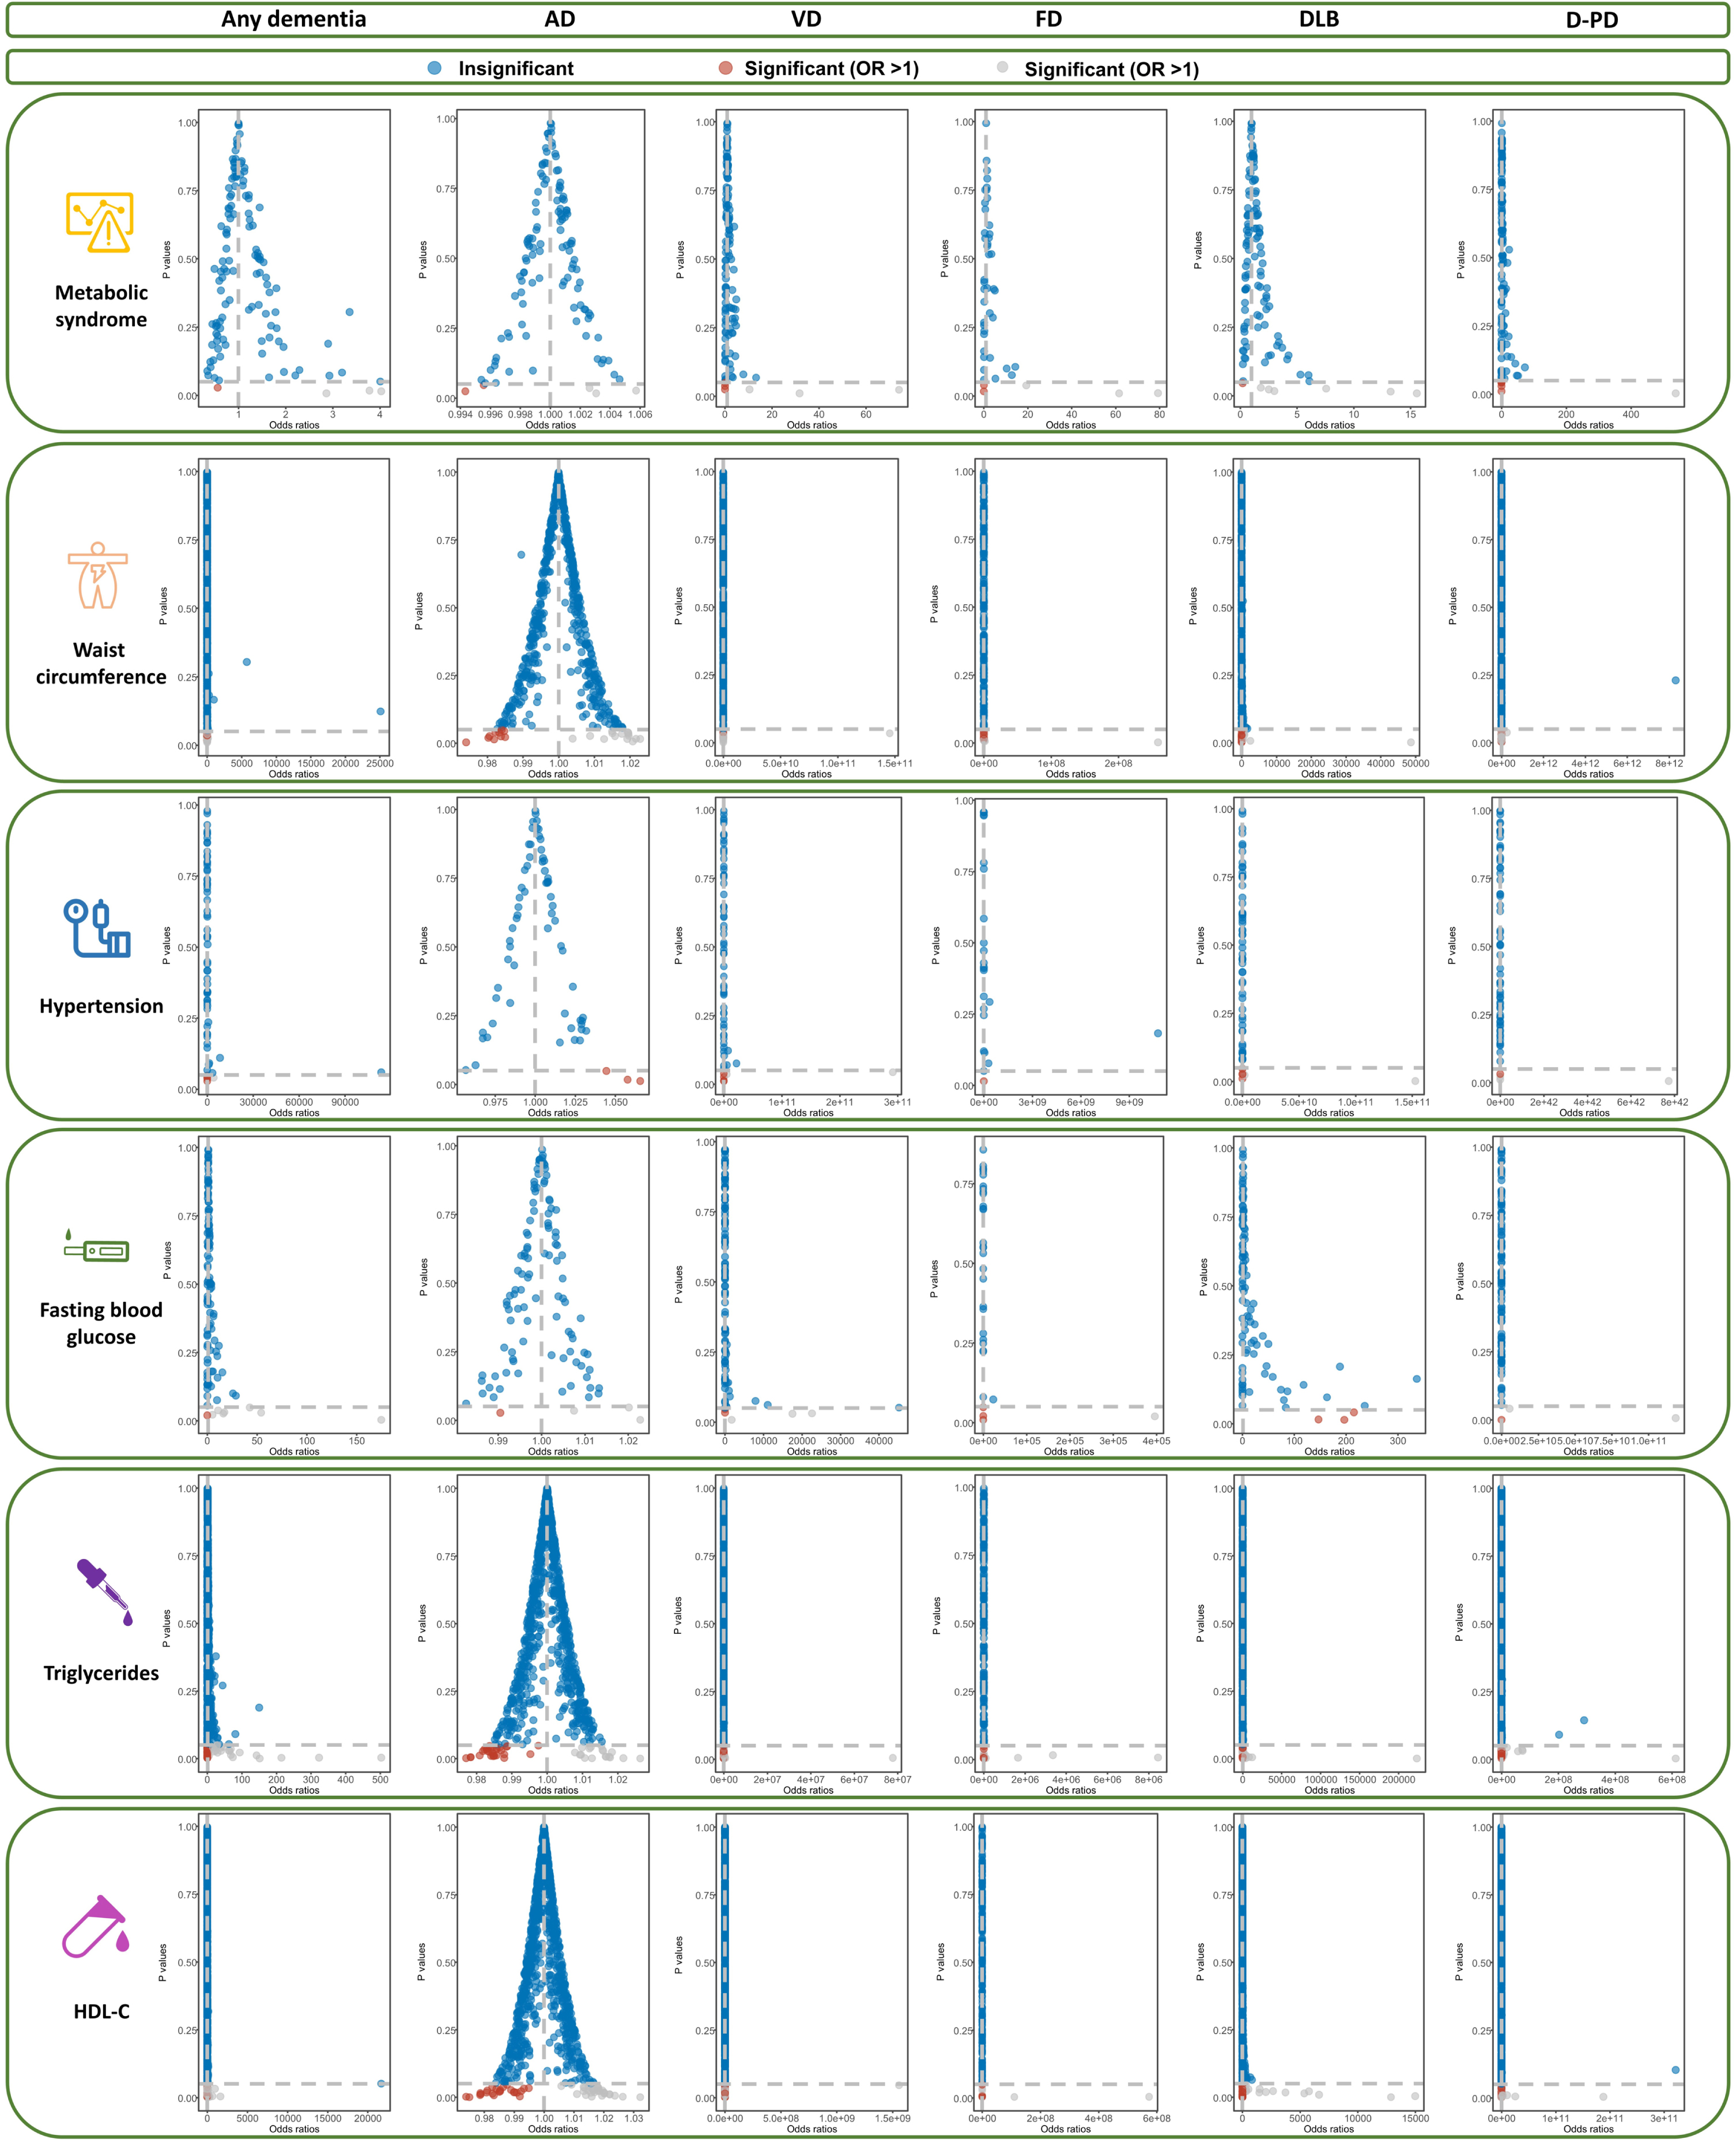
For AD, the results of IVW method show that no causal relationship of MetS and its subtypes is identified (all p > 0.0016, Table 2, Fig. 2). No evidence of heterogeneity is detected in Cochran’s Q analysis (all p > 0.05, Table 2) and the funnel plot (Fig. 3). Furthermore, no signs of pleiotropy is found in MR-Egger and MR-PRESSO analyses (Table 2). The leave-one-out analyses indicate the robustness of our MR results (Fig. 4). The causal estimate of each IV on AD is shown in Fig. 5.
In MR analysis for vascular dementia, we do not observe significant causal association between MetS, its subtypes, and vascular dementia (all p > 0.0016, Table 2, Fig. 2). In sensitivity analysis, Cochran’s Q test does not find any heterogeneity (Fig. 3, Table 2). In addition, there is no evidence of pleiotropyin MR-Egger and MR-PRESSO analyses (Table 2). The causal estimates are not driven by single SNP in the leave-one-out analysis (Fig. 4, Table 2). The frost plot manifesting the casual estimate of every SNP on vascular dementia is shown in Fig. 5.
As to frontotemporal dementia, there is no causal association between MetS, WC, hypertension, FBG, TG, HDL-C, and frontotemporal dementia (all p > 0.0016, Table 2, Fig. 2). Although the results in Cochran’s Q test demonstrate a visible heterogeneity between MetS and frontotemporal dementia (Table 2), the funnel plot reveals a symmetry of MR results (Fig. 3). We do not find pleiotropy in MR-Egger and MR-PRESSO analyses (Table 2), and the results of leave-one-out analysis remain robust (Fig. 4, Table 2). The causal estimate of each IV on frontotemporal dementia is displayed in frost plot (Fig. 5).
HDL-C decreases the risk of dementia with Lewy bodies (odd ratios (OR) = 0.81, 95% confidential index (CI) = 0.72–0.92, p = 0.0010), while no causal relationship is observed between MetS, WC, hypertension, FBG, TG, and dementia with Lewy bodies (all p > 0.0016, Table 2, Fig. 2). The funnel plot is symmetrical despite a visible heterogeneity in Cochran’s Q analysis (Table 2, Fig. 3). MR-Egger method and MR-PRESSO do not find potential pleiotropy (Table 2). The results of the leave-one-out analysis are stable (Fig. 4). The causal estimate of each SNP on dementia with Lewy bodies is depicted in Fig. 5.
As shown in Table 2 and Fig. 2, MetS and its five components are not causally related to dementia due to Parkinson’s disease (all p > 0.05). In sensitivity analyses, although there has pleiotropy (MR-Egger: p-Egger intercept <0.05, Table 2), the relationship still does not exist after performing CAUSE analysis (p = 0.94). There is no evidence of heterogeneity according to the findings of Cochran’s Q test and the funnel plot (Fig. 3, Table 2). Additionally, the robustness of the MR estimates is verified by the leave-one-out analysis (Fig. 4). Figure 5 demonstrates the casual estimate of each SNP on dementia due to Parkinson’s disease.
Table 6
The opinion about the relationship between MetS, its components and dementia in references
| Author | Study | Relationship | Opinion |
| Ng TP [6] | Singapore Longitudinal Ageing Study Cohort | MetS and any dementia | Harm |
| Akbaraly TN [7] | Whitehall II study | MetS and any dementia | Harm |
| Muller M [8] | Multiethnic elderly cohort | MetS and any dementia | None |
| Atti AR [27] | Meta-Analysis of Longitudinal Studies | MetS and any dementia | None |
| Watts AS [9] | – | MetS and any dementia | Protective |
| Abbatecola AM [28] | – | WC and any dementia | Harm |
| Ong HL [29] | Cross-sectional epidemiological study | WC and any dementia | None |
| Walker KA [31] | – | Hypertension and any dementia | Harm |
| Sierra C [30] | – | Hypertension and any dementia | Unknown |
| Jennings JR [32] | – | Hypertension and any dementia | Harm |
| Barbiellini Amidei C [33] and Mortimer JA [34] | – | FBG and any dementia | Harm |
| Reitz C, Li J, Han KT [35–37] | – | TG, HDL-C and any dementia | Inclusive |
| Atti AR [27] | Meta-analysis | MetS and AD | None |
| Lee JE [39] | – | MetS and AD | Harm |
| Forti P [40] | Prospective population-based cohort | MetS and AD | Protective |
| Danat IM [41] | Meta-analysis | WC and AD | None |
| Singh-Manoux A [42] | Whitehall II Study | WC and AD | Harm |
| Raffaitin C and Solfrizzi V [43, 44] | – | MetS and vascular dementia | Harm |
| Golimstok A [46] | Case-control study | FBG and frontotemporal dementia | Harm |
| Schelp AO [50] | Cross-sectional study | MetS, its components and dementia due to Parkinson’s disease | None |
| Dou Y, Yasuno F, Svensson T [51–53] | – | HDL-C and dementia with Lewy bodies | Protective |
AD, Alzheimer’s disease; MetS, metabolic syndrome; WC, waist circumference; FBG, fasting blood glucose; TG, triglycerides; HDL-C, high-density lipoprotein cholesterol.
DISCUSSION
In our MR analysis, we find that no significant causal association exists between MetS, its five components, and different dementia types, including any dementia, AD, vascular dementia, frontotemporal dementia, dementia with Lewy bodies, and dementia due to Parkinson’s disease, except for the relationship between HDL-C and dementia with Lewy bodies. HDL-C may play a protective role in dementia with Lewy bodies.
The previous results of the association between MetS, its components, and dementia is summarized in Table 6. The role of MetS on any dementia is not yet concluded. Some studies support the association between MetS and any dementia. For example, a cohort study including 1,519 participants conducted in Singapore finds that the MetS is associated with an increased risk of dementia [6]. The findings in the Whitehall II study also reveal that persistent MetS decline cognitive performance in late midlife [7]. In contrast, other studies do not support the association. In a cross-sectional and prospective study consisting of 2,476 men and women aged 65 years, researchers find that MetS is not associated with the increasing risk of dementia after 4.4 years of follow-up [8]. A recent meta-analysis including 18,313 participants ranging from January 1, 2000 to August 31, 2018 shows that no statistical significance pooled association emerges between MetS and dementia [27]. Some studies even support the protective role of MetS on dementia [9]. In our MR study, we do not identify the causal association between MetS and any dementia.
For the relationship between five components of MetS and any dementia, the association remains inconsistent. As to waist circumference, Abbatecola and his colleagues think that WC can predict the risk of cognitive decline during the 12-year follow-up in older patients with diabetes [28]. However, a study including 2,565 men and women does not find the association [29]. In our MR study, we do not support the causal association. The effect of hypertension on dementia remains unclear. Considering the numerous factors affecting hypertension, such as age and hypertension chronicity, the role of hypertension in dementia is complex [30]. For example, large epidemiological studies have demonstrated a consistent association between high midlife blood pressure and cognitive decline, while a similar association between late-life blood pressure and cognition decline is not consistent [31]. From the perspective of neuroimage, a recent study finds that hypertension may alter brain structure and function, which may result in disruption in cognitive function [32]. However, the causal association between hypertension and dementia does not exist in this study. FBG represents the abnormality of glucose level and is recognized as a well-known risk factor for dementia [33, 34], while we do not identify the causal association. In the association of TG, HDL-C, and dementia, the results also remain inclusive [35–37]. Our MR analysis does not find a causal relationship.
Inconsistent conclusions are also obtained about the association between MetS, its components, and AD [27, 38]. A meta-analysis, including a total of 18,313 participants aged older than 40 years with mean MetS prevalence of 22.7% and followed on average for 9.41 years, found that no significant pooled association existed between MetS and AD [27]. However, contradictory results also been reported [39], and the inverse association also have been observed [40]. As for MetS components, the effects on AD remain inconsistent. For example, a meta-analysis including 16 cohort studies and 41,781 participants and 4,511 dementia cases, no beneficial impacts of obesity in older age on incident dementia is found [41]. However, a study including a total of 10,308 adults found the detrimental effects on AD incidence [42]. In our MR study, no causal association between MetS, its components and the risk of AD were identified.
The studies related to the role of MetS on vascular dementia support the detrimental effect of MetS and may increase the risk of vascular dementia [43, 44], although these studies are scarce. In the Italian Longitudinal Study on Ageing including a total of 2,097 participants (MetS subjects [n = 918], subjects without MetS [n = 1,179]), studies found that MetS elevated the risk of vascular dementia [44]. So far, potential associations between frontotemporal dementia, and head trauma [45], diabetes [46], and autoimmune conditions may exist [47]. However, the study about the causal association between MetS and frontotemporal dementia is limited [48]. The study related to the association between MetS and dementia with Lewy bodies [49] and dementia due to Parkinson’s disease is also scarce, and no association between MetS, its components and dementia due to Parkinson’s disease was identified [50]. In our MR study, we find no significant casual association between MetS, its components and vascular dementia, frontotemporal dementia, and dementia due to Parkinson’s disease. As for dementia with Lewy bodies, Dou and colleagues thought that reduced levels of HDL-C were associated with the development of dementia with Lewy bodies in a case-control study including 65 patients with Lewy body dementia and 110 older adult controls [51]. Several studies also supported the relationship [52, 53].
Many observational studies may be influenced by many confounding factors such as limited sample size or (and) retrospective study. The strength of our MR study overcomes the possible confounders and clarifies the causal association between MetS and different dementia types. Additionally, it is the first study to illustrate their association. However, this study has several limitations. Firstly, the cases of different dementia are relatively small. Second, there is an ethnic bias because the datasets are all of European ancestry, which may limit the generalization of the conclusion. Third, we do not make stratification based on some factors such as age and gender due to the unavailability of stratification datasets. Future studies are required to verify these association in other ancestries, larger studies, and proper stratification people.
Conclusion
In our MR study, MetS and its components do not increase the risk of different dementia types., while HDL-C may play a protective role in dementia with Lewy bodies.
ACKNOWLEDGMENTS
We give great appreciation to the participants and working staff for their excellent job to the study.
FUNDING
This study was supported by the 1 3 5 project for disciplines of Excellence-Clinical Research Incubation Project, West China Hospital, Sichuan University (2018HXFH010).
CONFLICT OF INTEREST
The authors have no conflict of interest to report.
DATA AVAILABILITY
All data in our MR analyses are available from public databases (https://gwas.mrcieu.ac.uk/).
REFERENCES
[1] | Bosnjak Kuharic D , Markovic D , Brkovic T , Jeric Kegalj M , Rubic Z , Vuica Vukasovic A , Jeroncic A , Puljak L ((2021) ) Cannabinoids for the treatment of dementia, Cochrane Database Syst Rev 9: , CD012820. |
[2] | ((2022) ) 2022 Alzheimer’s disease facts and figures, Alzheimers Dement 18: , 700–789. |
[3] | Collaborators GBDDF ((2022) ) Estimation of the global prevalence of dementia in 2019 and forecasted prevalence in 2050: An analysis for the Global Burden of Disease Study 2019, Lancet Public Health 7: , e105–e125. |
[4] | Eckel RH , Grundy SM , Zimmet PZ ((2005) ) The metabolic syndrome, Lancet 365: , 1415–1428. |
[5] | Mogre V , Salifu ZS , Abedandi R ((2014) ) Prevalence, components and associated demographic and lifestyle factors of the metabolic syndrome in type 2 diabetes mellitus, J Diabetes Metab Disord 13: , 80. |
[6] | Ng TP , Feng L , Nyunt MS , Feng L , Gao Q , Lim ML , Collinson SL , Chong MS , Lim WS , Lee TS , Yap P , Yap KB ((2016) ) Metabolic syndrome and the risk of mild cognitive impairment and progression to dementia: Follow-up of the Singapore Longitudinal Ageing Study Cohort, JAMA Neurol 73: , 456–463. |
[7] | Akbaraly TN , Kivimaki M , Shipley MJ , Tabak AG , Jokela M , Virtanen M , Marmot MG , Ferrie JE , Singh-Manoux A ((2010) ) Metabolic syndrome over 10 years and cognitive functioning in late midlife: The Whitehall II study, Diabetes Care 33: , 84–89. |
[8] | Muller M , Tang MX , Schupf N , Manly JJ , Mayeux R , Luchsinger JA ((2007) ) Metabolic syndrome and dementia risk in a multiethnic elderly cohort, Dement Geriatr Cogn Disord 24: , 185–192. |
[9] | Watts AS , Loskutova N , Burns JM , Johnson DK ((2013) ) Metabolic syndrome and cognitive decline in early Alzheimer’s disease and healthy older adults, J Alzheimers Dis 35: , 253–265. |
[10] | Emdin CA , Khera AV , Kathiresan S ((2017) ) Mendelian randomization, JAMA 318: , 1925–1926. |
[11] | Smith GD , Ebrahim S ((2003) ) ‘Mendelian randomization’: can genetic epidemiology contribute to understanding environmental determinants of disease? , Int J Epidemiol 32: , 1–22. |
[12] | Lind L ((2019) ) Genome-wide association study of the metabolic syndrome in UK Biobank, Metab Syndr Relat Disord 17: , 505–511. |
[13] | Richardson TG , Sanderson E , Palmer TM , Ala-Korpela M , Ference BA , Davey Smith G , Holmes MV ((2020) ) Evaluating the relationship between circulating lipoprotein lipids and apolipoproteins with risk of coronary heart disease: A multivariable Mendelian randomisation analysis, PLoS Med 17: , e1003062. |
[14] | Chen J , Spracklen CN , Marenne G , Varshney A , Corbin LJ , Luan J , Willems SM , Wu Y , Zhang X , Horikoshi M , et al. ((2021) ) The trans-ancestral genomic architecture of glycemic traits, Nat Genet 53: , 840–860. |
[15] | Larsson SC , Woolf B , Gill D ((2022) ) Plasma caffeine levels and risk of Alzheimer’s disease and Parkinson’s disease: Mendelian randomization study, Nutrients 14: , 1697. |
[16] | Van Deerlin VM , Sleiman PM , Martinez-Lage M , Chen-Plotkin A , Wang LS , Graff-Radford NR , Dickson DW , Rademakers R , Boeve BF , Grossman M , Arnold SE , Mann DM , Pickering-Brown SM , Seelaar H , Heutink P , van Swieten JC , Murrell JR , Ghetti B , Spina S , Grafman J , Hodges J , Spillantini MG , Gilman S , Lieberman AP , Kaye JA , Woltjer RL , Bigio EH , Mesulam M , Al-Sarraj S , Troakes C , Rosenberg RN , White CL , 3rd, Ferrer I , Llado A , Neumann M , Kretzschmar HA , Hulette CM , Welsh-Bohmer KA , Miller BL , Alzualde A , Lopez de Munain A , McKee AC , Gearing M , Levey AI , Lah JJ , Hardy J , Rohrer JD , Lashley T , Mackenzie IR , Feldman HH , Hamilton RL , Dekosky ST , van der Zee J , Kumar-Singh S , Van Broeckhoven C , Mayeux R , Vonsattel JP , Troncoso JC , Kril JJ , Kwok JB , Halliday GM , Bird TD , Ince PG , Shaw PJ , Cairns NJ , Morris JC , McLean CA , DeCarli C , Ellis WG , Freeman SH , Frosch MP , Growdon JH , Perl DP , Sano M , Bennett DA , Schneider JA , Beach TG , Reiman EM , Woodruff BK , Cummings J , Vinters HV , Miller CA , Chui HC , Alafuzoff I , Hartikainen P , Seilhean D , Galasko D , Masliah E , Cotman CW , Tunon MT , Martinez MC , Munoz DG , Carroll SL , Marson D , Riederer PF , Bogdanovic N , Schellenberg GD , Hakonarson H , Trojanowski JQ , Lee VM ((2010) ) Common variants at 7p21 are associated with frontotemporal lobar degeneration with TDP-43 inclusions, Nat Genet 42: , 234–239. |
[17] | Chia R , Sabir MS , Bandres-Ciga S , Saez-Atienzar S , Reynolds RH , Gustavsson E , Walton RL , Ahmed S , Viollet C , Ding J , Makarious MB , Diez-Fairen M , Portley MK , Shah Z , Abramzon Y , Hernandez DG , Blauwendraat C , Stone DJ , Eicher J , Parkkinen L , Ansorge O , Clark L , Honig LS , Marder K , Lemstra A , St George-Hyslop P , Londos E , Morgan K , Lashley T , Warner TT , Jaunmuktane Z , Galasko D , Santana I , Tienari PJ , Myllykangas L , Oinas M , Cairns NJ , Morris JC , Halliday GM , Van Deerlin VM , Trojanowski JQ , Grassano M , Calvo A , Mora G , Canosa A , Floris G , Bohannan RC , Brett F , Gan-Or Z , Geiger JT , Moore A , May P , Kruger R , Goldstein DS , Lopez G , Tayebi N , Sidransky E , American Genome C , Norcliffe-Kaufmann L , Palma JA , Kaufmann H , Shakkottai VG , Perkins M , Newell KL , Gasser T , Schulte C , Landi F , Salvi E , Cusi D , Masliah E , Kim RC , Caraway CA , Monuki ES , Brunetti M , Dawson TM , Rosenthal LS , Albert MS , Pletnikova O , Troncoso JC , Flanagan ME , Mao Q , Bigio EH , Rodriguez-Rodriguez E , Infante J , Lage C , Gonzalez-Aramburu I , Sanchez-Juan P , Ghetti B , Keith J , Black SE , Masellis M , Rogaeva E , Duyckaerts C , Brice A , Lesage S , Xiromerisiou G , Barrett MJ , Tilley BS , Gentleman S , Logroscino G , Serrano GE , Beach TG , McKeith IG , Thomas AJ , Attems J , Morris CM , Palmer L , Love S , Troakes C , Al-Sarraj S , Hodges AK , Aarsland D , Klein G , Kaiser SM , Woltjer R , Pastor P , Bekris LM , Leverenz JB , Besser LM , Kuzma A , Renton AE , Goate A , Bennett DA , Scherzer CR , Morris HR , Ferrari R , Albani D , Pickering-Brown S , Faber K , Kukull WA , Morenas-Rodriguez E , Lleo A , Fortea J , Alcolea D , Clarimon J , Nalls MA , Ferrucci L , Resnick SM , Tanaka T , Foroud TM , Graff-Radford NR , Wszolek ZK , Ferman T , Boeve BF , Hardy JA , Topol EJ , Torkamani A , Singleton AB , Ryten M , Dickson DW , Chio A , Ross OA , Gibbs JR , Dalgard CL , Traynor BJ , Scholz SW ((2021) ) Genome sequencing analysis identifies new loci associated with Lewy body dementia and provides insights into its genetic architecture, Nat Genet 53: , 294–303. |
[18] | Burgess S , Thompson SG ((2017) ) Interpreting findings from Mendelian randomization using the MR-Egger method, Eur J Epidemiol 32: , 377–389. |
[19] | Ng JCM , Schooling CM ((2020) ) Effect of glucagon on ischemic heart disease and its risk factors: A Mendelian randomization study, J Clin Endocrinol Metab 105: . |
[20] | He Q , Wang W , Li H , Xiong Y , Tao C , Ma L , You C (2023) Genetic insights into the risk of metabolic syndrome and its components on stroke and its subtypes: Bidirectional Mendelian randomization. J Cereb Blood Flow Metab, doi: 10.1177/0271678X231169838. |
[21] | Verbanck M , Chen CY , Neale B , Do R ((2018) ) Detection of widespread horizontal pleiotropy in causal relationships inferred from Mendelian randomization between complex traits and diseases, Nat Genet 50: , 693–698. |
[22] | Hemani G , Zheng J , Elsworth B , Wade KH , Haberland V , Baird D , Laurin C , Burgess S , Bowden J , Langdon R , Tan VY , Yarmolinsky J , Shihab HA , Timpson NJ , Evans DM , Relton C , Martin RM , Davey Smith G , Gaunt TR , Haycock PC ((2018) ) The MR-Base platform supports systematic causal inference across the human phenome, Elife 7: , e34408. |
[23] | Zhao Q , Chen Y , Wang J , Small DS ((2019) ) Powerful three-sample genome-wide design and robust statistical inference in summary-data Mendelian randomization, Int J Epidemiol 48: , 1478–1492. |
[24] | Bowden J , Davey Smith G , Haycock PC , Burgess S ((2016) ) Consistent estimation in Mendelian randomization with some invalid instruments using a weighted median estimator, Genet Epidemiol 40: , 304–314. |
[25] | Bowden J , Davey Smith G , Burgess S ((2015) ) Mendelian randomization with invalid instruments: Effect estimation and bias detection through Egger regression, Int J Epidemiol 44: , 512–525. |
[26] | Milligan BG ((2003) ) Maximum-likelihood estimation of relatedness, Genetics 163: , 1153–1167. |
[27] | Atti AR , Valente S , Iodice A , Caramella I , Ferrari B , Albert U , Mandelli L , De Ronchi D ((2019) ) Metabolic syndrome, mild cognitive impairment, and dementia: A meta-analysis of longitudinal studies, Am J Geriatr Psychiatry 27: , 625–637. |
[28] | Abbatecola AM , Lattanzio F , Spazzafumo L , Molinari AM , Cioffi M , Canonico R , Dicioccio L , Paolisso G ((2010) ) Adiposity predicts cognitive decline in older persons with diabetes: A 2-year follow-up, PLoS One 5: , e10333. |
[29] | Ong HL , Chang SH , Abdin E , Vaingankar JA , Jeyagurunathan A , Shafie S , Magadi H , Chong SA , Subramaniam M ((2016) ) Association of grip strength, upper arm circumference, and waist circumference with dementia in older adults of the WiSE Study: A cross-sectional analysis, J Nutr Health Aging 20: , 996–1001. |
[30] | Sierra C ((2020) ) Hypertension and the risk of dementia, Front Cardiovasc Med 7: , 5. |
[31] | Walker KA , Power MC , Gottesman RF ((2017) ) Defining the relationship between hypertension, cognitive decline, and dementia: A review, Curr Hypertens Rep 19: , 24. |
[32] | Jennings JR , Mendelson DN , Muldoon MF , Ryan CM , Gianaros PJ , Raz N , Aizenstein H ((2012) ) Regional grey matter shrinks in hypertensive individuals despite successful lowering of blood pressure, J Hum Hypertens 26: , 295–305. |
[33] | Barbiellini Amidei C , Fayosse A , Dumurgier J , Machado-Fragua MD , Tabak AG , van Sloten T , Kivimaki M , Dugravot A , Sabia S , Singh-Manoux A ((2021) ) Association between age at diabetes onset and subsequent risk of dementia, JAMA 325: , 1640–1649. |
[34] | Mortimer JA , Borenstein AR , Ding D , Decarli C , Zhao Q , Copenhaver C , Guo Q , Chu S , Galasko D , Salmon DP , Dai Q , Wu Y , Petersen R , Hong Z ((2010) ) High normal fasting blood glucose is associated with dementia in Chinese elderly, Alzheimers Dement 6: , 440–447. |
[35] | Reitz C , Tang MX , Luchsinger J , Mayeux R ((2004) ) Relation of plasma lipids to Alzheimer disease and vascular dementia, Arch Neurol 61: , 705–714. |
[36] | Li J , Jiao M , Wen J , Fan D , Xia Y , Cao Y , Shi R , Xiao C ((2020) ) Association of body mass index and blood lipid profile with cognitive function in Chinese elderly population based on data from the China Health and Nutrition Survey, 2009–2015, Psychogeriatrics 20: , 663–672. |
[37] | Han KT , Kim SJ ((2021) ) Are serum cholesterol levels associated with cognitive impairment and depression in elderly individuals without dementia?: A retrospective cohort study in South Korea, Int J Geriatr Psychiatry 36: , 163–173. |
[38] | Cervellati C , Wood PL , Romani A , Valacchi G , Squerzanti M , Sanz JM , Ortolani B , Zuliani G ((2016) ) Oxidative challenge in Alzheimer’s disease: State of knowledge and future needs, J Investig Med 64: , 21–32. |
[39] | Lee JE , Shin DW , Han K , Kim D , Yoo JE , Lee J , Kim S , Son KY , Cho B , Kim MJ ((2020) ) Changes in metabolic syndrome status and risk of dementia, J Clin Med 9: , 122. |
[40] | Forti P , Pisacane N , Rietti E , Lucicesare A , Olivelli V , Mariani E , Mecocci P , Ravaglia G ((2010) ) Metabolic syndrome and risk of dementia in older adults, J Am Geriatr Soc 58: , 487–492. |
[41] | Danat IM , Clifford A , Partridge M , Zhou W , Bakre AT , Chen A , McFeeters D , Smith T , Wan Y , Copeland J , Anstey KJ , Chen R ((2019) ) Impacts of overweight and obesity in older age on the risk of dementia: A systematic literature review and a meta-analysis, J Alzheimers Dis 70: , S87–S99. |
[42] | Singh-Manoux A , Dugravot A , Shipley M , Brunner EJ , Elbaz A , Sabia S , Kivimaki M ((2018) ) Obesity trajectories and risk of dementia: 28 years of follow-up in the Whitehall II Study, Alzheimers Dement 14: , 178–186. |
[43] | Raffaitin C , Gin H , Empana JP , Helmer C , Berr C , Tzourio C , Portet F , Dartigues JF , Alperovitch A , Barberger-Gateau P ((2009) ) Metabolic syndrome and risk for incident Alzheimer’s disease or vascular dementia: The Three-City Study, Diabetes Care 32: , 169–174. |
[44] | Solfrizzi V , Scafato E , Capurso C , D’Introno A , Colacicco AM , Frisardi V , Vendemiale G , Baldereschi M , Crepaldi G , Di Carlo A , Galluzzo L , Gandin C , Inzitari D , Maggi S , Capurso A , Panza F , Italian Longitudinal Study on Ageing Working Group ((2010) ) Metabolic syndrome and the risk of vascular dementia: The Italian Longitudinal Study on Ageing, J Neurol Neurosurg Psychiatry 81: , 433–440. |
[45] | LoBue C , Wilmoth K , Cullum CM , Rossetti HC , Lacritz LH , Hynan LS , Hart J Jr. , Womack KB ((2016) ) Traumatic brain injury history is associated with earlier age of onset of frontotemporal dementia, J Neurol Neurosurg Psychiatry 87: , 817–820. |
[46] | Golimstok A , Campora N , Rojas JI , Fernandez MC , Elizondo C , Soriano E , Cristiano E ((2014) ) Cardiovascular risk factors and frontotemporal dementia: A case-control study, Transl Neurodegener 3: , 13. |
[47] | Katisko K , Solje E , Koivisto AM , Kruger J , Kinnunen T , Hartikainen P , Helisalmi S , Korhonen V , Herukka SK , Haapasalo A , Remes AM ((2018) ) Prevalence of immunological diseases in a Finnish frontotemporal lobar degeneration cohort with the C9orf72 repeat expansion carriers and non-carriers, J Neuroimmunol 321: , 29–35. |
[48] | Kalkonde YV , Jawaid A , Qureshi SU , Shirani P , Wheaton M , Pinto-Patarroyo GP , Schulz PE ((2012) ) Medical and environmental risk factors associated with frontotemporal dementia: A case-control study in a veteran population, Alzheimers Dement 8: , 204–210. |
[49] | Kung WM , Ho YJ , Yoshizawa H , Matsuo S , Wei CY ((2018) ) Behavioural and cognitive changes in Lewy body dementias, Behav Neurol 2018: , 2404191. |
[50] | Schelp AO , Mendes-Chiloff CL , Bazan R , Paduan VC , Pioltini AB ((2012) ) Metabolic syndrome and dementia associated with Parkinson’s disease: Impact of age and hypertension, Arq Neuropsiquiatr 70: , 114–118. |
[51] | Dou Y , Liu S , Li Y , Wu H , Chen H , Ji Y ((2022) ) Plasma cholesterol levels as potential nutritional biomarkers for Lewy body dementia, J Alzheimers Dis 86: , 779–786. |
[52] | Yasuno F , Tanimukai S , Sasaki M , Ikejima C , Yamashita F , Kodama C , Hidaka S , Mizukami K , Asada T ((2012) ) Effect of plasma lipids, hypertension and APOE genotype on cognitive decline, Neurobiol Aging 33: , 2633–2640. |
[53] | Svensson T , Sawada N , Mimura M , Nozaki S , Shikimoto R , Tsugane S ((2019) ) The association between midlife serum high-density lipoprotein and mild cognitive impairment and dementia after 19 years of follow-up, Transl Psychiatry 9: , 26. |


