
Extracellular Vesicle-Enriched miRNA-Biomarkers Show Improved Utility for Detecting Alzheimer’s Disease Dementia and Medial Temporal Atrophy
Abstract
Background:
Emerging diagnostic modalities suggest that miRNA profiles within extracellular vesicles (EVs) isolated from peripheral blood specimens may provide a non-invasive diagnostic alternative for dementia and neurodegenerative disorders. Given that EVs confer a protective environment against miRNA enzymatic degradation, the miRNAs enriched in the EV fraction of blood samples could serve as more stable and clinically relevant biomarkers compared to those obtained from serum.
Objective:
To compare miRNAs isolated from EVs versus serum in blood taken from Alzheimer’s disease (AD) dementia patients and control cohorts.
Methods:
We compared 25 AD patients to 34 individuals who exhibited no cognitive impairments (NCI). Subjects were Singapore residents with Chinese heritage. miRNAs purified from serum versus blood-derived EVs were analyzed for associations with AD dementia and medial temporal atrophy detected by magnetic resonance imaging.
Results:
Compared to serum-miRNAs, we identified almost twice as many EV-miRNAs associated with AD dementia, and they also correlated more significantly with medial temporal atrophy, a neuroimaging marker of AD-brain pathology. We further developed combination panels of serum-miRNAs and EV-miRNAs with improved performance in identifying AD dementia. Dominant in both panels was miRNA-1290.
Conclusions:
This data indicates that miRNA profiling from EVs offers diagnostic superiority. This underscores the role of EVs as vectors harboring prognostic biomarkers for neurodegenerative disorders and suggests their potential in yielding novel biomarkers for AD diagnosis.
INTRODUCTION
Due to shifts in population age distributions to older ages, dementias like Alzheimer’s disease (AD) are becoming major health issues. To date, only one drug has been approved, albeit controversially, as a disease-modifying treatment for AD [1]. One of the major challenges in dementia research is the ability to provide accurate diagnoses in premortem settings, especially before clinical symptoms are evident. Advances in positron emission tomography (PET) for amyloid and tau protein, magnetic resonance imaging (MRI) for hippocampal atrophy, and cerebrospinal fluid tests for phospho-tau and amyloid, have made in vivo detection of AD brain pathology possible [2–4], but the high costs and invasiveness of these procedures have limited their use in clinical settings. Consequently, biomarkers derived from blood, which offer the advantages of reduced invasiveness and lower costs, have garnered significant interest for their potential roles in understanding the pathogenesis, prognosis, and diagnosis of this disease [5].
MicroRNAs (miRNA), a class of non-coding RNA, have recently been recognized as a novel disease biomarker species due to their characteristics of tissue- and disease-specific expression [6]. Notably, miRNA incorporation into extracellular vesicles (EVs) increases miRNA stability, as the lipid bilayer of EV membranes protects the contents from degradation by nucleases and proteases [7]. Experimental studies have reported that EV-bound extracellular miRNAs are resistant to conditions of severe cellular stress, such as high temperatures, repeated freeze-thaw cycles [8], extreme pH levels [9], boiling and extended storage time [10–12]. The high stability of miRNAs within the EVs means that they have long half-lives in biological fluids [13]. As such, they are attractive as potential diagnostic [14] and prognostic biomarkers [8].
Numerous studies investigating blood expression levels of EV-derived miRNAs in AD patients have been performed in the past decade. Notably, associations of AD with hsa-miR-93-5p, hsa-miR-23a-3p, hsa-miR-3065-5p, hsa-miR-424-5p, hsa-miR-1306-5p, hsa-miR-15b-3p, hsa-miR-342-3p, and hsa-miR-193b have been replicated in independent cohorts [15–24]. Besides being promising in identifying AD, several EV-derived miRNAs have also displayed putative associations with cognitive and functional outcomes [15, 23]. Interestingly, one study reported a significant correlation between EV-derived miR193b and the 42-amino acid beta-amyloid (Aβ42) in cerebrospinal fluid, thus linking EV-derived miRNAs and AD pathology [19].
It remains unknown if EV-derived miRNAs provide diagnostic advantages over serum-miRNAs. We therefore compared EV versus serum miRNAs of AD patients.
MATERIALS AND METHODS
Study cohort
Subjects for this study were selected from a previously described longitudinal case-control study performed on a memory clinic cohort in Singapore, recruited between August 2010 and March 2014. Briefly, all subjects underwent neuroimaging and physical, clinical, and neuropsychological tests at the National University of Singapore. A comprehensive neuropsychological battery of tests was performed to assess seven cognitive domains: Executive Function, Attention, Language, Visuomotor Speed, Visuoconstruction, Verbal Memory, and Visual Memory (see Supplementary Table 1 for details on the component tests for each domain). Diagnoses were made at weekly consensus meetings attended by neuropsychologists and clinicians, at which psychometrics, clinical features, and neuroimaging were evaluated.
AD dementia cases included in this study were recruited from memory clinics from National University Hospital and St Luke’s Hospital in Singapore, and diagnosed using the National Institute of Neurological and Communicative Disorders and Stroke and the Alzheimer’s disease and Related Disorders Association (NINCDS-ADRDA) clinical criteria [25]. Subjects diagnosed with non-AD etiologies defined by the National Institute of Neurological Disorders and Stroke and Association Internationale pour la Recherche' et l’ Enseignement en Neurosciences (NINDS-AIREN) criteria, such as vascular dementia, were excluded from this study to rule out the possible confounding effects. Concurrently, controls were recruited from both the community and memory clinics and were defined as those who were cognitively normal on an objective neuropsychological assessment—also labelled as having no cognitive impairment (NCI) and being functionally independent. Ethics approval for the current study was obtained from the National Healthcare Group Domain-Specific Review Board (DSRB reference: 2010/00017; study protocol number: DEM4233). Informed consent was obtained from all participants before study recruitment and assessment procedures. The study was conducted in accordance with the Declaration of Helsinki.
Neuroimaging assessment for brain atrophy
MRI scans were performed on a 3-Tesla Siemens Magnetom Trio Tim scanner, using a 32-channel head coil, at the Clinical Imaging Research Centre of the National University of Singapore. Subjects with claustrophobia, contraindications for MRI, or those who were unable to tolerate the procedure were excluded. All MRIs were graded by one radiologist and two clinicians blinded to the neuropsychological and clinical data. Brain atrophy was assessed on the MRI scans, with medial temporal lobe atrophy defined by the widening of the choroid fissure, the widening of temporal horn, and the loss of hippocampal height as seen on coronal sections. The severity of medial temporal atrophy was graded using the 5-point Scheltens’ scale (0 – normal, 1 – mild, 2 – mild-moderate, 3 – moderate, 4 – severe) [26]. We used a dichotomized scale in all our analyses, with a score of≥2 defined as significant medial temporal atrophy and a score of < 2 considered to be non-significant, as previously described [27, 28].
Assessments of other risk factors
Risk factors such as hypertension, hyperlipidemia, diabetes, and cardiovascular diseases were ascertained from both clinical interviews and medical records and were classified as present or absent. Hypertension was defined as systolic blood pressure≥140 mmHg and/or diastolic blood pressure≥90 mmHg, or use of antihypertensive medications. Diabetes was defined as glycated hemoglobin≥6.5% or on corresponding medications. Hyperlipidemia was defined as total cholesterol levels≥4.14 mM or on corresponding medications. Cardiovascular disease was classified as a previous history of atrial fibrillation, congestive heart failure, and myocardial infarction. Education status was categorized as low (not exceeding primary school education) or high (beyond primary school education). Apolipoprotein E (APOE) genotyping was performed as described previously [29], and APOE ɛ4 carrier status was defined as having at least one ɛ4 allele.
Blood sample preparation
Blood samples collected in ethylenediaminetetraacetic acid (EDTA) and serum-separating tubes (SST) were centrifuged at 2000 g for 10 min at 4°C. The upper layer of plasma (from EDTA tubes) and serum (from SST) were transferred to a new tube, mixed, aliquoted, and stored at –80°C until future use. All samples were subjected to only one freeze-and-thaw cycle.
EV isolation and characterization
We followed the Minimal Information for Studies of Extracellular Vesicles (MISEV) guidelines of the International Society for Extracellular Vesicles (ISEV) [30] for the isolation, quantification, and characterization of EVs. EVs were isolated from EDTA plasma with 70 nm qEVsingle columns (IZON Science, Christchurch, New Zealand). 200μl EDTA plasma followed by 0. 2μm-filtered 1x Tris-buffered saline were loaded onto the column. 16 fractions of 250μl were collected. Fractions 4–8 were combined in a 100k Amicon filter and concentrated to 200μl by centrifugation (4000 g, 15 min, 4°C). Isolated EVs were stored at –80°C until RNA extraction.
EV quantification and size characterization were performed via nanoparticle trafficking analysis (NTA, Nanosight). RNA and protein concentrations were measured using Nanodrop. To demonstrate the EV identity of our isolated particles, we utilized western blot analysis (30μg/lane) of the classical EV markers: mouse anti-Alix (1 : 200, sc-53538, Santa Cruz), mouse anti-Hsp70 (1 : 1000, sc-32239, Santa Cruz), rabbit anti-CD81 (1 : 1000, ExoAB-CD81A-1, Systems Biosciences), rabbit anti-CD9 (1 : 1000, ExoAB-CD9A-1, Systems Biosciences), rabbit anti-GM130 (1 : 1000, ab52649, Abcam), and goat anti-albumin (1 : 1000, NB600-41532, Novus Biologicals). Collected and combined fractions used for EV analysis (F4-F8) contained most of the particles detected by NTA, the bulk of the RNA molecules, and little protein contamination. In accordance with the MISEV guidelines, detailed characterizations of the extracted EVs were performed as shown in Supplementary Figures 1 and 2. We detected classical EV markers in all fractions analyzed with little albumin and Golgi matrix protein (GM130) contamination (Supplementary Figure 1), indicating successful EV separation.
Isolation, augmentation, and quantification of miRNAs
In the present study, “serum-miRNAs” refer to the miRNAs isolated from serum samples, while “EV-miRNAs” refer to the miRNAs isolated from plasma-derived EVs. All reagents and assay kits used for RNA isolation, augmentation, and quantification were from MiRXES, Singapore, unless otherwise stated.
Total RNAs were extracted from patient-derived serum and patient-derived EVs (200μl each). The miRNeasy Serum/Plasma kit (Qiagen; Hilden, Germany) on a semi-automated QiaCube system was used for the serum, while the Maxwell RSC miRNA Tissue Kit and the Maxwell RSC System (Promega Corp., Wisconsin, USA) were used for the isolated EVs. A combination of synthetic control RNAs with sequences distinct from annotated mature human miRNAs (miRBase versions 21 and 22) and inter-plate calibrators were included in the assay panels to monitor and normalize workflow efficiency.
Isolated total RNA was reverse transcribed on the ID3EAL cDNA Synthesis System using conformational restricted miRNA-specific reverse transcription (RT) primers that were selected based on experimental analysis of more than 1000 high confidence human miRNAs from several hundred serum and plasma specimens. The reaction mixture was incubated at 42°C for 30 min, followed by 90°C for 5 min, to inactivate the reverse transcriptase on a Veriti™ Thermal Cycler (Applied Biosystems; California, United States). cDNAs were further augmented using the MiRXES ID3EAL miRNA Augmentation System.
For serum-miRNA quantifications, qPCR amplification and detection were performed on ViiA7 qPCR system (Applied Biosystems; California, USA) with the following cycling conditions: 95°C for 10 min, followed by 40 cycles of 95°C for 10 s and 60°C for 30 s. In contrast, qPCR amplification and detection were performed on the QuantStudio5-384-well qPCR system (Applied Biosystems, California, USA) for the quantification of EV-miRNAs. Raw Ct values were calculated using the ViiA 7 RUO software and the QuantStudio Design and Analysis software, respectively, with an automatic baseline setting and a threshold of 0.5. Technical variations introduced during RNA isolation and the process of RT-qPCR were normalized using the spike-in control RNAs and inter-plate calibrators. The gene expression levels of each serum and EV-miRNAs were expressed in arbitrary units by subtracting raw Ct numbers from 40.
Statistical analysis of demographic data
Our statistical analysis of demographic information (Table 1) was performed using SPSS software (version 21, IBM Inc.; New York, USA). Kolmogorov-Smirnov tests were used to test for normality. The t-test was used for two-group comparisons of means of variables that could be assumed to be approximately normally distributed. For comparisons of mean ranks of distributions not assumed to be normal (Mini-Mental State Exam, MMSE score), the Mann-Whitney U Test was used. Finally, to test for differences in proportions of categorical variables, the Chi-square test was used. p value < 0.05 was considered statistically significant for all analyses.
Table 1
Baseline demographics of cases and controls (n = 59)
| NCI (n = 34) | AD (n = 25) | p | |
| Age, y, mean (SD) | 69.9 (5.2) | 73.5 (5.8) | 0.015a |
| Female, n (%) | 20 (58.8) | 16 (64.0) | 0.687b |
| Education, year, mean (SD) | 10.1 (4.7) | 4.8 (5.1) | <0.001a |
| APOE ɛ4 carrier, n (%) | 8 (23.5) | 12 (48.0) | 0.05b |
| Hypertension, n (%) | 15 (44.1) | 19 (76.0) | 0.014b |
| Diabetes, n (%) | 7 (20.6) | 12 (48.0) | 0.026b |
| Hyperlipidemia, n (%) | 16 (47.1) | 17 (68.0) | 0.109b |
| Cardiovascular disease, n (%) | 1 (2.9) | 2 (8.0) | 0.382b |
| MMSE, mean (SD) | 27.7 (2.1) | 18.1 (4.3) | <0.001c |
Pairwise comparison was performed using atwo-tailed t-test, bPearson’s Chi-square test, or cMann-Whitney U test. Bold values indicate p < 0.05. NCI, non-cognitive impairment; AD, Alzheimer’s disease; SD, standard deviation; n, number; APOE ɛ4, apolipoprotein E ɛ4 allele.
Statistical analysis of miRNA data
Our statistical analysis for miRNA data was performed as follows. To identify potential miRNA biomarkers, two-tailed t-tests were performed to compare each serum and EV-miRNA gene expression levels (i.e., 40 minus Ct number) between AD and control groups. Mean difference (i.e., average Ct in AD group minus average Ct in control group) and significance (i.e., -Log10 of p-value obtained from corresponding t-test) of each miRNA expression level between AD and control groups were expressed in volcano plots. miRNAs with p < 0.05 were selected for further investigation. Logistic regression was used to form odds ratios (OR) and 95% confidence intervals (CI) of each miRNA included in the model; the model’s output is AD (1) versus control (0). Univariate models without a covariate were assessed. To identify a combination of miRNAs associated with AD, miRNAs that were found to be significantly associated with AD at the univariate level were included in a forward stepwise multiple logistic regression analysis; if adding each new variable to the model lowered the model’s Akaike information criterion (AIC) value, a likelihood ratio significance level of 0.10 was used to determine if any variables should be removed from the model. Unless stated otherwise, calculations were performed using R statistical software (version 3.6.3, The R Foundation).
Receiver operating characteristic (ROC) curve analyses of our fitted logistic regression model were performed using the R package pROC. ROC area under curves (AUC) and their 95% CIs were computed using DeLong’s method [32]. Sensitivity and specificity were calculated via Youden index thresholds using bootstrap procedures with 2,000 iterations [33].
In the final miRNA model, age, education, APOE4, hypertension, and diabetes were added as covariates, as these variables were not matched between groups (see Table 1). The same statistical approach (adjusted for age, gender, education, and APOE4, but not hypertension or diabetes) was then used to form a model of the occurrence of medial temporal brain atrophy.
miRNA-target enrichment and Gene Ontology (GO) analysis
To predict the potential biological relevance of the miRNAs that are part of the combination panels identified using stepwise multiple regression models shown in Fig. 3, we first confirmed their expression in human brain tissue utilizing a human miRNA tissue atlas published by Ludwig and colleagues in 2016 [34]. We then performed miRNA-target enrichment analyses of each combination panel via miRTarBase 9.0, utilizing only experimentally validated targets [35]. We then performed Gene Ontology analysis [36, 37] of the identified targets via the web-based tool Enrichr [38–40]. The top ten significantly enriched GO annotations with p-value<0.05 were exported from Enrichr and plotted in Prism Graphpad. False Discovery Rates (FDR) were calculated at 5% and 10%.
RESULTS
Baseline demographics of study cohort
Of 59 subjects in our study, 34 (57.6%) had NCI and 25 (42.43%) had AD dementia. AD patients were, on average, three years older, had less education, higher APOE ɛ4 carrier prevalence, and more hypertension and diabetes. As expected, compared to NCI, AD patients also scored significantly lower in MMSE (Table 1).
EV-miRNAs show stronger associations with AD than serum-miRNAs
Of 291 serum-miRNAs detected, 25 were significantly altered in AD versus NCI patients (p < 0.05, two-tailed t-test; Fig. 1B, red dots). Univariate logistic regression analyses demonstrated that 20 serum-miRNAs were significantly associated with AD (p < 0.05, univariate logistic regression; Fig. 2A, blue bars). After complete covariate adjustment using multiple regression analyses, none were of statistical significance (p > 0.05, multiple logistic regression; Fig. 2A).
Fig. 1
Profiling of serum-miRNAs and EV-miRNAs in AD. (A) Summary of study design and main results. Volcano plots showing the differential expression of (B) serum-miRNAs and (C) EV-miRNAs in AD patients versus NCI controls. The x-axis shows the mean difference of each miRNA expression level between AD patients and NCI controls and the y-axis shows -log10 of p-values obtained from corresponding t-tests. Each dot represents miRNAs detectable in the EV (n = 352) and serum (n = 291) sample pools. Red dots indicate a significant mean difference of n = 25 serum-miRNAs and n = 41 EV-miRNAs in AD compared to NCI controls (p < 0.05, two-tailed t-tests).
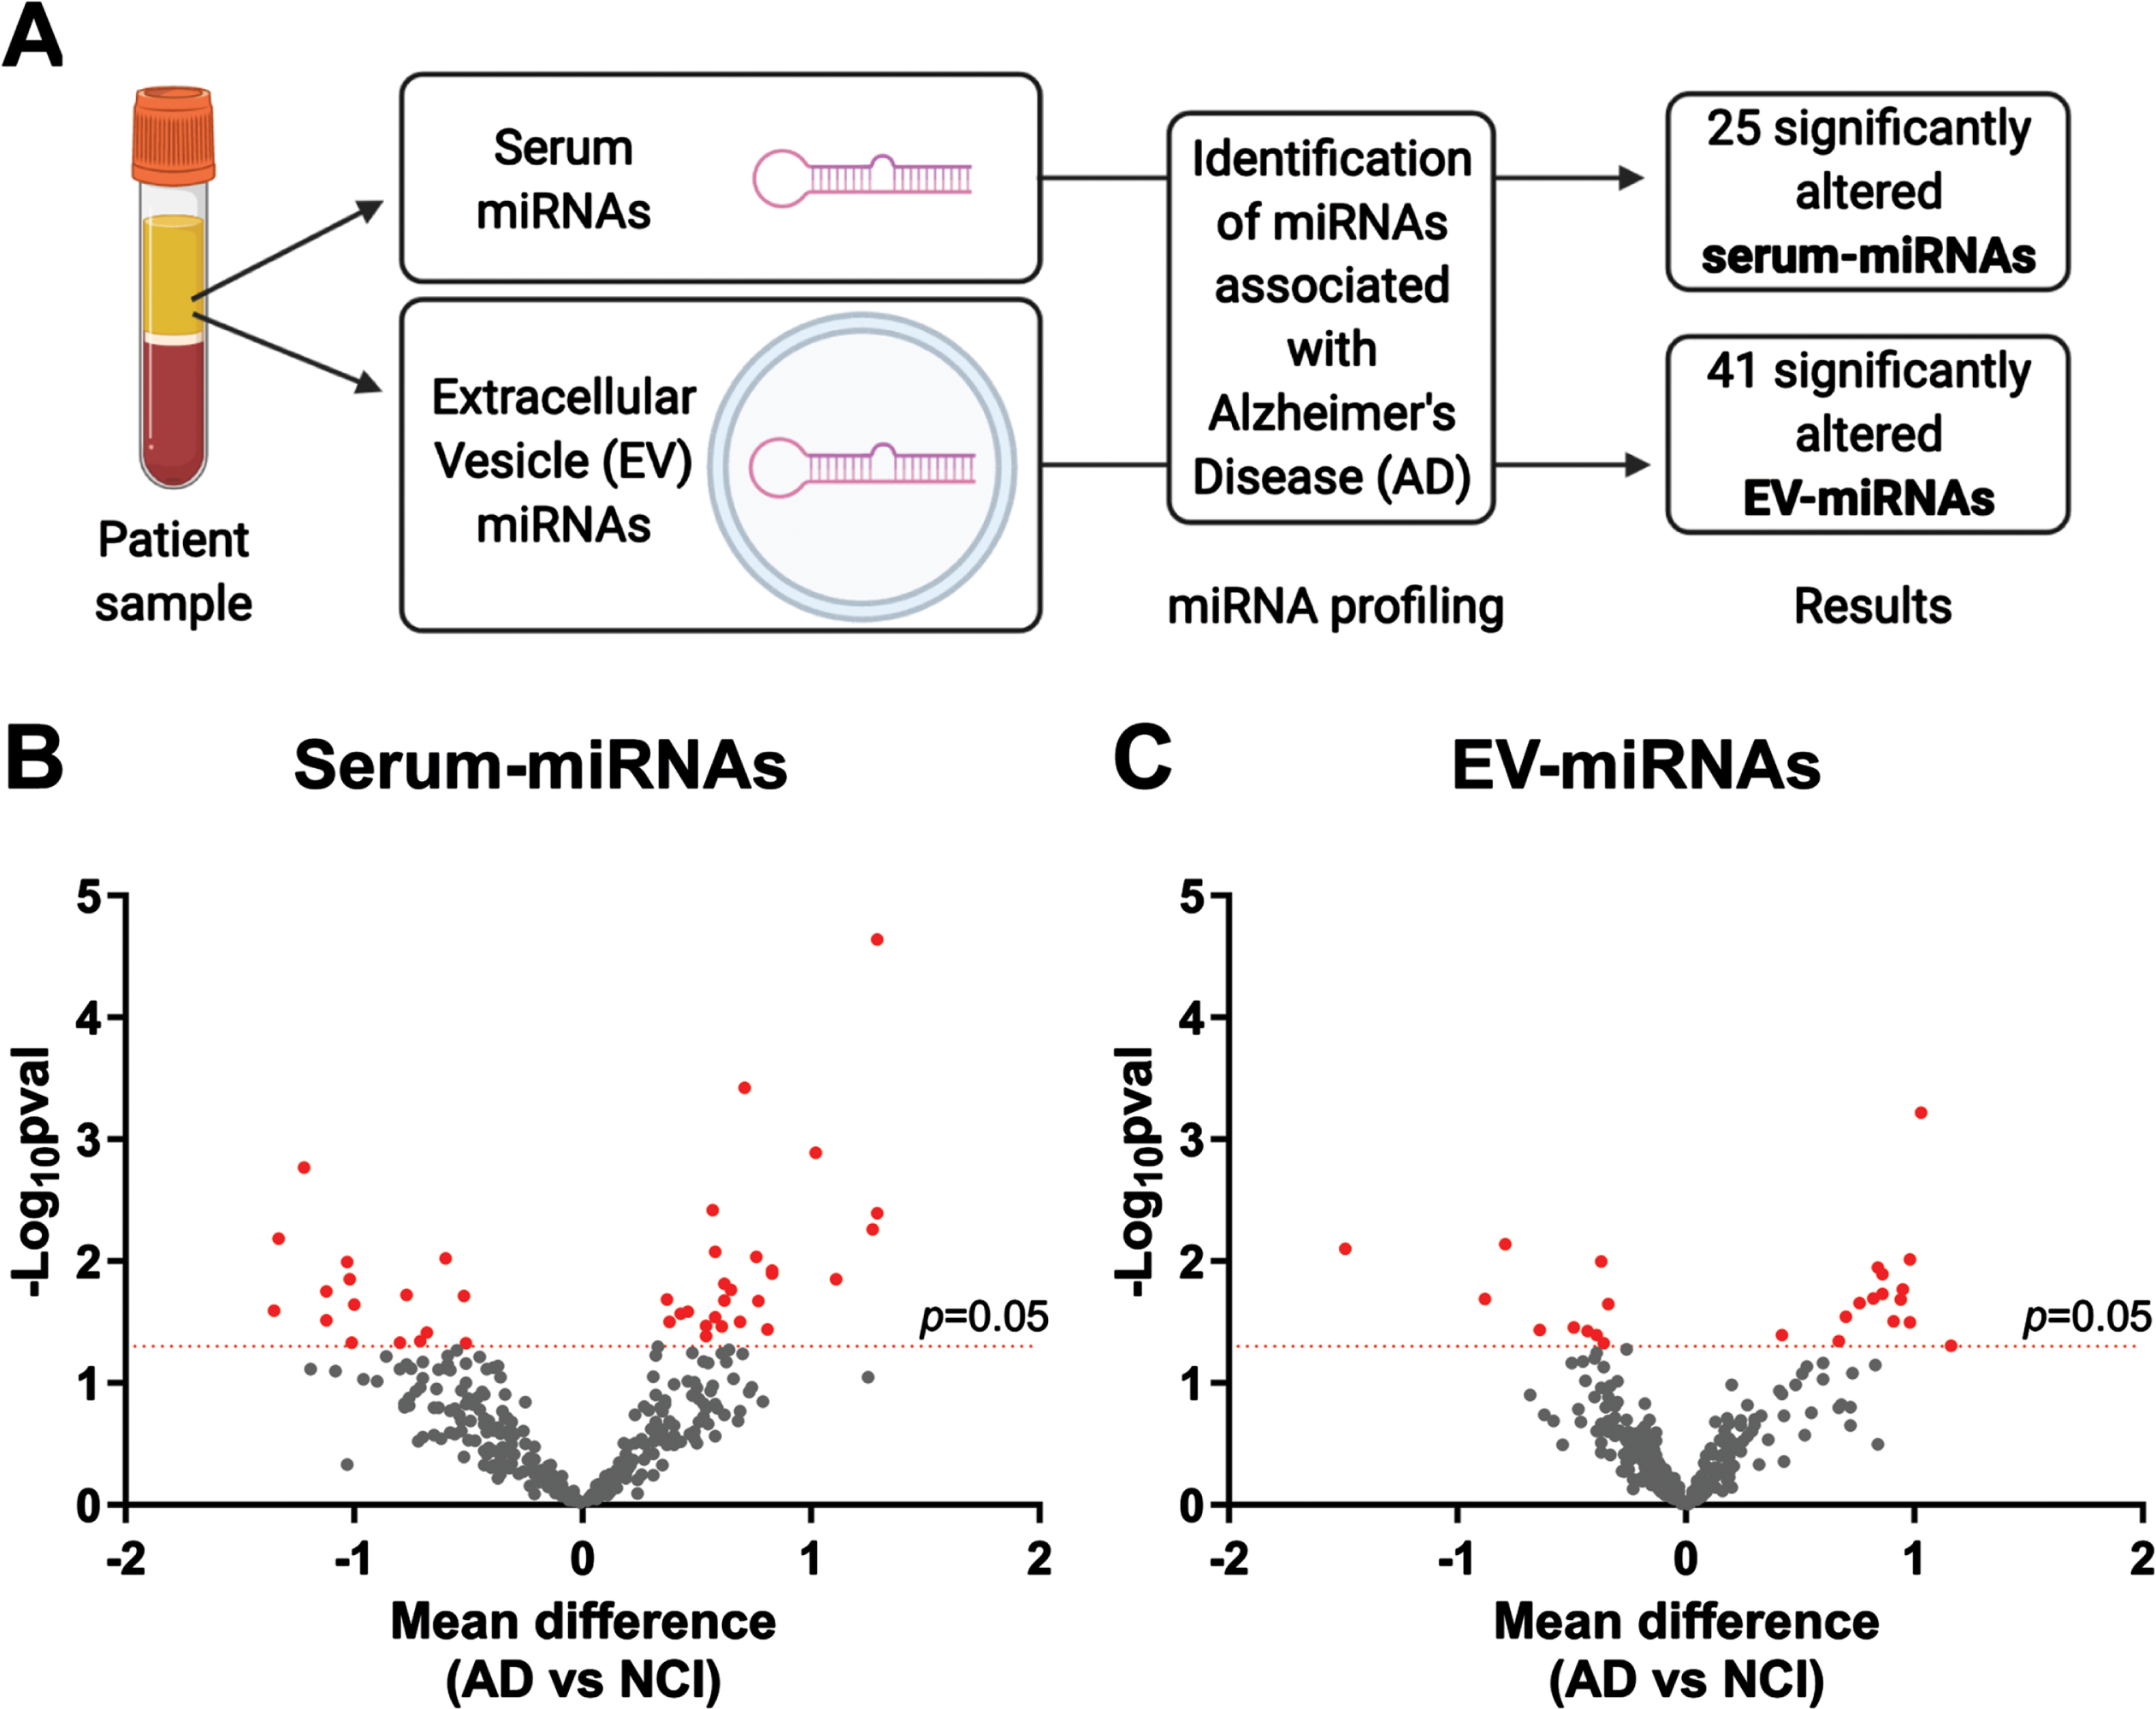
Fig. 2
Associations of serum-miRNAs and EV-miRNAs with AD. Forest plots showing univariate logistic regression analyses of (A) 25 serum-miRNAs and (B) 41 EV-miRNAs that were significantly altered in AD. Shown are odds ratio (OR) associations between miRNAs and AD and their 95% confidence intervals (CIs). Red lines indicate significant association before covariate adjustment (p < 0.05, univariate binary logistic regression), while asterisks indicate significant association after covariate adjustment for age, education and APOE ɛ4, hypertension, and diabetes (p < 0.05, multiple binary logistic regression).
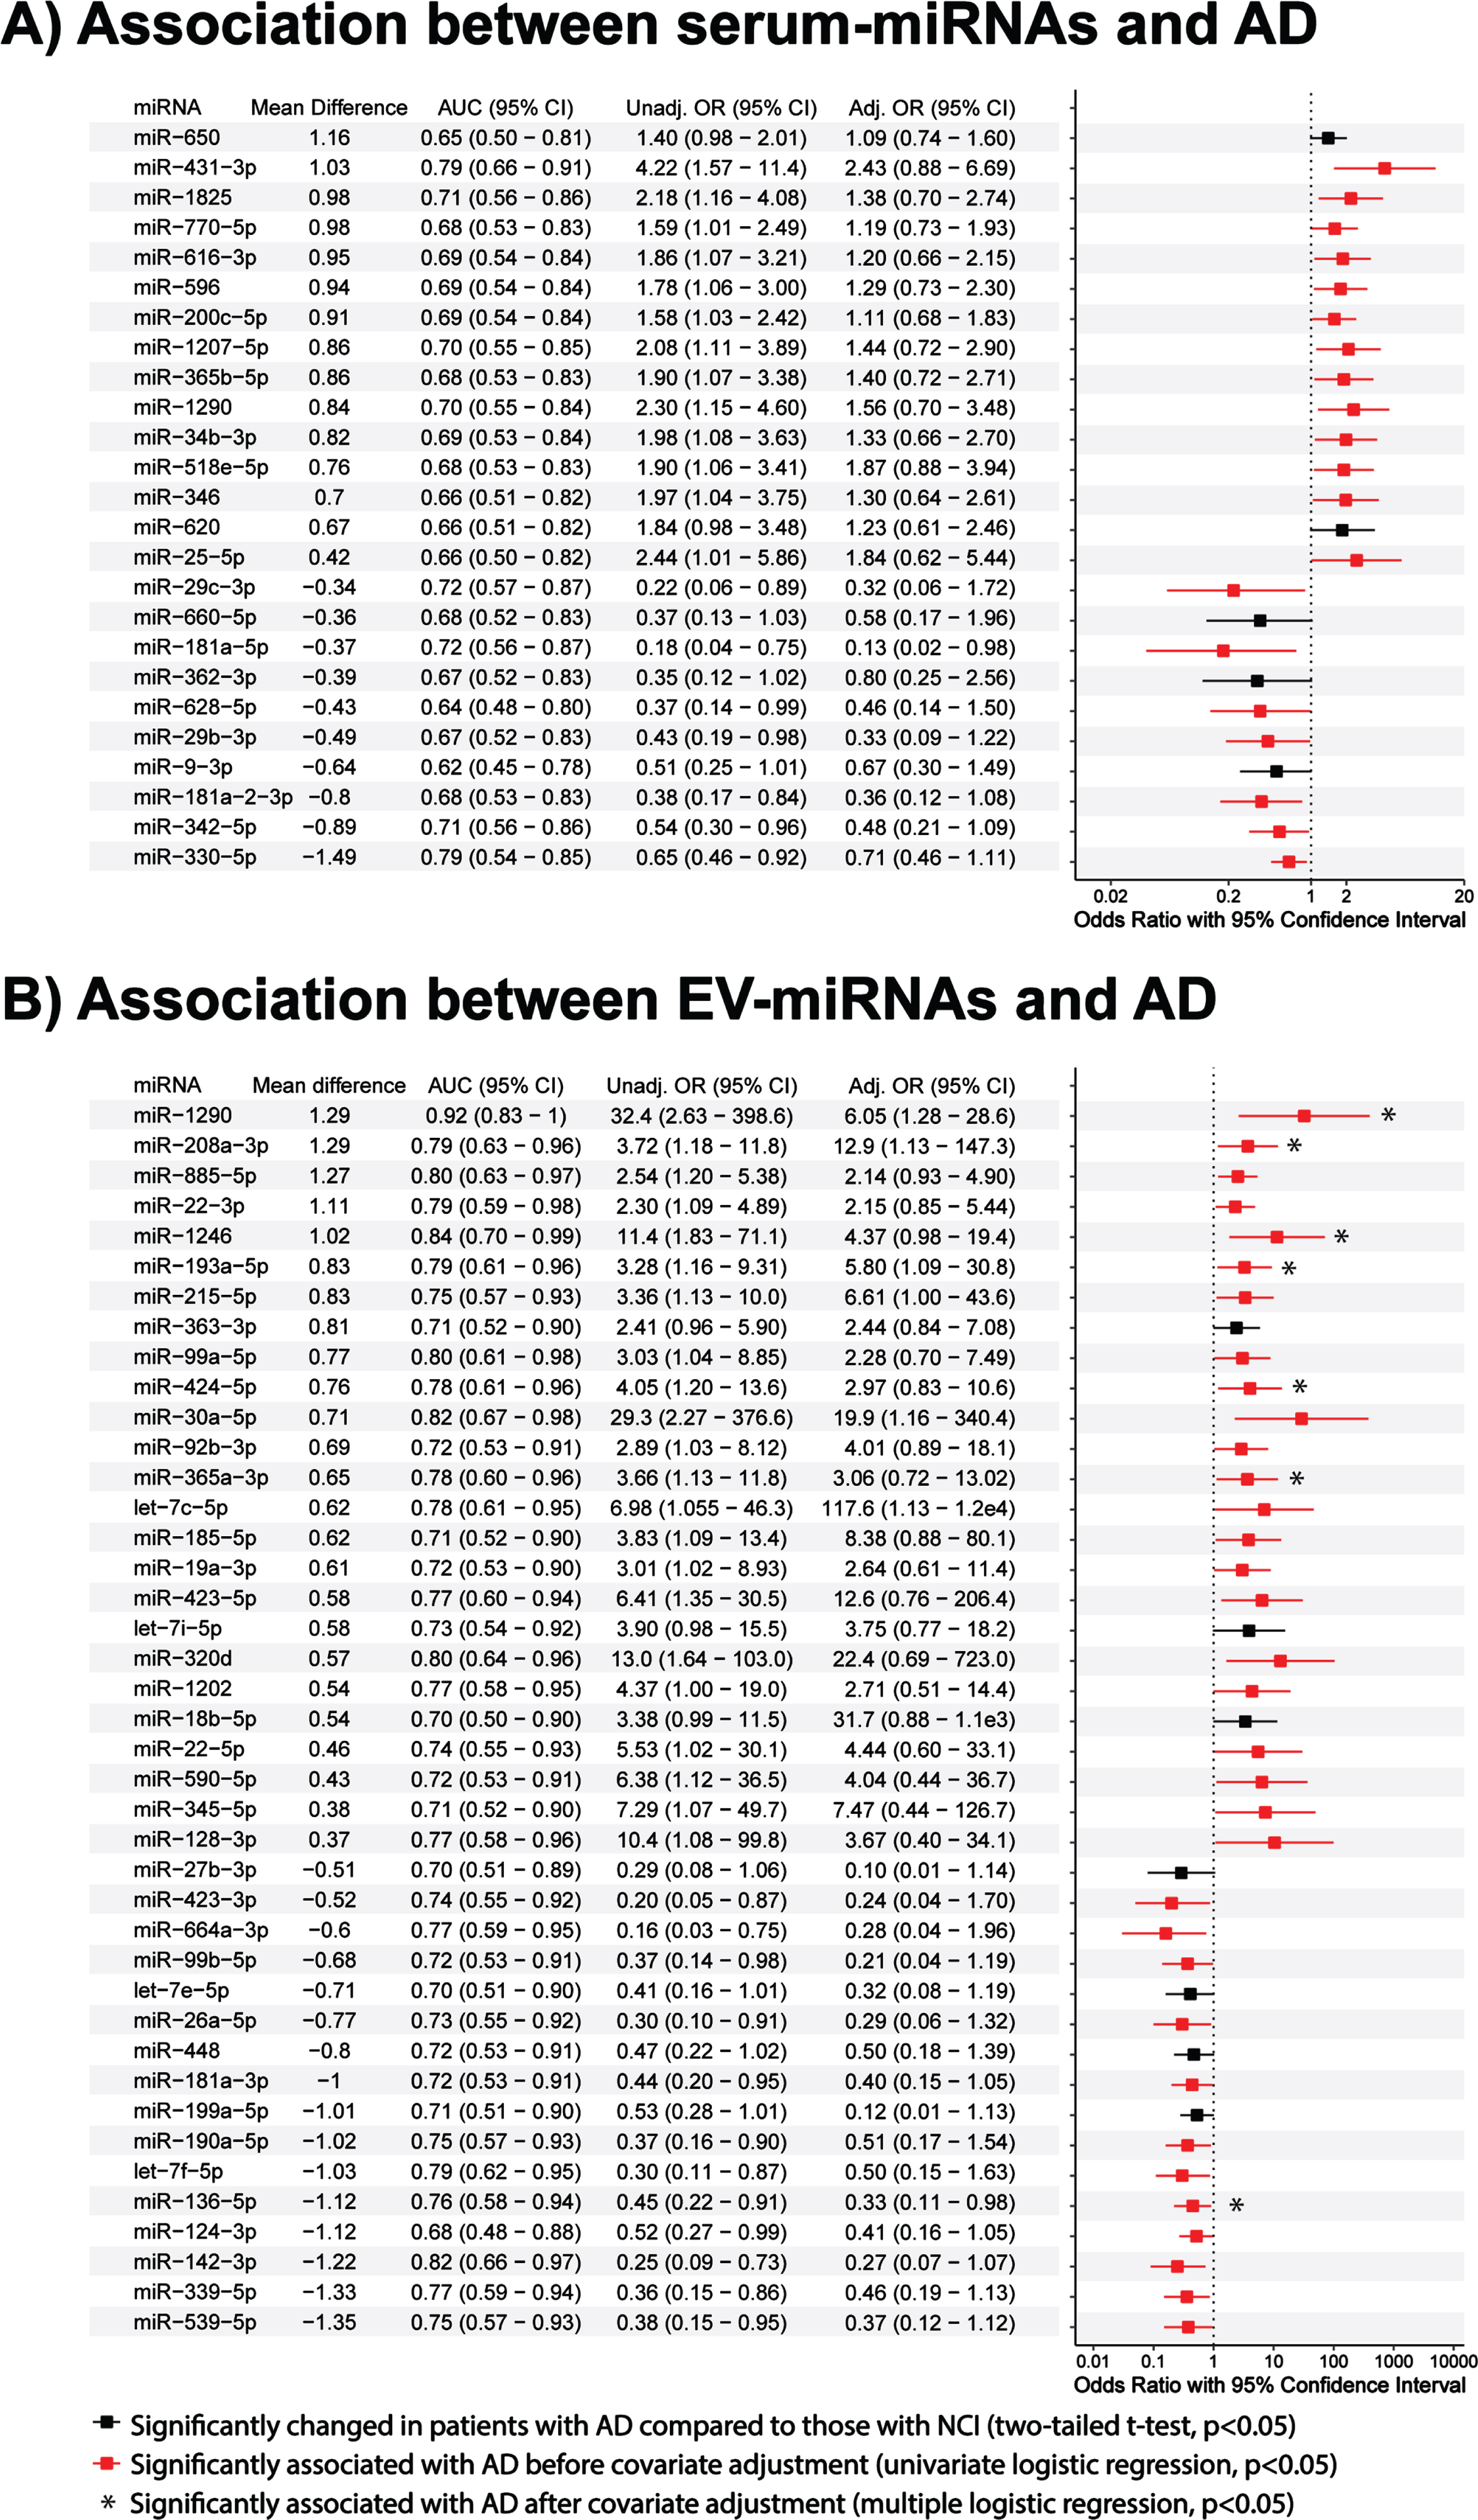
Of 322 EV-miRNAs detected, 41 were significantly altered in the AD versus NCI patients (p < 0.05, two-tailed t-test; Fig. 1C, red dots). Using univariate logistic regression analyses we identified 34 EV-miRNAs associated with AD (p < 0.05, univariate logistic regression; Fig. 2B, red bars), of which seven miRNAs retained statistical significance after complete covariate adjustment (p < 0.05, multiple logistic regression; Fig. 2B, asterisks).
EV-miRNAs outcompete serum-miRNAs utilizing miRNA combination panels
Four serum-miRNAs were identified to be significantly associated with AD in the stepwise multiple regression model, namely hsa-miR-431-3p [Odds Ratio (OR) = 18.4; 95% Confidence Interval (CI)], hsa-miR-1290 (OR = 39.8; 95% CI = 2.6 to 603.4), hsa-miR-330-5p (OR = 0.13; 95% CI = 0.03 to 0.58) and hsa-miR-181a-2-3p (OR = 0.02; 95% CI = 0.0004 to 0.8) (Table 2). The combination panel had better model fitting with a lower AIC value of 30.0 compared to that of the individual miRNAs (individual AIC = 57.8, 64.4, 64.6 and 63.8, respectively; p < 0.05, likelihood ratio test). ROC AUCs (Fig. 3A) were 0.79, 0.70, 0.70 and 0.68 for individual miRNAs and 0.97 for all miRNAs combined. Comparing AD to NCI, hsa-miR-431-3p and hsa-miR-1290 were upregulated and hsa-miR-181a-2-3p and hsa-miR-330-5p were downregulated (Fig. 3C).
Table 2
Diagnostic performance of the individual and combined miRNAs panels identified by stepwise regression models in distinguishing AD from NCI (n = 59)
| Sample | Panel | miRNA | OR (95% CI) | AIC | ROC analysis | ||
| AUC (95% CI) | Sensitivity % (95% CI) | Specificity % (95% CI) | |||||
| Serum | Individuala | miR-431-3p | 4.22 (1.57–11.38) | 57.8 | 0.79 (0.66–0.91) | 75.0 (45.8–100) | 84.0 (40.0–100) |
| miR-1290 | 2.30 (1.15–4.60) | 64.4 | 0.70 (0.55–0.84) | 70.8 (29.2–100) | 72.0 (28.0–100) | ||
| miR-330-5p | 0.65 (0.46–0.92) | 64.6 | 0.70 (0.54–0.85) | 95.8 (50.0–100) | 52.0 (32.0–88.0) | ||
| miR-181a-2-3p | 0.38 (0.17–0.84) | 63.8 | 0.68 (0.53–0.83) | 45.8 (25.0–100) | 100 (32.0–100) | ||
| Combinedb | miR-431-3p | 18.4 (1.24–275.0) | 30.0 | 0.97 (0.94–100) | 100 (91.6–100) | 92.0 (76.0–100) | |
| miR-1290 | 39.8 (2.6–603.4) | ||||||
| miR-330-5p | 0.13 (0.03–0.58) | ||||||
| miR-181a-2-3p | 0.02 (0.0004–0.8) | ||||||
| EV | Individuala | miR-1290 | 32.4 (2.63–398.5) | 24.8 | 0.92 (0.83–100) | 92.9 (64.3–100) | 93.8 (62.5–100) |
| miR-128-3p | 10.4 (1.08–99.8) | 39.8 | 0.77 (0.58–0.96) | 100 (85.7–100) | 68.8 (43.8–87.5) | ||
| Combinedb | miR-1290 | 1.17e4 (0.89–1.54e8) | 14.0 | 0.98 (0.94–100) | 92.9 (78.6–100) | 100 (87.5–100) | |
| miR-128-3p | 1.77e4 (1.34–2.34e6) | ||||||
Associations analyses were performed using aunivariate or bstepwise multiple logistic regression models. Bold values indicate p < 0.05 using the respective binary logistic regression models. NCI, non-cognitive impairment; AD, Alzheimer’s disease; EV, extracellular vesicle; OR, odds ratio; CI, confidence interval; AIC, Akaike’s information criterion; ROC, receiver operating characteristic; AUC, area under curve.
Fig. 3
Expression levels and AD classification potentials of serum- and EV-miRNAs. ROC analyses of AD versus NCI classification performance of logistic regression models obtained using (A) serum-miRNAs and (B) EV-miRNAs identified by stepwise regression. Performance improved when more than one miRNA was used, both for serum and EV miRNAs (*p < 0.05, likelihood ratio tests). Boxplots show 40 – Ct expression levels of (C) serum and (D) EV miRNAs in AD patients versus NCI controls.
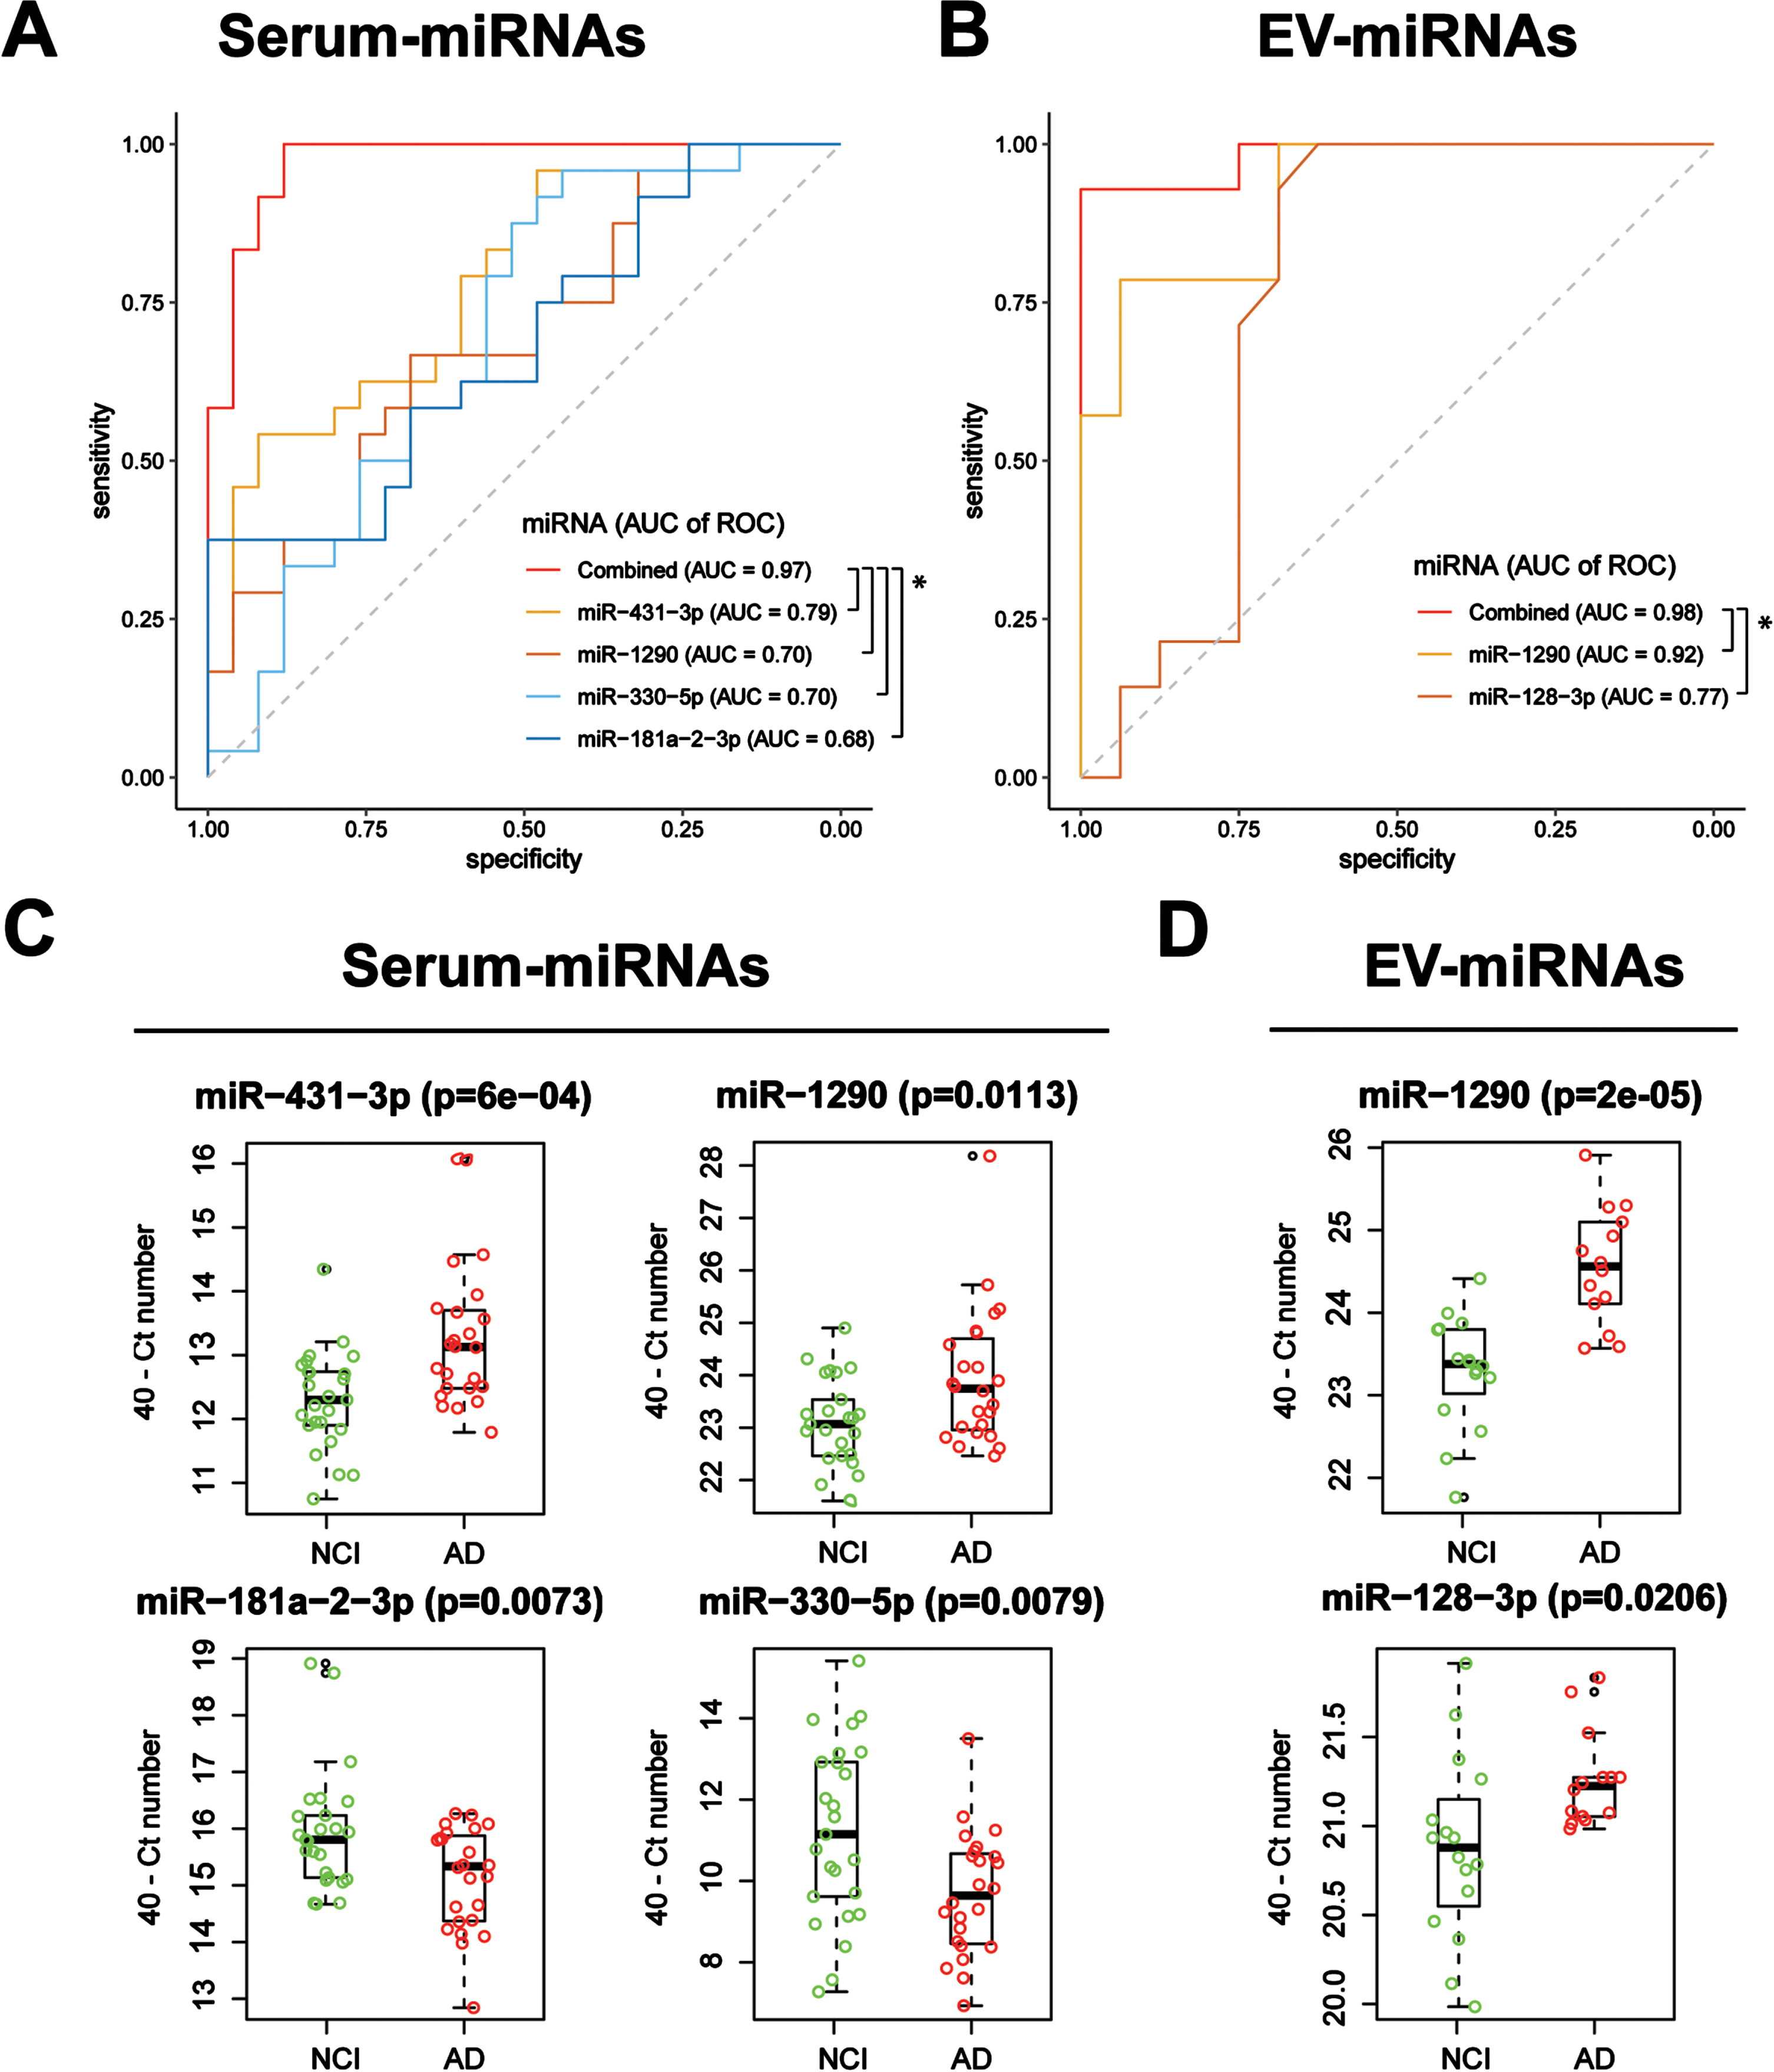
Two EV-miRNAs were significantly associated with AD in the stepwise multiple regression model: hsa-miR-1290 (OR = 1.17e4; 95% CI = 0.89 to 1.54e8) and hsa-miR-128-3p (OR = 1.77e4; 95% CI = 1.34 to 2.34e6) (Table 2). The combination panel had better model fitting with a lower AIC value of 14.0 compared to those of the individual miRNAs (individual AIC = 24.8 and 39.8, respectively; p < 0.05, likelihood ratio test). While the ROC of hsa-miR-1290 alone achieved an AUC of 0.92, the addition of hsa-miR-128-3p (individual AUC = 0.77) raised it to 0.98 (p < 0.05, likelihood ratio test; Fig. 3B). Both EV-miRNAs showed significant increases in expression in AD compared to that of the control (two-tailed t-tests;Fig. 3D).
Tissue source and gene enrichment analysis of miRNA combination panels
According to a human miRNA tissue atlas, the serum-miRNAs (hsa-miR-431-3p, hsa-miR-1290, and hsa-miR-181a-2-3p) and the EV-miRNAs (hsa-miR-1290 and hsa-miR-128-3p) are widely expressed in various human tissues, including the brain. The cellular origin of hsa-miR-330-5p was not examined due to a lack of data in the repository; however, its -3p counterpart was reported to be highly expressed in brain tissues [34].
GO enrichment analysis performed on experimentally validated targets of the four serum-miRNAs and the two EV-miRNAs: the former yielded cytoskeleton regulation involvement (FDR < 0.05; Supplementary Figure 3) and the latter yielded involvement in the regulation of membrane bound organelles, the nucleus, early endosomes (FDR < 0.05), dendrites (FDR < 0.1), and possibly other biological processes (Supplementary Figure 3) with potential relevance to hypoxic conditions, potentially implicating roles of these two miRNA in neuronal degeneration.
Associations of miRNA biomarkers with medial temporal atrophy
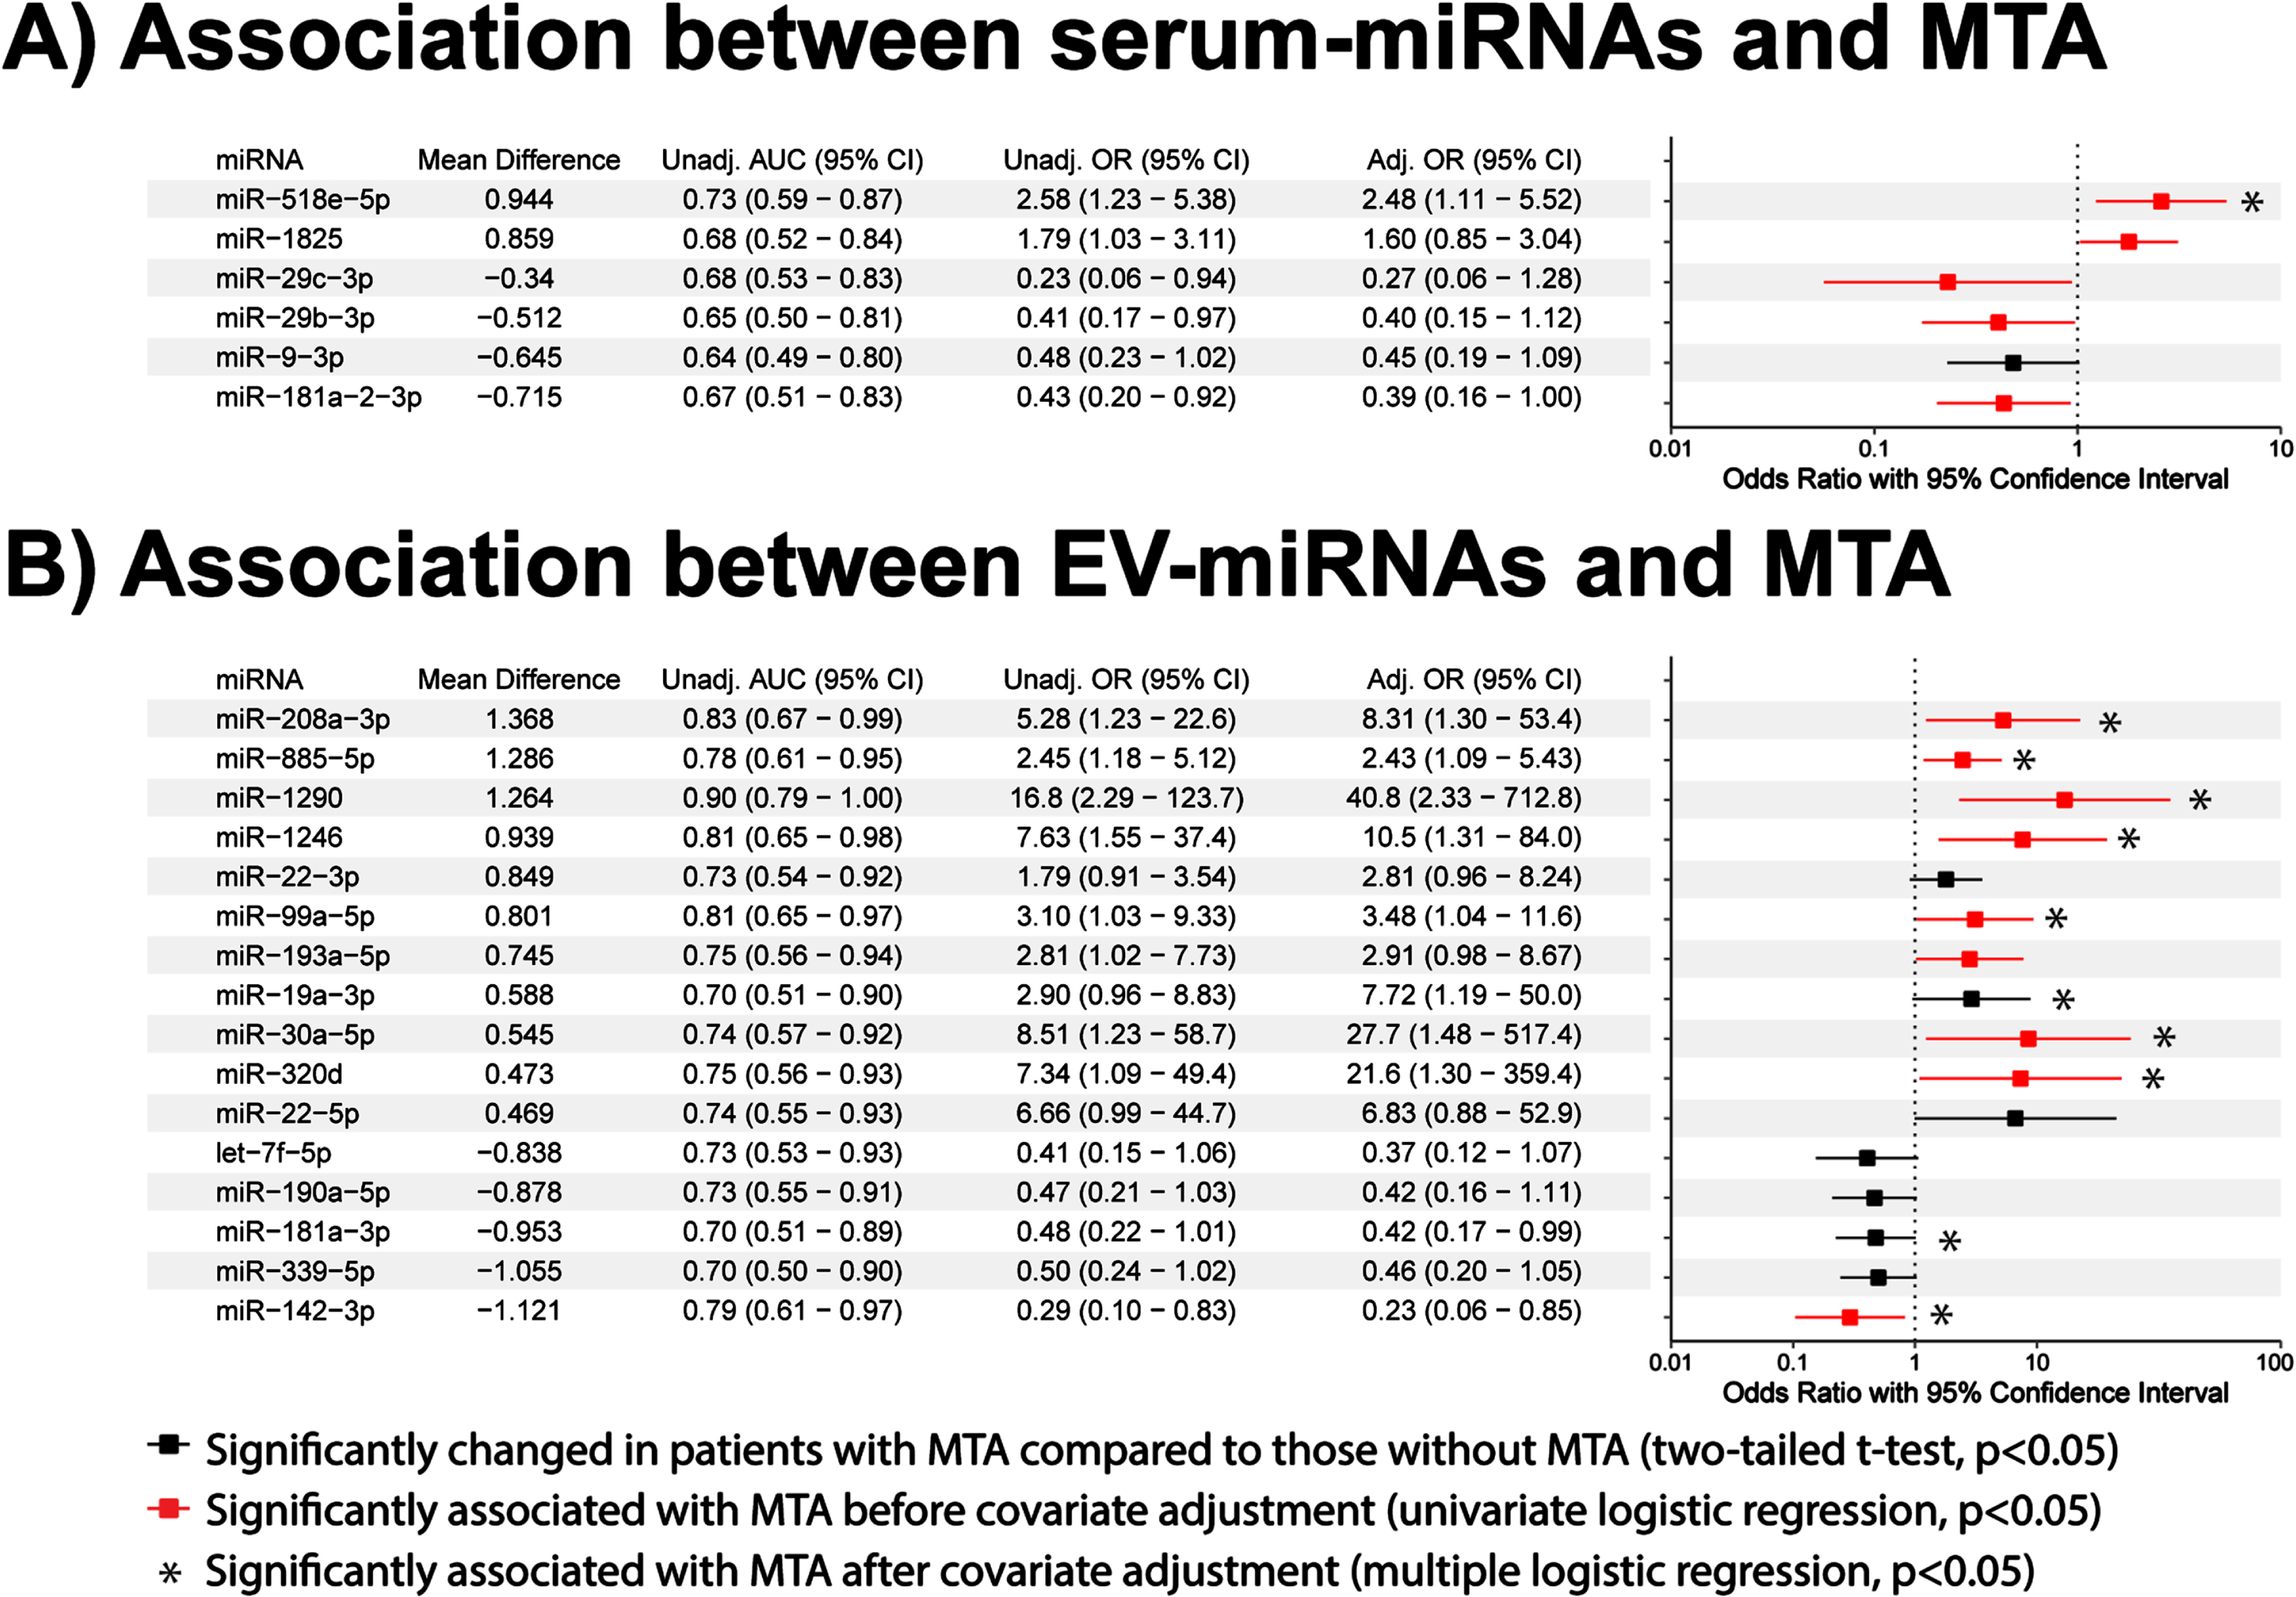
Biomarkers that can not only diagnose AD but also provide information on neuropathological characteristics of the AD brain have increased potential for clinical use [15, 19, 23]. Given that medial temporal atrophy is a common feature of AD, we investigated the associations between the significantly altered miRNAs (Fig. 2) and the presence of medial temporal atrophy. We identified six serum-miRNAs that were significantly altered (p < 0.05, two-tailed t-tests; Fig. 4A) and almost three times as many EV-miRNAs (n = 16, p < 0.05, two-tailed t-tests; Fig. 4B) in the presence of medial temporal atrophy. Of these miRNAs, five serum-miRNAs and nine EV-miRNAs were significantly associated with medial temporal atrophy (p < 0.05, univariate logistic regression; Fig. 4, red bars). After covariate adjustment using multiple regression analyses, only one serum-miRNAs, but ten EV-miRNAs, remained significantly associated with medial temporal atrophy (p < 0.05, multiple logistic regression; Fig. 4A, B, asterisks). This comparative analysis highlights the increased potential of EV versus serum miRNAs in identifying the presence of AD and its associated medial temporal atrophy; EV-miRNA hsa-miR-1290’s AUC of 0.90 (95% CI: 0.79 to 1) suggests it could be a clinically useful biomarker.
Fig. 4
Associations of serum and EV miRNAs with medial temporal atrophy. Univariate and multiple regression analyses of (A) 6 serum-miRNAs and (B) 16 EV-miRNAs significantly altered in medial temporal atrophy cases. Associations are expressed in terms of odds ratios (OR) and their 95% confidence intervals (CI). Red lines indicate significant association before covariate adjustment (p < 0.05, univariate binary logistic regression), while asterisks indicate significant association after covariate adjustment for age, gender, education, and APOE ɛ4 (p < 0.05, multiple binary logistic regression).
DISCUSSION
Our study yielded 25 serum-miRNAs and 41 EV-miRNAs significantly altered in a comparison of 25 AD patients to 34 NCI controls. Of these miRNAs, the expression level of one serum-miRNA (namely hsa-miR-29c-3p) was consistent with findings of previous studies [41]. In contrast, the literature supports many of our EV-miRNA observations: increased expression of miR-424-5p [16, 18], miR-423-5p [21], miR-18b-5p [16], miR-128-3p [21], and decreased expression of let-7e-5p [21] and miR-142-3p [15]. There were, however, also some discrepancies, specifically in miR-92b-3p [21], miR-185-5p [20] and let-7i-5p [17], between the literature and our EV-miRNAs expression level observations. Although these discrepancies remain to be resolved, on balance, our study suggests that EV-miRNAs contain more information relevant to identifying AD and medial temporal atrophy than serum-miRNAs.
ROC AUCs of predictions of patients being AD versus NCI were higher for EV-miRNAs than for serum miRNAs. In particular, EV-enriched hsa-miR-1290 showed the greatest diagnostic potential for identifying both AD (AUC of 0.92) and medial temporal atrophy (AUC of 0.90). There is thus clearly an advantage of isolating miRNAs from EVs rather than serum, as is often practiced in clinical settings. This advantage could be due to the protection of miRNAs from degradation via encapsulation in EVs before, during, and after blood collection [7–14], or due to the disproportionate sorting of miRNAs into EVs during disease pathogenesis [42].
Our study suggests that combining miRNAs could increase AD detection accuracy to a level that is even higher than the already high level obtained using hsa-miR-1290 alone. Combining miRNA from serum (hsa-miR-431-3p, hsa-miR-181-2-3p, hsa-miR-1290, and hsa-miR-330-5p) or EV (hsa-miR-1290 and hsa-miR-128-3p) could have clinical utility, as ROC AUC values then rise even further. As only two EV-miRNAs, as compared to four serum-miRNAs, were required to achieve an exceptionally high ROC AUC, EV-miRNAs may have stronger predictive potentials than the serum-miRNAs. Indeed, EV-enriched hsa-miR-1290 alone had exceptional AD diagnostic value with an ROC AUC of 0.92. Belief in hsa-miR-1290 as a true signal is further fortified by the fact that it was identified in both serum-miRNAs and EV-miRNAs, and in prior literature; there is evidence of hsa-miR-1290 involvement in neurogenesis and neuronal differentiation during early central nervous system development [43–47], and evidence of its utility as a biomarker for subarachnoid hemorrhage [48]. While the underlying mechanism of hsa-miR-1290 in subarachnoid hemorrhage is unclear, cell culture models suggest that it may be anti-apoptotic in ischemia-reperfusion [49, 50]. Given that ischemia stroke is an important risk factor of neurological abnormalities, including AD and medial temporal atrophy [51], the association of hsa-miR-1290 with AD observed in our study may be mediated by underlying pathophysiologies other than neurodegeneration, e.g., vascular pathologies. Additional studies are needed to better understand the role of hsa-miR-1290 in AD.
How other miRNAs identified here may impact neurological disorders and diseases is not known. Although hsa-miR-431-3p was, to our knowledge, never studied, its precursor, miR-431, was reported to exert a protective effect on neuronal cells by regulating axonal regeneration [52], as well as by preventing both amyloid-β-induced synapse loss [53] and cerebral ischemia-reperfusion injury [54]. Interestingly, its 5p counterpart (miR-431-5p) was reported to be upregulated in the brains of AD transgenic mice [55]. Another candidate in our serum-miRNA combination panel, miR-330-5p, was also suggested to play a role in neuronal plasticity and development in rat hippocampal neurons [56]; serum hsa-miR-330-5p was also found to be upregulated in the plasma of patients with Parkinson’s disease [57]. Turning to our EV-miRNA panel, hsa-miR-128-3p is linked to cerebrovascular diseases, as higher expression is observed in the cerebrospinal fluid of acute ischemic stroke patients [58], and in rodent models of middle cerebral artery occlusion, miR-128-3p may suppress apoptotic processes and thus promote neuronal cell survival in ischemia-induced brain injuries [59]. Interestingly, GO enrichment analysis search for biological processes influenced by our EV-miRNAs hsa-miR-1290 and hsa-miR-128-3p yielded cellular responses to hypoxia, which are crucial during ischemia and an important in vascular pathologies. While none of our miRNAs were previously reported in human clinical cohorts of AD, our findings provide new insights and thus contribute to AD research.
Our study has several limitations. First, as our analyses were cross-sectional, temporal associations between miRNAs and the progression of cognitive impairment was not assessed. Second, the sample size was small, and thus may have limited statistical power in detecting significantly altered miRNAs in AD. This sample size limitation also restricted the use of covariate adjustments in multiple regression models and multiple testing corrections. As such, validation with a bigger cohort is still needed to confirm our findings. Indeed, our AUCs are high partly due to the fact that they were assessed on the data to which the models were fitted; we expect smaller values in independent cohorts, though likely not much worse than for hsa-miR-1290 alone, as it was found reproducibly in both serum and EV. Although over-fitting is a concern, with ∼300 miRNAs and thus ∼15 false positives at an alpha of 0.05, there are 25 minus ∼15 =∼10 and 41 minus ∼15 =∼26 true positives in serum and EV, respectively, Thus, signals existed on both sides, and more so in EVs than in serum. Third, subjects with cerebrovascular disease were deliberately excluded in the analysis, so our results may not be generalizable to populations where cerebrovascular burdens are high [60, 61]; studies that include subjects with vascular cognitive impairment and dementia may thus broaden the clinical utilities of miRNAs as biomarkers. Our last caveat is that to make this study more clinically relevant, we collected blood samples in standard collection tubes for miRNA isolation [EDTA (EV-miRNAs) and SST (serum-miRNAs)]. Although blood was collected into both EDTA and SST tubes from each participant concurrently, caution needs to be taken while interpreting the data, as pre-analytic blood processing procedures may affect the expression of biomarkers in the blood [62–64].
We investigated the diagnostic potential of miRNAs isolated from AD-patient blood-derived EVs versus serum samples from a clinically and ethnically well-defined patient cohort and found twice as many altered miRNAs in EV than in serum. While the EV-miRNA hsa-miR-1290 alone may predict AD sufficiently, further including miRNA such as hsa-128-3p may further improve accuracy. This holds not only for AD but also for medial temporal atrophy, an important characteristic of AD brain pathology. In unpublished other work, we also found hsa-miR-1290 to be significantly enriched in EVs extracted from patients with vascular dementia. Its importance is thus well supported. Overall, our work suggests that there are diagnostic advantages of EV-miRNAs over serum-miRNAs. Further investigations of EVs as carriers of disease-predicting biomarkers for neurodegeneration are thus warranted.
AUTHOR CONTRIBUTIONS
Yuek Ling Chai (Data curation; Investigation; Methodology; Project administration; Writing – original draft; Writing – review & editing); Lea Strohm (Data curation; Formal analysis; Investigation; Methodology); Yanan Zhu (Data curation; Formal analysis; Investigation); Rachel Sher Li Chia (Data curation; Formal analysis; Investigation); Joyce Ruifen Chong (Data curation; Formal analysis; Investigation); Danesha Devini Suresh (Data curation; Formal analysis; Investigation); Li Han Zhou (Data curation; Formal analysis; Investigation); Heng Phon Too (Data curation; Formal analysis; Investigation); Saima Hilal (Data curation; Formal analysis; Investigation); Tomas Radivoyevitch (Data curation; Formal analysis; Writing – review & editing); Edward H. Koo (Funding acquisition; Project administration); Christopher P. Chen (Conceptualization; Funding acquisition; Methodology; Supervision); Gunnar Heiko Dirk Poplawski (Conceptualization; Data curation; Formal analysis; Funding acquisition; Investigation; Methodology; Project administration; Supervision; Visualization; Writing – original draft; Writing – review & editing).
ACKNOWLEDGMENTS
The authors would like to thank the patients and their families for their participation in this study. Dr. Tan Boon Yeow, St Luke’s Hospital, is acknowledged for his contributions to patient recruitment.
FUNDING
This work was supported by the National Medical Research Council (NMRC/CSA-SI/007/2016 to CPC; OFYIRG19MAY-0024 to GHDP), National University of Singapore Yong Loo Lin School of Medicine (Post-Doctoral Fellowship NUSMED/2021/PDF/05 to YLC), and Lerner Research Institute, Center for Immunotherapy & Precision Immuno-Oncology, Cleveland Clinic, Cleveland Ohio (laboratory seed fund to GHDP).
CONFLICT OF INTEREST
The authors have no conflict of interest to report.
DATASETS/DATA AVAILABILITY STATEMENT
The data supporting the findings of this study are available on request from the corresponding author. The data are not publicly available due to privacy or ethical restrictions.
SUPPLEMENTARY MATERIAL
[1] The supplementary material is available in the electronic version of this article: https://dx.doi.org/10.3233/JAD-230572.
REFERENCES
[1] | FDA approved drug for Alzheimer’s Disease: ADUCANUMAB, https://www.accessdata.fda.gov/scripts/cder/daf/index.cfm?event=overview.process&ApplNo=761178 |
[2] | Jack C , Petersen RC , Xu YC , O’Brien PC , Smith GE , Ivnik RJ , Boeve BF , Waring SC , Tangalos EG , Kokmen E ((1999) ) Prediction of AD with MRI-based hippocampal volume in mild cognitive impairment, Neurology 52: , 1397–1397. |
[3] | Wang P , Lirng J , Lin K , Chang F , Liu H ((2006) ) Prediction of Alzheimer’s disease in mild cognitive impairment: A prospective study in Taiwan, Neurobiol Aging 27: , 1797–1806. |
[4] | Welge V , Fiege O , Lewczuk P , Mollenhauer B , Esselmann H , Klafki HW , Wolf S , Trenkwalder C , Otto M , Kornhuber J , Wiltfang J , Bibl M ((2009) ) Combined CSF tau, p-tau181 and amyloid-beta 38/40/42 for diagnosing Alzheimer’s disease, J Neural Transm 116: , 203–212. |
[5] | Chong JR , Ashton NJ , Karikari TK , Tanaka T , Saridin FN , Reilhac A , Robins EG , Nai YH , Vrooman H , Hilal S , Zetterberg H , Blennow K , Lai MKP , Chen CP ((2021) ) Plasma P-tau181 to Abeta42 ratio is associated with brain amyloid burden and hippocampal atrophy in an Asian cohort of Alzheimer’s disease patients with concomitant cerebrovascular disease, Alzheimers Dement 17: , 1649–1662. |
[6] | Kroh EM , Parkin RK , Mitchell PS , Tewari M ((2010) ) Analysis of circulating microRNA biomarkers in plasma and serum using quantitative reverse transcription-PCR (qRT-PCR), Methods 50: , 298–301. |
[7] | Nik Mohamed Kamal N , Shahidan WNS ((2019) ) Non-exosomal and exosomal circulatory microRNAs: Which are more valid as biomarkers? Front Pharmacol 10: , 1500. |
[8] | Fornari F , Ferracin M , Trerè D , Milazzo M , Marinelli S , Galassi M , Venerandi L , Pollutri D , Patrizi C , Borghi A , Foschi FG , Stefanini GF , Negrini M , Bolondi L , Gramantieri L ((2015) ) Circulating microRNAs, miR-939, miR-595, miR-519d and miR-494, identify cirrhotic patients with HCC, PLoS One 10: , e0141448. |
[9] | Duttagupta R , Jiang R , Gollub J , Getts RC , Jones KW ((2011) ) Impact of cellular miRNAs on circulating miRNA biomarker signatures, PLoS One 6: , e20769. |
[10] | Domańska-Senderowska D , Jastrzębski Z , Kiszałkiewicz J , Brzeziański M , Pastuszak-Lewandoska D , Radzimińki Ł , Brzeziańska-Lasota E , Jegier A ((2017) ) Expression analysis of selected classes of circulating exosomal miRNAs in soccer players as an indicator of adaptation to physical activity, Biol Sport 34: , 331–338. |
[11] | Fu F , Jiang W , Zhou L , Chen Z ((2018) ) Circulating exosomal miR-17-5p and miR-92a-3p predict pathologic stage and grade of colorectal cancer, Transl Oncol 11: , 221–232. |
[12] | Uratani R , Toiyama Y , Kitajima T , Kawamura M , Hiro J , Kobayashi M , Tanaka K , Inoue Y , Mohri Y , Mori T , Kato T , Goel A , Kusunoki M ((2016) ) Diagnostic potential of cell-free and exosomal microRNAs in the identification of patients with high-risk colorectal adenomas, PLoS One 11: , e0160722. |
[13] | Ragusa M , Barbagallo C , Statello L , Caltabiano R , Russo A , Puzzo L , Avitabile T , Longo A , Toro MD , Barbagallo D , Valadi H , Di Pietro C , Purrello M , Reibaldi M ((2015) ) miRNA profiling in vitreous humor, vitreal exosomes and serum from uveal melanoma patients: Pathological and diagnostic implications, Cancer Biol Ther 16: , 1387–1396. |
[14] | Pirola CJ , Fernández Gianotti T , Castaño GO , Mallardi P , San Martino J , Mora Gonzalez Lopez Ledesma M , Flichman D , Mirshahi F , Sanyal AJ , Sookoian S ((2015) ) Circulating microRNA signature in non-alcoholic fatty liver disease: From serum non-coding RNAs to liver histology and disease pathogenesis, Gut 64: , 800–812. |
[15] | Aharon A , Spector P , Ahmad RS , Horrany N , Sabbach A , Brenner B , Aharon-Peretz J ((2020) ) Extracellular vesicles of Alzheimer’s disease patients as a biomarker for disease progression, Mol Neurobiol 57: , 4156–4169. |
[16] | Cheng L , Doecke JD , Sharples RA , Villemagne VL , Fowler CJ , Rembach A , Martins RN , Rowe CC , Macaulay SL , Masters CL , Hill AF ((2015) ) Prognostic serum miRNA biomarkers associated with Alzheimer’s disease shows concordance with neuropsychological and neuroimaging assessment, Mol Psychiatry 20: , 1188–1196. |
[17] | Gámez-Valero A , Campdelacreu J , Vilas D , Ispierto L , Reñé R , Álvarez R , Armengol MP , Borràs FE , Beyer K ((2019) ) Exploratory study on microRNA profiles from plasma-derived extracellular vesicles in Alzheimer’s disease and dementia with Lewy bodies, Transl Neurodegener 8: , 31. |
[18] | Li F , Xie XY , Sui XF , Wang P , Chen Z , Zhang JB ((2020) ) Profile of pathogenic proteins and microRNAs in plasma-derived extracellular vesicles in Alzheimer’s disease: A pilot study, Neuroscience 432: , 240–246. |
[19] | Liu CG , Song J , Zhang YQ , Wang PC ((2014) ) MicroRNA-193b is a regulator of amyloid precursor protein in the blood and cerebrospinal fluid derived exosomal microRNA-193b is a biomarker of Alzheimer’s disease, Mol Med Rep 10: , 2395–2400. |
[20] | Lugli G , Cohen AM , Bennett DA , Shah RC , Fields CJ , Hernandez AG , Smalheiser NR ((2015) ) Plasma exosomal miRNAs in persons with and without Alzheimer disease: Altered expression and prospects for biomarkers, PLoS One 10: , e0139233. |
[21] | Nie C , Sun Y , Zhen H , Guo M , Ye J , Liu Z , Yang Y , Zhang X ((2020) ) Differential expression of plasma exo-miRNA in neurodegenerative diseases by next-generation sequencing, Front Neurosci 14: , 438. |
[22] | Serpente M , Fenoglio C , D’Anca M , Arcaro M , Sorrentino F , Visconte C , Arighi A , Fumagalli GG , Porretti L , Cattaneo A , Ciani M , Zanardini R , Benussi L , Ghidoni R , Scarpini E , Galimberti D ((2020) ) miRNA profiling in plasma neural-derived small extracellular vesicles from patients with Alzheimer’s disease, Cells 9: , 1443. |
[23] | Wei H , Xu Y , Xu W , Zhou Q , Chen Q , Yang M , Feng F , Liu Y , Zhu X , Yu M , Li Y ((2018) ) Serum exosomal miR-223 serves as a potential diagnostic and prognostic biomarker for dementia, Neuroscience 379: , 167–176. |
[24] | Yang TT , Liu CG , Gao SC , Zhang Y , Wang PC ((2018) ) The serum exosome derived microRNA-135a, -193b, and -384 were potential Alzheimer’s disease biomarkers, Biomed Environ Sci 31: , 87–96. |
[25] | McKhann G , Drachman D , Folstein M , Katzman R , Price D , Stadlan EM ((1984) ) Clinical diagnosis of Alzheimer’s disease: Report of the NINCDS-ADRDA Work Group under the auspices of Department of Health and Human Services Task Force on Alzheimer’s Disease, Neurology 34: , 939–944. |
[26] | Scheltens P , Launer LJ , Barkhof F , Weinstein HC , van Gool WA ((1995) ) Visual assessment of medial temporal lobe atrophy on magnetic resonance imaging: Interobserver reliability, J Neurol 242: , 557–560. |
[27] | Gyanwali B , Shaik MA , Hilal S , Cano J , Chen C , Venketasubramanian N ((2018) ) Prevalence and association of syphilis reactivity in an Asian memory clinic population, Int J STD AIDS 29: , 1368–1374. |
[28] | Chai YL , Chong JR , Raquib AR , Xu X , Hilal S , Venketasubramanian N , Tan BY , Kumar AP , Sethi G , Chen CP , Lai MKP ((2021) ) Plasma osteopontin as a biomarker of Alzheimer’s disease and vascular cognitive impairment, Sci Rep 11: , 4010. |
[29] | Chai YL , Yeo HK , Wang J , Hilal S , Ikram MK , Venketasubramanian N , Wong BS , Chen CL ((2016) ) Apolipoprotein varepsilon4 is associated with dementia and cognitive impairment predominantly due to Alzheimer’s disease and not with vascular cognitive impairment: A Singapore-based cohort, J Alzheimers Dis 51: , 1111–1118. |
[30] | Théry C , Witwer KW , Aikawa E , Alcaraz MJ , Anderson JD , Andriantsitohaina R , Antoniou A , Arab T , Archer F , Atkin-Smith GK , et al. ((2018) ) Minimal information for studies of extracellular vesicles 2018 (MISEV2018): A position statement of the International Society for Extracellular Vesicles and update of the MISEV2014 guidelines, J Extracell Vesicles 7: , 1535750. |
[31] | Robin X , Turck N , Hainard A , Tiberti N , Lisacek F , Sanchez JC , Müller M ((2011) ) pROC: An open-source package for R and+to analyze and compare ROC curves, BMC Bioinformatics 12: , 77. |
[32] | DeLong ER , DeLong DM , Clarke-Pearson DL ((1988) ) Comparing the areas under two or more correlated receiver operating characteristic curves: A nonparametric approach, Biometrics 44: , 837–845. |
[33] | Youden WJ ((1950) ) Index for rating diagnostic tests, Cancer 3: , 32–35. |
[34] | Ludwig N , Leidinger P , Becker K , Backes C , Fehlmann T , Pallasch C , Rheinheimer S , Meder B , Stähler C , Meese E , Keller A ((2016) ) Distribution of miRNA expression across human tissues, Nucleic Acids Res 44: , 3865–3877. |
[35] | Huang HY , Lin YC , Cui S , Huang Y , Tang Y , Xu J , Bao J , Li Y , Wen J , Zuo H , Wang W , Li J , Ni J , Ruan Y , Li L , Chen Y , Xie Y , Zhu Z , Cai X , Chen X , Yao L , Chen Y , Luo Y , LuXu S , Luo M , Chiu CM , Ma K , Zhu L , Cheng GJ , Bai C , Chiang YC , Wang L , Wei F , Lee TY , Huang HD ((2022) ) miRTarBase update 2022: An informative resource for experimentally validated miRNA-target interactions, Nucleic Acids Res 50: , D222–d230. |
[36] | Aleksander SA , Balhoff J , Carbon S , Cherry JM , Drabkin HJ , Ebert D , Feuermann M , Gaudet P , Harris NL , Hill DP , Lee R , Mi H , Moxon S , Mungall CJ , Muruganugan A , Mushayahama T , Sternberg PW , Thomas PD , Van Auken K , Ramsey J , Siegele DA , Chisholm RL , Fey P , Aspromonte MC , Nugnes MV , Quaglia F , Tosatto S , Giglio M , Nadendla S , Antonazzo G , Attrill H , Dos Santos G , Marygold S , Strelets V , Tabone CJ , Thurmond J , Zhou P , Ahmed SH , Asanitthong P , Luna Buitrago D , Erdol MN , Gage MC , Ali Kadhum M , Li KYC , Long M , Michalak A , Pesala A , Pritazahra A , Saverimuttu SCC , Su R , Thurlow KE , Lovering RC , Logie C , Oliferenko S , Blake J , Christie K , Corbani L , Dolan ME , Drabkin HJ , Hill DP , Ni L , Sitnikov D , Smith C , Cuzick A , Seager J , Cooper L , Elser J , Jaiswal P , Gupta P , Jaiswal P , Naithani S , Lera-Ramirez M , Rutherford K , Wood V , De Pons JL , Dwinell MR , Hayman GT , Kaldunski ML , Kwitek AE , Laulederkind SJF , Tutaj MA , Vedi M , Wang SJ , D’Eustachio P , Aimo L , Axelsen K , Bridge A , Hyka-Nouspikel N , Morgat A , Aleksander SA , Cherry JM , Engel SR , Karra K , Miyasato SR , Nash RS , Skrzypek MS , Weng S , Wong ED , Bakker E , Berardini TZ , Reiser L , Auchincloss A , Axelsen K , Argoud-Puy G , Blatter MC , Boutet E , Breuza L , Bridge A , Casals-Casas C , Coudert E , Estreicher A , Livia Famiglietti M , Feuermann M , Gos A , Gruaz-Gumowski N , Hulo C , Hyka-Nouspikel N , Jungo F , Le Mercier P , Lieberherr D , Masson P , Morgat A , Pedruzzi I , Pourcel L , Poux S , Rivoire C , Sundaram S , Bateman A , Bowler-Barnett E , Bye AJH , Denny P , Ignatchenko A , Ishtiaq R , Lock A , Lussi Y , Magrane M , Martin MJ , Orchard S , Raposo P , Speretta E , Tyagi N , Warner K , Zaru R , Diehl AD , Lee R , Chan J , Diamantakis S , Raciti D , Zarowiecki M , Fisher M , James-Zorn C , Ponferrada V , Zorn A , Ramachandran S , Ruzicka L , Westerfield M ((2023) ) The Gene Ontology knowledgebase in 2023, Genetics 224: , iyad031. |
[37] | Ashburner M , Ball CA , Blake JA , Botstein D , Butler H , Cherry JM , Davis AP , Dolinski K , Dwight SS , Eppig JT , Harris MA , Hill DP , Issel-Tarver L , Kasarskis A , Lewis S , Matese JC , Richardson JE , Ringwald M , Rubin GM , Sherlock G ((2000) ) Gene ontology: Tool for the unification of biology. The Gene Ontology Consortium, Nat Genet 25: , 25–29. |
[38] | Chen EY , Tan CM , Kou Y , Duan Q , Wang Z , Meirelles GV , Clark NR , Ma’ayan A ((2013) ) Enrichr: Interactive and collaborative HTML5 gene list enrichment analysis tool, BMC Bioinformatics 14: , 128. |
[39] | Kuleshov MV , Jones MR , Rouillard AD , Fernandez NF , Duan Q , Wang Z , Koplev S , Jenkins SL , Jagodnik KM , Lachmann A , McDermott MG , Monteiro CD , Gundersen GW , Ma’ayan A ((2016) ) Enrichr: A comprehensive gene set enrichment analysis web server 2016 update, Nucleic Acids Res 44: , W90–97. |
[40] | Xie Z , Bailey A , Kuleshov MV , Clarke DJB , Evangelista JE , Jenkins SL , Lachmann A , Wojciechowicz ML , Kropiwnicki E , Jagodnik KM , Jeon M , Ma’ayan A ((2021) ) Gene Set Knowledge Discovery with Enrichr, Curr Protoc 1: , e90. |
[41] | Takousis P , Sadlon A , Schulz J , Wohlers I , Dobricic V , Middleton L , Lill CM , Perneczky R , Bertram L ((2019) ) Differential expression of microRNAs in Alzheimer’s disease brain, blood, and cerebrospinal fluid, Alzheimers Dement 15: , 1468–1477. |
[42] | Čarna M , Novotny JS , Dragišić N , Slavik H , Sheardova K , Geda YE , Vyhnalek M , Laczo J , Hort J , Mao Z , Rissman RA , Hajduch M , Dammer EB , Stokin GB ((2023) ) Missorting of plasma miRNAs in aging and Alzheimer’s disease, J Neurochem 165: , 149–161. |
[43] | Lamadrid-Romero M , Solís KH , Cruz-Reséndiz MS , Pérez JE , Díaz NF , Flores-Herrera H , García-López G , Perichart O , Reyes-Muñoz E , Arenas-Huertero F , Eguía-Aguilar P , Molina-Hernández A ((2018) ) Central nervous system development-related microRNAs levels increase in the serum of gestational diabetic women during the first trimester of pregnancy, Neurosci Res 130: , 8–22. |
[44] | Moore D , Meays BM , Madduri LSV , Shahjin F , Chand S , Niu M , Albahrani A , Guda C , Pendyala G , Fox HS , Yelamanchili SV ((2019) ) Downregulation of an evolutionary young miR-1290 in an iPSC-derived neural stem cell model of autism spectrum disorder, Stem Cells Int 2019: , 8710180. |
[45] | Yelamanchili SV , Morsey B , Harrison EB , Rennard DA , Emanuel K , Thapa I , Bastola DR , Fox HS ((2014) ) The evolutionary young miR-1290 favors mitotic exit and differentiation of human neural progenitors through altering the cell cycle proteins, Cell Death Dis 5: , e982. |
[46] | Zbucka-Kretowska M , Niemira M , Paczkowska-Abdulsalam M , Bielska A , Szalkowska A , Parfieniuk E , Ciborowski M , Wolczynski S , Kretowski A ((2019) ) Prenatal circulating microRNA signatures of foetal Down syndrome, Sci Rep 9: , 2394. |
[47] | Zhuang H , Zhang R , Zhang S , Shu Q , Zhang D , Xu G ((2015) ) Altered expression of microRNAs in the neuronal differentiation of human Wharton’s Jelly mesenchymal stem cells, Neurosci Lett 600: , 69–74. |
[48] | Lu G , Wong MS , Xiong MZQ , Leung CK , Su XW , Zhou JY , Poon WS , Zheng VZY , Chan WY , Wong GKC ((2017) ) Circulating microRNAs in delayed cerebral infarction after aneurysmal subarachnoid hemorrhage, J Am Heart Assoc 6: , e005363. |
[49] | Wu K , Hu M , Chen Z , Xiang F , Chen G , Yan W , Peng Q , Chen X ((2017) ) Asiatic acid enhances survival of human AC16 cardiomyocytes under hypoxia by upregulating miR-1290, IUBMB Life 69: , 660–667. |
[50] | Yue KY , Zhang PR , Zheng MH , Cao XL , Cao Y , Zhang YZ , Zhang YF , Wu HN , Lu ZH , Liang L , Jiang XF , Han H ((2019) ) Neurons can upregulate Cav-1 to increase intake of endothelial cells-derived extracellular vesicles that attenuate apoptosis via miR-1290, Cell Death Dis 10: , 869. |
[51] | Kebets V , Gregoire SM , Charidimou A , Barnes J , Rantell K , Brown MM , Jäger HR , Cipolotti L , Werring DJ ((2015) ) Prevalence and cognitive impact of medial temporal atrophy in a hospital stroke service: Retrospective cohort study, Int J Stroke 10: , 861–867. |
[52] | Wu D , Murashov AK ((2013) ) MicroRNA-431 regulates axon regeneration in mature sensory neurons by targeting the Wnt antagonist Kremen1, Front Mol Neurosci 6: , 35. |
[53] | Ross SP , Baker KE , Fisher A , Hoff L , Pak ES , Murashov AK ((2018) ) miRNA-431 prevents amyloid-β-induced synapse loss in neuronal cell culture model of Alzheimer’s disease by silencing Kremen1, Front Cell Neurosci 12: , 87. |
[54] | Han XR , Wen X , Wang YJ , Wang S , Shen M , Zhang ZF , Fan SH , Shan Q , Wang L , Li MQ , Hu B , Sun CH , Wu DM , Lu J , Zheng YL ((2018) ) Protective effects of microRNA-431 against cerebral ischemia-reperfusion injury in rats by targeting the Rho/Rho-kinase signaling pathway, J Cell Physiol 233: , 5895–5907. |
[55] | Wang LL , Min L , Guo QD , Zhang JX , Jiang HL , Shao S , Xing JG , Yin LL , Liu JH , Liu R , Guo SL ((2017) ) Profiling microRNA from brain by microarray in a transgenic mouse model of Alzheimer’s disease, Biomed Res Int 2017: , 8030369. |
[56] | Cohen JE , Lee PR , Fields RD ((2014) ) Systematic identification of 3’-UTR regulatory elements in activity-dependent mRNA stability in hippocampal neurons, Philos Trans R Soc Lond B Biol Sci 369: , 20130509. |
[57] | Ravanidis S , Bougea A , Papagiannakis N , Koros C , Simitsi AM , Pachi I , Breza M , Stefanis L , Doxakis E ((2020) ) Validation of differentially expressed brain-enriched microRNAs in the plasma of PD patients, Ann Clin Transl Neurol 7: , 1594–1607. |
[58] | Sørensen SS , Nygaard AB , Carlsen AL , Heegaard NHH , Bak M , Christensen T ((2017) ) Elevation of brain-enriched miRNAs in cerebrospinal fluid of patients with acute ischemic stroke, Biomark Res 5: , 24. |
[59] | Mao G , Ren P , Wang G , Yan F , Zhang Y ((2017) ) MicroRNA-128-3p protects mouse against cerebral ischemia through reducing p38α mitogen-activated protein kinase activity, J Mol Neurosci 61: , 152–158. |
[60] | Chen C , Homma A , Mok VC , Krishnamoorthy E , Alladi S , Meguro K , Abe K , Dominguez J , Marasigan S , Kandiah N , Kim SY , Lee DY , De Silva HA , Yang YH , Pai MC , Senanarong V , Dash A ((2016) ) Alzheimer’s disease with cerebrovascular disease: Current status in the Asia-Pacific region, J Intern Med 280: , 359–374. |
[61] | Lam BYK , Yiu B , Ampil E , Chen CL , Dikot Y , Dominguez JC , Ganeshbhai PV , Hilal S , Kandiah N , Kim S , Lee JY , Ong AP , Senanarong V , Leung KT , Wang H , Yang YH , Yong T , Arshad F , Alladi S , Wong S , Ko H , Lau AYL , Mok VCT ((2021) ) High burden of cerebral white matter lesion in 9 Asian cities, Sci Rep 11: , 11587. |
[62] | Max KEA , Bertram K , Akat KM , Bogardus KA , Li J , Morozov P , Ben-Dov IZ , Li X , Weiss ZR , Azizian A , Sopeyin A , Diacovo TG , Adamidi C , Williams Z , Tuschl T ((2018) ) Human plasma and serum extracellular small RNA reference profiles and their clinical utility, Proc Natl Acad Sci U S A 115: , E5334–E5343. |
[63] | Yu Z , Kastenmuller G , He Y , Belcredi P , Moller G , Prehn C , Mendes J , Wahl S , Roemisch-Margl W , Ceglarek U , Polonikov A , Dahmen N , Prokisch H , Xie L , Li Y , Wichmann HE , Peters A , Kronenberg F , Suhre K , Adamski J , Illig T , Wang-Sattler R ((2011) ) Differences between human plasma and serum metabolite profiles, PLoS One 6: , e21230. |
[64] | Nishiumi S , Suzuki M , Kobayashi T , Yoshida M ((2018) ) Differences in metabolite profiles caused by pre-analytical blood processing procedures, J Biosci Bioeng 125: , 613–618. |


