
Microstructural Neurodegeneration of the Entorhinal-Hippocampus Pathway along the Alzheimer’s Disease Continuum
Abstract
Background:
Conventional neuroimaging biomarkers for the neurodegeneration of Alzheimer’s disease (AD) are not sensitive enough to detect neurodegenerative alterations during the preclinical stage of AD individuals.
Objective:
We examined whether neurodegeneration of the entorhinal-hippocampal pathway could be detected along the AD continuum using ultra-high-field diffusion tensor imaging and tractography for ex vivo brain tissues.
Methods:
Postmortem brain specimens from a cognitively unimpaired individual without AD pathological changes (non-AD), a cognitively unimpaired individual with AD pathological changes (preclinical AD), and a demented individual with AD pathological changes (AD dementia) were scanned with an 11.7T diffusion magnetic resonance imaging. Fractional anisotropy (FA) values of the entorhinal layer II and number of perforant path fibers counted by tractography were compared among the AD continuum. Following the imaging analyses, the status of myelinated fibers and neuronal cells were verified by subsequent serial histological examinations.
Results:
At 250μm (zipped to 125μm) isotropic resolution, the entorhinal layer II islands and the perforant path fibers could be identified in non-AD and preclinical AD, but not in AD dementia, followed by histological verification. The FA value of the entorhinal layer II was the highest among the entorhinal laminae in non-AD and preclinical AD, whereas the FA values in the entorhinal laminae were homogeneously low in AD dementia. The FA values and number of perforant path fibers decreased along the AD continuum (non-AD>preclinical AD > AD dementia).
Conclusion:
We successfully detected neurodegenerative alterations of the entorhinal-hippocampal pathway at the preclinical stage of the AD continuum.
INTRODUCTION
While the “modified amyloid cascade hypothesis” pathway has been supported by cumulative evidence [1], the causal relationship of amyloid-β, tau, or both to Alzheimer’s disease (AD) progression is still under debate. Prognostication at the personal level is difficult because not all cognitively normal individuals with positive results of these biomarkers show cognitive impairment within a clinically relevant timeframe. Nevertheless, there is a consensus that neurodegeneration is closely associated with cognitive impairment during disease progression in the AD continuum [2]. However, the neuroimaging modalities currently used to detect the biomarkers for neurodegeneration, such as anatomical magnetic resonance imaging (MRI) and fluorodeoxyglucose positron emission tomography, are not sensitive enough to detect these neurodegenerative alterations in preclinical AD [3].
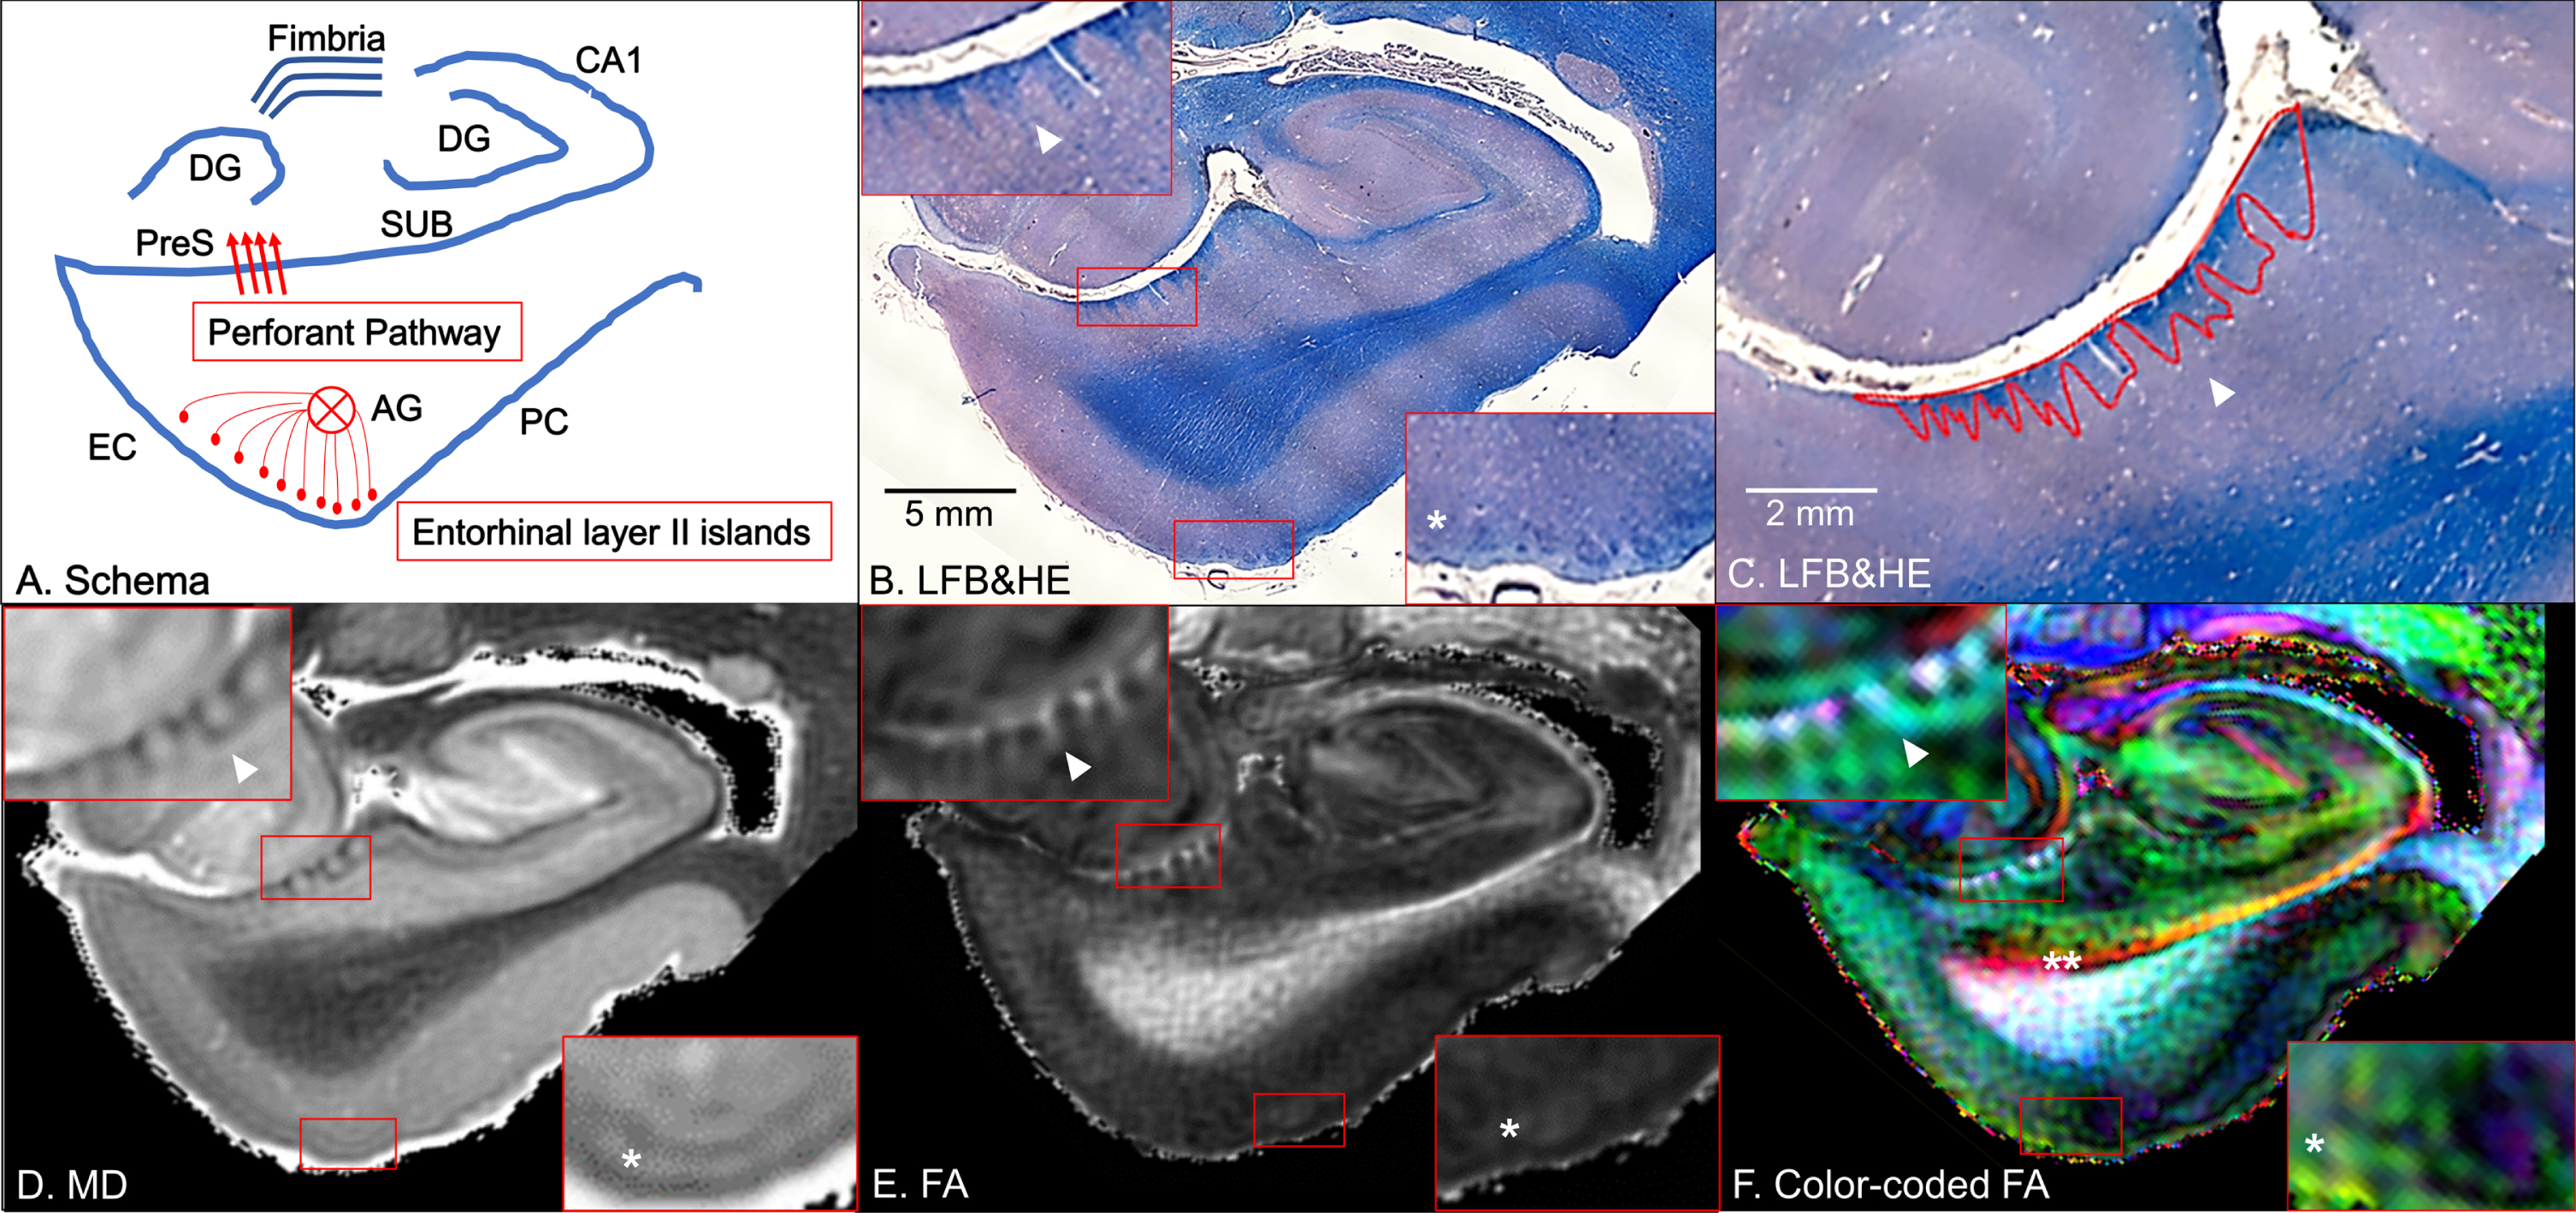
For the development of a highly sensitive neurodegenerative biomarker for preclinical AD, the following two requirements must be met: 1) pathological changes are present from the preclinical stage of the AD continuum; and 2) the magnitude of these changes is related to cognitive impairment of AD. The entorhinal-hippocampal pathway meets these requirements because it is the first region where neurofibrillary tangles, composed of hyperphosphorylated tau, appear in the process of AD pathogenesis [4] and also has a crucial role in the formation of episodic memory [5]. The entorhinal cortex is located at the anterior half of the parahippocampal gyrus in the medial temporal lobe. Neurons of the entorhinal layer II cluster and form neuronal-rich islands [6], from which projection fibers converge to form the angular bundle that reaches the presubiculum and connects to the dentate gyrus of the hippocampus, called the perforant pathway (Fig. 1A) [7]. In a clinicopathological study for AD dementia, memory loss became irreversible during the pathological process of AD, with the demise of entorhinal neurons and perforant path fibers, which causes the disconnection of the hippocampus from the association and limbic cortices [8]. Further, degradation of the perforant pathway in aged humans was associated with a word-list learning task before the entorhinal atrophic changes were apparent [9]. Under these circumstances, our perspective was that neurodegeneration below the threshold for clinical manifestation might be present in preclinical AD.
Fig. 1
Coronal panels of the left entorhinal cortex (EC) in non-Alzheimer’s disease brain tissue. A) Schematic diagram. The perforant pathway is a set of fibers projecting from the entorhinal layer II islands through the angular bundle (AG) and the presubiculum (PreS) to the dentate gyrus (DG) in the hippocampus. PC, perirhinal cortex; SUB, subiculum. B) Luxol fast blue with hematoxylin and eosin staining (LFB&HE). The red bounding boxes are 5×magnified to clearly visualize the perforant path fibers on the presubiculum (left-upper panel) and the entorhinal layer II islands (right-lower panel). C) The red bounding areas are myelinated fibers in the presubiculum. D) Mean diffusivity (MD) map. E) Fractional anisotropy (FA) map. F) Color-coded FA map. Arrowheads point to myelinated fibers in the presubiculum and single asterisks denote the entorhinal layer II cortices (B–F). Double asterisk designates the temporal alvear pathway coursing around the hippocampal fissure (F).
Given the clinical and pathological significance of the entorhinal-hippocampal pathway to the earliest AD pathogenesis, we hypothesized that its myeloarchitectonic features would serve as neurodegenerative biomarkers for preclinical AD if such features could be detected using quantitative MRI. Among various MRI modalities, diffusion MRI is particularly suited for quantifying anatomical fiber connections such as the entorhinal-hippocampal pathway because it can assess the characteristics of tissue microstructure by measuring the thermal motion of water molecules, which is not detectable with anatomical MRI [10]. There has been one research paper showing that the diffusion MRI properties of the perforant path fibers are altered in symptomatic AD [11]. However, due to the low resolution of the image acquisition for in vivo diffusion MRI, the perforant path fibers could not be thoroughly reconstructed, which was far from comparable to microscopic neuroanatomical observations [12]. Whether alterations in the entorhinal-hippocampal pathway are observed in preclinical AD is still an open question.
A prerequisite for using changes in the entorhinal-hippocampal pathway as neurodegenerative biomarkers is the ability of diffusion MRI to quantify microstructural alterations in preclinical AD. Therefore, it is necessary to conduct a proof-of-concept study to demonstrate whether histologically confirmed neurodegenerative findings can be quantified by diffusion MRI. Current advances in the application of ex vivo diffusion MRI at ultra-high-field strength, i.e., 7T or higher static magnetic field, have been of great interest because of its ability to visualize the cortical laminar substructure and its unique features [13]. Assuming the average width of the entorhinal layer II islands is ≈500μm [14], image acquisition with submillimeter resolution is required. Ultra-high-field MRI-based histological analyses in previous studies, in which postmortem human brain tissues were scanned with 7T MRI followed by histological verification, could visualize the entorhinal layer II islands and the perforant path fibers [15, 16]. As a proof-of-concept study, we used postmortem brain tissues from non-AD, preclinical AD, and AD dementia to investigate whether ultra-high-field diffusion MRI could depict the histologically confirmed neurodegeneration of the entorhinal-hippocampal pathway.
MATERIALS AND METHODS
Human brain tissue
This study was performed under a protocol for the use of de-identified human brain tissues for research purposes, approved by the Institutional Review Board of the Johns Hopkins University School of Medicine. Pathologically diagnosed postmortem brain specimens of the left cerebral hemisphere were provided by the Brain Resource Center, Department of Pathology, Johns Hopkins University School of Medicine, after standard pathological examinations that included amyloid- and tau-immunostaining. These postmortem brain specimens included a 22-year-old cognitively unimpaired man without AD pathological changes (non-AD), a 68-year-old cognitively unimpaired woman with AD pathological changes (preclinical AD), and a 93-year-old demented man with AD pathological changes (AD dementia). The diagnosis was made based on the National Institute on Aging and Alzheimer’s Association (NIA-AA) guidelines for the neuropathologic assessment of AD [17]. Demographics and pathological findings of these brain specimens are summarized in the Supplementary Material (Supplementary Table 1 and Supplementary Figure 1).
Histological observation
The brain specimens were fixed in 10% formaldehyde for more than two weeks and sectioned into 10 mm-thick coronal slabs. The tissue blocks, approximately 40×20 mm in area, were cut from the slabs that contained the entorhinal cortex and hippocampus. For MRI scans, the brain tissues were transferred to phosphate-buffered saline with 2 mM gadopentetate dimeglumine for 48 h, and then were placed inside 50 ml conical tubes and filled with proton-free liquid (Fomblin: Ausimont, Thorofare, NJ, USA). The use of gadolinium contrast agent allowed a shorter repetition time without compromising diffusion measures [18]. Air bubbles were removed by placing the sample in a vacuum chamber for more than 10 min before MRI scans. Following MRI scans, the brain tissues were embedded in paraffin blocks, cut into 10μm thick sections at 200μm intervals, and stained using Luxol fast blue with hematoxylin and eosin (LFB&HE) for histological examination of myelinated fibers and neuronal cells. Histological pictures were captured under a Zeiss Axio Observer.Z1 microscope equipped with an AxioCam MRc camera (Carl Zeiss Microscopy, Thornwood, NY, USA) and a ×5 objective (Figs. 1B, 2A, and 2D). Areas of myelinated fibers in the presubiculum were measured using the ZEN 3.6 (blue edition) software (Fig. 1C). Finally, the ratio of the area of myelinated fibers in the presubiculum to the overall area of the presubiculum was calculated in each brain tissue.
Fig. 2
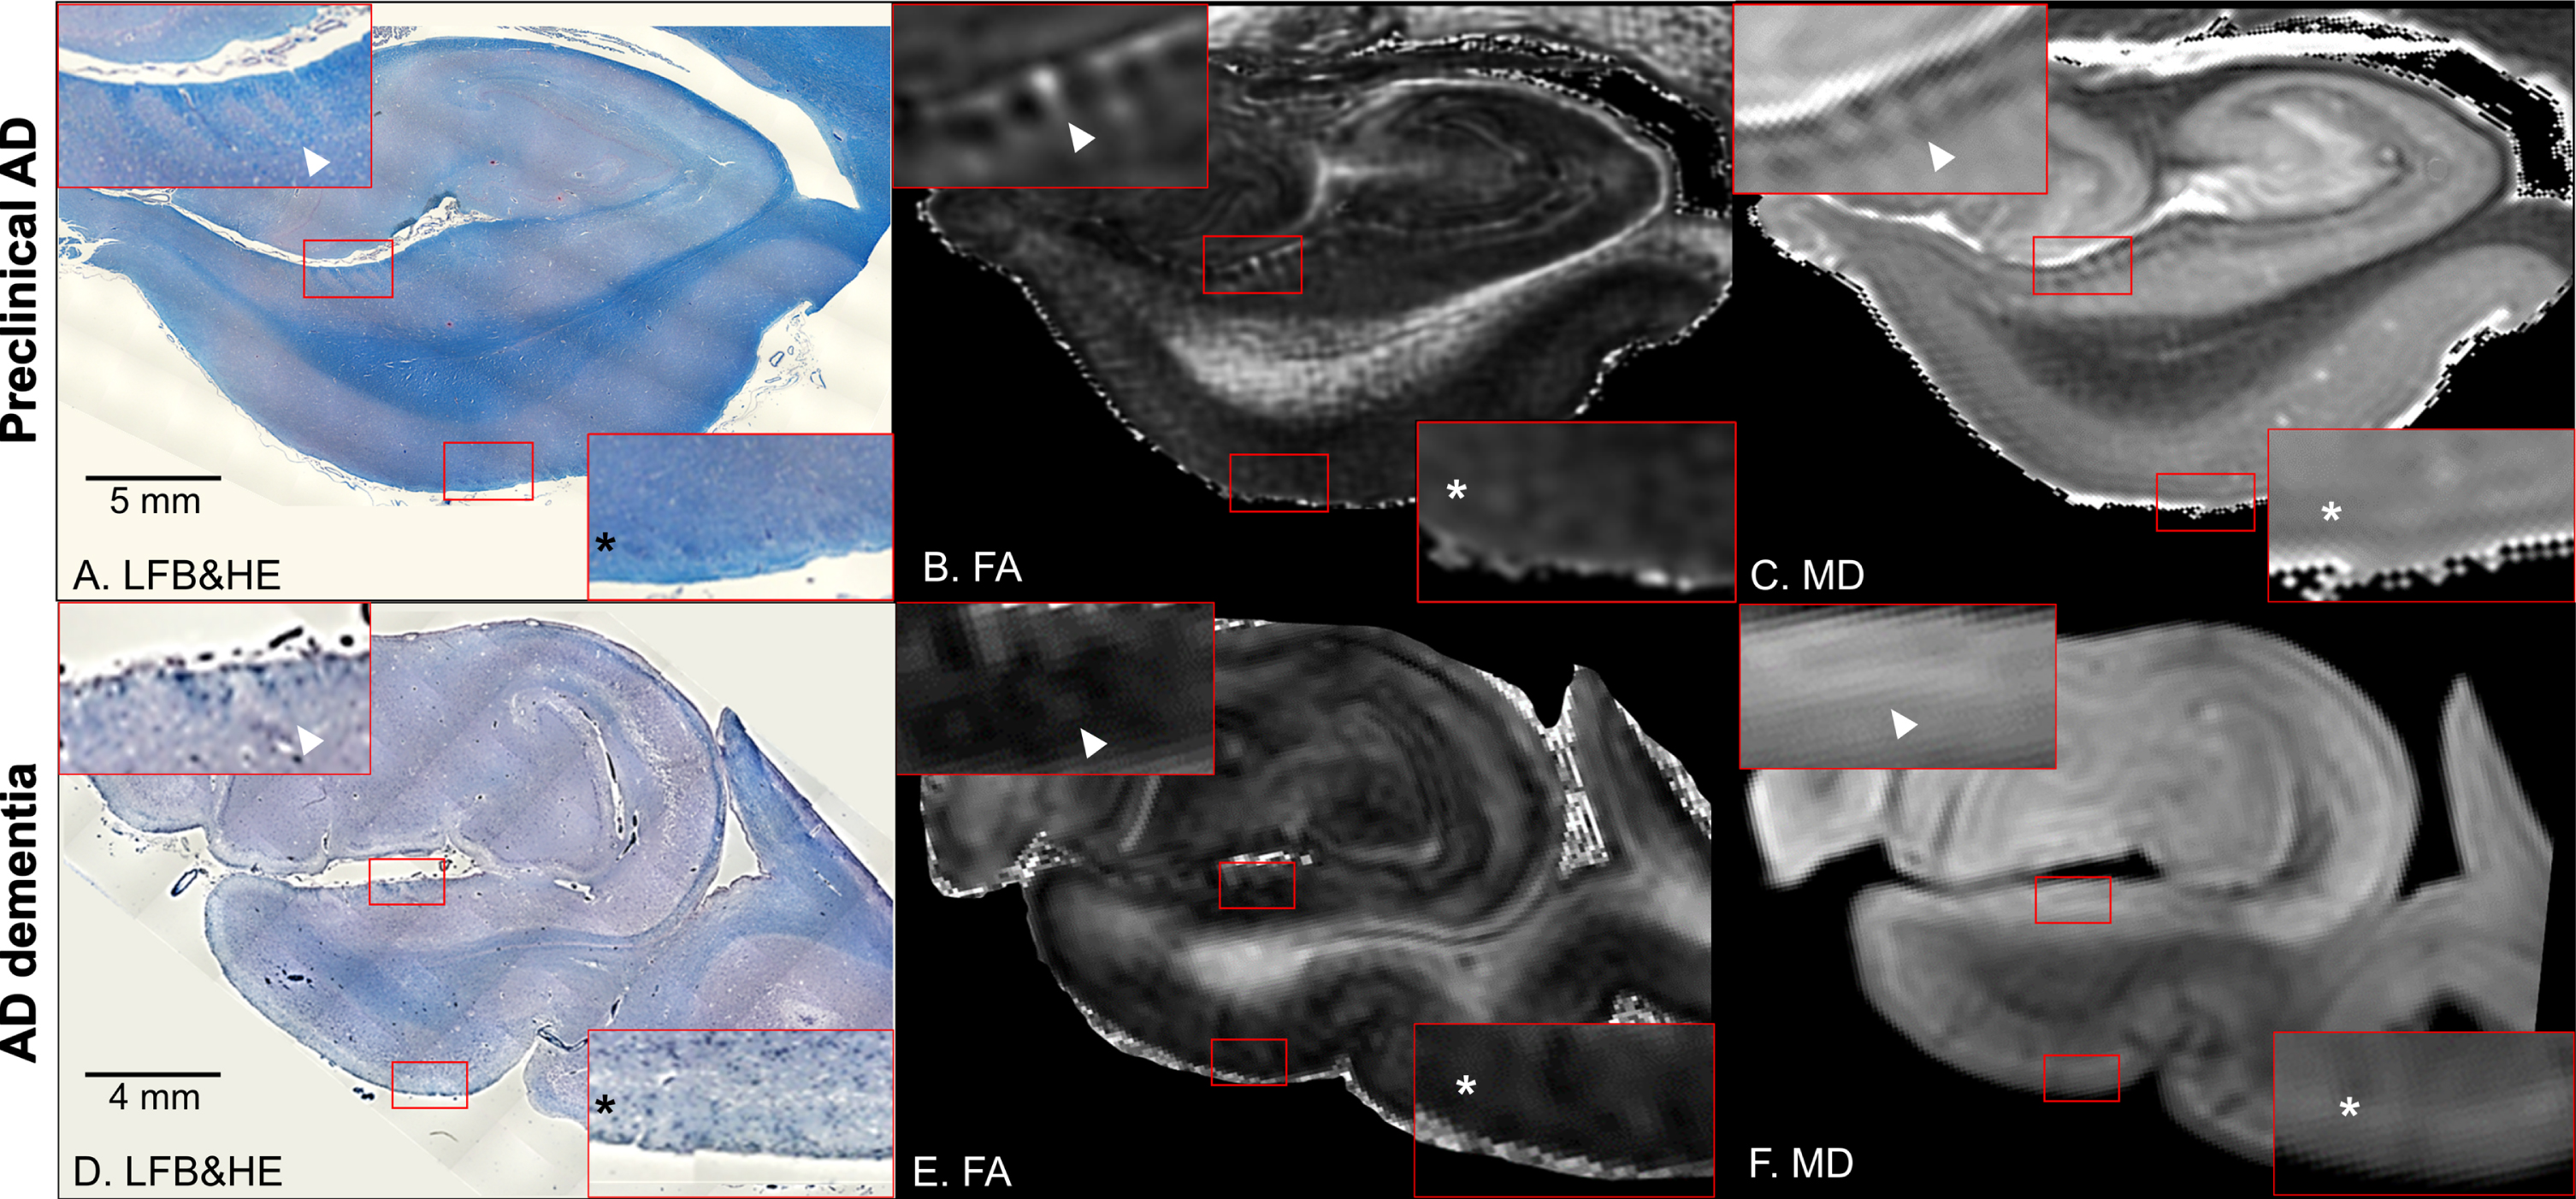
Coronal panels of the left entorhinal cortex in preclinical Alzheimer’s disease (AD) (A–C) and AD dementia brain tissues (D–F). A, D) Luxol fast blue with hematoxylin and eosin staining (LFB&HE). B, E) Fractional anisotropy (FA) maps. C, F) Mean diffusivity (MD) maps. The red bounding boxes are 5× magnified to clearly visualize the perforant path fibers on the presubiculum (left-upper panel) and the entorhinal layer II islands (right-lower panel). Arrowheads point to myelinated fibers in the presubiculum and asterisks denote the entorhinal layer II cortices (A–F). Note that these cortical substructures are not clearly discernible in the AD dementia brain tissue.
MRI scan and processing
Diffusion MRI was acquired using an 11.7-Tesla NMR spectrometer (Bruker Biospin, Billerica, MA, USA). A single-channel 30 mm Bruker volume coil was used for both radio frequency transmission and reception. Diffusion-weighted gradient and spin echo sequences with navigator phase correction were applied to the ex vivo brain tissue [19]. The scan parameters were: echo time = 37 ms; repetition time = 900 ms; two signal averages; two b0 images; and ten diffusion directions with b-value = 2300 s/mm2. The temperature during the scan was 27°C. The field of view was 40×30×16 mm3 and the acquisition matrix size was 160×120×64, which was zero-filled to 320×240×128. This resulted in a final resolution of 250μm (zipped to 125μm) isotropic. The total scan time was 24 h per scan.
The DtiStudio software (https://www.MRIstudio.org) [20] was used for the tensor calculation. The linear registration method minimized a cost function based on mean square tensor fitting errors to correct eddy current distortion and motion of the tissue [21]. The pixels with artifactual signal were eliminated from the tensor calculation using the corrected Inter-Slice Intensity Discontinuity algorithm [22]. From the tensor field, three eigenvalues were extracted to calculate scalar values, such as fractional anisotropy (FA), mean diffusivity (MD), axial diffusivity (AxD), and radial diffusivity (RD). Among these, we selected FA and MD maps to assess the tissue microstructures of the postmortem brain specimens because these contrasts were superior to those of the AxD and RD maps in discerning the cortical substructures (Supplementary Figure 2) [23]. The FA map was color-coded by the principal eigenvectors, shown in red (medial –lateral orientation), green (anterior –posterior orientation), and blue (superior –inferior orientation). The Gibbs ringing artifact [24] was removed from all the images using the MRtrix3 software (https://mrtrix.org; RRID:SCR_006971) [25].
Microstructural analysis
At 250μm (zipped to 125μm) isotropic resolution, cortical substructures were discernible within the entorhinal laminae using ex vivo 11.7T diffusion MRI, which was validated by subsequent serial histological examinations. In the MD map, areas occupied by neuronal cells and intercellular matrices appear bright [23]. Accordingly, the entorhinal layer II, primarily occupied by neuronal-rich islands, showed bright intensities [14]. With reference to the localization of these islands, the RoiEditor software (https://www.MRIstudio.org) was used to delineate the boundary of the entorhinal layer I (the molecular layer), layer II (the external granular layer), and other inner layers (III: the external pyramidal layer; IV: the internal granular layer; V: the internal pyramidal layer; VI: the polymorphic layer), which were indiscernible on both our MRI and histological analyses (Fig. 3A–C). Then, the mean FA and MD values were calculated for each layer on a 2D coronal plane of the left entorhinal cortex. The criteria used to select the coronal plane were: 1) the slice where the dentate gyrus of the hippocampus was split into the inner and outer portions; and 2) the slice that maximized the area occupied by the entorhinal layer II islands.
Fig. 3
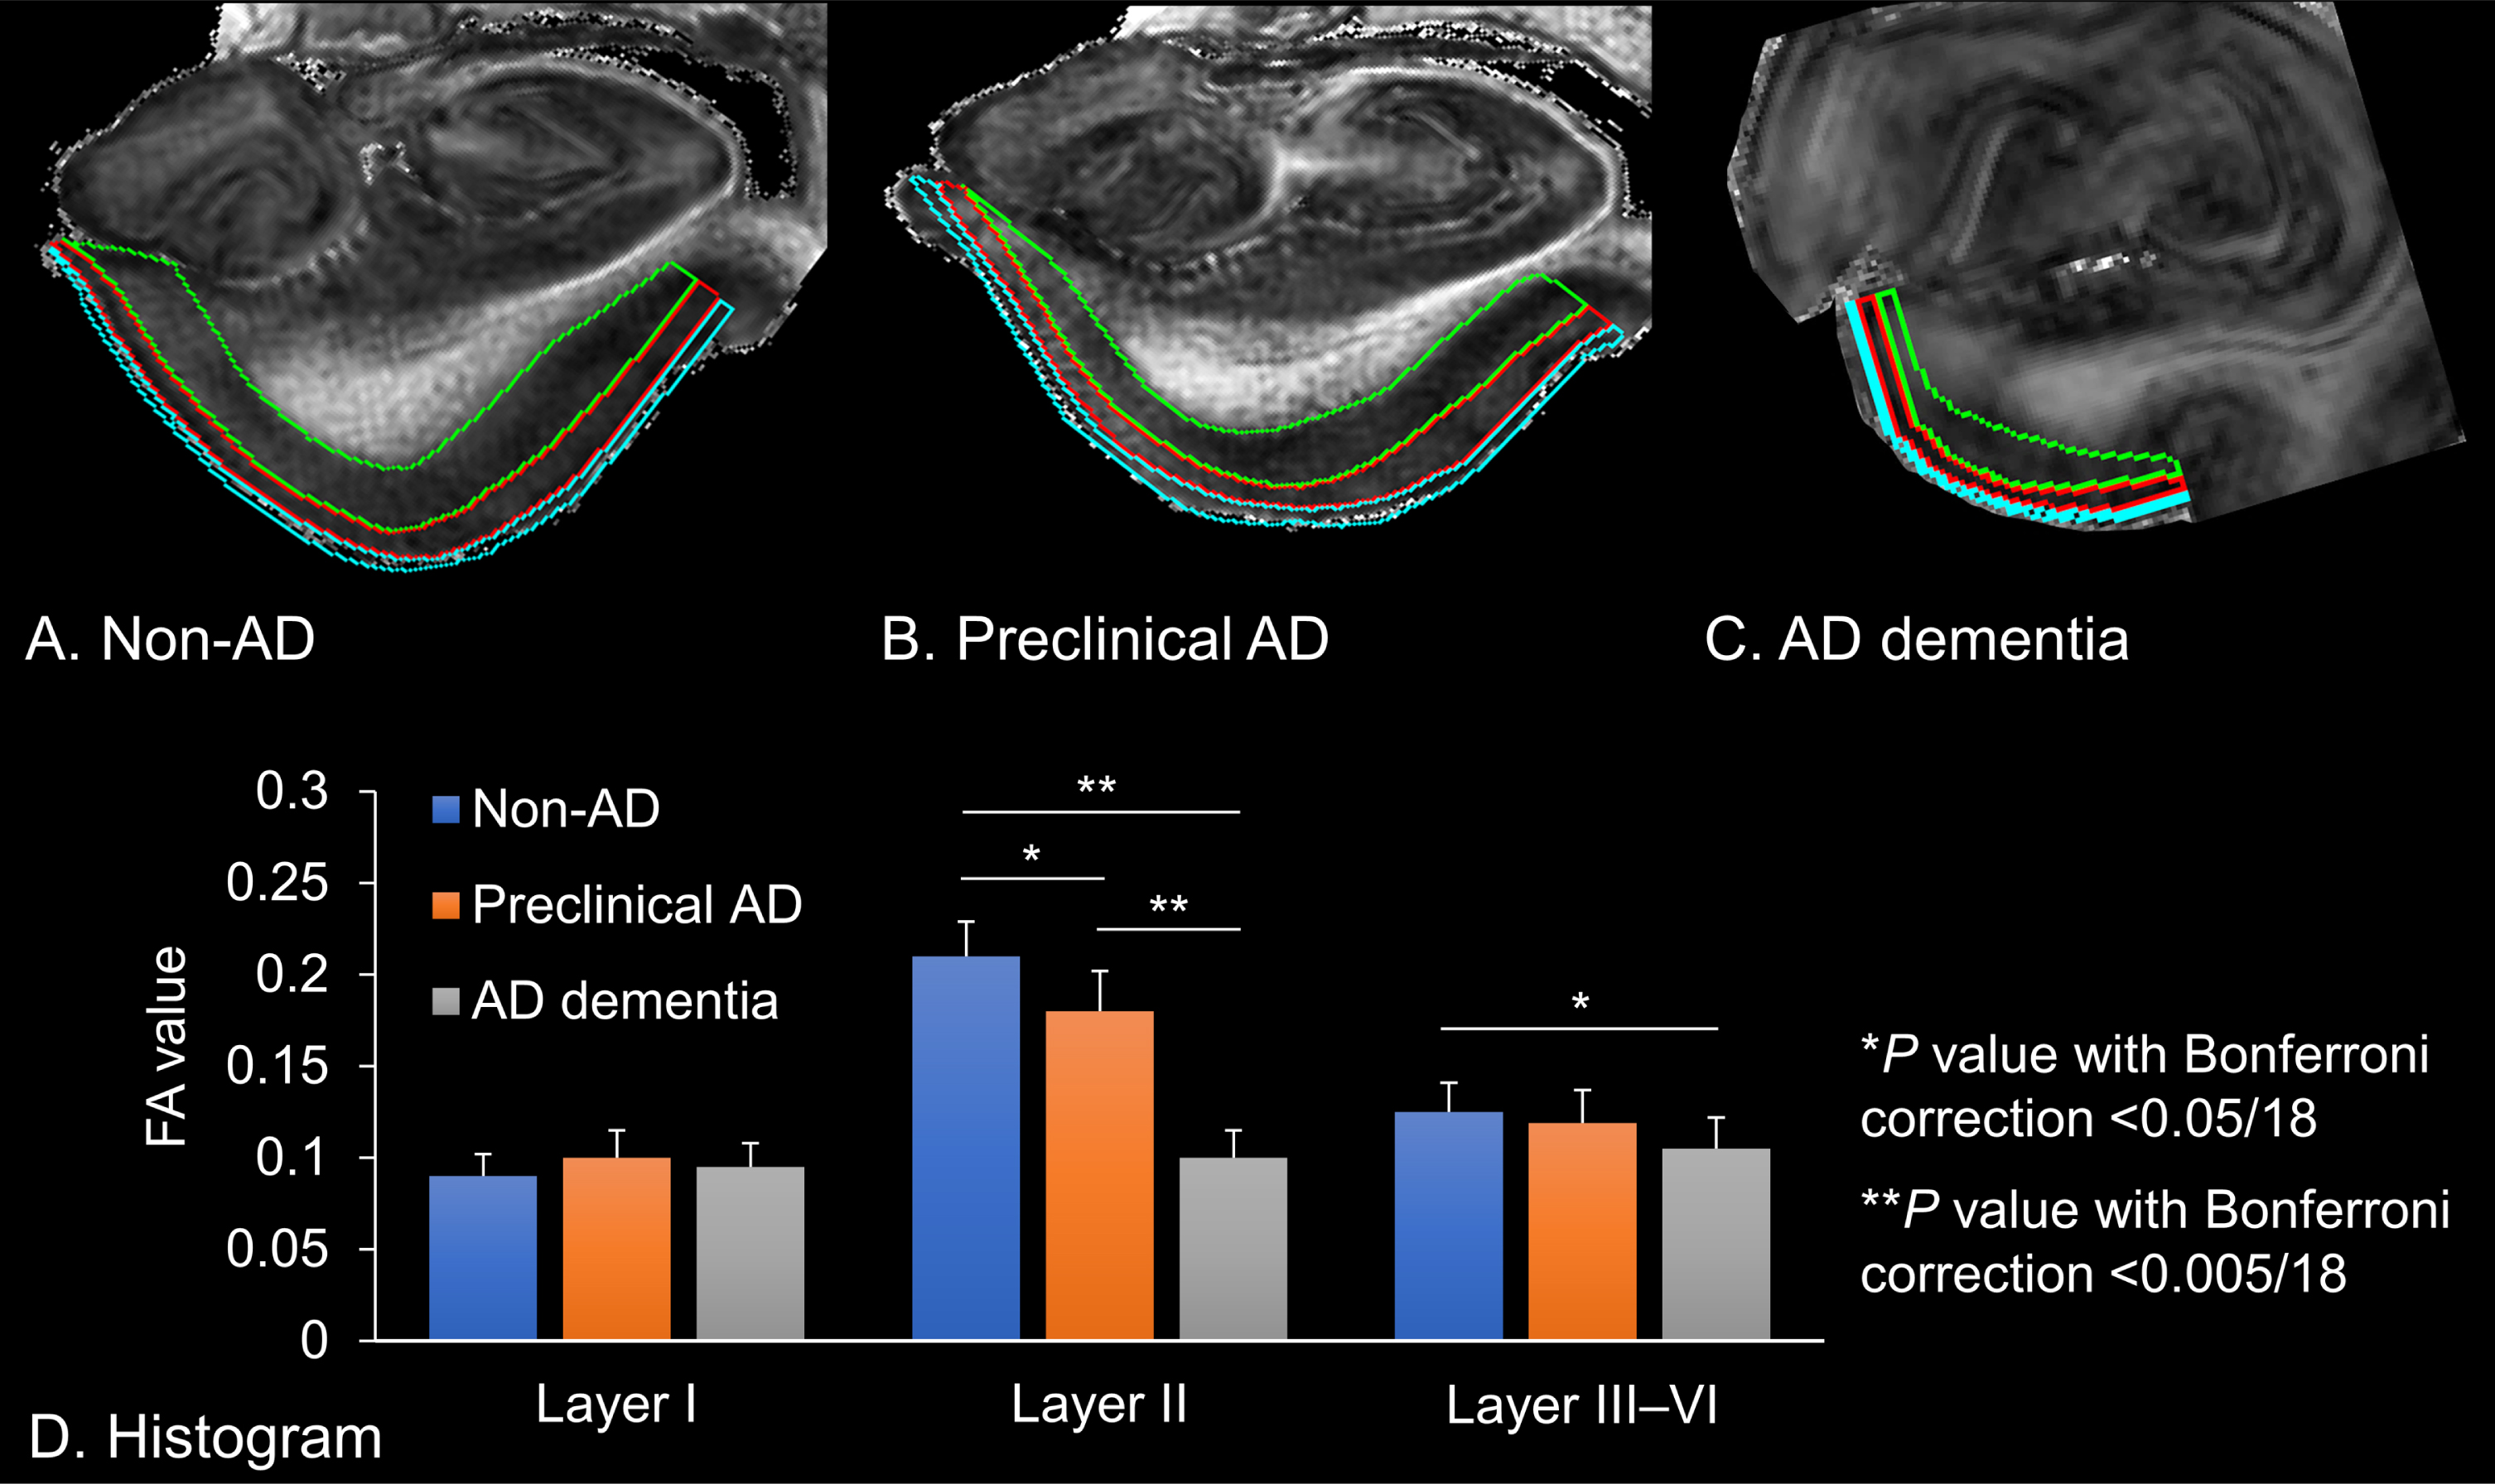
Fractional anisotropy (FA) values extracted from the left entorhinal cortices. A) Non-Alzheimer’s disease (AD) brain tissue, which is delineated for each entorhinal cortex. B) Preclinical AD brain tissue. C) AD dementia brain tissue. Cyan: Layer I, Red: Layer II, Green: Layer III–VI. D) The histogram shows the FA value of each entorhinal lamina. Error bars indicate standard error of the mean. Asterisks denote significant differences between the mean of the FA values (*p value with Bonferroni correction <0.05/18; **p value with Bonferroni correction <0.005/18).
Tract reconstruction
To reconstruct the perforant path fibers, we used the fiber assignment by continuous tracking (FACT) deterministic algorithm [26], which is implemented in the DtiStudio software. An FA threshold of 0.1, an angle threshold of 60°, and a minimum length of five pixels were applied to determine the fiber tract in the native FA space [27]. An OR operation was set on the presubiculum for the first seed point where the myelinated fibers of the perforant pathway were seen on the FA map. The FA map was primarily used as a reference to identify the seed point since its image contrast was comparable to that of the myelin-stained histological section [23]. The corresponding color-coded FA map was also used to guide the placement of the seed points. Then, an AND operation was set on the angular bundle for the second seed point. Following these steps, the perforant path fibers were automatically reconstructed as a tract connecting the entorhinal layer II and the dentate gyrus. Anatomically implausible fibers for a portion of perforant pathway were removed using a NOT operation as an additional step. Finally, the Amira software (Mercury Computer System Inc., San Diego, CA, USA) was used to visualize three-dimensional trajectories of the perforant pathway to the surrounding anatomical structures.
Statistics
Descriptive statistics and graphical displays were performed in each case. To compare the eigen values (FA and MD) extracted from the tensor calculation among the brain tissues (non-AD versus preclinical AD versus AD dementia), one-way analysis of variance (ANOVA) was used with their pixel counts, mean values, and standard deviations. Post hoc tests were performed using Bonferroni correction for multiple comparisons at a p value of <0.05/18 (2×3×3) for each eigen value in three layers among three brain tissues.
RESULTS
Identification of anatomical structures
On microscopic observations, the entorhinal layer II islands and the perforant path fibers showed blue contrasts in LFB&HE, which were clearly visible in non-AD (Fig. 1B) and preclinical AD (Fig. 2A), whereas they were indiscernible in AD dementia (Fig. 2D). Areas of myelinated fibers in the presubiculum and its ratio to the overall area of the presubiculum decreased along the AD continuum (Table 1). These cellular and myeloarchitectural features could be visualized on ex vivo 11.7T diffusion MRI. In non-AD and preclinical AD, the MD map displayed bright patchy intensities in the entorhinal layer II, which were primarily occupied by neuronal-rich islands, and dark striate intensities for fibers of the perforant pathway on the presbiculum (Figs. 1D, 2C). In addition, the FA map displayed a bright lamina in the entorhinal layer II and bright striates for fibers of the perforant pathway on the presbiculum (Figs. 1E, 2B). In contrast, these maps in AD dementia displayed less laminar contrasts, which revealed the demise of the entorhinal layer II islands and perforant path fibers (Fig. 2D, E). The temporal alvear pathway was shown coursing around the hippocampal sulcus where it routed the long way to the hippocampus (Fig. 1F).
Table 1
Anatomical features of the entorhinal layers and the perforant pathway
| Non-AD | Preclinical AD | AD dementia | p | |
| Entorhinal layer I | ||||
| Number of pixels | 315 | 308 | 165 | NA |
| FA value, Mean±SD | 0.092±0.047 | 0.101±0.054 | 0.095±0.048 | 0.077 |
| MD value, Mean±SD, mm2/s×10–3 | 1.21±0.35 | 1.18±0.32 | 1.24±0.41 | 0.198 |
| Entorhinal layer II | ||||
| Number of pixels | 614 | 599 | 312 | NA |
| FA value, Mean±SD | 0.213±0.104 | 0.183±0.091 | 0.104±0.053 | <0.001*, †, ‡ |
| MD value, Mean±SD, mm2/s×10–3 | 1.31±0.55 | 1.28±0.39 | 1.33±0.47 | 0.164 |
| Entorhinal layer III–VI | ||||
| Number of pixels | 1267 | 1145 | 584 | NA |
| FA value, Mean±SD | 0.125±0.061 | 0.119±0.059 | 0.105±0.056 | 0.032† |
| MD value, Mean±SD, mm2/s×10–3 | 1.27±0.32 | 1.25±0.36 | 1.29±0.42 | 0.106 |
| Perforant pathway | ||||
| Area in the presubiculum, mm2×10–3 | 3.89 | 2.33 | 0.61 | NA |
| Ratio of area to the presubiculum | 0.22 | 0.14 | 0.08 | NA |
| Number of fibers | 2865 | 1134 | 103 | NA |
| Mean length of fibers, mm | 4.62 | 4.15 | 0.96 | NA |
| Maximum length of fibers, mm | 9.58 | 9.41 | 5.12 | NA |
| Minimum length of fibers, mm | 0.75 | 0.63 | 0.63 | NA |
Significant differences determined by one-way analysis of variance are indicated with the following letters: *for the comparison between non-AD and preclinical AD with Bonferroni correction (p < 0.05/18). †for the comparison between non-AD and AD dementia with Bonferroni correction (p < 0.05/18). ‡for the comparison between preclinical AD and AD dementia with Bonferroni correction (p < 0.05/18). AD, Alzheimer’s disease; FA, fractional anisotropy; MD, mean diffusivity; NA, not applicable; SD, standard deviation.
Quantitative analysis
Laminar contrasts were seen within the entorhinal cortices at 250μm (zipped to 125μm) isotropic resolution. Then, we delineated the boundary of the entorhinal cortex layers I, II, and III–VI, in which the FA and MD values of each cortical lamina were extracted from the non-AD, preclinical AD, and AD dementia brain tissues (Fig. 3A–C). These microstructural characteristics of the entorhinal layers and the perforant path fibers are listed in Table 1. There were significant differences in the FA values of the entorhinal layer II between pairs of each brain tissue (non-AD versus preclinical AD versus AD dementia; Bonferroni-corrected p < 0.05/18, respectively) and in those of the entorhinal layers III–VI between non-AD and AD dementia. In contrast, there were no significant differences in the MD values among the brain tissues. We also found that the FA value of the entorhinal layer II was the highest among the entorhinal laminae in non-AD and preclinical AD, whereas the FA values were homogeneously low in AD dementia (Fig. 3D).
Fiber tractography
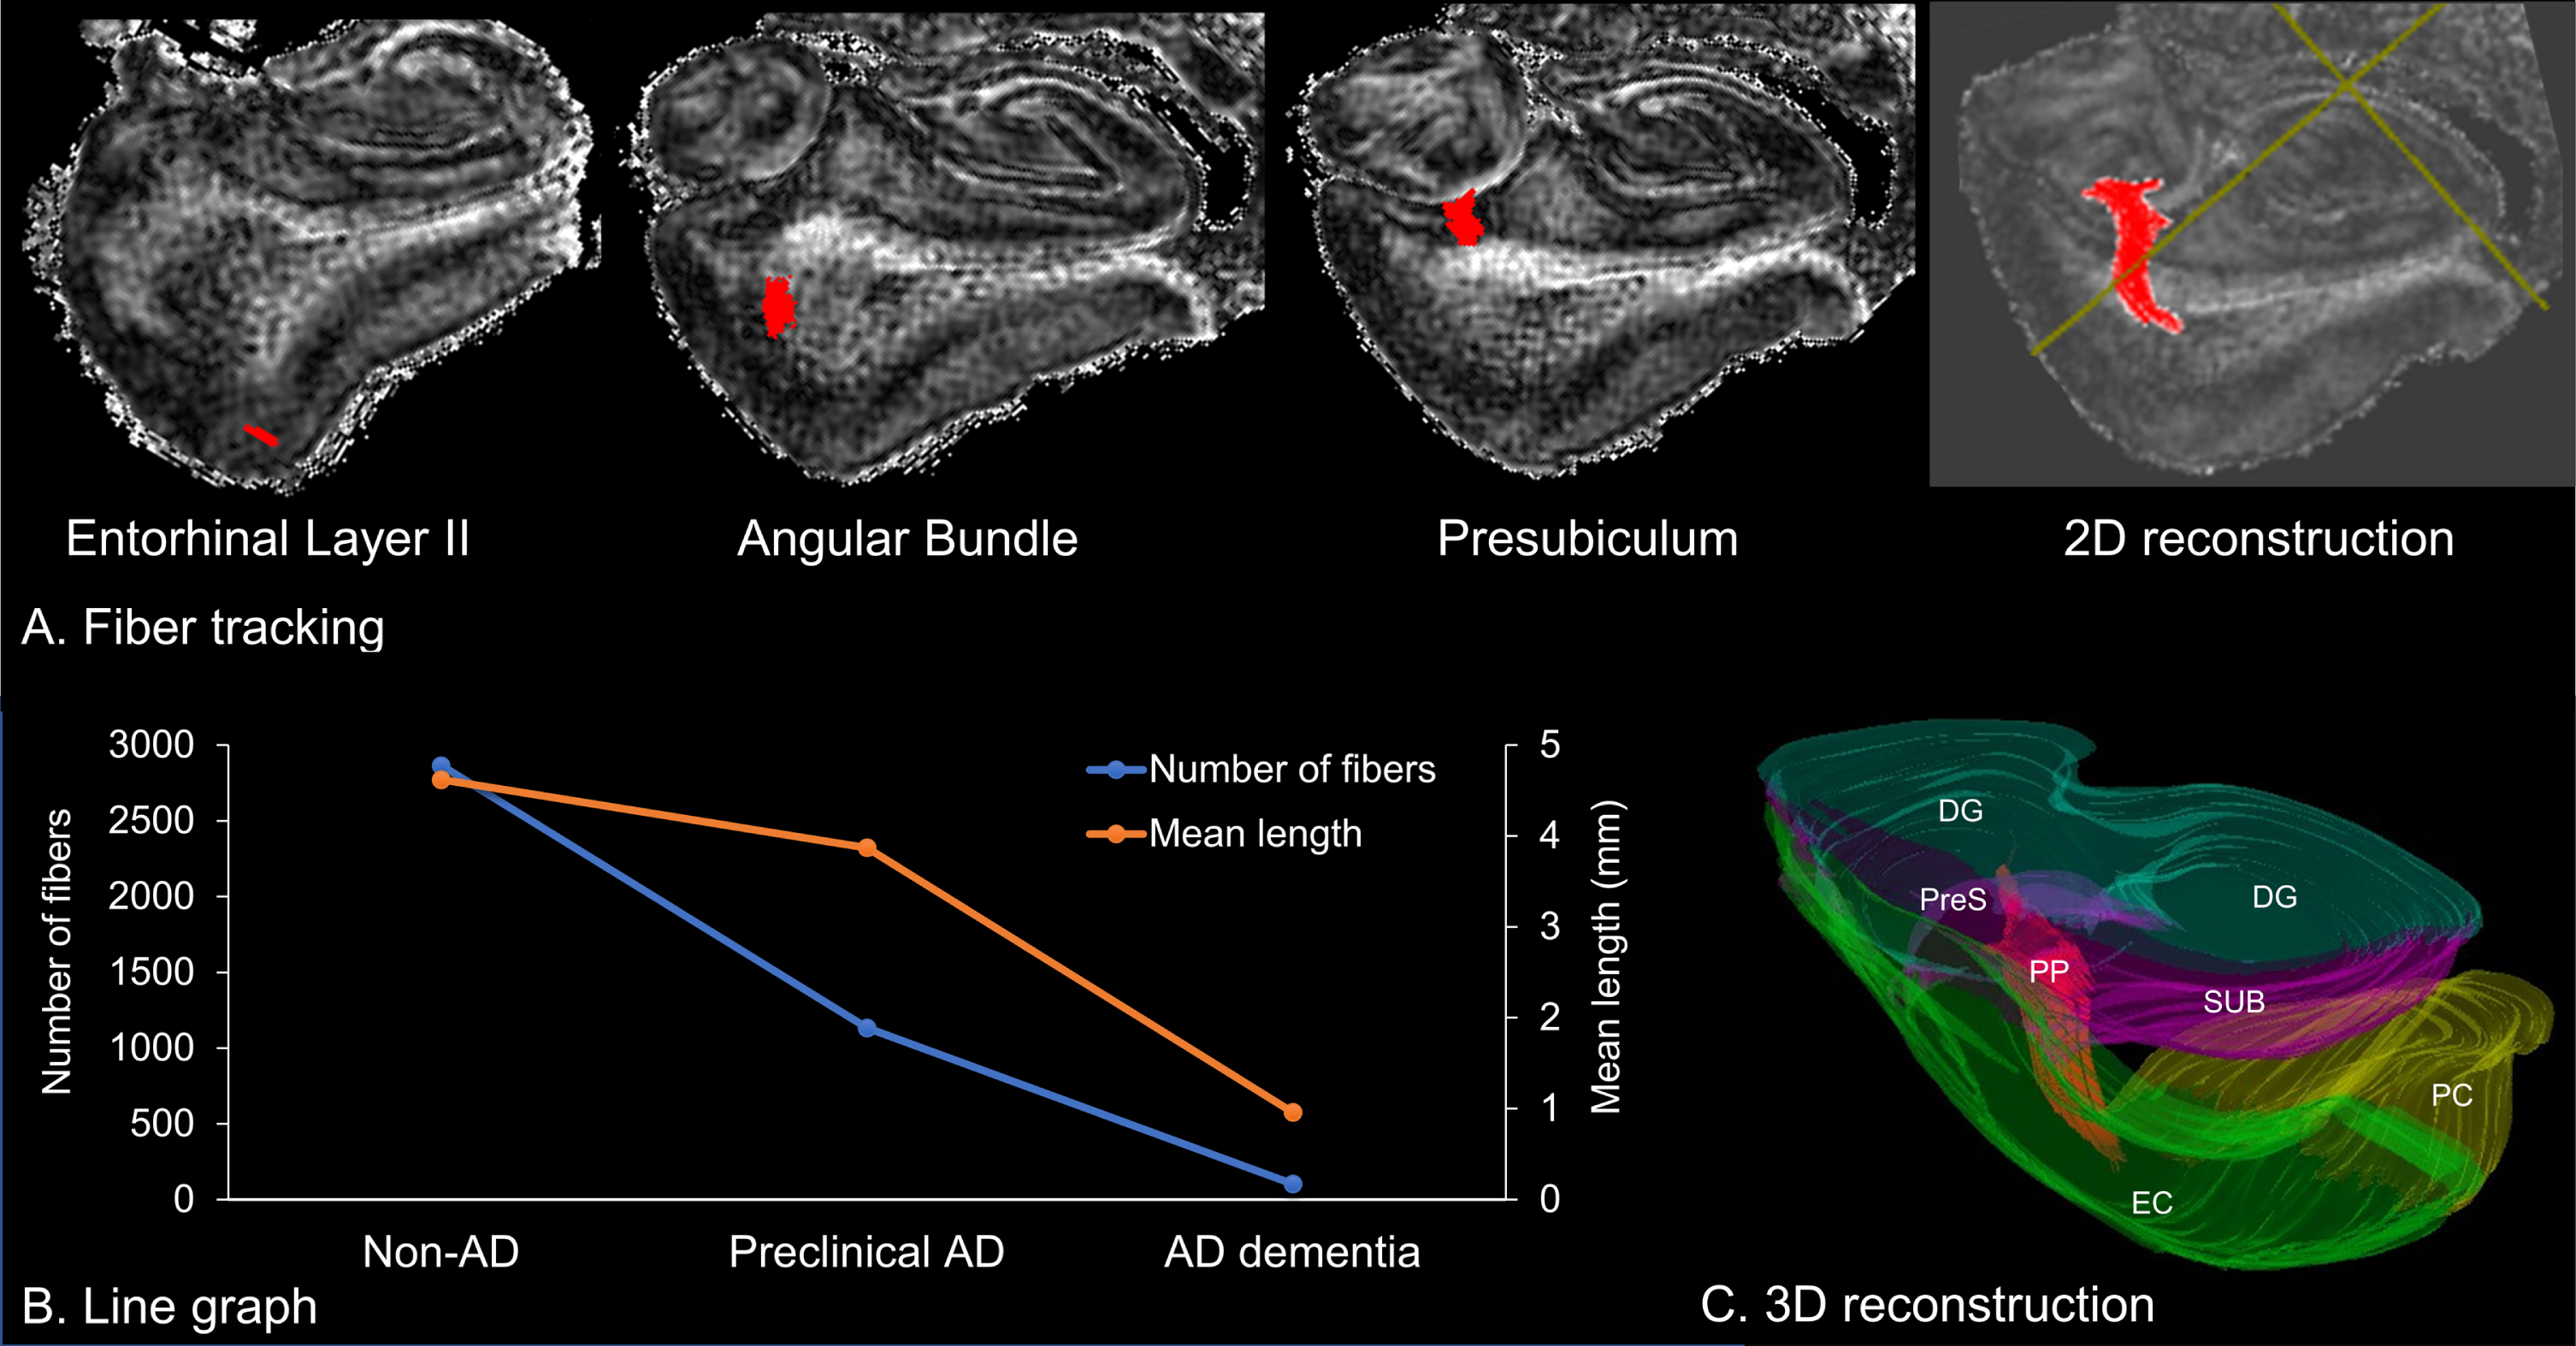
Using the deterministic fiber tractography, the perforant path fibers could be identified in non-AD and preclinical AD (Fig. 4A), but not in AD dementia. Anatomical features of the perforant pathway, including the number and length of fibers, are listed in Table 1. We found that the number of fibers decreased along the AD continuum, whereas the mean length of fibers comparatively preserved in preclinical AD (Fig. 4B). Finally, the three-dimensional tractography could reproduce the previously reported trajectories of the perforant pathway [16, 28], which aids in understanding the stereoscopic architecture of fibers to the surrounding anatomical structures (Fig. 4C).
Fig. 4
Fiber tractography of the perforant pathway. A) Two-dimensional (2D) reconstruction of the perforant pathway, which originates from the entorhinal layer II and projects to the hippocampus through the angular bundle and the presubiculum. B) Line graph of the number and mean length of fibers. C) Three-dimensional (3D) reconstruction of fibers to the surrounding anatomical structures. DG, dentate gyrus; EC, entorhinal cortex; PC perirhinal cortex; PP, perforant pathway; PreS, presubiculum; SUB, subiculum.
DISCUSSION
In the present study, we applied ex vivo 11.7T diffusion MRI with submillimeter resolution to distinguish the entorhinal cortex layers I, II, and III–VI and to visualize the perforant path fibers in postmortem human brain tissues along the AD continuum. Then, we quantified the structural and connectivity properties of the entorhinal laminae and the perforant path fibers, which were validated by subsequent serial histological examinations. To the best of our knowledge, this study is the first to reveal that changes in diffusion MRI metrics, such as decreased FA values in the entorhinal layer II and a decreased number of fibers of the perforant pathway, could result from histologically confirmed neurodegeneration of the entorhinal-hippocampal pathway seen in the AD continuum, including preclinical AD.
Pathological changes in AD begin silently many years before the onset of cognitive decline [29]. This long “preclinical stage” provides us with an opportunity for timely therapeutic and preventive interventions; therefore, tools that can diagnose the preclinical stage of AD are needed. In 2011, the NIA-AA proposed guidelines by which to identify preclinical AD patients who were not cognitively impaired but who had abnormal AD biomarkers [30]. Advances in biomarker research over the last decade [3] led to the proposal of research criteria with which to identify biomarker-defined preclinical AD [2]. Thus, AD is now regarded as a biological and clinical continuum that covers both asymptomatic and symptomatic individuals with evidence of AD pathological changes [31].
Our results showed that FA values of the entorhinal layer II were the highest among the entorhinal laminae in non-AD and preclinical AD. The entorhinal layer II is primarily occupied by neuronal-rich islands, surrounded by neuron-sparse inter-islands [4]. In addition, myelinated fibers in the perforant pathway originate from the entorhinal layer II islands and densely exist in this layer [7]. We speculate that myelinated fibers within neuron-sparse inter-islands might reflect an increased degree of anisotropy of water molecules, resulting in high FA values (Supplementary Figure 3). During disease progression, mild neuronal cell loss in the entorhinal layer II has been microscopically observed from the preclinical stage of AD [32], which may cause decreased FA values due to the enlarged neuron-sparse inter-islands. Finally, the demise of entorhinal neurons and perforant path fibers in AD dementia diminished laminar contrasts, resulting in homogeneously low FA values. The current application of ex vivo diffusion MRI at 250μm isotropic (zipped to 125μm) resolution could quantify these changes in cortical laminar substructures.
The reason that our results showed significant differences along the AD continuum only in the FA values of the entorhinal layer II, but not in the MD values, remains unclear. One possibility is the variability in MD values during the pathological process of the AD continuum. At the preclinical stage, gliosis and myelin repair can cause diffusion restrictions of water molecules, resulting in decreased MD values [33], whereas increased MD values have been seen in the entorhinal cortex due to severe neuronal cell loss in AD dementia [34]. Indeed, there was a tendency toward lower MD in preclinical AD and higher MD in AD dementia, compared to non-AD (Table 1). The MD value obtained from the tensor model might oversimplify such temporal changes along the AD continuum, and therefore, might not be sensitive enough to differentiate non-AD, preclinical AD, and AD dementia. Meanwhile, scalar measures obtained from the non-tensor model that allow quantification of detailed microscopic anatomical features, including fiber density and fiber bundle cross-section, can be useful in deciphering the disease progression during early AD [35]. Nevertheless, our results derived from a diffusion tensor imaging with submillimeter resolution demonstrated its feasibility to quantify histopathological findings.
In addition to FA and MD values, we measured the number and length of fibers of the perforant pathway from streamlines created by tractography, which is determined with FA thresholding [26]. A decreased number of fibers in the process of AD pathogenesis has been generally interpreted as the result of demyelination of axonal structures, or axonal degeneration, or both [34, 36]. However, it should be noted that diffusion MRI does not image axons directly, but reflects only indirect properties based on the diffusion of water molecules. To overcome this biological non-specificity, we demonstrated that decreased areas of myelinated fibers measured by histological analysis were compatible with the number of fibers counted by tractography. Furthermore, the reconstructed trajectories of the perforant pathway in the present study were comparable to the trajectory visualized by polarized light microscopy in the human hippocampus ex vivo, indicating that the tractography methodology used in this study was valid. Compared to the number of fibers, the length of fibers of the perforant pathway preserved in preclinical AD, but intensively shortened in AD dementia (Fig. 4B). Another tractography study also showed both decreased number and length of fibers in symptomatic AD [36]. In addition, the lower the FA value of the perforant pathway, the lower the episodic memory function was before the entorhinal atrophic changes [9]. These results suggested the potential of diffusion MRI as a tool with which to predict transition from asymptomatic to symptomatic AD.
Caution should be exercised when interpreting our results as an AD-specific neurodegeneration. Considering the age-dependent degradation of the perforant pathway [9], the findings might reflect both AD- and age-related neurodegeneration. To account for the effects of aging, age-matched brain tissues in cognitively unimpaired individuals with and without AD pathological changes should have been examined. However, amyloid plaques and neurofibrillary tangles, the pathological hallmarks of AD, are commonly observed in postmortem histological examinations for older individuals even with clinically normal cognition, reaching an occurrence of almost 100% in the oldest (>90 years) [37]. Based on this prevalence of AD pathology, it would be necessary to adjust for the effects of aging in the study design and analysis phases. For the acquisition of reliable samples, a longitudinal study for cognitively unimpaired individuals with and without abnormal AD biomarkers is needed to test whether the diffusion MRI findings in the entorhinal-hippocampal pathway can be used as AD-specific neurodegenerative biomarkers.
In this study, we opted for a deterministic methodology for three primary reasons. First, the primary objective was to enhance spatial resolution to precisely depict cortical substructures and intricate fiber anatomy. Despite the benefits of a probabilistic approach in augmenting within-voxel information, the downside is the need for a higher b-value, leading to a reduced signal-to-noise ratio (SNR) [38]. This lower SNR necessitates decreased spatial resolution, an extended scan time, or both. Furthermore, the approach calls for a higher angular resolution, which results in an even more prolonged scan time. Second, we utilized the gold standard of histological observation to affirm the consistency of the tracts with those found in myelin-stained sections. Third, the resolution of our ex vivo scans (0.25 mm cube) was significantly higher than that of standard in vivo scans (approximately 1.5–2.5 mm cube), diminishing the likelihood of multiple fiber bundles being included within each voxel. For these reasons, we favored a deterministic approach over a probabilistic one and were able to discern the perforant path fibers in harmony with the histological observations. However, we also acknowledge that probabilistic tracking might be suitable for exploring anatomical areas with dense crossing fibers, as previously reported [39].
Considerable technical advances will be needed to promote efficient translation of the ex vivo MRI experiments into in vivo MRI clinical research. It is difficult to measure FA values using in vivo diffusion MRI with submillimeter resolution due to distortion artifacts and time-consuming scans in a clinical scanner. A practical solution is to make use of phase image contrasts acquired from multi-echo gradient echo sequences because the contrasts in diffusion MRI and relaxation-based MRI, such as T1- and T2-weighted images, are insufficient to distinguish the entorhinal laminae in vivo [40]. An ultra-high-field gradient echo-derived susceptibility tensor imaging could be utilized as a clinical application alternative to diffusion tensor imaging and will be of benefit because of its ability to reconstruct microstructural fibers with high spatial resolution [41].
The present study has several limitations. This proof-of-concept study was based on a limited number of brain specimens. As a result, we could not estimate the effects of various biological factors, such as age and sex. In addition, the procedures utilized for tissue preparation, such as the use of gadopentetate dimeglumine and variations in the duration of formaldehyde fixation, could have potentially influenced MRI metrics and thereby introduced confounding factors into the results. For instance, a study conducted by Dawe et al. discovered that the effect of fixation on T2 values in the deep brain region was significant for up to 50 days, but plateaued after 100 days [42]. In another study, Shatil et al. found that formaldehyde fixation significantly affected T1 and T2 relaxation times, but did not influence FA and MD values [43]. Furthermore, the impact of formaldehyde fixation on brains from different age groups remains unexplored. Finally, the influence of FA thresholding and crossing fibers within each voxel should be noted for the quantification of the number of perforant path fibers, especially where the angular bundle has highly mixed fiber orientations [44].
Conclusion
Ex vivo ultra-high-field diffusion MRI with submillimeter resolution was capable of quantifying microstructural alterations along the AD continuum, such as decreased FA values in the entorhinal layer II and a decreased number of fibers of the perforant pathway. The MRI findings were validated by subsequent serial histological examinations. These results advance our understanding of the microstructural neurodegeneration in the entorhinal-hippocampal pathway during the pathological process of AD and open an avenue for the development of neurodegenerative biomarkers for preclinical AD.
ACKNOWLEDGMENTS
We thank Ms. Mary McAllister for her help with manuscript editing.
FUNDING
Some of the results presented here were the result of studies funded by grants from the Johns Hopkins University Alzheimer’s Disease Research Center P30AG066507 and Biomarkers for Older Controls at Risk for Dementia AG033655 to JCT and the National Institutes of Health - National Institute of Neurological Disorders and Stroke R01NS086888 to SM.
CONFLICT OF INTEREST
SM is one of the co-founders of AnatomyWorks and Corporate M. SM is CEO and KOi is a consultant of AnatomyWorks. These arrangements are being managed by the Johns Hopkins University in accordance with its conflict-of-interest policies. YU, KOn, ZH, and JCT declare no competing financial interests.
DATA AVAILABILITY
The data supporting the findings of this study are available within the article and/or its supplementary material.
SUPPLEMENTARY MATERIAL
[1] The supplementary material is available in the electronic version of this article: https://dx.doi.org/10.3233/JAD-230452.
REFERENCES
[1] | Jack CR Jr, Knopman DS , Jagust WJ , Petersen RC , Weiner MW , Aisen PS , Shaw LM , Vemuri P , Wiste HJ , Weigand SD , Lesnick TG , Pankratz VS , Donohue MC , Trojanowski JQ ((2013) ) Tracking pathophysiological processes in Alzheimer’s disease: An updated hypothetical model of dynamic biomarkers. Lancet Neurol 12: , 207–216. |
[2] | Jack CR Jr, Bennett DA , Blennow K , Carrillo MC , Dunn B , Haeberlein SB , Holtzman DM , Jagust W , Jessen F , Karlawish J , Liu E , Molinuevo JL , Montine T , Phelps C , Rankin KP , Rowe CC , Scheltens P , Siemers E , Snyder HM , Sperling R , Contributors ((2018) ) NIA-AA Research Framework: Toward a biological definition of Alzheimer’s disease. Alzheimers Dement 14: , 535–562. |
[3] | Mattsson-Carlgren N , Andersson E , Janelidze S , Ossenkoppele R , Insel P , Strandberg O , Zetterberg H , Rosen HJ , Rabinovici G , Chai X , Blennow K , Dage JL , Stomrud E , Smith R , Palmqvist S , Hansson O ((2020) ) Aβ deposition is associated with increases in soluble and phosphorylated tau that precede a positive Tau PET in Alzheimer’s disease. Sci Adv 6: , eaaz2387. |
[4] | Braak H , Braak E ((1995) ) Staging of Alzheimer’s disease-related neurofibrillary changes. Neurobiol Aging 16: , 271–278; discussion 278-284. |
[5] | Shah A , Jhawar SS , Goel A ((2012) ) Analysis of the anatomy of the Papez circuit and adjoining limbic system by fiber dissection techniques. J Clin Neurosci 19: , 289–298. |
[6] | Braak H , Braak E ((1991) ) Neuropathological stageing of Alzheimer-related changes. Acta Neuropathol 82: , 239–259. |
[7] | Witter MP ((2007) ) The perforant path: Projections from the entorhinal cortex to the dentate gyrus. Prog Brain Res 163: , 43–61. |
[8] | Hyman BT , Van Hoesen GW , Damasio AR , Barnes CL ((1984) ) Alzheimer’s disease: Cell-specific pathology isolates the hippocampal formation. Science 225: , 1168–1170. |
[9] | Yassa MA , Muftuler LT , Stark CE ((2010) ) Ultrahigh-resolution microstructural diffusion tensor imaging reveals perforant path degradation in aged humans in vivo. Proc Natl Acad Sci U S A 107: , 12687–12691. |
[10] | Oishi K , Mielke MM , Albert M , Lyketsos CG , Mori S ((2011) ) DTI analyses and clinical applications in Alzheimer’s disease. J Alzheimers Dis 26: (Suppl 3), 287–296. |
[11] | Kalus P , Slotboom J , Gallinat J , Mahlberg R , Cattapan-Ludewig K , Wiest R , Nyffeler T , Buri C , Federspiel A , Kunz D , Schroth G , Kiefer C ((2006) ) Examining the gateway to the limbic system with diffusion tensor imaging: The perforant pathway in dementia. Neuroimage 30: , 713–720. |
[12] | Benes FM ((1989) ) Myelination of cortical-hippocampal relays during late adolescence. Schizophr Bull 15: , 585–593. |
[13] | Assaf Y ((2019) ) Imaging laminar structures in the gray matter with diffusion MRI. Neuroimage 197: , 677–688. |
[14] | Augustinack JC , van der Kouwe AJ , Blackwell ML , Salat DH , Wiggins CJ , Frosch MP , Wiggins GC , Potthast A , Wald LL , Fischl BR ((2005) ) Detection of entorhinal layer II using 7Tesla [corrected] magnetic resonance imaging. Ann Neurol 57: , 489–494. |
[15] | Augustinack JC , Magnain C , Reuter M , van der Kouwe AJ , Boas D , Fischl B ((2014) ) MRI parcellation of ex vivo medial temporal lobe. Neuroimage 93: (Pt 2), 252–259. |
[16] | Augustinack JC , Helmer K , Huber KE , Kakunoori S , Zollei L , Fischl B ((2010) ) Direct visualization of the perforant pathway in the human brain with ex vivo diffusion tensor imaging. Front Hum Neurosci 4: , 42. |
[17] | Montine TJ , Phelps CH , Beach TG , Bigio EH , Cairns NJ , Dickson DW , Duyckaerts C , Frosch MP , Masliah E , Mirra SS , Nelson PT , Schneider JA , Thal DR , Trojanowski JQ , Vinters HV , Hyman BT ((2012) ) National Institute on Aging-Alzheimer’s Association guidelines for the neuropathologic assessment of Alzheimer’s disease: A practical approach. Acta Neuropathol 123: , 1–11. |
[18] | D’Arceuil HE , Westmoreland S , de Crespigny AJ ((2007) ) An approach to high resolution diffusion tensor imaging in fixed primate brain. Neuroimage 35: , 553–565. |
[19] | Aggarwal M , Mori S , Shimogori T , Blackshaw S , Zhang J ((2010) ) Three-dimensional diffusion tensor microimaging for anatomical characterization of the mouse brain. Magn Reson Med 64: , 249–261. |
[20] | Jiang H , van Zijl PC , Kim J , Pearlson GD , Mori S ((2006) ) DtiStudio: Resource program for diffusion tensor computation and fiber bundle tracking. Comput Methods Programs Biomed 81: , 106–116. |
[21] | Haynor DR , Li Y , Jiang H , Mori S , Ourselin S (2012) Medical Imaging 2012: Image Processing. |
[22] | Li Y , Shea SM , Lorenz CH , Jiang H , Chou MC , Mori S ((2013) ) Image corruption detection in diffusion tensor imaging for post-processing and real-time monitoring. PLoS One 8: , e49764. |
[23] | Oishi K , Mori S , Troncoso JC , Lenz FA ((2020) ) Mapping tracts in the human subthalamic area by 11.7T ex vivo diffusion tensor imaging. Brain Struct Funct 225: , 1293–1312. |
[24] | Kellner E , Dhital B , Kiselev VG , Reisert M ((2016) ) Gibbs-ringing artifact removal based on local subvoxel-shifts. Magn Reson Med 76: , 1574–1581. |
[25] | Tournier JD , Smith R , Raffelt D , Tabbara R , Dhollander T , Pietsch M , Christiaens D , Jeurissen B , Yeh CH , Connelly A ((2019) ) MRtrix3: A fast, flexible and open software framework for medical image processing and visualisation. Neuroimage 202: , 116137. |
[26] | Mori S , Crain BJ , Chacko VP , van Zijl PC ((1999) ) Three-dimensional tracking of axonal projections in the brain by magnetic resonance imaging. Ann Neurol 45: , 265–269. |
[27] | Mori S , Kageyama Y , Hou Z , Aggarwal M , Patel J , Brown T , Miller MI , Wu D , Troncoso JC ((2017) ) Elucidation of white matter tracts of the human amygdala by detailed comparison between high-resolution postmortem magnetic resonance imaging and histology. Front Neuroanat 11: , 16. |
[28] | Zeineh MM , Palomero-Gallagher N , Axer M , Grassel D , Goubran M , Wree A , Woods R , Amunts K , Zilles K ((2017) ) Direct visualization and mapping of the spatial course of fiber tracts at microscopic resolution in the human hippocampus. Cereb Cortex 27: , 1779–1794. |
[29] | Scheltens P , De Strooper B , Kivipelto M , Holstege H , Chételat G , Teunissen CE , Cummings J , van der Flier WM ((2021) ) Alzheimer’s disease. Lancet 397: , 1577–1590. |
[30] | Sperling RA , Aisen PS , Beckett LA , Bennett DA , Craft S , Fagan AM , Iwatsubo T , Jack CR Jr., Kaye J , Montine TJ , Park DC , Reiman EM , Rowe CC , Siemers E , Stern Y , Yaffe K , Carrillo MC , Thies B , Morrison-Bogorad M , Wagster MV , Phelps CH ((2011) ) Toward defining the preclinical stages of Alzheimer’s disease: Recommendations from the National Institute on Aging-Alzheimer’s Association workgroups on diagnostic guidelines for Alzheimer’s disease. Alzheimers Dement 7: , 280–292. |
[31] | Aisen PS , Cummings J , Jack CR Jr, Morris JC , Sperling R , Frolich L , Jones RW , Dowsett SA , Matthews BR , Raskin J , Scheltens P , Dubois B ((2017) ) On the path to 2025: Understanding the Alzheimer’s disease continuum. Alzheimers Res Ther 9: , 60. |
[32] | Arendt T , Bruckner MK , Morawski M , Jager C , Gertz HJ ((2015) ) Early neurone loss in Alzheimer’s disease: Cortical or subcortical? Acta Neuropathol Commun 3: , 10. |
[33] | Benitez A , Jensen JH , Thorn K , Dhiman S , Fountain-Zaragoza S , Rieter WJ , Spampinato MV , Hamlett ED , Nietert PJ , Falangola MF , Helpern JA ((2022) ) Greater diffusion restriction in white matter in preclinical Alzheimer disease. Ann Neurol 91: , 864–877. |
[34] | Rose SE , Janke AL , Chalk JB ((2008) ) Gray and white matter changes in Alzheimer’s disease: A diffusion tensor imaging study. J Magn Reson Imaging 27: , 20–26. |
[35] | Mito R , Raffelt D , Dhollander T , Vaughan DN , Tournier JD , Salvado O , Brodtmann A , Rowe CC , Villemagne VL , Connelly A ((2018) ) Fibre-specific white matter reductions in Alzheimer’s disease and mild cognitive impairment. Brain 141: , 888–902. |
[36] | Gao J , Cheung RT , Lee TM , Chu LW , Chan YS , Mak HK , Zhang JX , Qiu D , Fung G , Cheung C ((2011) ) Possible retrogenesis observed with fiber tracking: An anteroposterior pattern of white matter disintegrity in normal aging and Alzheimer’s disease. J Alzheimers Dis 26: , 47–58. |
[37] | Kok E , Haikonen S , Luoto T , Huhtala H , Goebeler S , Haapasalo H , Karhunen PJ ((2009) ) Apolipoprotein E-dependent accumulation of Alzheimer disease-related lesions begins in middle age. Ann Neurol 65: , 650–657. |
[38] | Khalsa S , Mayhew SD , Chechlacz M , Bagary M , Bagshaw AP ((2014) ) The structural and functional connectivity of the posterior cingulate cortex: Comparison between deterministic and probabilistic tractography for the investigation of structure-function relationships. Neuroimage 102: (Pt 1), 118–127. |
[39] | Moldrich RX , Pannek K , Hoch R , Rubenstein JL , Kurniawan ND , Richards LJ ((2010) ) Comparative mouse brain tractography of diffusion magnetic resonance imaging. Neuroimage 51: , 1027–1036. |
[40] | Duyn JH , van Gelderen P , Li TQ , de Zwart JA , Koretsky AP , Fukunaga M ((2007) ) High-field MRI of brain cortical substructure based on signal phase. Proc Natl Acad Sci U S A 104: , 11796–11801. |
[41] | Liu C ((2010) ) Susceptibility tensor imaging. Magn Reson Med 63: , 1471–1477. |
[42] | Dawe RJ , Bennett DA , Schneider JA , Vasireddi SK , Arfanakis K ((2009) ) Postmortem MRI of human brain hemispheres: T2 relaxation times during formaldehyde fixation. Magn Reson Med 61: , 810–818. |
[43] | Shatil AS , Uddin MN , Matsuda KM , Figley CR ((2018) ) Quantitative ex vivo MRI changes due to progressive formalin fixation in whole human brain specimens: Longitudinal characterization of diffusion, relaxometry, and myelin water fraction measurements at 3T. Front Med (Lausanne) 5: , 31. |
[44] | Budde MD , Annese J ((2013) ) Quantification of anisotropy and fiber orientation in human brain histological sections. Front Integr Neurosci 7: , 3. |


