
Tau Loss of Function, by Deletion or Aggregation, Contributes to Peripheral Insulin Resistance
Abstract
Background:
Several epidemiological data revealed an association between Alzheimer’s disease (AD) and type 2 diabetes. Researchers concentrated on brain insulin resistance with little emphasis on the link between systemic insulin resistance and AD, despite the fact that the incidence of type 2 diabetes is higher in AD patients and that impairment in insulin signaling is a risk factor for AD.
Objective:
The goal of this study is to determine the role of systemic insulin resistance in the pathogenesis of Alzheimer’s disease by evaluating the consequences of tau loss-of-function on peripheral insulin sensitivity.
Methods:
Primary hepatocytes isolated from transgenic mouse models (Tau KO, P301 L) and wild type mice (C57BL/6) were evaluated for their insulin sensitivity using glucose uptake assays as well as biochemical analysis of insulin signaling markers.
Results:
Our data show that tau deletion or loss of function promotes peripheral insulin resistance as seen in primary hepatocytes isolated from Tau KO and P301 L mice, respectively. Furthermore, exposure of wild-type primary hepatocytes to sub-toxic concentrations of tau oligomers results in a dose-dependent inhibition of glucose uptake, associated with downregulation of insulin signaling. Tau oligomers-induced inactivation of insulin signaling proteins was rescued by inhibition of p38 MAPK, suggesting the involvement of p38 MAPK.
Conclusions:
This is the first study testing tau role in peripheral insulin resistance at the cellular level using multiple transgenic mouse models. Moreover, this study suggests that tau should be functional for insulin sensitivity, therefore, any loss of function by deletion or aggregation would result in insulin resistance.
INTRODUCTION
An estimated 6.7 million Americans aged 65 and older have Alzheimer’s disease (AD), the most common type of dementia. Several epidemiological data revealed an association between AD and type 2 diabetes (T2D) [1–5]. Brains from AD patients showed downregulation of insulin signaling [6–13], and impaired glucose metabolism and insulin signaling has been shown in AD patients and animal models of AD [7, 8, 22, 14–21]. Therefore, it is hypothesized that the brain and the systemic metabolic homeostasis are inter-connected and influence the development of AD [23].
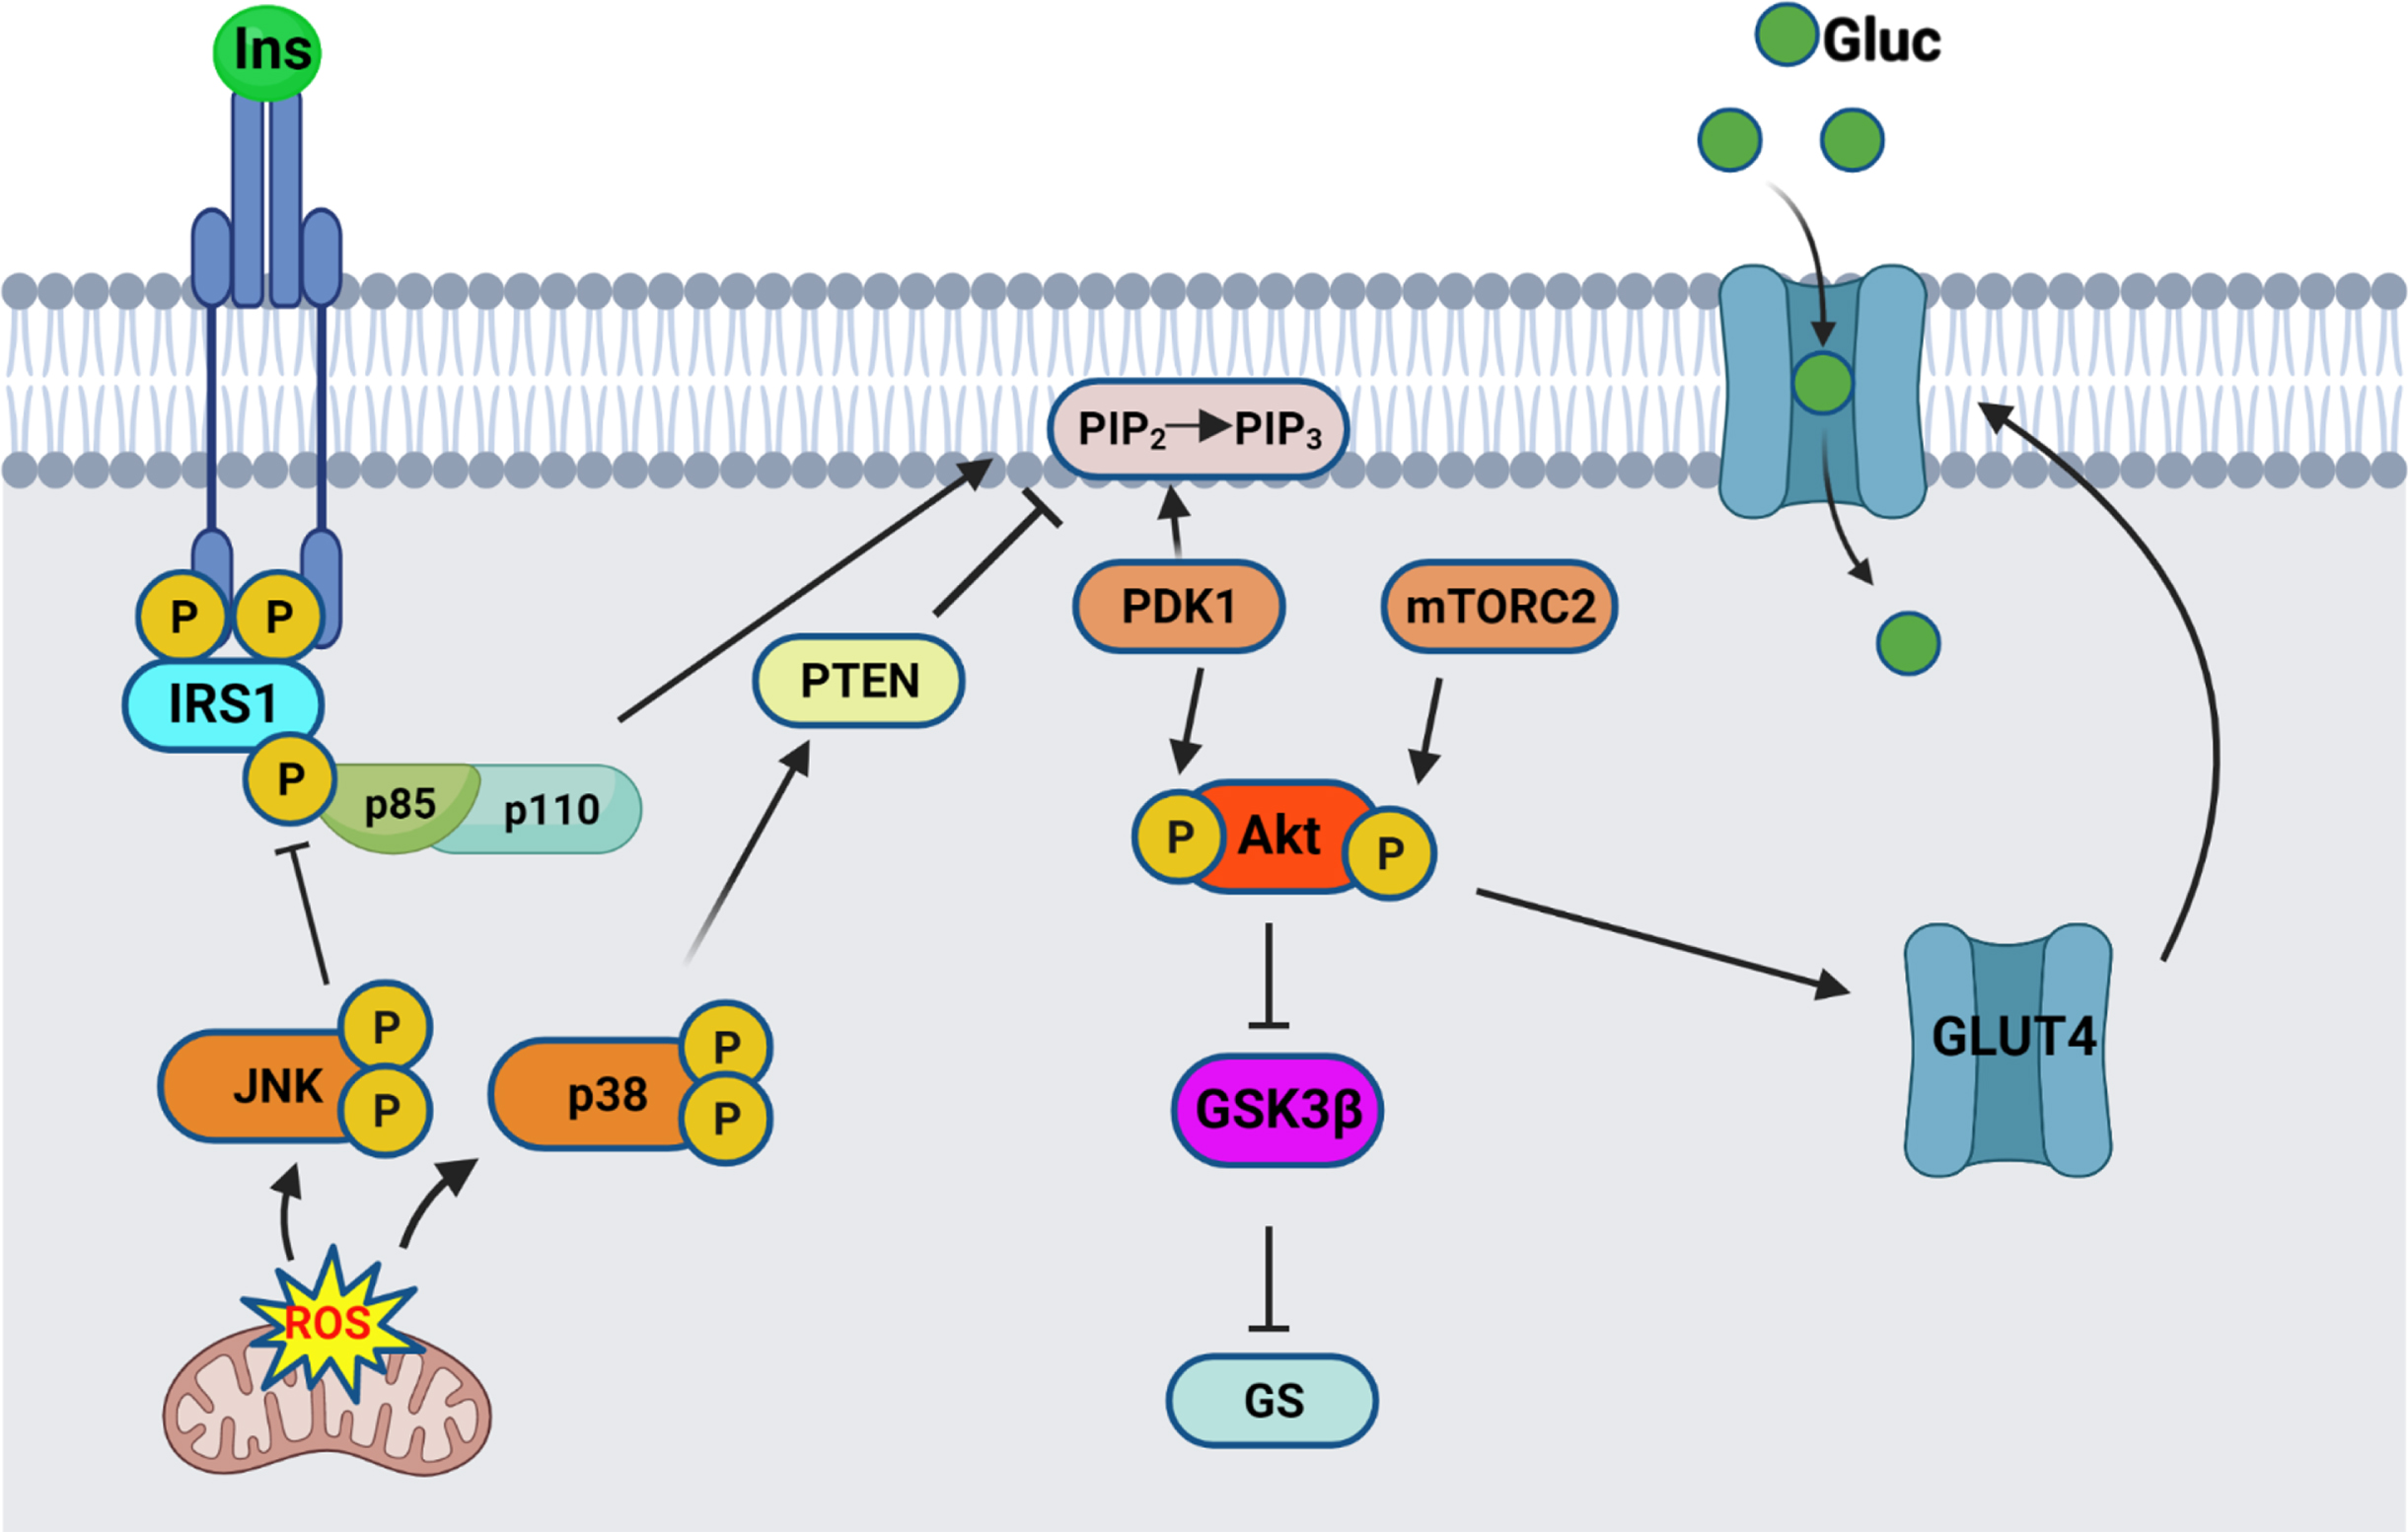
Insulin signaling originates at the insulin receptor, where binding of insulin to the extracellular α-subunit of the transmembrane insulin receptor (IR) activates a rapid autophosphorylation of specific intracellular tyrosine residues in the β subunit tyrosine kinase domain (as illustrated in Fig. 1). This activation leads to recruitment and activation of the insulin receptor substrate (IRS) proteins. Binding of the phosphotyrosine binding domain (PTB) of IRS1 and IRS2 to the IR intracellular domain results in phosphorylation of multiple tyrosine residues that act as docking scaffolds for downstream substrates, including p85 regulatory subunit of PI3K. One of the regulatory processes at the proximal end of insulin signaling involves the phosphorylation of IRS1 Ser307 (Ser312 in humans). Due to its proximity to the PTB of IRS1, phosphorylation of Ser307 results in inhibition of PTB binding to the IR leading to inhibition of signal transduction from the insulin receptor to its downstream effectors [24, 25]. Upon translocation and binding to IRS1/2, p85 activates the p110α catalytic subunit, thus catalyzing the phosphorylation of phosphatidylinositol-4,5-P2 (PIP2) to phosphatidylinositol-3,4,5-P3 (PIP3) . This results in translocation and binding of PDK1 and Akt, allowing the phosphorylation of Akt on Thr308 residue, followed by full activation of Akt through phosphorylation of Ser473 residue. Active Akt results in inhibition of GSK3β through its phosphorylation on Ser9 residue, therefore removing the inhibition on glycogen synthase, ending in glycogen synthesis. One of the other functions of active Akt involves the translocation of the insulin-sensitive glucose transporter GLUT4 from intracellular pools towards the membrane to allow for glucose uptake.
Fig. 1
Insulin signaling pathway schematic. Insulin binds to the extracellular IR domain, inducing autophosphorylation of the intracellular domain, leading to recruitment and phosphorylation of IRS1. Regulatory subunit of PI3K, p85α, gets recruited to the bound IRS1, and activates the catalytic subunit, p110. Active PI3K converts PIP2 into PIP3 thereby recruiting PDK1 and Akt, resulting in phosphorylation of Akt on Thr308. Full activation of Akt occurs after phosphorylation on Ser473 by mTORC2. Active Akt inhibits GSK3β by Ser9 phosphorylation, therefore relieving the inhibition on Glycogen synthase (GS). Active Akt also leads to translocation of the glucose transporter GLUT4 from intracellular pools towards the membrane, where it allows glucose uptake. The stress response proteins, JNK and p38 MAPK, are activated by mitochondrial-generated ROS and result in inhibition of the insulin signaling pathway. Schematic created by Rabab Al-Lahham in BioRender.com
AD is characterized by the extracellular accumulation of Aβ into amyloid plaques as well as intracellular aggregation of the microtubule-associated protein tau into neurofibrillary tangles (NFT). Although few studies have shown the involvement of Aβ oligomers in the neuronal insulin resistance and tau hyperphosphorylation [7, 19, 23, 26–32], the role of tau remains unclear. AD stage-related reduction in IRS1 protein levels as well as an increase in phosphoSer312IRS1 inhibitory phosphorylation has been shown to correlate with NFT pathology in AD [8, 11]. Furthermore, GSK-3β is an important kinase of tau, thus reduction of its inhibition by Akt as a result of impaired insulin signaling will lead to tau phosphorylation. While insulin resistance is an important risk factor for AD, the exact mechanistic link remains unknown, and whether insulin resistance is a cause or a consequence of AD is still an unanswered question. Researchers concentrated on brain insulin resistance and considered it a type 3 diabetes, with little emphasis on the link between systemic insulin resistance and AD, despite the fact that the incidence of T2D is higher in AD patients [5, 6, 10, 16, 33–36], and that peripheral insulin resistance and diabetes are also risk factors for AD [2, 3, 37–43]. Induction of insulin resistance in transgenic mouse models of AD intensifies AD pathology as well as impairs further cognitive function [44, 45]. Hyperglycemia by itself, even without the presence of diabetes, is a risk factor for dementia and AD [46]. Recently, Marciniak et al. have shown that tau deletion impairs the hippocampal response to insulin through altered PTEN (phosphatase and tensin homolog deleted on chromosome ten) activity, and neuronal tau was shown to have an important role in regulation of energy homeostasis and peripheral metabolism [47]. Impaired glucose homeostasis in Tau KO mice has been shown also in later studies [15], confirming the role of tau in insulin sensitivity. In a more recent study, tau loss of function in a tau Knock-in mouse model promoted impaired glucose homeostasis [48].
Besides being a neuronal protein, studies have shown that tau is also expressed in pancreatic insulin-sensitive β-cells in T2D and AD patients as well as transgenic mice [15, 48–54]. Increased levels of phosphorylated tau have been found in the pancreas of diabetic patients [50] as well as in pancreatic islets from a transgenic mouse model of AD and T2D [16, 52]. Moreover, oxidative stress has been also linked to AD and insulin resistance, and it has been reported that tau deletion increases JNK activation in mouse brain hippocampal tissues [55], and JNK has been shown to cause IRS1 Ser307 phosphorylation and insulin resistance [24]. In addition, significant increase in P-Ser IRS1 as well as activated JNK levels have been found in AD brains and transgenic animal models of AD [7]. Taken together, these findings suggest a role for peripheral insulin resistance in the pathogenesis of AD.
In the present study, we investigated the involvement of tau in the regulation of peripheral insulin signaling using primary hepatocytes isolated from transgenic mouse models and wild type mice. We display an important function of tau in regulating hepatocytic insulin signaling and discuss how tau aggregates can lead to impairment of insulin signaling in wild type mice hepatocytes.
MATERIALS AND METHODS
Animals
Ten-month-old male C57BL/6, homozygous P301 L (JNPL3) (Taconic farms) and Tau KO (The Jackson Laboratory) mice were used. The JNPL3 mouse model [56] expresses a frontotemporal dementia-associated human mutant tau transgene (P301 L) and has been shown to develop tau aggregates in different regions in the brain as early as 4.5 months. Tau KO mice do not express tau in the whole body. Mice were housed at the UT Health Science Center at Houston animal care facility and maintained according to USDA standards (12 h light/dark cycle, food and water ad libitum), in accordance with the Guide for the Care and Use of Laboratory Animals (National Institutes of Health).
Preparation of tau aggregates
Recombinant human tau 2N4 R was produced in E. coli BL21(DE3). Bacteria pellets were lysed in 20 mM PIPES pH 6.5, 500 mM NaCl, plus protease inhibitor cocktail complete (Roche) and sonicated with a 1/2” probe (S-4000, Misonix). Lysates were then heated at 95°C for 30 min followed by centrifugation at 15,000×g for 20 min at 4°C to remove debris. Protein was precipitated by adding ammonium sulfate at 55% w/v and incubated at room temperature for 1 h. Precipitated protein was recovered by centrifugation at 15,000×g at room temperature, pellets were stored at –20°C.
Tau protein was then purified by Cation Exchange Chromatography in an AKTA pure Chromatography System. Ammonium sulfate pellets were dissolved in 20 mM PIPES pH 6.5 and the solution was filtered through 0.2μm filter. The sample was applied to a Hitrap SP HP column and eluted in a linear salt gradient (50–1000 mM NaCl, 20 mM PIPES pH 6.5). The content of tau protein was followed at 260 nm absorbance and checked by SDS-PAGE and Blue Coomassie staining. Fractions containing tau protein were pooled and dialyzed overnight in 10 mM HEPES buffer pH 7.4, 100 mM NaCl. Tau protein was concentrated using centrifugal filters (10 kDa MW CO, Millipore), and then filtered in 100 kDa centrifugal filters to remove precipitated or aggregated protein. Protein concentration was determined by BCA protein Assay (ThermoScientific, Waltham, MA). Aliquots were prepared at 5 mg/ml and stored at –80°C.
Tau filaments were prepared by incubating monomeric tau protein at 50μM with 25μM heparin (average MW 18,000, Sigma-Aldrich, St. Louis, MO) in 10 mM HEPES buffer pH 7.4, 100 mM NaCl for 6–120 h at 37°C with constant shaking at 500 rpm in a thermomixer (Eppendorf). The formation of amyloid filaments was followed by Thioflavin T fluorescence (excitation/emission wavelengths: 435/485 nm). Tau oligomers were collected at 18 h, time at which ThT fluorescence was still at lag-phase levels and aggregates did not have a filamentous morphology by TEM imaging.
Characterization of tau aggregates
Transmission electron microscopy
Negative-stain transmission EM samples were prepared by applying 5μl of solution to glow discharged 300-mesh carbon-coated copper grids [57, 58]. The samples were incubated on the grid for 1 min and then blotted off with a filter paper. The grids were washed twice, each with 5μl of Milli-Q water, followed by three repeats of 2% uranyl acetate staining. The grids were left to air dry for 1-2 min and imaged using a JEOL 1400 electron microscope.
Dot blot
Dot blot assay to detect tau aggregates at different time points of aggregation was performed. Briefly, 1μl of aggregated tau samples at different time points of aggregation were applied onto nitrocellulose membranes and then blocked with 5% nonfat milk in Tris-buffered saline with 0.1% Tween20 (TBST) for 1 h at room temperature. Membranes were probed with MC1 antibody (1:1000) diluted in 5% nonfat milk/TBST overnight at 4°C. Membranes were then incubated with HRP-conjugated IgG anti-mouse (1:4000) to detect MC1 immunoreactivity. Blots were then washed three times in TBST before ECL (Amersham ECL prime western blotting detection reagent, Cytiva) was used for signal detection. Oligomeric tau was used as a positive control.
Primary hepatocyte isolation, culture, treatment, and harvesting
Mouse primary hepatocytes were isolated by the collagenase type IV perfusion as described previously [59]. Briefly, 10 months old mice were anesthetized by an intraperitoneal injection of Ketamine/Xylazine (150μg/g Ketamine, 16μg/g Xylazine). The inferior vena cava was cannulated with a 24-gauge catheter, and heparin (Sigma-Aldrich, St. Louis, MO) was injected. The liver was blanched with Ca++ /Mg++-free Hanks balanced salt solution (Cellgro, Manassas, VA) supplemented with 80μM EDTA at 37°C for 5–10 min through a peristaltic pump, then perfused with 0.05% collagenase Type 4 (Worthington Biochemical, Lakewood, NJ) perfusion solution in Hanks balanced salt solution (with Ca++ and Mg++) supplemented with 20 mM HEPES at 37°C until they were adequately perfused and starting to release hepatocytes from the extracellular matrix. The digested liver was excised and the cells were shaken from their sac in diluted collagenase solution (0.023%). Isolated cells were shaken at 37°C and 125 rpm for 5 min. Cells were filtered through a 70μm nylon cell strainer (BD Biosciences, Bedford, MA) into a 50-ml Falcon tube. The cell suspension was centrifuged at 700 rpm and 4°C for 3 min. The cell pellet was washed 3 times and resuspended in Williams’ E medium (Sigma-Aldrich, St. Louis, MO) supplemented with 5% fetal bovine serum (FBS) (Gibco, Grand Island, NY), penicillin (100 U/ml), and streptomycin (100μg/ml) (Gibco, Grand Island, NY). Cells were counted using a hemocytometer and seeded on 100 mm culture dishes using Williams’ E medium containing 5% FBS, penicillin (100 U/ml), and streptomycin (100μg/ml) and incubated overnight (37°C, 5% CO2). For glucose-uptake, MTT, LDH, and DCF-DA assays, cells were plated on 96-well plates with 30,000 cells/well. For cell-based ELISAs, cells were plated on ELISA 96-well plates with 20,000 cells/well according to manufacturer’s instructions.
Following an overnight incubation, cells were treated with either 100 nM insulin (Sigma-Aldrich) for 5 min, or with different concentrations of tau oligomers (TauO) for 24 h followed by 100 nM insulin for 5 min as specified in each figure. In other experiments, cells were pretreated with 20μM SB203580 (Sigma-Aldrich) for 30 min and then treated with TauO in the continued presence of SB203580. Control treatments had only media as untreated control or 0.1% dimethylsulfoxide (DMSO) (Sigma-Aldrich) as a vehicle control for the p38 MAPK inhibitor SB203580.
Treated cells were harvested at various time points by washing and scraping the cells in ice-cold PBS. Qproteome cell compartment kit was used for preparation of cell cytosolic and membrane fractions (Qiagen kit #37502, Germantown, MD) according to manufacturer’s instructions. Fractions were stored at –80°C.
Glucose uptake cell-based assay
Basal as well as insulin-stimulated glucose uptake were measured using Glucose uptake cell-based assay kit from Cayman Chemical (Cayman chemical # 600470, Ann Arbor, MI) according to manufacturer’s instructions. Briefly, cells were seeded at 30,000 cells/well in a 96-well black, clear bottom plate and incubated overnight. The next day, cells were incubated with 100 nM insulin and 2-deoxy-2-[(7-Nitro-2, 1, 3-benzoxadiazol-4-yl) Amino]-D-glucose (2-NBDG, final concentration 200μg/ml) for 8 h in glucose-free Williams’ E culture medium (US biological, Salem, MA). Control cells were incubated with only 2-NBDG for 8 h. Wild type (C57BL/6) cells exposed to TauO treatment were treated with different concentrations of TauO (0.25, 0.5, 1.0μM) for 24 h, with the last 8 h exposed to 2-NBDG alone or with insulin. At the end of the treatment, plates were centrifuged for 5 min at 400 x g at room temperature, and the supernatants were aspirated. 200μl of cell-based assay buffer was added to each well carefully not to disturb the cell layer, followed by centrifugation again for 5 min at 400 x g at room temperature. Supernatants were aspirated and 100μl cell-based assay buffer was added to each well then cells were analyzed immediately using fluorescent filters (excitation/emission wavelengths: 485/535 nm). Fluorescence was measured using Gemini EM plate reader (Molecular Devices, San Jose, CA)
Cell viability assay
Wild type primary mouse hepatocytes were seeded in 96-well plate and incubated overnight. The next day, they were exposed to different concentrations of TauO (0.25, 0.5, 1μM) for 24 h followed by assessment of cell viability to evaluate TauO toxicity at the concentrations used. The cell viability was determined using MTT reagent (Thiazolyl Blue Tetrazolium Bromide, # M5655, Sigma). Briefly, cells were incubated with MTT reagent for 2 h at 37°C followed by incubation with solubilization solution overnight at 37°C. Absorbance was measured at 562 nm with SpectraMax Plus 384 plate reader (Molecular Devices, San Jose, CA). Cells viability was corrected for the culture medium background absorbance. All measurements were performed in six replicates and cell viability was calculated as the percentage of the optical density (OD) value of treated cells relative to untreated controls.
Cell toxicity assay
Wild type primary mouse hepatocytes were seeded in 96-well plate and incubated overnight. The next day, they were exposed to different concentrations of TauO (0.25, 0.5, 1μM) for 24 h followed by assessment of cell toxicity at TauO concentrations used. The cell toxicity was determined based on LDH release using The CytoTox 96® Non-Radioactive Cytotoxicity Assay (Promega #G1781, Madison, WI) according to manufacturer’s instructions. Absorbance was measured at 490 nm with SpectraMax Plus 384 plate reader (Molecular Devices, San Jose, CA). Cells toxicity was corrected for the culture medium background absorbance. All measurements were performed in six replicates and cell toxicity was calculated as the percentage of the OD value of untreated or treated cells relative to maximum LDH release controls of lysed cells.
Protein assay
Total protein concentrations were measured using BCA protein assay kit with bovine serum albumin as a protein standard (Pierce #23225, ThermoFisher Scientific, Waltham, MA).
Western blot analysis
40μg each of cytosolic (for phosphorylated Akt and GSK3β) or membrane fractions (for GLUT4 and phosphorylated IRβ) were resolved in a pre-cast NuPAGE 4–12% Bis-Tris Gel for SDS-PAGE (Invitrogen, Waltham, MA) at 80 volts for the first 10 min then 110 volts in MOPS-SDS running buffer and subsequently electro-transferred onto nitrocellulose membranes (Bio-Rad, Hercules, CA). After blocking for 1 h at room temperature with 5% nonfat dried milk/Tris-Buffered Saline with 0.1% Tween 20 (TBST), membranes were probed overnight at 4°C with antibodies against the following insulin signaling proteins; phospho-Akt (Ser473) (Cell Signaling, Catalog No. 9271), phospho-GSK3_(Ser9) (Cell Signaling, Catalog No. 9323), GLUT4 (EMD Millipore, Catalog No. 07-1404), phospho-IGF1Rβ (Tyr1135/1136)/insulin receptor β (Tyr1150/1151) (Cell Signaling, Catalog No. 3024). Immunoreactivity was detected with horseradish peroxidase (HRP)-conjugated anti-rabbit or anti-mouse IgG secondary antibodies (1:5000, Sigma). β-actin was used as a loading control. For signal generation, Amersham ECL prime western blotting detection reagent (Cytiva) was used. Protein band density was quantified using ImageJ software and normalized to that of β-actin. All densitometry results represent the mean and standard errors of the mean.
ELISA
ELISA kits used for Akt (phospho-Ser473, CBP1490), GSK3β (phospho-Ser9, CBP1567), and IRS1 (phospho-Ser307, CBP1090) were all colorimetric cell-based ELISA kits from Assay Biotechnology. GLUT4 colorimetric ELISA kit was from Novus Biologicals (NBP2-82175). ELISAs were performed according to manufacturer’s instructions. For cell-based ELISA kits, 20,000 cells were seeded per well into each ELISA plate and incubated overnight. After treatments, cells were washed with TBS, and fixed using 4% formaldehyde. After washing, the plates were stored at 4°C for 5 days. Fixed cells were incubated with quenching buffer for 20 min at room temperature, followed by washing. Plates were incubated with blocking buffer for 1 h at room temperature, after which, primary antibodies were added and the plates were incubated overnight at 4°C. The next day, plates were washed and immunoreactivity was detected using HRP-conjugated secondary antibodies for 1.5 h at room temperature. Finally, plates were washed and incubated with substrate solution and the reaction was stopped with stop solution. The OD was measured at 450 nm. Following the colorimetric measurement of the HRP activity, plates were washed and crystal violet cell staining solution was added for 30 min at room temperature. This staining step is necessary to stain cells in order to determine cell density for normalization. Crystal violet solution was washed well, then SDS was added and incubated for 1 h at room temperature, followed by measuring absorbance at 595 nm. Each sample was measured in duplicates. Absorbance values for samples were normalized to crystal violet absorbance values. For GLUT4 ELISA, membrane fractions were added to plate wells and incubated for 90 min at 37°C, followed by incubation with biotinylated antibody solution for 1 h at 37°C. Following washing, samples were incubated with HRP-conjugated secondary antibody solution for 30 min at 37°C. Finally, plates were washed and incubated with substrate solution for 15 min at 37°C, then the reaction was stopped with stop solution. OD was measured at 450 nm. Each sample was measured in duplicates. ELISA results were analyzed using Graph Pad Prism 9.0 software, as stated under each figure.
ROS quantification
Primary hepatocytes were plated on 96-well plates and incubated overnight. Intracellular ROS levels were determined the next day using the fluorogenic probe dichlorodihydrofluorescein diacetate (H2DCF-DA) (Invitrogen, Eugene, OR). Briefly, cells were loaded with 50 mM H2DCF-DA or with H2DCFDA and 20μM SB203580 and incubated for 45 min. After incubation, DCF-DA-loaded cells were washed twice with PBS and changes in DCF fluorescence were recorded using Gemini EM plate reader (Molecular Devices, San Jose, CA) at 485 nm excitation and 528 nm emission. Results are expressed as percent of wild type mice or untreated controls. All measurements were performed in six experimental replicates.
Statistical analysis
All data are presented as mean±SEM for the number of replicates indicated under each figure. All data were analyzed using GraphPad prism 9.0 software (GraphPad Software Inc., La Jolla, CA, USA). Statistical analysis was carried out as indicated under figure legends. Results were considered significant if the p value was <0.05. Data were checked for normality using Shapiro-Wilk test. Data passed the normality test.
RESULTS
Tau deletion or loss of function decreases hepatocytic insulin-stimulated glucose uptake
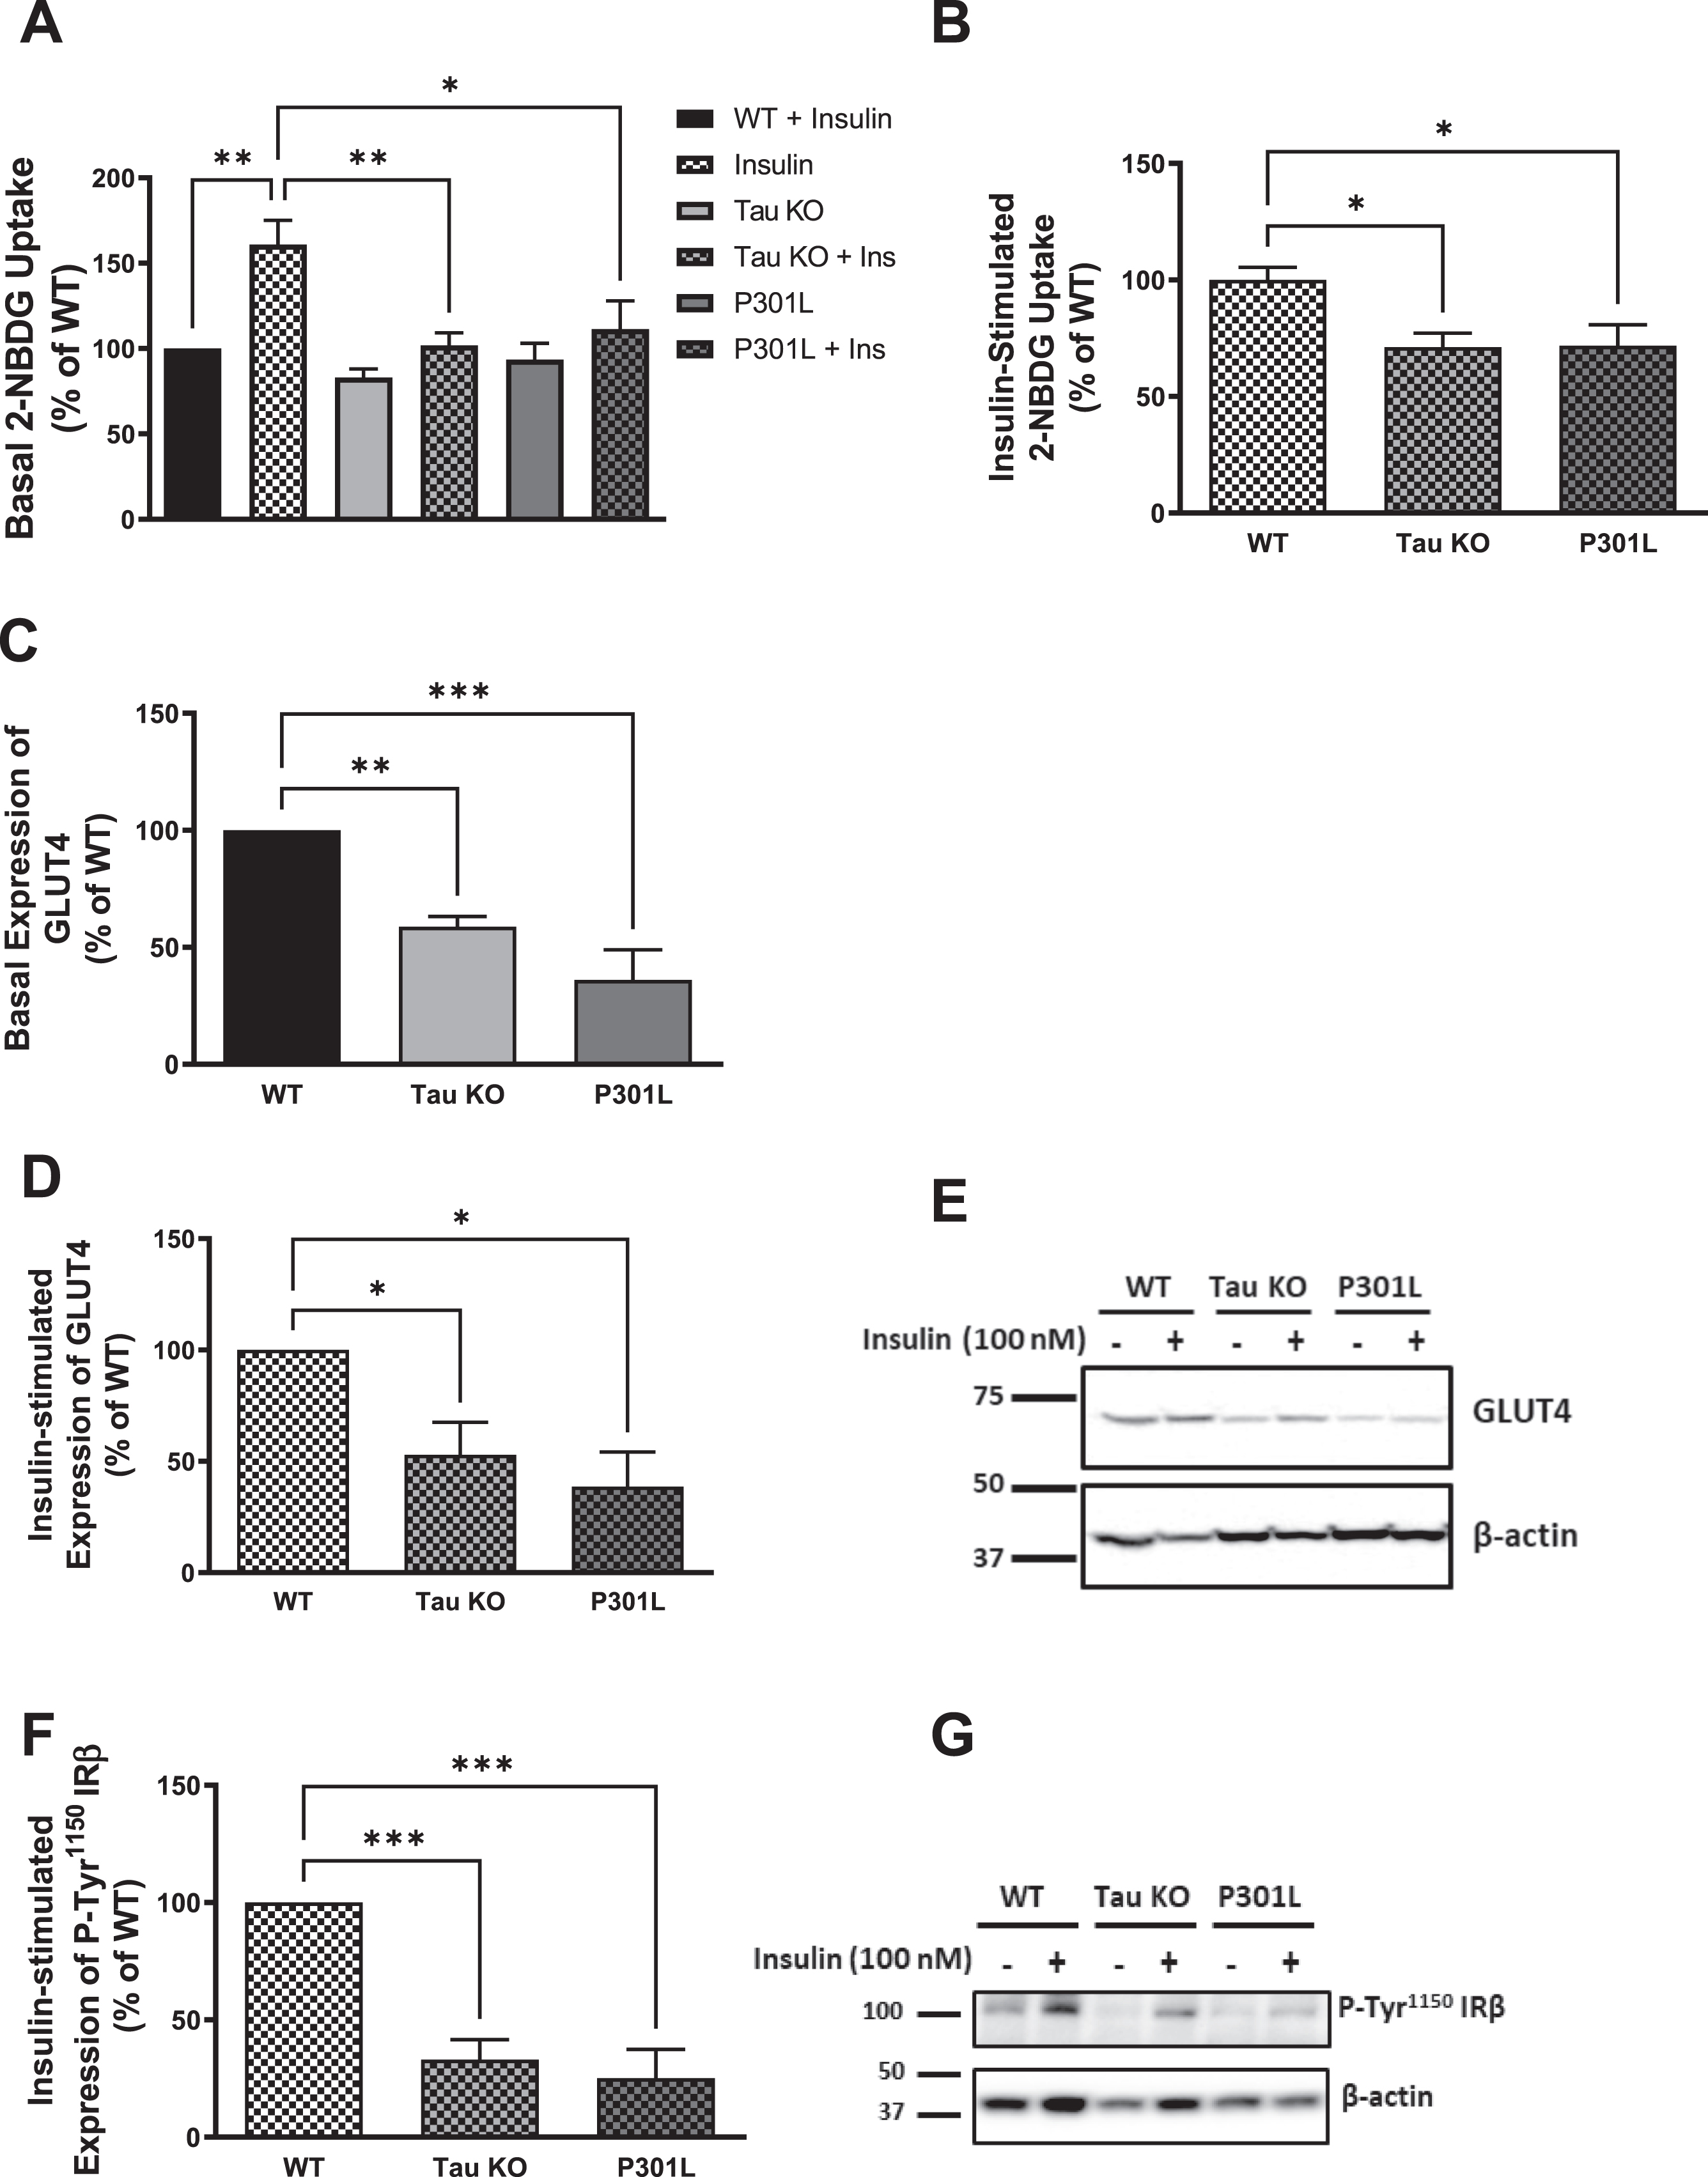
Tau deletion has been shown to impair insulin signaling in the brain [47], and to cause impairment in glucose metabolism [15]. To address the influence of tau loss of function on peripheral insulin signaling, we evaluated the impact of tau deletion as well as tau aggregation on peripheral insulin sensitivity using primary hepatocytes isolated from Tau KO and P301 L mice, respectively, as well as wild type mice, and compared the responsiveness of these cells towards insulin. Glucose-uptake assay was utilized to test the uptake of 2-deoxyglucose (2-NBDG) with or without treatment with 100 nM insulin for 5 min. As shown in Fig. 2, primary hepatocytes isolated from 10-month-old Tau KO as well as P301 L mice show no response to insulin stimulation (Fig. 2A) as well as a significant reduction in insulin-stimulated glucose uptake compared to wild type mice (Fig. 2B), indicating insulin resistance in these cells.
Fig. 2
Tau loss of function by deletion or aggregation induces insulin resistance in primary mouse hepatocytes. A) Primary mouse hepatocytes isolated form 10-month-old wild type mice show increased glucose uptake after insulin stimulation, while tau KO and P301L primary hepatocytes do not respond to insulin. B) Primary mouse hepatocytes isolated from tau KO and P301L mice show significantly reduced insulin-stimulated glucose uptake compared to wild type hepatocytes. Data represent mean±SEM of 8 mice, each with six experimental replicates. WB: primary hepatocytes isolated form 10 months Tau KO and P301L mice show reduced basal (C) and insulin-stimulated (D) expression of GLUT4 at the membrane. Data represent mean±SEM of 4 mice. E) Corresponding gel for C and D. F) primary hepatocytes isolated form Tau KO and P301L mice show reduced insulin-stimulated expression of P-Tyr1150IRβ at the membrane. The antibody specifically detected P-IRβ Tyr1150 phosphorylation. Data represent mean±SEM of 4 mice. G) Corresponding gel for F. β-actin was used as a loading control and band intensities were normalized to β-actin bands intensities. *p < 0.05, **p < 0.01, ***p < 0.001; One-way ANOVA, Dunnett’s post hoc test.
Tau deletion or loss of function results in impairment of insulin signaling as shown by the reduction in hepatocytic GLUT4, P-Tyr1150 IRβ, P-Ser473AKT, and P-Ser9GSK3β
Insulin stimulation of hepatocytes results in translocation of the insulin-sensitive glucose transporter GLUT4 to the membrane. Therefore, to investigate if the reduction in glucose uptake we see in Tau KO and P301 L mice hepatocytes compared to wild type hepatocytes is due to reduction of GLUT4 at the membrane of these cells, we analyzed the expression of GLUT4 at the membrane before and after insulin stimulation using western blot analysis, and we found a significant reduction in both basal as well as insulin-stimulated expression of GLUT4 at the membrane in Tau KO and P301 L mice hepatocytes compared to wild type (Fig. 2C-E). To evaluate if the GLUT4 reduction at the membrane at the distal end of insulin signaling is a result of a proximal end impairment, we analyzed the tyrosine phosphorylation of IR at the proximal end of the pathway. Using western blot analysis, we could see that both Tau KO and P301 L hepatocytes exhibit reduction in tyrosine phosphorylation of the IR compared to wild type mice after insulin stimulation (Fig. 2F, G).
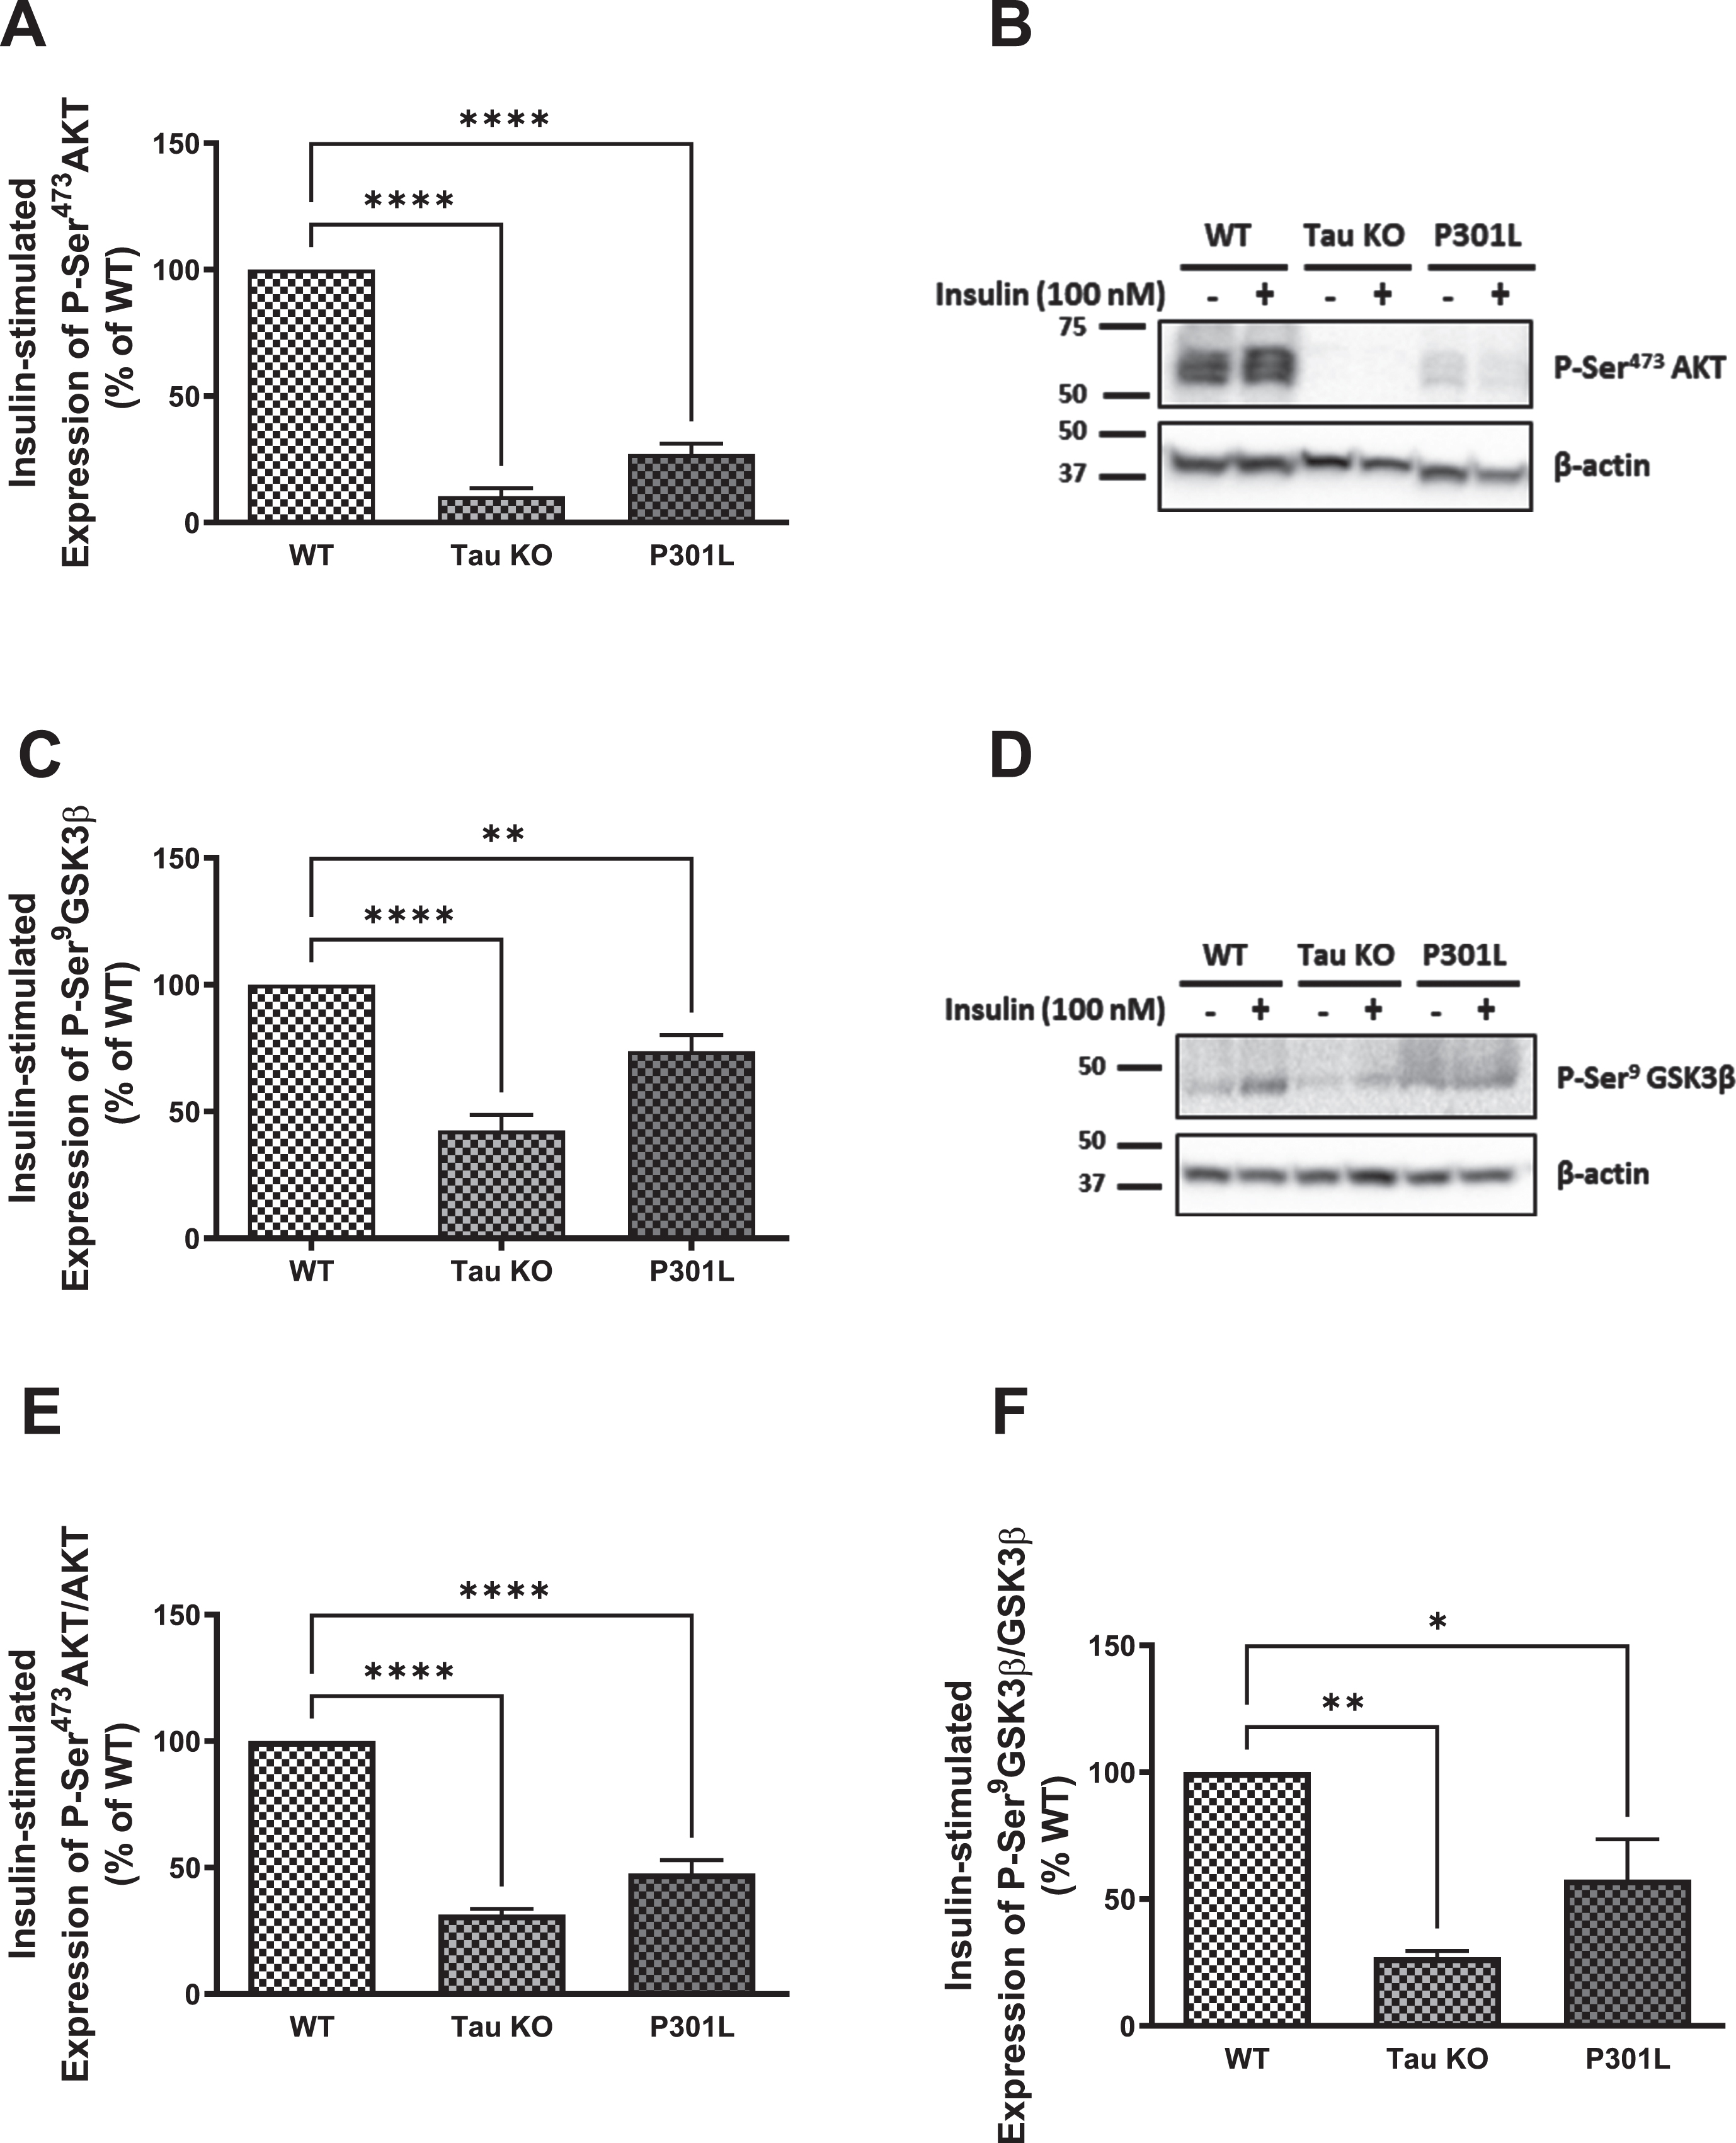
Since GLUT4 translocates to the membrane from intracellular pools upon activation of the insulin signaling as a consequence of Akt activation, we investigated the insulin signaling markers Akt and GSK3β. As shown in Fig. 3, there is a significant reduction in phosphorylation and activation of Akt in hepatocytes isolated from Tau KO and P301 L compared to those isolated from wild type mice using western blot analysis (Fig. 3A, B), which was confirmed with ELISA (Fig. 3E). This was also reflected in the downstream substrate of Akt, GSK3β, where its Ser9 phosphorylation was also significantly reduced in Tau KO and P301 L hepatocytes compared to wild type ones using western blot analysis (Fig. 3C, D) as well as ELISA (Fig. 3F). Phosphorylation of GSK3β by Akt results in inhibition of the enzyme activity, and reduced phosphorylation would, therefore, be expected to result in an increase in its activity. These data show downregulation of insulin signaling as seen by the significant reduction in phosphorylation and activation of the IRβ upon insulin stimulation, accompanied by reduction in activation of Akt resulting in reduction in expression of GLUT4 at the membrane of these cells.
Fig. 3
Tau loss of function, by deletion or aggregation, induces downregulation of the insulin signaling pathway in primary mouse hepatocytes. WB: A) primary hepatocytes isolated form 10 months Tau KO and P301L mice show significantly reduced insulin-stimulated P-Ser473AKT expression compared to wild type hepatocytes. Data represent mean±SEM of 3 mice; B) Corresponding gel for A. C) primary hepatocytes isolated form 10 months Tau KO and P301L mice show significantly reduced insulin-stimulated P-Ser9GSK3β expression compared to wild type hepatocytes. Data represent mean±SEM of 5 (WT, TauKO), or 4 (P301L) mice. D) Corresponding gel for C. The antibodies specifically detected AKT-Ser473 and GSK3β-Ser9 phosphorylation. ELISA: primary hepatocytes isolated form Tau KO and P301L mice show significantly reduced insulin-stimulated P-Ser473AKT (E) and P-Ser9GSK3β (F) compared to wild type hepatocytes. Data represent mean±SEM of 3 mice, each with two experimental replicates. *p < 0.05, **p < 0.01, ****p < 0.0001; One-way ANOVA, Dunnett’s post hoc test.
In accordance with impaired insulin signaling in the brain of tau KO mice [47], our data support that tau deletion leads to insulin resistance but in the periphery, besides showing that tau aggregation in P301 L mice also results in insulin resistance.
Exposure to sub-toxic concentrations of tau aggregates results in dose-dependent decrease in glucose uptake
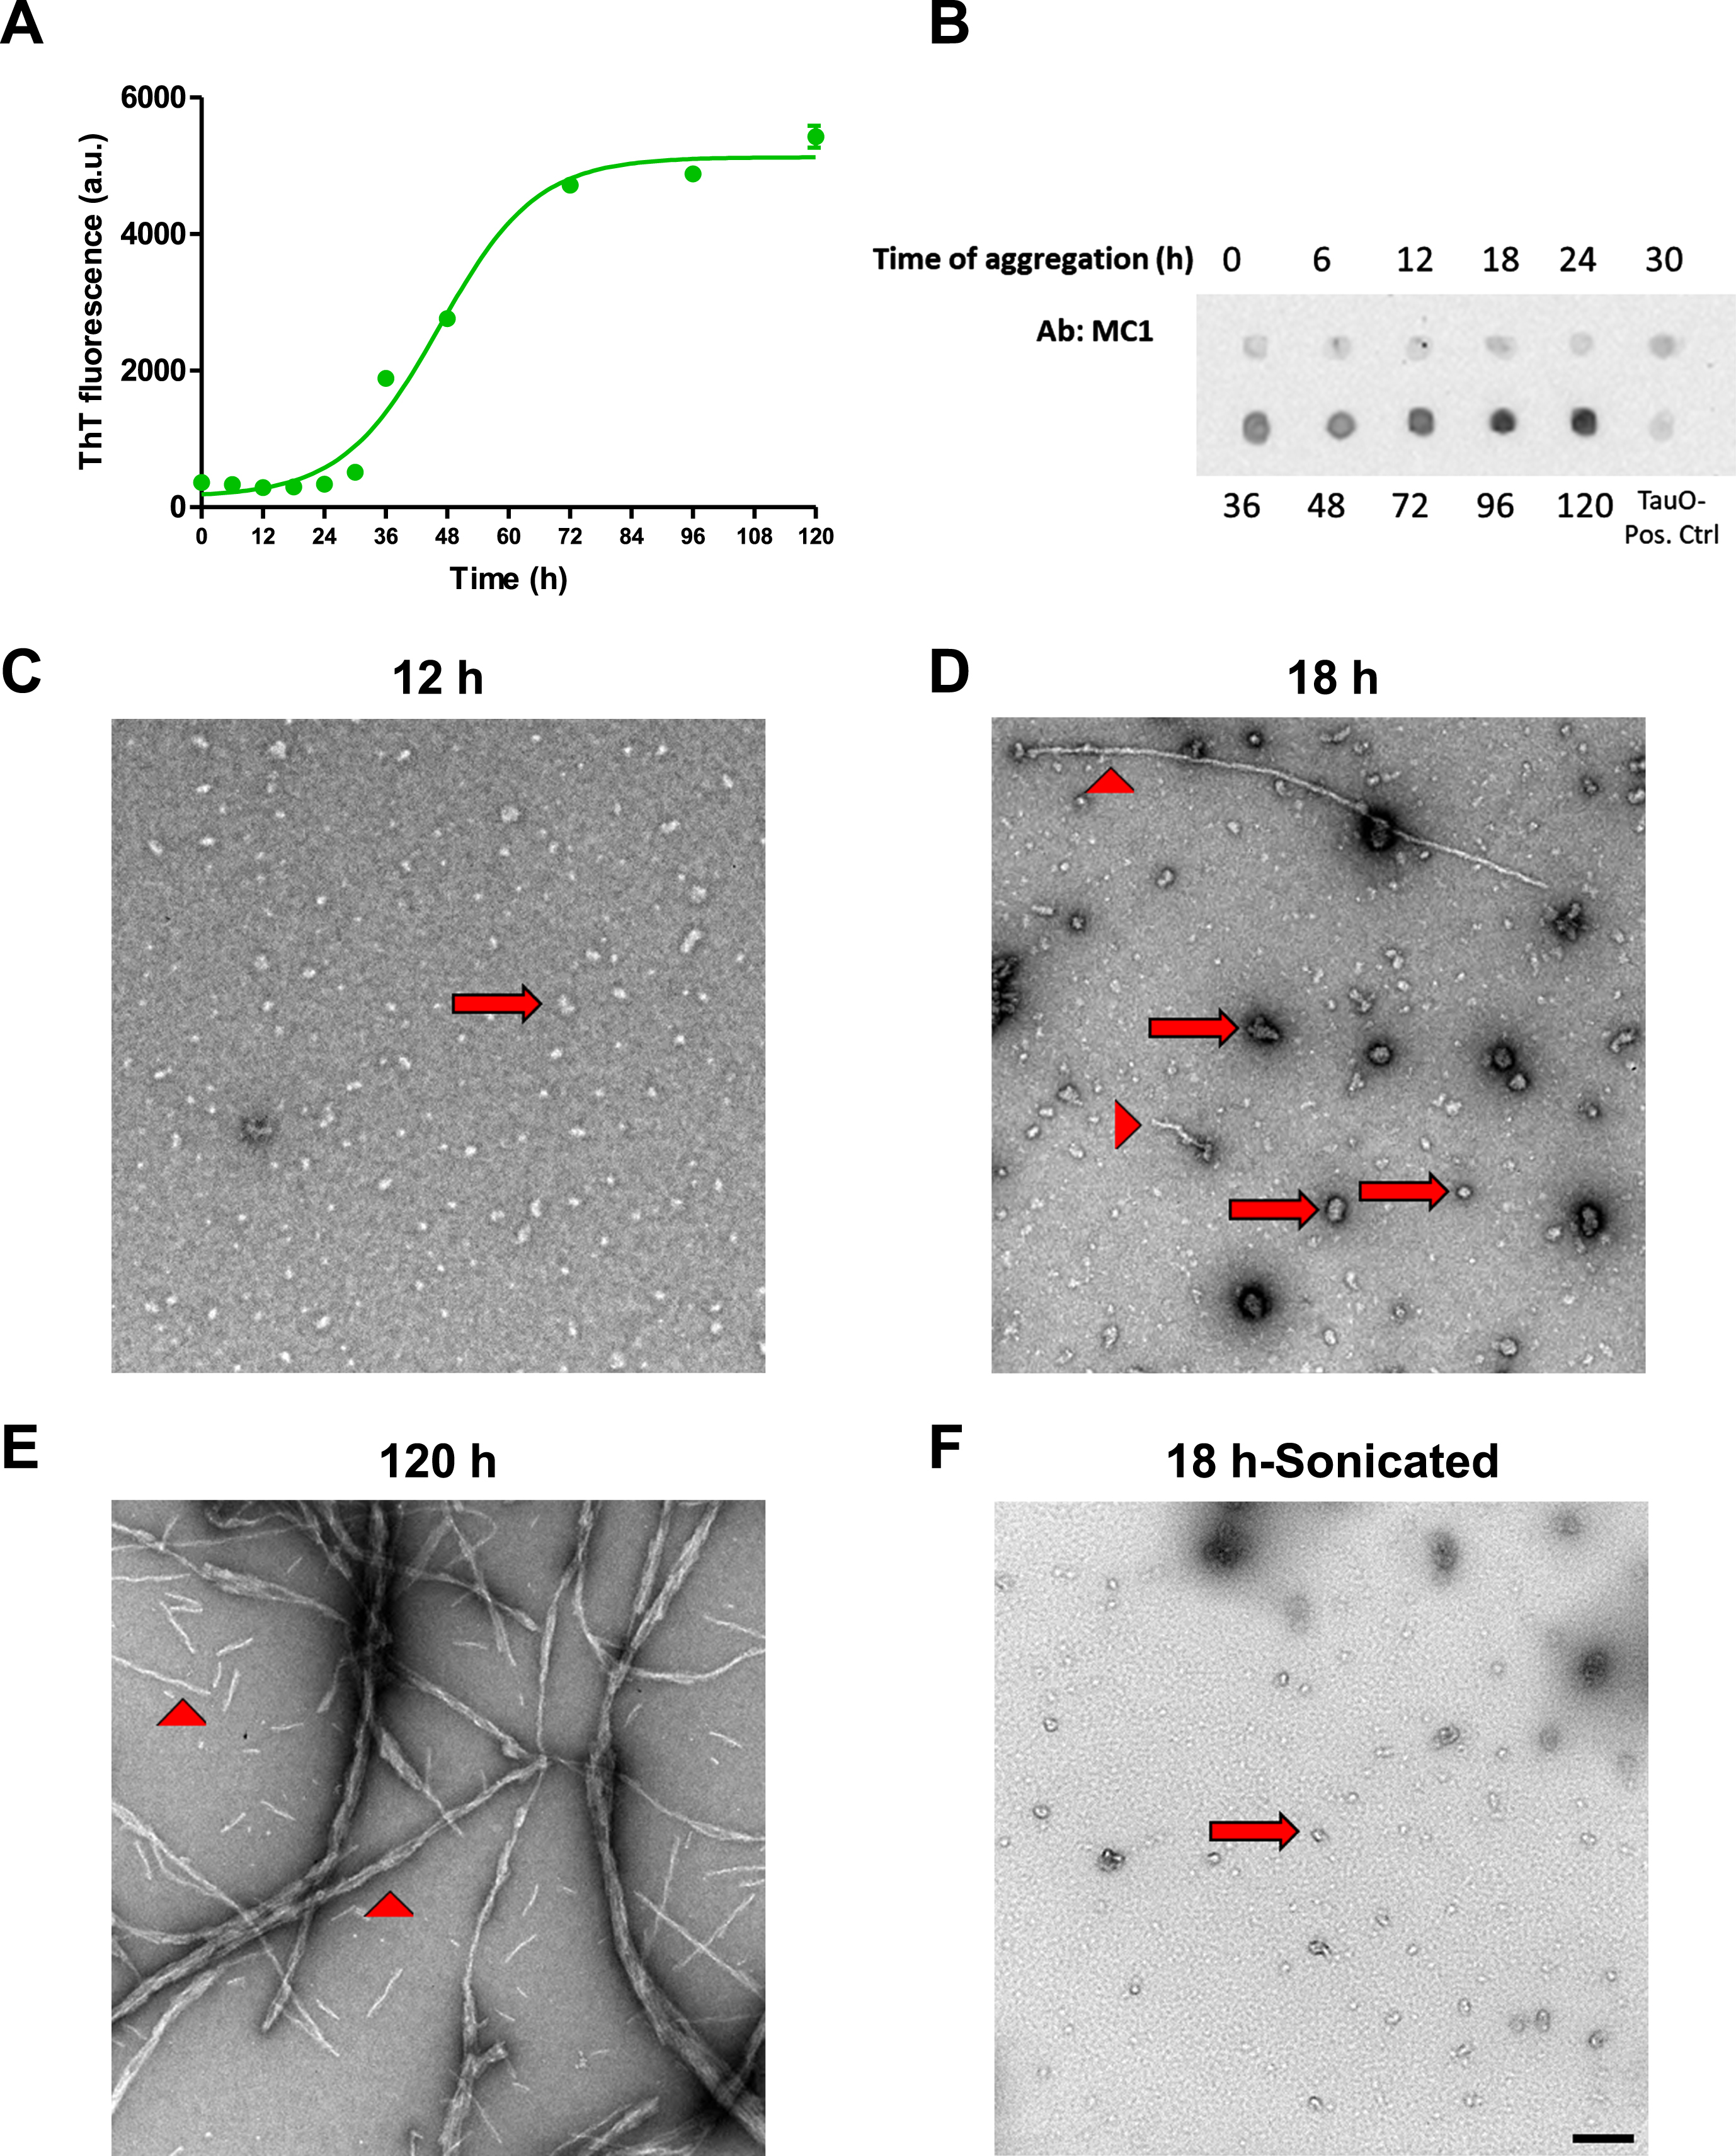
The peripheral insulin resistance shown in tau KO and P301 L mouse models suggests that loss of functional tau, either by deletion or aggregation, induces downregulation of insulin signaling. To analyze this further, we used wild type hepatocytes to confirm the involvement of tau in peripheral insulin signaling. To characterize tau aggregates species before treatment, we used Thioflavin T fluorescence. ThT is a dye that binds to β-sheet containing amyloid proteins [60–63]. Fibrillar species contain β-sheet and therefore would show fluorescence when bound to ThT, while oligomers do not contain β-sheet so they should not emit fluorescence upon exposure to ThT dye. As seen in Fig. 4A, aggregation of tau until 18 h still does not show an increase in fluorescence of ThT. At 24 h of aggregation, we start seeing an increase in fluorescence and it increases steeply after that until it reaches a plateau. We also ran dot blot analysis of tau aggregated for different time points using MC1 antibody, and as shown in Fig. 4B, MC1 does not detect tau aggregates until species aggregated for 30 h and after, indicating the presence of fibrillar species. To confirm the presence of oligomeric species before the 24 h and the fibrillar species after 120 h of aggregation, we performed transmission electron microscopy. Tau aggregated for 12 h shows only oligomeric species (Fig. 4C), while aggregation for 18 h shows mainly oligomeric tau but with some short fibrillar species as shown in Fig. 4D. Aggregation of tau for 120 h leads to formation of mainly fibrils (Fig. 4E). Based on the characterization done, we chose to use tau aggregated for 18 h but after sonication to break down short fibrils into oligomers, as shown in Fig. 4F, for treatment of cells. Tau oligomer (TauO) has been shown by many researchers to be the toxic form of tau that is responsible for neurodegeneration in AD [64–69].
Fig. 4
Tau aggregates characterization. A) Tau aggregates were prepared by shaking 50μM 2N4R recombinant Tau at 37°C for different times in the presence of 25μM Heparin. ThT fluorescence was used to detect the presence of fibrillar aggregates at different time points. Data represent mean±SEM of 3 samples at each time point. B) Dot blot analysis of tau aggregates after different time points of aggregation using MC1 antibody to detect fibrillary species. C-F) Electron Microscopy images of tau aggregates after 12 h (C), 18 h (D), and 120 h (E) show the presence of only oligomeric (arrows) species after 12 h aggregation, while aggregation for 18 h shows the presence of mostly oligomeric (arrows) with some fibrillar (arrow heads) species, and aggregates formed after 120 h show the presence of mainly fibrillar species. F) Sonication of the aggregates formed after 18 h results in mainly oligomeric species with no fibrillary aggregates present. Scale bar = 200 nm.
Primary mouse hepatocytes isolated from wild type C57BL/6 mice were treated with different concentrations of TauO. We used sub-toxic concentrations of tau, based on MTT (Fig. 5C) and LDH (Fig. 5D) assays, to make sure that the effect we see on insulin signaling is not due to a toxic effect of TauO on cells’ viability, but rather a specific response on insulin signaling. We treated hepatocytes isolated from wild type mice with different concentrations of TauO for 24 h and measured the effect of TauO on glucose-uptake in these cells. As shown in Fig. 5, TauO resulted in a dose-dependent reduction in basal (Fig. 5A), as well as insulin-stimulated (Fig. 5B) glucose uptake into primary wild type hepatocytes. These findings suggest TauO induction of insulin resistance in primary mouse hepatocytes. For the rest of experiments, we decided to use 0.5μM TauO for treatment.
Fig. 5
Exposure to sub-toxic concentrations of TauO results in downregulation of insulin signaling in wild type primary mouse hepatocytes. 8-month-old wild type (C57BL/6) primary mouse hepatocytes were treated with TauO at different concentrations (0.25, 0.5, and 1μM) for 24 h followed by an insulin challenge (100 nM) for 5 min. Glucose-uptake Assay: TauO results in a dose-dependent decrease in basal (A) as well as insulin-stimulated (B) glucose uptake in wild type primary mouse hepatocytes. Cell Viability and Toxicity Assays: Cell viability (MTT assay) (C) as well as cell toxicity (LDH release) (D) assays show no toxic effect of the different concentrations of TauO on primary wild type hepatocytes after 24 h of incubation. Data represent mean±SEM of 6 mice, each with six experimental replicates. ****p < 0.0001; One-way ANOVA, Dunnett’s post hoc test. ELISA: E, F) Glucose transporter GLUT4 : 0.5μM TauO treatment results in significant reduction of basal (E) as well as insulin-stimulated (F) expression of GLUT4 at the membrane in wild type primary mouse hepatocytes. Data represent mean±SEM of 6 (E), or 7 (F) mice, each with two experimental replicates. Treatment with 0.5μM TauO results in a significant increase in phosphorylation and inactivation of IRS1-Ser307 (G) as well as a significant decrease in phosphorylation and activation of AKT-Ser473 (H). Data represent mean±SEM of 8 (G) or 4 (H) mice, each with two experimental replicates. *p < 0.05, **p < 0.01, ****p < 0.0001; Unpaired t-test.
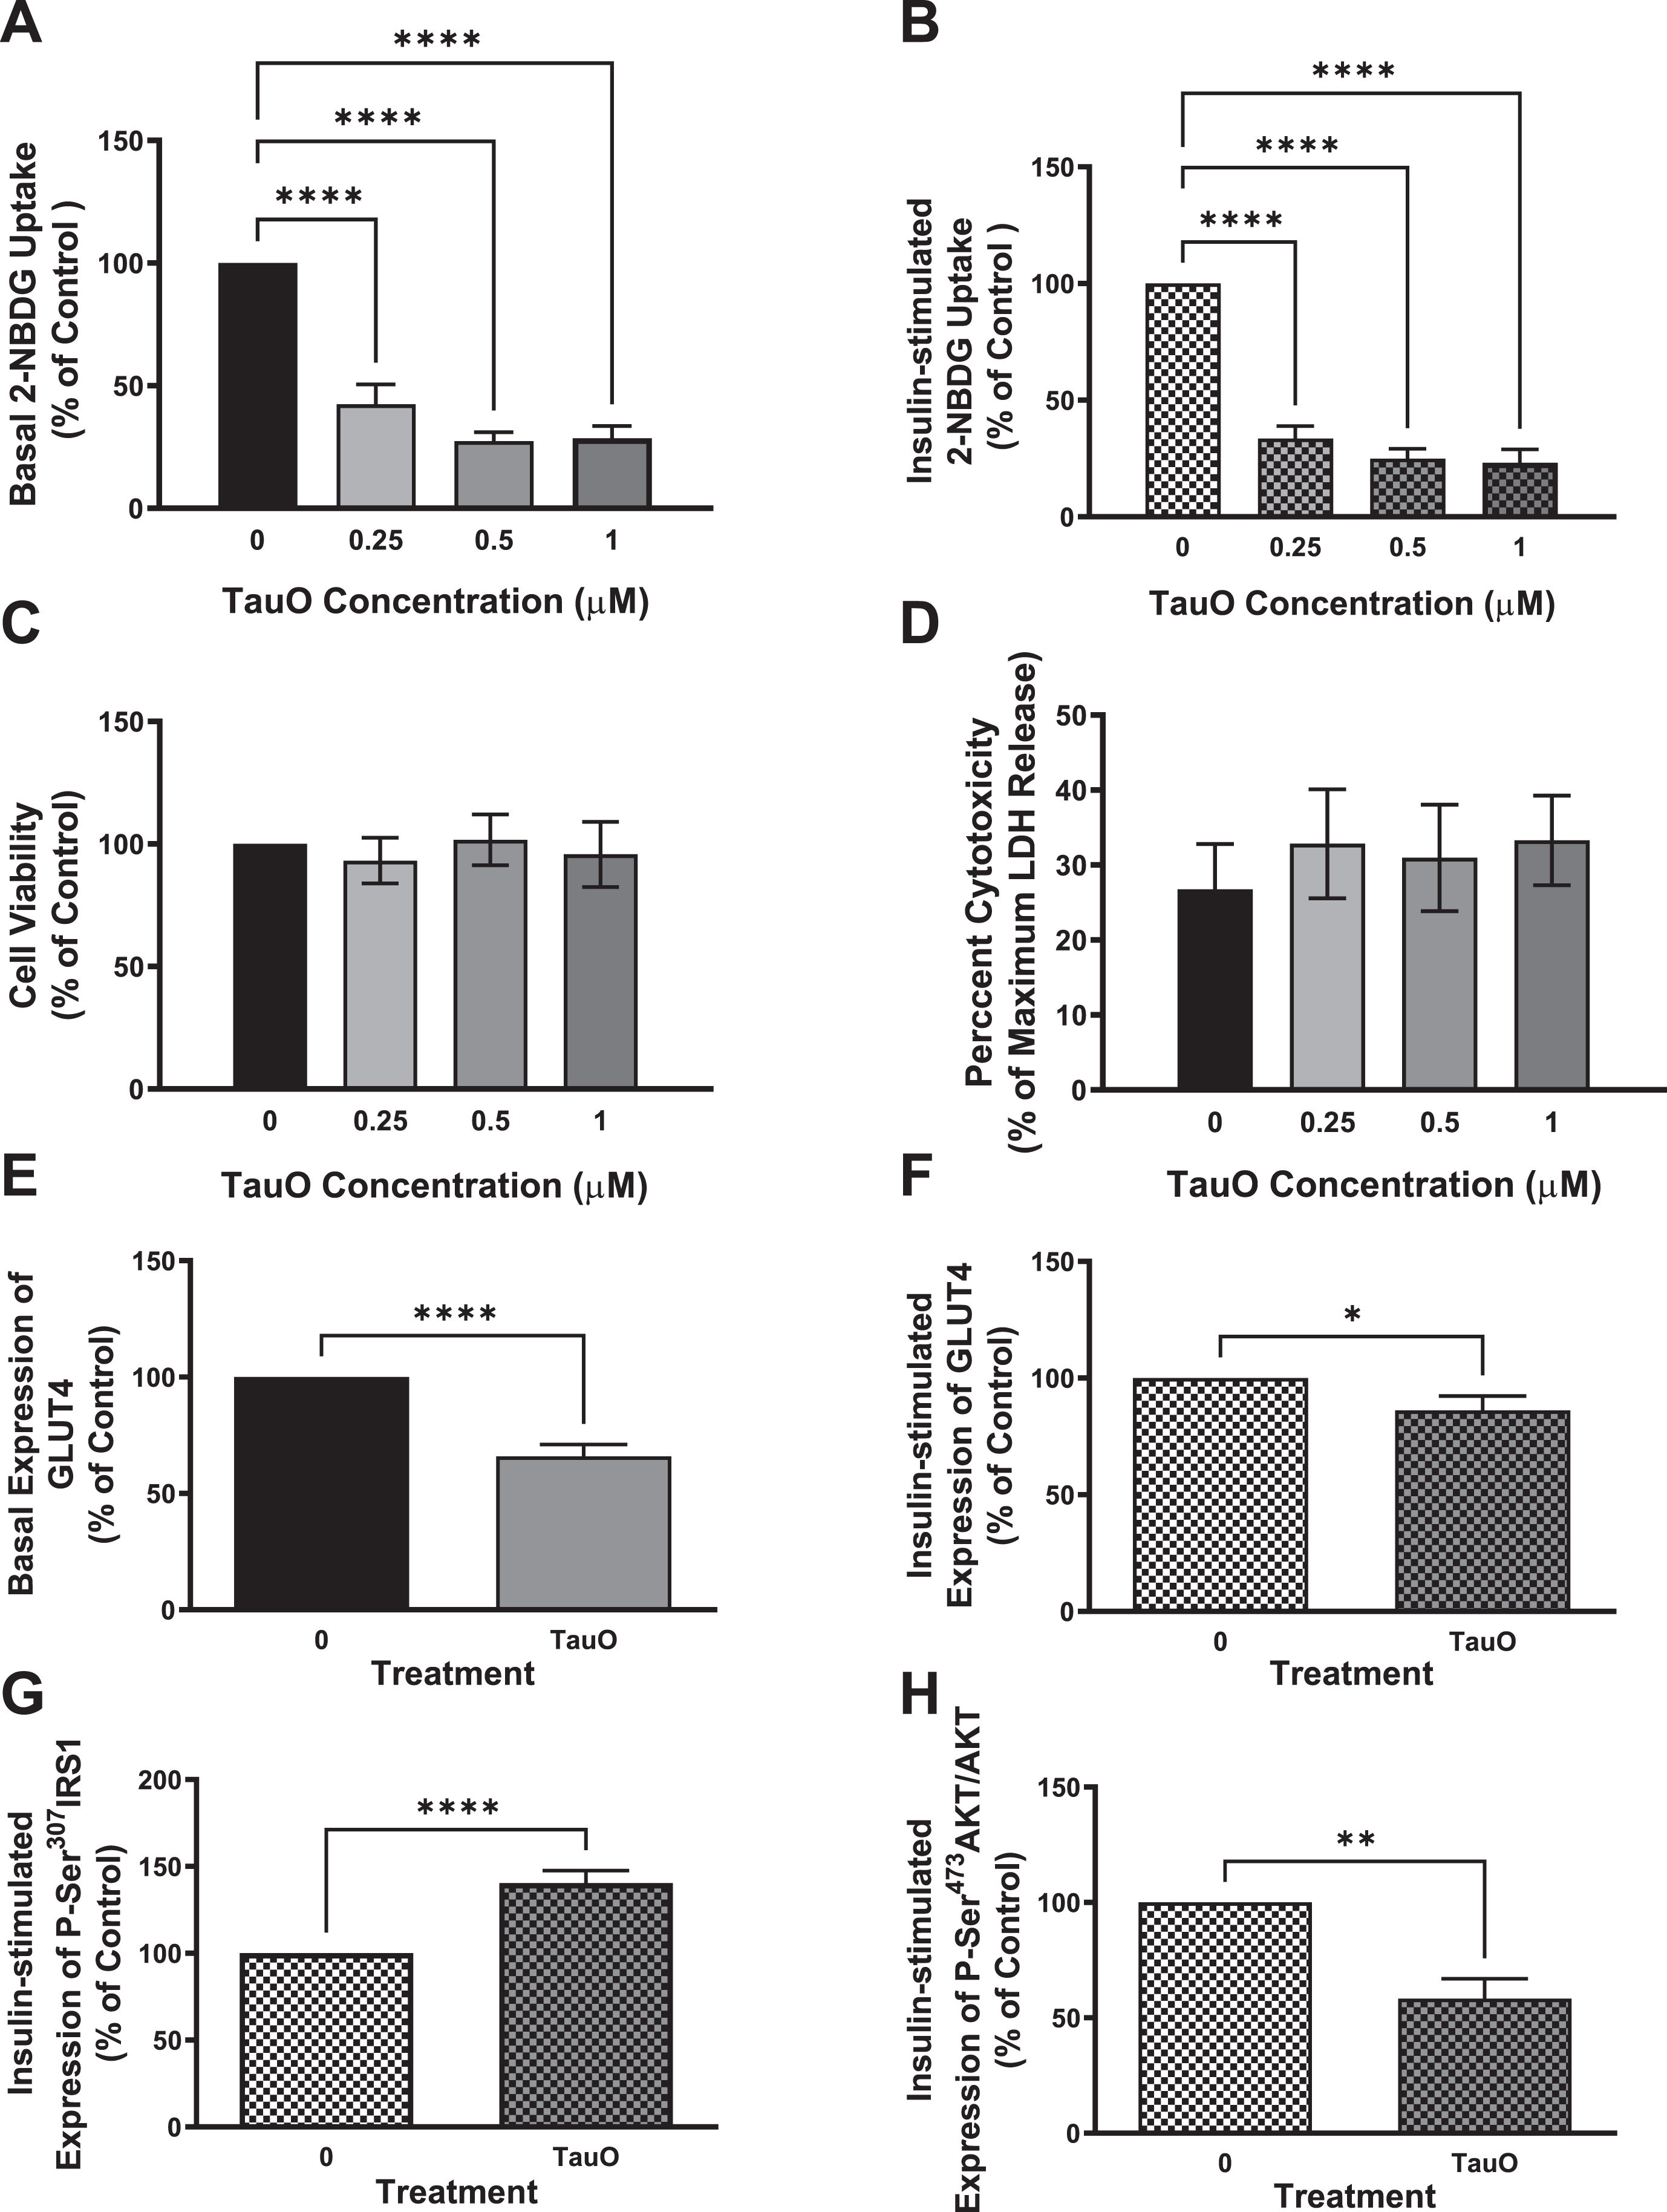
Exposure to sub-toxic concentrations of tau aggregates results in a decrease in GLUT4 expression, reduction in phosphorylation and activation of AKT, as well as inactivation of IRS1
To confirm TauO-induced downregulation of insulin signaling pathway in primary mouse hepatocytes, we investigated the effect of TauO treatment on the glucose transporter GLUT4 and insulin signaling proteins IRS1 and Akt. We found that treatment with 0.5μM TauO resulted in significant reduction in basal (Fig. 5E) as well as insulin-stimulated (Fig. 5F) expression of GLUT4 at the membrane.
To evaluate if the reduction in membrane expression of GLUT4 is a result of downregulation of insulin signaling, we examined IRS1 phosphorylation on Ser307 residue, which has been shown to result in IRS1 inhibition, and we found an increase in P-Ser307IRS1 as seen in Fig. 5 G. To validate that this inhibition of IRS1 at the proximal end of the insulin signaling extends towards the distal end, we looked at Akt phosphorylation and activation and, in line with impairment of insulin signaling at the proximal end, we found a significant reduction in P-Ser473Akt levels (Fig. 5H), indicating downregulation of insulin signaling pathway. These data imply that exposure of primary mouse hepatocytes to sub-toxic concentrations of TauO results in downregulation of the insulin signaling pathway and therefore, reduction in glucose uptake into these cells upon insulin stimulation, demonstrating insulin resistance.
p38 MAPK inhibition rescues tau aggregates-induced downregulation of insulin signaling in wild type mice hepatocytes
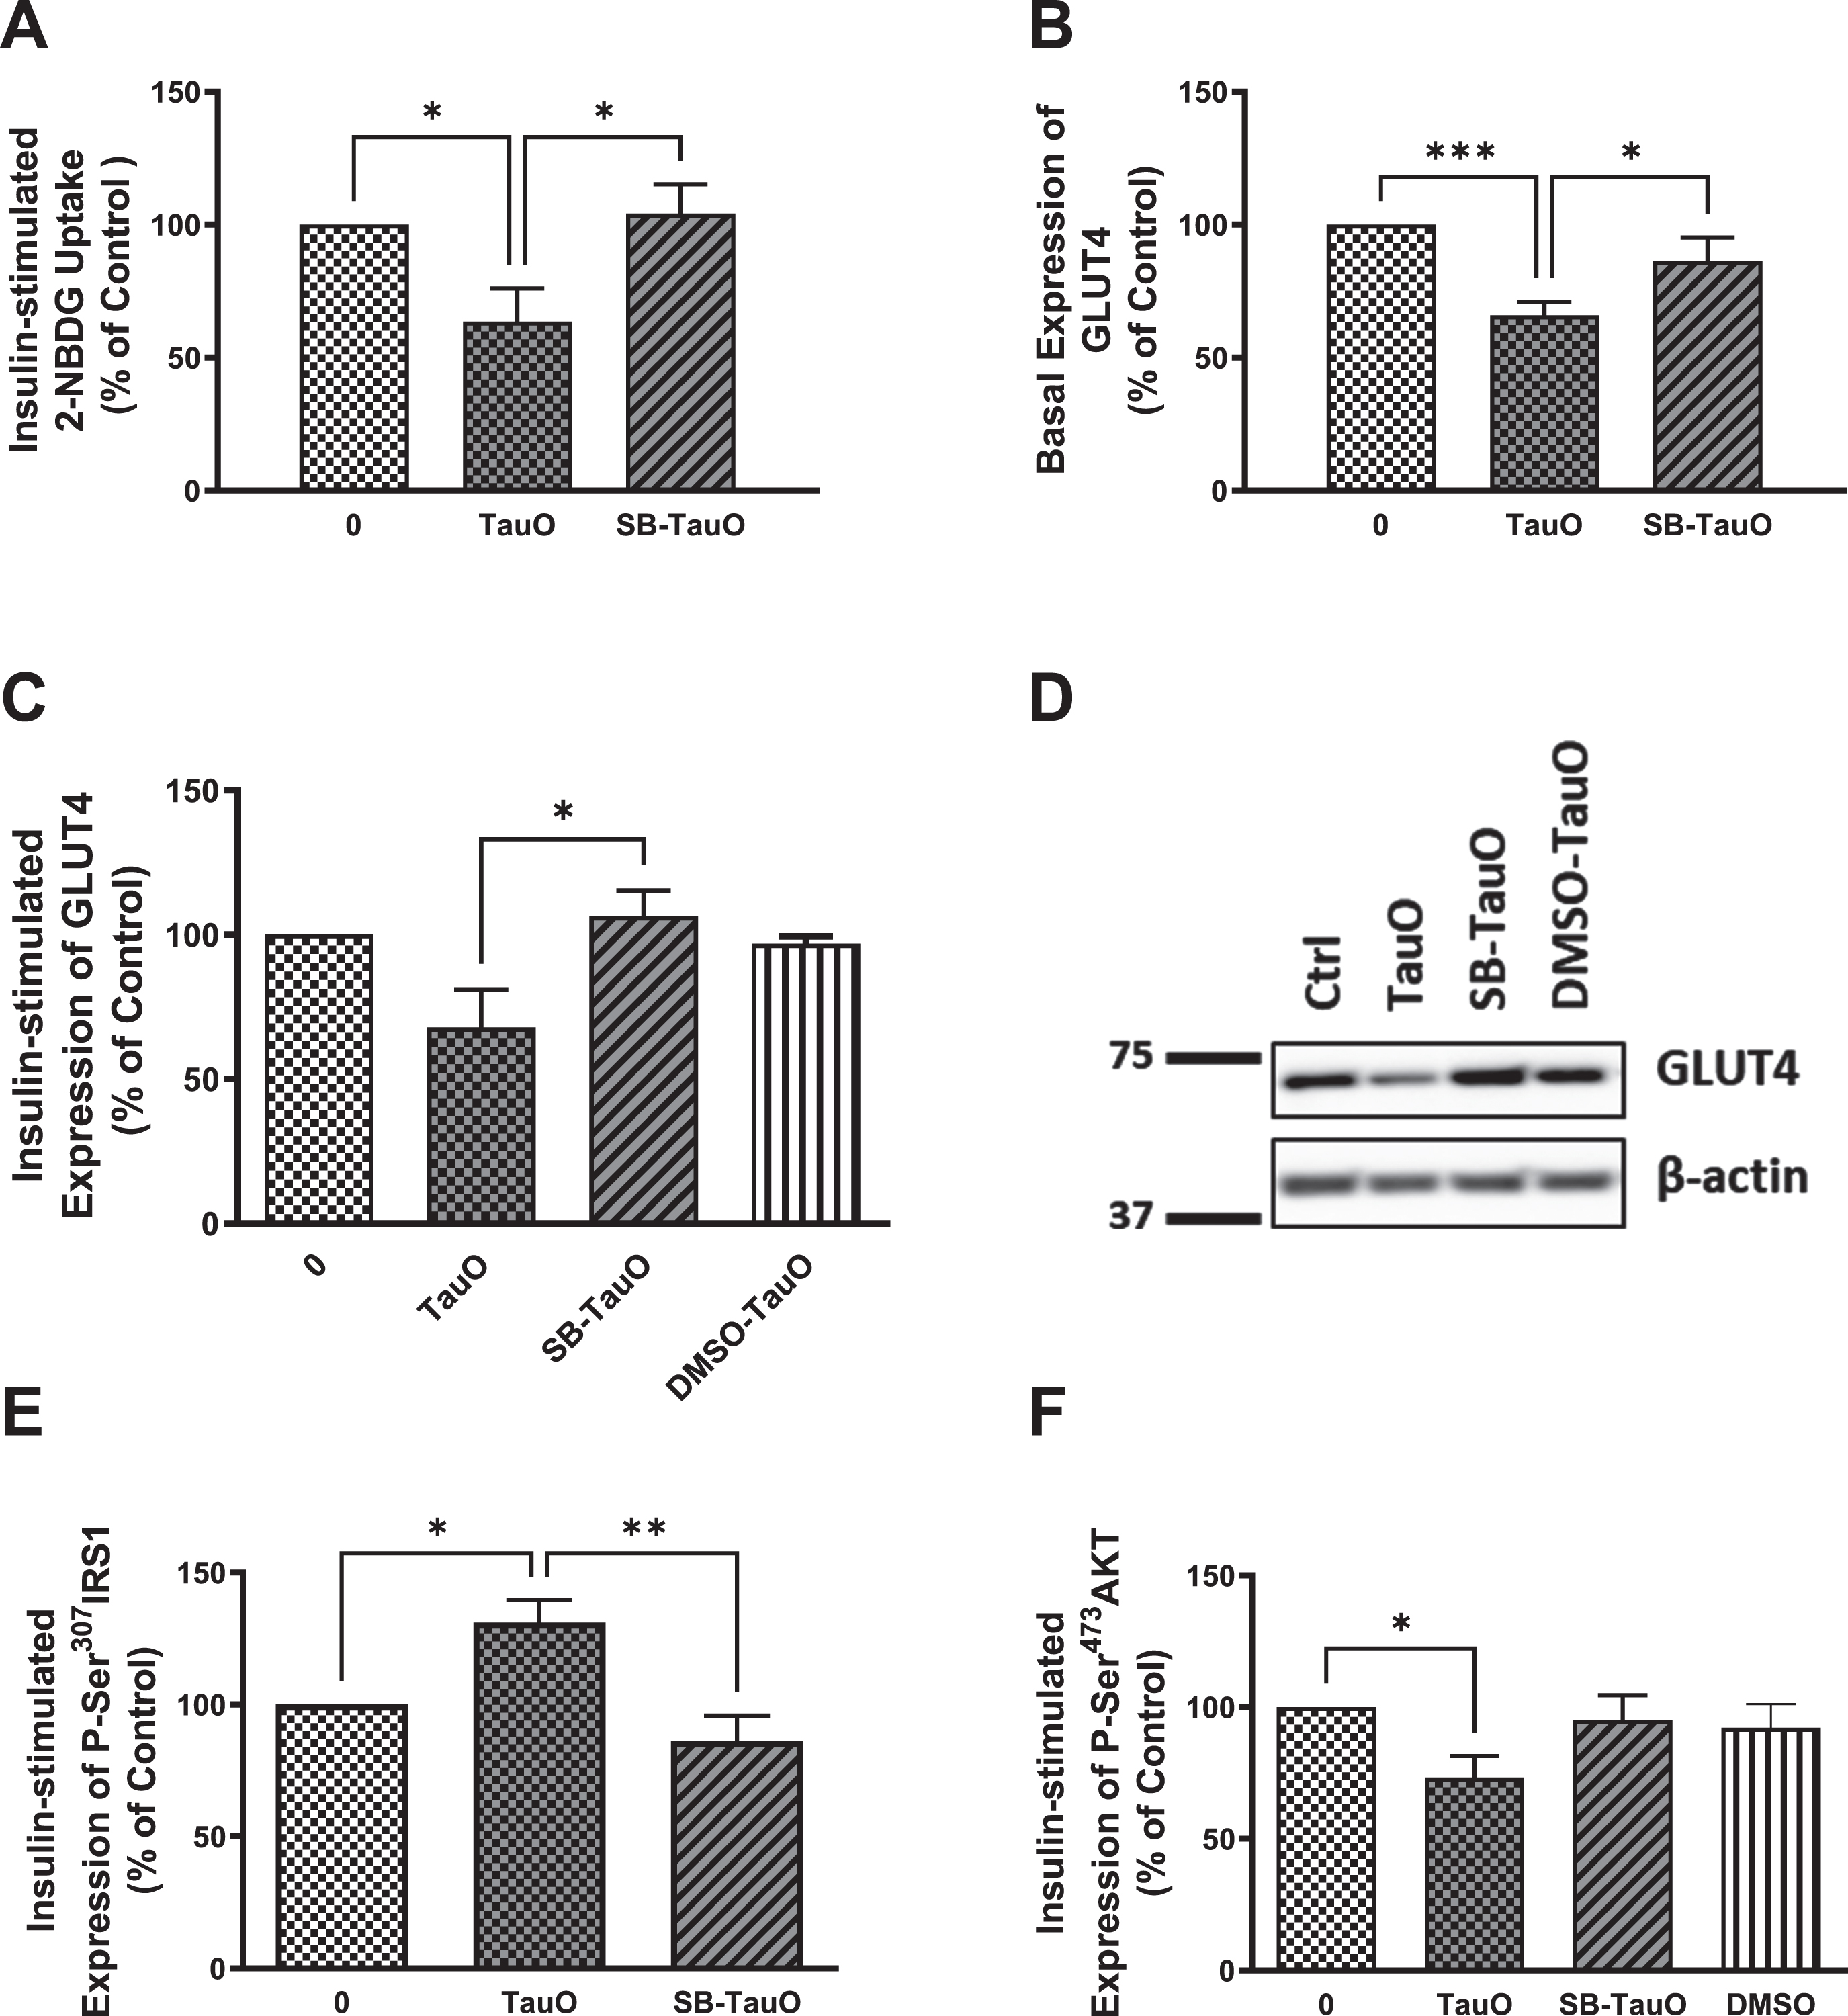
Previous studies have shown that p38 MAPK stress-response pathway mediates ROS-induced impairment of the insulin signaling pathway in primary mouse hepatocytes [59]. p38 MAPK has also been reported to upregulate PTEN resulting in insulin resistance [70, 71], while Marciniak et al. showed that neuronal tau reduces PTEN activity [47]. Therefore, to analyze if tau loss-of-function-induced insulin resistance may be mediated through activation of p38 stress-response pathway, we used a p38 MAPK pharmacological inhibitor, SB203580, to explore if it will rescue hepatocytes from TauO-induced insulin resistance, especially since we noticed a reduction in oxidative stress levels, accompanied by increase in glucose uptake, in Tau KO and P301 L hepatocytes upon treatment with the p38 MAPK inhibitor (Supplementary Figure 1). Furthermore, we also noticed increase in phosphorylation and activation of p38 MAPK in Tau KO and P301 L mice (data not shown). Therefore, cells were treated with 20μM SB203580 for 30 min prior to their TauO or TauO-insulin treatments, in the continued presence of the inhibitor. Pretreatment with SB203580 rescued the TauO-induced reduction in glucose uptake (Fig. 6A) accompanied by rescuing of the reduction in GLUT4 expression at the membrane using ELISA (Fig. 6B), which was also shown by western blot analysis (Fig. 6C, D). This effect was associated with a significant rescuing of TauO-induced Ser307 phosphorylation and inactivation of IRS-1 (Fig. 6E) as well as relief of TauO-induced inhibition of Ser473 phosphorylation and activation of Akt (Fig. 6F). These results suggest that the TauO-induced inhibition of insulin signaling might be, at least partially, mediated through the activation of p38MAPK. This requires further studying to investigate if this was due to a direct effect between tau and p38 MAPK or through TauO-induction of oxidative stress, or maybe via another mediator, such as PTEN as shown previously in the brain [47], especially that upregulation of PTEN expression has been shown to result from p38 activation of its downstream transcription factor-2 (ATF-2) that binds to the PTEN promoter region, leading to increased PTEN transcription [71].
Fig. 6
Exposure to the p38 MAPK inhibitor, SB203580, rescues TauO-induced downregulation of insulin signaling. Glucose-uptake: A) Treatment with 0.5μM TauO results in significant reduction of insulin-stimulated glucose uptake into primary wild type hepatocytes that is rescued by pretreatment with the p38 inhibitor, SB203580. Data represent mean±SEM of 7 (untreated, TauO treated) or 4 (SB-TauO-treated) mice. Western blot analysis: C, D) Pretreatment with SB203580 rescues TauO-induced reduction of insulin-stimulated expression of GLUT4 at the membrane in wild type primary mouse hepatocytes. Data represent mean±SEM of 4 (0, TauO) or 3 (SB-TauO, DMSO-TauO) mice. DMSO used as a vehicle control shows no effect on wild type primary hepatocytes. This effect was confirmed by ELISA (B), Data represent mean±SEM of 6 (0, TauO) or 3 (SB-TauO) mice. ELISA: E, F) Treatment with 0.5μM TauO results in a significant increase in phosphorylation and inactivation of IRS1-Ser307 (E) as well as a significant decrease in phosphorylation and activation of AKT-Ser473 (F). These effects were reversed by pretreatment with the p38 MAPK inhibitor, SB203580. DMSO used as a vehicle control shows no effect on wild type primary hepatocytes. The values are expressed as the percent of insulin-treated control. Data represent mean±SEM of 6 (E), or 7 (0, TauO, SB-TauO in F), 3 (DMSO in F) mice, each with two experimental replicates, *p < 0.05, **p < 0.01, ***p < 0.001; One-way ANOVA, Dunnett’s post hoc test.
DISCUSSION
Although many epidemiological studies have demonstrated an association between AD and T2D, and that both diseases are risk factors for each other, the mechanistic details at the cellular level are still lacking. Furthermore, majority of studies have concentrated on the insulin resistance in the brain with limited information about the cellular mechanism for the peripheral insulin resistance. Previous studies have demonstrated the presence of tau aggregates in the pancreatic islets, while they reported the absence of tau expression in the whole pancreas or in the liver using total tissue lysates, proposing that tau is expressed in a subset of cells in these organs [15]. Therefore, the contribution of liver hepatocytes towards tau aggregation or insulin resistance is still lacking. With the use of primary hepatocytes isolated from transgenic mouse models of tauopathy, we here provide the first direct demonstration, to our knowledge, that tau loss of function, by deletion or aggregation, leads to peripheral insulin resistance. By measuring glucose uptake into primary hepatocytes isolated from Tau KO and P301 L mice, we show that there is reduction in basal as well as insulin-stimulated glucose uptake into these hepatocytes compared to wild type mouse hepatocytes. This reduction was accompanied by reduction in the glucose transporter GLUT4 levels at the membrane as well as by a reduction in the phosphorylation and activation of IRβ and Akt as well as reduction in phosphorylation and inactivation of GSK3β, indicating insulin resistance. These observations are in accordance with a previous study that showed central insulin resistance in Tau KO mice [47], and a later study that showed peripheral insulin resistance in Tau KO mice, proposing an important role for tau in pancreatic β cell function and glucose homeostasis [15]. Our study was performed using P301 L mice at an age when the model displays tau aggregation, allowing us to explore the effect of tau aggregates on peripheral insulin signaling, whereas previous studies were done using transgenic mice at an age that does not exhibit any tau aggregation to investigate the effect of tau loss of function by mutation without the interference of aggregation [48]. Therefore, to confirm the tau aggregates-induction of insulin resistance we see in P301 L mice, we used tau oligomeric species to explore if they will cause similar effects as seen in P301 L mice.
Oligomeric tau appears to play an important role in the pathogenesis of a group of neurodegenerative diseases including AD, and has been shown to be the toxic species rather than the more fibrillar form of tau, NFTs [64, 65]. While the toxicity of tau is well-documented in cells in culture and in rodents, the pathological consequences of the interaction between tau and insulin signaling in peripheral tissues, in this case liver, remains unknown. To address this, we treated wild type hepatocytes with a sub-toxic concentration of TauO and evaluated insulin signaling post-treatment. We found that TauO induces significant reduction in glucose-uptake that is accompanied by reduction of GLUT4 at the membrane, as well as inactivation of IRS1 and Akt, indicating impairment of insulin signaling. IRS1 Ser307 phosphorylation has been shown by many studies to be a marker of insulin resistance [24, 25]. Consistent with this, we found an increase in IRS1 Ser307 phosphorylation in wild type hepatocytes exposed to TauO treatment.
One of the kinases that lead to tau phosphorylation, p38 MAPK [72, 73], has been shown to be activated in AD brains [74–76]. To explore the involvement of p38 MAPK in the TauO-induced downregulation of insulin signaling, we used a pharmacological inhibitor of p38 MAPK, SB203580, to pretreat hepatocytes followed by TauO treatment, in the continued presence of the inhibitor. We found that inhibition of the p38 stress-response pathway rescues hepatocytes from TauO-mediated attenuation of insulin signaling.
Our findings propose that there might be a vicious cycle linking impaired insulin signaling where active GSK3β can phosphorylate tau and tau loss of function can, therefore, lead to more insulin resistance, thereby aggravating the disease pathology further
Both AD and T2D are very devastating and costly diseases, with the incidence of both projecting to increase as the population is aging, thus making them major health concerns. The current data present an important role for tau in regulating peripheral insulin signaling, thus supporting the hypothesis that AD is not only a central disease, and there maybe peripheral components contributing to its pathogenesis. In addition, we revealed that tau loss of function might contribute to the progression of AD, supporting the evidence that insulin resistance and T2D accelerate conversion from mild cognitive impairment to dementia [77].
In summary, the present study demonstrates the importance of functional tau in peripheral insulin signaling. A growing body of evidence supports the link between diabetes and AD, where each disease is a risk factor for the other [78]. Furthermore, the presence of abnormally phosphorylated tau in pancreatic tissues of diabetic patients as well as in pancreatic islets of transgenic mouse models of AD and T2D, together with the current observations in this study, propose that tau loss of physiological function triggering peripheral insulin resistance can be an early pathophysiological event in AD pathogenesis and might be the mechanistic tool linking T2D and AD. Data in this study also provide appreciation of a new physiological involvement of tau in peripheral insulin signaling. Further studies include extending these studies towards human postmortem peripheral tissues by testing mild cognitive impairment and AD patients’ peripheral tissues for insulin resistance. Data in this study also layout awareness that it is vital to look at tau beyond its neuronal microtubule binding function and to analyze it not only in the brain, but also in the periphery in neurodegenerative diseases.
The findings of this study are critical as they suggest that targeting tau by immunotherapy as a therapeutic approach in AD might cause peripheral insulin resistance, thus leading to a chain of events that are detrimental to older patients. Therefore, it is important to test peripheral insulin resistance in preclinical studies using passive immunotherapy targeting tau species to make sure that AD therapeutic strategies target only non-functional tau aggregates and not monomeric functional tau.
Finally, our findings implicated that tau plays a pivotal role in insulin signaling, therefore playing a crucial role in the pathogenesis of AD, especially at early stages. This will help in the search for better diagnostic tools for AD, as well as will pave the way for novel therapeutic strategies that will benefit both T2D as well as AD.
ACKNOWLEDGMENTS
We would like to thank Dr. Victor Banerjee (Mitchell Center for Alzheimer’s Disease and Related Brain Disorders) for his help with TEM imaging of sonicated fibrils as well as Dr. Neal M. Waxham (UT Health Science Center at Houston) for his help with TEM imaging of tau aggregates.
FUNDING
This work was supported by the Alzheimer’s Association Research Fellowship (AARF) Program 2018-AARF-592035.
CONFLICT OF INTEREST
The authors have no conflict of interest to report.
DATA AVAILABILITY
The data supporting the findings of this study are available upon request from the corresponding author.
SUPPLEMENTARY MATERIAL
[1] The supplementary material is available in the electronic version of this article: https://dx.doi.org/10.3233/JAD-230392.
REFERENCES
[1] | Maher PA , Schubert DR ((2009) ) Metabolic links between diabetes and Alzheimer’s disease. Expert Rev Neurother 9: , 617–630. |
[2] | Ott A , Stolk RP , van Harskamp F , Pols HA , Hofman A , Breteler MM ((1999) ) Diabetes mellitus and the risk of dementia: The Rotterdam Study. Neurology 53: , 1937–1942. |
[3] | Leibson CL , Rocca WA , Hanson VA , Cha R , Kokmen E , O’Brien PC , Palumbo PJ ((1997) ) Risk of dementia among persons with diabetes mellitus: A population- based cohort study. Am J Epidemiol 145: , 301–308. |
[4] | Hoyer S ((2004) ) Glucose metabolism and insulin receptor signal transduction in Alzheimer disease. Eur J Pharmacol 490: , 115–125. |
[5] | De la Monte SM ((2014) ) Relationships between diabetes and cognitive impairment. Endocrinol Metab Clin North Am 43: , 245–267. |
[6] | Steen E , Terry BM , Rivera EJ , Cannon JL , Neely TR , Tavares R , Xu XJ , Wands JR , De La Monte SM ((2005) ) Impaired insulin and insulin-like growth factor expression and signaling mechanisms in Alzheimer’s disease - Is this type 3 diabetes? J Alzheimers Dis 7: , 63–80. |
[7] | Bomfim TR , Forny-Germano L , Sathler LB , Brito-Moreira J , Houzel JC , Decker H , Silverman MA , Kazi H , Melo HM , McClean PL , Holscher C , Arnold SE , Talbot K , Klein WL , Munoz DP , Ferreira ST , De Felice FG ((2012) ) An anti-diabetes agent protects the mouse brain from defective insulin signaling caused by Alzheimer’s disease-associated Aβ oligomers. J Clin Invest 122: , 1339–1353. |
[8] | Moloney AM , Griffin RJ , Timmons S , O’Connor R , Ravid R , O’Neill C ((2010) ) Defects in IGF-1 receptor, insulin receptor and IRS-1/2 in Alzheimer’s disease indicate possible resistance to IGF-1 and insulin signalling. Neurobiol Aging 31: , 224–243. |
[9] | Talbot K , Wang HY , Kazi H , Han LY , Bakshi KP , Stucky A , Fuino RL , Kawaguchi KR , Samoyedny AJ , Wilson RS , Arvanitakis Z , Schneider JA , Wolf BA , Bennett DA , Trojanowski JQ , Arnold SE ((2012) ) Demonstrated brain insulin resistance in alzheimer’s disease patients is associated with IGF-1 resistance, IRS-1 dysregulation, and cognitive decline. J Clin Invest 122: , 1316–1338. |
[10] | Rivera EJ , Goldin A , Fulmer N , Tavares R , Wands JR , De La Monte SM ((2005) ) Insulin and insulin-like growth factor expression and function deteriorate with progression of Alzheimer’s disease: Link to brain reductions in acetylcholine. J Alzheimers Dis 8: , 247–268. |
[11] | Yarchoan M , Toledo JB , Lee EB , Arvanitakis Z , Kazi H , Han LY , Louneva N , Lee VMY , Kim SF , Trojanowski JQ , Arnold SE ((2014) ) Abnormal serine phosphorylation of insulin receptor substrate 1 is associated with tau pathology in Alzheimer’s disease and tauopathies. Acta Neuropathol 128: , 679–689. |
[12] | Stanley M , Macauley SL , Holtzman DM ((2016) ) Changes in insulin and insulin signaling in Alzheimer’s disease: Cause or consequence? J Exp Med 213: , 1375–1385. |
[13] | Frölich L , Blum-Degen D , Bernstein HG , Engelsberger S , Humrich J , Laufer S , Muschner D , Thalheimer A , Türk A , Hoyer S , Zöchling R , Boissl KW , Jellinger K , Riederer P ((1998) ) Brain insulin and insulin receptors in aging and sporadic Alzheimer’s disease. J Neural Transm 105: , 423–438. |
[14] | Takeda S , Sato N , Uchio-Yamada K , Sawada K , Kunieda T , Takeuchi D , Kurinami H , Shinohara M , Rakugi H , Morishita R ((2010) ) Diabetes-accelerated memory dysfunction via cerebrovascular inflammation and Aβ deposition in an Alzheimer mouse model with diabetes. Proc Natl Acad Sci U S A 107: , 7036–7041. |
[15] | Wijesekara N , Goncalves RA , Ahrens R , De Felice FG , Fraser PE ((2018) ) Tau ablation in mice leads to pancreatic b cell dysfunction and glucose intolerance. FASEB J 32: , 3166–3173. |
[16] | Wijesekara N , Goncalves RA , De Felice FG , Fraser PE ((2018) ) Impaired peripheral glucose homeostasis and Alzheimer’s disease. Neuropharmacology 136: , 172–181. |
[17] | Schubert M , Gautam D , Surjo D , Ueki K , Baudler S , Schubert D , Kondo T , Alber J , Galldiks N , Küstermann E , Arndt S , Jacobs AH , Krone W , Ronald Kahn C , Brüning JC ((2004) ) Role for neuronal insulin resistance in neurodegenerative diseases. Proc Natl Acad Sci U S A 101: , 3100–3105. |
[18] | Hokama M , Oka S , Leon J , Ninomiya T , Honda H , Sasaki K , Iwaki T , Ohara T , Sasaki T , LaFerla FM , Kiyohara Y , Nakabeppu Y ((2014) ) Altered expression of diabetes-related genes in Alzheimer’s disease brains: The Hisayama study. Cereb Cortex 24: , 2476–2488. |
[19] | Matsuzaki T , Sasaki K , Tanizaki Y , Hata J , Fujimi K , Matsui Y , Sekita A , Suzuki SO , Kanba S , Kiyohara Y , Iwaki T ((2010) ) Insulin resistance is associated with the pathology of Alzheimer disease: The Hisayama study. Neurology 75: , 764–770. |
[20] | Tortelli R , Lozupone M , Guerra V , Barulli MR , Imbimbo BP , Capozzo R , Grasso A , Tursi M , Di Dio C , Sardone R , Giannelli G , Seripa D , Misciagna G , Panza F , Logroscino G ((2017) ) Midlife metabolic profile and the risk of late-life cognitive decline. J Alzheimers Dis 59: , 121–130. |
[21] | Craft S ((2007) ) Insulin resistance and Alzheimers disease pathogenesis: Potential mechanisms and implications for treatment. Curr Alzheimer Res 4: , 147–152. |
[22] | Calsolaro V , Edison P ((2016) ) Alterations in glucose metabolism in Alzheimer’s disease. Recent Pat Endocr Metab Immune Drug Discov 10: , 31–39. |
[23] | De Felice FG ((2013) ) Alzheimer’s disease and insulin resistance: Translating basic science into clinical applications. J Clin Invest 123: , 531–539. |
[24] | Aguirre V , Uchida T , Yenush L , Davis R , White MF ((2000) ) The c-JunNH2-terminal kinase promotes insulin resistance during associationwith insulin receptor substrate-1 and phosphorylation of Ser307. J Biol Chem 275: , 9047–9054. |
[25] | Copps KD , White MF ((2012) ) Regulation of insulin sensitivity by serine/threonine phosphorylation of insulin receptor substrate proteins IRS1 and IRS2. Diabetologia 55: , 2565–2582. |
[26] | Zhang X , Tang S , Zhang Q , Shao W , Han X , Wang Y , Du Y ((2016) ) Endoplasmic reticulum stress mediates JNK-dependent IRS-1 serine phosphorylation and results in Tau hyperphosphorylation in amyloid β oligomer-treated PC12 cells and primary neurons. Gene 587: , 183–193. |
[27] | Ma QL , Yang F , Rosario ER , Ubeda OJ , Beech W , Gant DJ , Ping PC , Hudspeth B , Chen C , Zhao Y , Vinters H V. , Frautschy SA , Cole GM ((2009) ) β-Amyloid oligomers induce phosphorylation of tau and inactivation of insulin receptor substrate via c-Jun N-terminal kinase signaling: Suppression by omega-3 fatty acids and curcumin. J Neurosci 29: , 9078–9089. |
[28] | De Felice FG , Vieira MNN , Bomfim TR , Decker H , Velasco PT , Lambert MP , Viola KL , Zhao WQ , Ferreira ST , Klein WL ((2009) ) Protection of synapses against Alzheimer’s-linked toxins: Insulin signaling prevents the pathogenic binding of Aβ oligomers. Proc Natl Acad Sci U S A 106: , 1971–1976. |
[29] | Zhao WQ , Townsend M ((2009) ) Insulin resistance and amyloidogenesis as common molecular foundation for type 2 diabetes and Alzheimer’s disease. Biochim Biophys Acta 1792: , 482–496. |
[30] | Zhao W , De Felice FG , Fernandez S , Chen H , Lambert MP , Quon MJ , Krafft GA , Klein WL ((2008) ) Amyloid beta oligomers induce impairment of neuronal insulin receptors. FASEB J 22: , 246–260. |
[31] | Clarke JR , Lyra e Silva NM , Figueiredo CP , Frozza RL , Ledo JH , Beckman D , Katashima CK , Razolli D , Carvalho BM , Frazão R , Silveira MA , Ribeiro FC , Bomfim TR , Neves FS , Klein WL , Medeiros R , LaFerla FM , Carvalheira JB , Saad MJ , Munoz DP , Velloso LA , Ferreira ST , De Felice FG ((2015) ) Alzheimer-associated Aβ oligomersimpact the central nervous system to induce peripheral metabolicderegulation. EMBO Mol Med 7: , 190–210. |
[32] | Hiltunen M , Khandelwal VKM , Yaluri N , Tiilikainen T , Tusa M , Koivisto H , Krzisch M , Vepsäläinen S , Mäkinen P , Kemppainen S , Miettinen P , Haapasalo A , Soininen H , Laakso M , Tanila H ((2012) ) Contribution of genetic and dietary insulin resistance to Alzheimer phenotype in APP/PS1 transgenic mice. J Cell Mol Med 16: , 1206–1222. |
[33] | Michailidis M , Moraitou D , Tata DA , Kalinderi K , Papamitsou T , Papaliagkas V ((2022) ) Alzheimer’s disease as type 3 diabetes: Common pathophysiological mechanisms between Alzheimer’s disease and type 2 diabetes. Int J Mol Sci 23: , 2687. |
[34] | Lester-Coll N , Rivera EJ , Soscia SJ , Doiron K , Wands JR , De La Monte SM , ((2006) ) Intracerebral streptozotocin model of type 3 diabetes: Relevance to sporadic Alzheimer’s disease. J Alzheimers Dis 9: , 13–33. |
[35] | Hoyer S ((1998) ) Is sporadic Alzheimer disease the brain type of non-insulin dependent diabetes mellitus? A challenging hypothesis. J Neural Transm 105: , 415–422. |
[36] | Janson J , Laedtke T , Parisi JE , O’Brien P , Petersen RC , Butler PC ((2004) ) Increased risk of type 2 diabetes in Alzheimer disease. Diabetes 53: , 474–481. |
[37] | Schrijvers EMC , Witteman JCM , Sijbrands EJG , Hofman A , Koudstaal PJ , Breteler MMB ((2010) ) Insulin metabolism and the risk of Alzheimer disease: The Rotterdam Study. Neurology 75: , 1982–1987. |
[38] | Saczynski JS , Jónsdóttir MK , Garcia ME , Jonsson PV , Peila R , Eiriksdottir G , Olafsdottir E , Harris TB , Gudnason V , Launer LJ ((2008) ) Cognitive impairment: An increasingly important complication of type 2 diabetes. Am J Epidemiol 168: , 1132–1139. |
[39] | Peila R , Rodriguez BL , Launer LJ ((2002) ) Type 2 diabetes, APOE gene, and the risk for dementia and related pathologies: The Honolulu-Asia Aging Study. Diabetes 51: , 1256–1262. |
[40] | Rönnemaa E , Zethelius B , Sundelöf J , Sundström J , Degerman-Gunnarsson M , Berne C , Lannfelt L , Kilander L ((2008) ) Impaired insulin secretion increases the risk of Alzheimer disease. Neurology 71: , 1065–1071. |
[41] | Profenno LA , Porsteinsson AP , Faraone SV ((2010) ) Meta-analysis of Alzheimer’s disease risk with obesity, diabetes, and related disorders. Biol Psychiatry 67: , 505–512. |
[42] | Ott A , Stolk RP , Hofman A , Van Harskamp F , Grobbee DE , Breteler MMB ((1996) ) Association of diabetes mellitus and dementia: The Rotterdam Study. Diabetologia 39: , 1392–1397. |
[43] | Ohara T , Doi Y , Ninomiya T , Hirakawa Y , Hata J , Iwaki T , Kanba S , Kiyohara Y , ((2011) ) Glucose tolerance status and risk of dementia in the community: The Hisayama Study. Neurology 77: , 1126–1134. |
[44] | Cao D , Lu H , Lewis TL , Li N ((2007) ) Intake of sucrose-sweetened water induces insulin resistance and exacerbates memory deficits and amyloidosis in a transgenic mouse model of Alzheimer disease. J Biol Chem 282: , 36275–36282. |
[45] | Ho L , Qin W , Pompl PN , Xiang Z , Wang J , Zhao Z , Peng Y , Cambareri G , Rocher A , Mobbs C V. , Hof PR , Pasinetti GM ((2004) ) Diet-induced insulin resistance promotes amyloidosis in a transgenic mouse model of Alzheimer’s disease. FASEB J 18: , 902–904. |
[46] | Crane PK , Walker R , Hubbard RA , Li G , Nathan DM , Zheng H , Haneuse S , Craft S , Montine TJ , Kahn SE , McCormick W , McCurry SM , Bowen JD , Larson EB ((2013) ) Glucose levels and risk of dementia. N Engl J Med 369: , 540–548. |
[47] | Marciniak E , Leboucher A , Caron E , Ahmed T , Tailleux A , Dumont J , Issad T , Gerhardt E , Pagesy P , Vileno M , Bournonville C , Hamdane M , Bantubungi K , Lancel S , Demeyer D , Eddarkaoui S , Vallez E , Vieau D , Humez S , Faivre E , Grenier-Boley B , Outeiro TF , Staels B , Amouyel P , Balschun D , Buee L , Blum D ((2017) ) Tau deletion promotes brain insulin resistance. J Exp Med 214: , 2257–2269. |
[48] | Benderradji H , Kraiem S , Courty E , Eddarkaoui S , Bourouh C , Faivre E , Rolland L , Caron E , Besegher M , Oger F , Boschetti T , Carvalho K , Thiroux B , Gauvrit T , Nicolas E , Gomez-Murcia V , Bogdanova A , Bongiovanni A , Muhr-Tailleux A , Lancel S , Bantubungi K , Sergeant N , Annicotte JS , Buée L , Vieau D , Blum D , Buée-Scherrer V ((2022) ) Impaired glucose homeostasis in a tau knock-in mouse model. Front Mol Neurosci 15: , 841892. |
[49] | Maj M , Gartner W , Ilhan A , Neziri D , Attems J , Wagner L ((2010) ) Expression of TAU in insulin-secreting cells and its interaction with the calcium-binding protein secretagogin. J Endocrinol 205: , 25–36. |
[50] | Miklossy J , Qing H , Radenovic A , Kis A , Vileno B , Làszló F , Miller L , Martins RN , Waeber G , Mooser V , Bosman F , Khalili K , Darbinian N , McGeer PL ((2010) ) Beta amyloid and hyperphosphorylatedtau deposits in the pancreas in type 2 diabetes. NeurobiolAging 31: , 1503–1515. |
[51] | Martinez-Valbuena I , Valenti-Azcarate R , Amat-Villegas I , Marcilla I , Marti-Andres G , Caballero MC , Riverol M , Tuñon MT , Fraser PE , Luquin MR ((2021) ) Mixed pathologies in pancreatic β cells from subjects with neurodegenerative diseases and their interaction with prion protein. Acta Neuropathol Commun 9: , 64. |
[52] | Wijesekara N , Ahrens R , Sabale M , Wu L , Ha K , Verdile G , Fraser PE ((2017) ) Amyloid-b and islet amyloid pathologies link Alzheimer’s disease and type 2 diabetes in a transgenic model. FASEB J 31: , 5409–5418. |
[53] | Maj M , Hoermann G , Rasul S , Base W , Wagner L , Attems J ((2016) ) The microtubule-associated protein Tau and its relevance for pancreatic beta cells. J Diabetes Res 2016: , 1964634. |
[54] | Vanier MT , Neuville P , Michalik L , Launay JF ((1998) ) Expression of specific tau exons in normal and tumoral pancreatic acinar cells. J Cell Sci 111: (Pt 10), 1419–1432. |
[55] | Ma Q-L , Zuo X , Yang F , Ubeda OJ , Gant DJ , Alaverdyan M , Kiosea NC , Nazari S , Chen PP , Nothias F , Chan P , Teng E , Frautschy SA , Cole GM ((2014) ) Loss of MAP function leads to hippocampal synapse loss anddeficits in the Morris water maze with aging. J Neurosci 34: , 7124–7136. |
[56] | Lewis J , McGowan E , Rockwood J , Melrose H , Nacharaju P , Van Slegtenhorst M , Gwinn-Hardy K , Murphy MP , Baker M , Yu X , Duff K , Hardy J , Corral A , Lin W-L , Yen S-H , Dickson DW , Davies P , Hutton M ((2000) ) Neurofibrillary tangles, amyotrophy and progressive motor disturbance in mice expressing mutant (P301L) tau protein. Nat Genet 25: , 402–405. |
[57] | Banerjee V , Shani T , Katzman B , Vyazmensky M , Papo N , Israelson A , Engel S ((2016) ) Superoxide dismutase 1 (SOD1)-derived peptide inhibits amyloid aggregation of familial amyotrophic lateral sclerosis SOD1 mutants. ACS Chem Neurosci 71: , 1595–1606. |
[58] | Banerjee V , Oren O , Ben-Zeev E , Taube R , Engel S , Papo N ((2017) ) A computational combinatorial approach identifies a protein inhibitor of superoxide dismutase 1 misfolding, aggregation, and cytotoxicity. J Biol Chem 292: , 15777–15788. |
[59] | Al-Lahham R , Deford JH , Papaconstantinou J ((2016) ) Mitochondrial-generated ROS down regulates insulin signaling via activation of the p38MAPK stress response pathway. Mol Cell Endocrinol 419: , 1–11. |
[60] | Vassar PS , Culling CF ((1959) ) Fluorescent stains, with special reference to amyloid and connective tissues. Arch Pathol 68: , 487–498. |
[61] | Kelényi G ((1967) ) On the histochemistry of azo group-freethiazole dyes. J Histochem Cytochem 15: , 172–180. |
[62] | Naiki H , Higuchi K , Hosokawa M , Takeda T ((1989) ) Fluorometric determination of amyloid fibrils in vitro using the fluorescent dye, thioflavine T. Anal Biochem 177: , 244–249. |
[63] | Robbins KJ , Liu G , Selmani V , Lazo ND ((2012) ) Conformational analysis of thioflavin T bound to the surface of amyloid fibrils. Langmuir 28: , 16490–16495. |
[64] | Morsch R , Simon W , Coleman PD ((1999) ) Neurons may live for decades with neurofibrillary tangles. J Neuropathol Exp Neurol 58: , 188–197. |
[65] | Bondareff W , Mountjoy CQ , Roth M , Hauser DL ((1989) ) Neurofibrillary degeneration and neuronal loss in Alzheimer’s disease. Neurobiol Aging 10: , 709–715. |
[66] | Berger Z , Roder H , Hanna A , Carlson A , Rangachari V , Yue M , Wszolek Z , Ashe K , Knight J , Dickson D , Andorfer C , Rosenberry TL , Lewis J , Hutton M , Janus C ((2007) ) Accumulation of pathological tau species and memory loss in a conditional model of tauopathy. J Neurosci 27: , 3650–3662. |
[67] | Andorfer C , Acker CM , Kress Y , Hof PR , Duff K , Davies P ((2005) ) Cell-cycle reentry and cell death in transgenic mice expressing nonmutant human tau isoforms. J Neurosci 25: , 5446–5454. |
[68] | SantaCruz K , Lewis J , Spires T , Paulson J , Kotilinek L , Ingelsson M , Guimaraes A , DeTure M , Ramsden M , McGowan E , Forster C , Yue M , Orne J , Janus C , Mariash A , Kuskowski M , Hyman B , Hutton M , Ashe KH ((2005) ) Tau suppression in a neurodegenerative mouse model improves memory function. Science 309: , 476–481. |
[69] | Spires TL , Orne JD , SantaCruz K , Pitstick R , Carlson GA , Ashe KH , Hyman BT ((2006) ) Region-specific dissociation of neuronal loss and neurofibrillary pathology in a mouse model of tauopathy. Am J Pathol 168: , 1598–1607. |
[70] | Liu HY , Collins QF , Xiong Y , Moukdar F , Lupo EG , Liu Z , Cao W ((2007) ) Prolonged treatment of primary hepatocytes with oleate induces insulin resistance through p38 mitogen-activated protein kinase. J Biol Chem 282: , 14205–14212. |
[71] | Shen YH , Zhang L , Gan Y , Wang X , Wang J , LeMaire SA , Coselli JS , Wang XL ((2006) ) Up-regulation of PTEN (phosphatase and tensin homolog deleted on chromosome ten) mediates p38 MAPK stress signal-induced inhibition of insulin signaling: A cross-talk between stress signaling and insulin signaling in resistin-treated human endothelial cel. J Biol Chem 281: , 7727–7736. |
[72] | Reynolds CH , Nebreda AR , Gibb GM , Utton MA , Anderton BH ((1997) ) Reactivating kinase/p38 phosphorylates τ protein in vitro. J Neurochem 69: , 191–198. |
[73] | Kelleher I , Garwood C , Hanger DP , Anderton BH , Noble W ((2007) ) Kinase activities increase during the development of tauopathy in htau mice. J Neurochem 103: , 2256–2267. |
[74] | Hensley K , Floyd RA , Zheng NY , Nael R , Robinson KA , Nguyen X , Pye QN , Stewart CA , Geddes J , Markesbery WR , Patel E , Johnson GVW , Bing G ((1999) ) p38 Kinase is activated in the Alzheimer’s disease brain. J Neurochem 72: , 2053–2058. |
[75] | Sun A , Liu M , Nguyen XV , Bing G ((2003) ) p38 MAP kinase is activated at early stages in Alzheimer’s disease brain. Exp Neurol 183: , 394–405. |
[76] | Lee JK , Kim NJ ((2017) ) Recent advances in the inhibition of p38 MAPK as a potential strategy for the treatment of Alzheimer’s disease. Molecules 22: , 1287. |
[77] | Xu W , Caracciolo B , Wang HX , Winblad B , Bäckman L , Qiu C , Fratiglioni L ((2010) ) Accelerated progression from mild cognitive impairment to dementia in people with diabetes. Diabetes 59: , 2928–2935. |
[78] | Yang Y , Song W ((2013) ) Molecular links between Alzheimer’s disease and diabetes mellitus. Neuroscience 250: , 140–150. |


