
Differences in the Cognitive Function of Mexican Adults Aged 60 and Older with Self-Reported Diabetes in 2001 and 2018
Abstract
Background:
The prevalence of type 2 diabetes in Mexico has nearly doubled for adults aged ≥60. Increases in education and healthcare resources to manage chronic conditions have contributed to population-level increases in the cognitive functioning of older adults. However, research has not focused on older adults with chronic conditions such as diabetes.
Objective:
Our objective was to compare the cognitive functioning of Mexican adults aged ≥60 with diabetes in 2001 and 2018.
Methods:
Data came from Mexican Health and Aging Study. Our study used a cross-sectional design and included participants aged ≥60 with self-reported diabetes during the 2001 (n = 1,052, mean age = 68.4, female = 59.6%) and 2018 (n = 2,469, mean age = 70.6, female = 62.0%) observation waves. Five cognitive tests were used to create a score of global cognition. Generalized estimating equations were used to compare global cognition in 2001 to 2018.
Results:
Older adults in 2018 had more education and were more likely than older adults in 2001 to take oral medication for diabetes, insulin, and to check blood sugar weekly. Older adults in 2018 had higher global cognition than in 2001 when adjusting for age, gender, education, and health insurance coverage (b = 0.38, SE = 0.02). This statistically significant difference remained after adjusting for health conditions, health behaviors, and diabetes management behaviors.
Conclusions:
Older adults in Mexico with self-reported diabetes in 2018 had higher cognitive function than in 2001. Future research is needed to investigate causes of the cohort differences in cognitive functioning among Mexican older adults with self-reported diabetes.
INTRODUCTION
Older adults with hyperglycemia and type 2 diabetes mellitus (T2DM) can experience accelerated cognitive decline and are at an increased risk for cognitive impairment and dementia [1]. Type 2 diabetes mellitus may be causally related to poor cognitive functioning among older adults through the adverse effects of hyperglycemia on the brain [2, 3]. Pre-diabetes and T2DM are associated with neurodegeneration, reduced white matter volume, and increased white matter hyperintensities [4, 5].
The rising prevalence of T2DM among older adults is a global public health concern. Latin American countries such as Mexico are projected to experience a disproportionately higher burden of T2DM [6]. Between 2000 and 2012, the prevalence of T2DM in Mexico doubled for adults aged 70 and older and increased by 1.5 times for adults aged 60 to 69 [7]. The prevalence of T2DM among adults aged 50 and older in Mexico is expected to increase from 19.8% in 2012 to 28.6% in 2050 [8]. The increasing trend in T2DM prevalence is a concern, given that T2DM is associated with lower cognitive functioning and an increased risk of severe cognitive impairment for older adults in Mexico [9–11].
The increasing prevalence and incidence of T2DM in Mexico are occurring in the context of rapid population aging. Current projections estimate that the percentage of Mexico’s population aged 60 and older will increase from 10% in 2017 to 25% in 2050 [12]. The growing number of older adults in Mexico will increase the number of older adults living with cognitive impairment and dementia [13].
While the prevalence of T2DM for older adults in Mexico is increasing and the older adult population is expanding, life course characteristics beneficial to late-life cognitive functioning, such as educational attainment and health insurance coverage, have also increased, and public health initiatives have improved health behaviors. The percentage of Mexican adults aged 50 and older with seven or more years of formal education has increased from 20.5% and 16.6% for men and women, respectively, in 2001 to 43.4% and 41.4% in 2012 [14]. Greater educational attainment has consistently been associated with higher late-life cognition and lower dementia risk [15], including for older adults in Mexico [16].
In 2004, Mexico launched Seguro Popular, a public health insurance program that has provided health insurance coverage to over 50 million previously uninsured individuals [17]. Expanding health insurance coverage in Mexico has been associated with increased T2DM screening and diagnosis [18, 19]. The expanded access to health insurance coverage has potentially important implications for cognitive aging in Mexico. Prior research has shown that older adults in Mexico with health insurance coverage have higher cognitive functioning than uninsured older adults [16, 20].
Seguro Popular has also contributed to the increased use of insulin and oral medications among older adults with T2DM [21], especially those living in urban areas where medical services are readily available [18]. Uncontrolled T2DM is associated with lower cognitive functioning among older adults. A longitudinal study of adults aged 50 and older with T2DM from the United Kingdom showed that elevated hemoglobin A1c and microvascular complications, including neuropathy and nephropathy, were associated with increased dementia risk [22]. Conversely, using insulin and other treatments can reflect greater T2DM severity. Older adults with T2DM who use insulin have been found to have greater dementia risk than older adults with T2DM who do not use insulin.
Mexico has also shown diverging trends in health behaviors associated with T2DM and late-life cognitive functioning, such as smoking and physical activity [23–26]. In 2004, Mexico implemented several anti-smoking policies, including increases in cigarette taxes, regulations on advertising smoking products, and restrictions on smoking indoors [27]. These policies reduced smoking prevalence among adults aged 65 and older from nearly 30% in 2003 to approximately 20% in 2012 for men and 12% to 8% for women [28]. Conversely, the percentage of adults in Mexico who are physically inactive increased from 14% in 2006 to 20.8% in 2018 [29].
Evidence from high-income countries suggests decreasing dementia prevalence and incidence [30, 31]. Other US-based studies have reported trends of increased cognitively healthy life expectancy over time [32]. These trends have been attributed to population-level increases in educational attainment and better management of chronic conditions, such as T2DM [33]. Few studies have investigated similar population-level trends in the cognitive health of older adults in Mexico. Using data from the Mexican Health and Aging Study, Diaz-Venegas and colleagues reported that men and women aged 60 and older in 2012 had higher cognitive functioning than men and women in 2001 [34].
It is unknown if similar population-level trends in cognitive functioning are occurring in older adult populations with chronic conditions such as T2DM, especially in a country such as Mexico, which is expected to experience an increasingly high burden of dementia and T2DM [8, 13]. Population aging in Mexico makes it important to understand how population-level changes in demographic characteristics, co-morbid health conditions, health behaviors, and diabetes management have contributed to the cognitive functioning of the growing older adult population with T2DM in Mexico.
Our primary objective was to compare the cognitive functioning of Mexican adults aged 60 and older with self-reported diabetes in 2001 to adults aged 60 and older with self-reported diabetes in 2018. Our primary hypothesis was that older adults with self-reported diabetes in 2018 would have higher cognitive functioning than those with self-reported diabetes in 2001. We also sought to describe trends in the health behaviors, and the management and treatment of T2DM among Mexican older adults and investigate if these trends contributed to differences in cognitive functioning between older adults with self-reported diabetes in 2001 and 2018. We focused these analyses on T2DM treatment behaviors to determine if increased use of T2DM treatments represented better disease management and treatment or greater disease severity and how these scenarios may influence the cognitive functioning of older adults with T2DM. We hypothesized that T2DM management behaviors (e.g., insulin use, oral medications, checking blood sugar) would be higher in 2018 than in 2001. We also hypothesized that these trends would at least partially explain any population-level differences in the cognitive functioning of older adults with self-reported diabetes.
METHODS
Data source and sample selection
Our analysis used data from participants of the Mexican Health and Aging Study (MHAS). The MHAS is a longitudinal study of population aging in Mexico that began in 2001 with a nationally representative sample of 15,186 participants aged 50 and older [14]. Participants were re-interviewed in 2003, 2012, 2015, and 2018. New participants aged 50–59 (n = 5,896) and 50–55 (n = 4,809) were recruited in 2012 and 2018, respectively, to maintain the national representation of the MHAS cohort. The MHAS is a longitudinal study, but our analysis used a cross-sectional type design by comparing participants interviewed in 2001 to those interviewed in 2018.
This research is a secondary analysis of data previously collected by the MHAS and offers no risk to human subjects. The MHAS survey data is collected in Mexico by the Mexican Statistical Bureau (Instituto Nacional de Estadistica y Geografia, INEGI) and the Mexican National Institute of Public Health (INSP). These institutions de-identify data files before delivering the MHAS survey data files to the MHAS research team; the INEGI deletes any potentially identifying information about the respondent (including geographical location: state, county, or local community) before release of a data file to the MHAS team for dissemination.
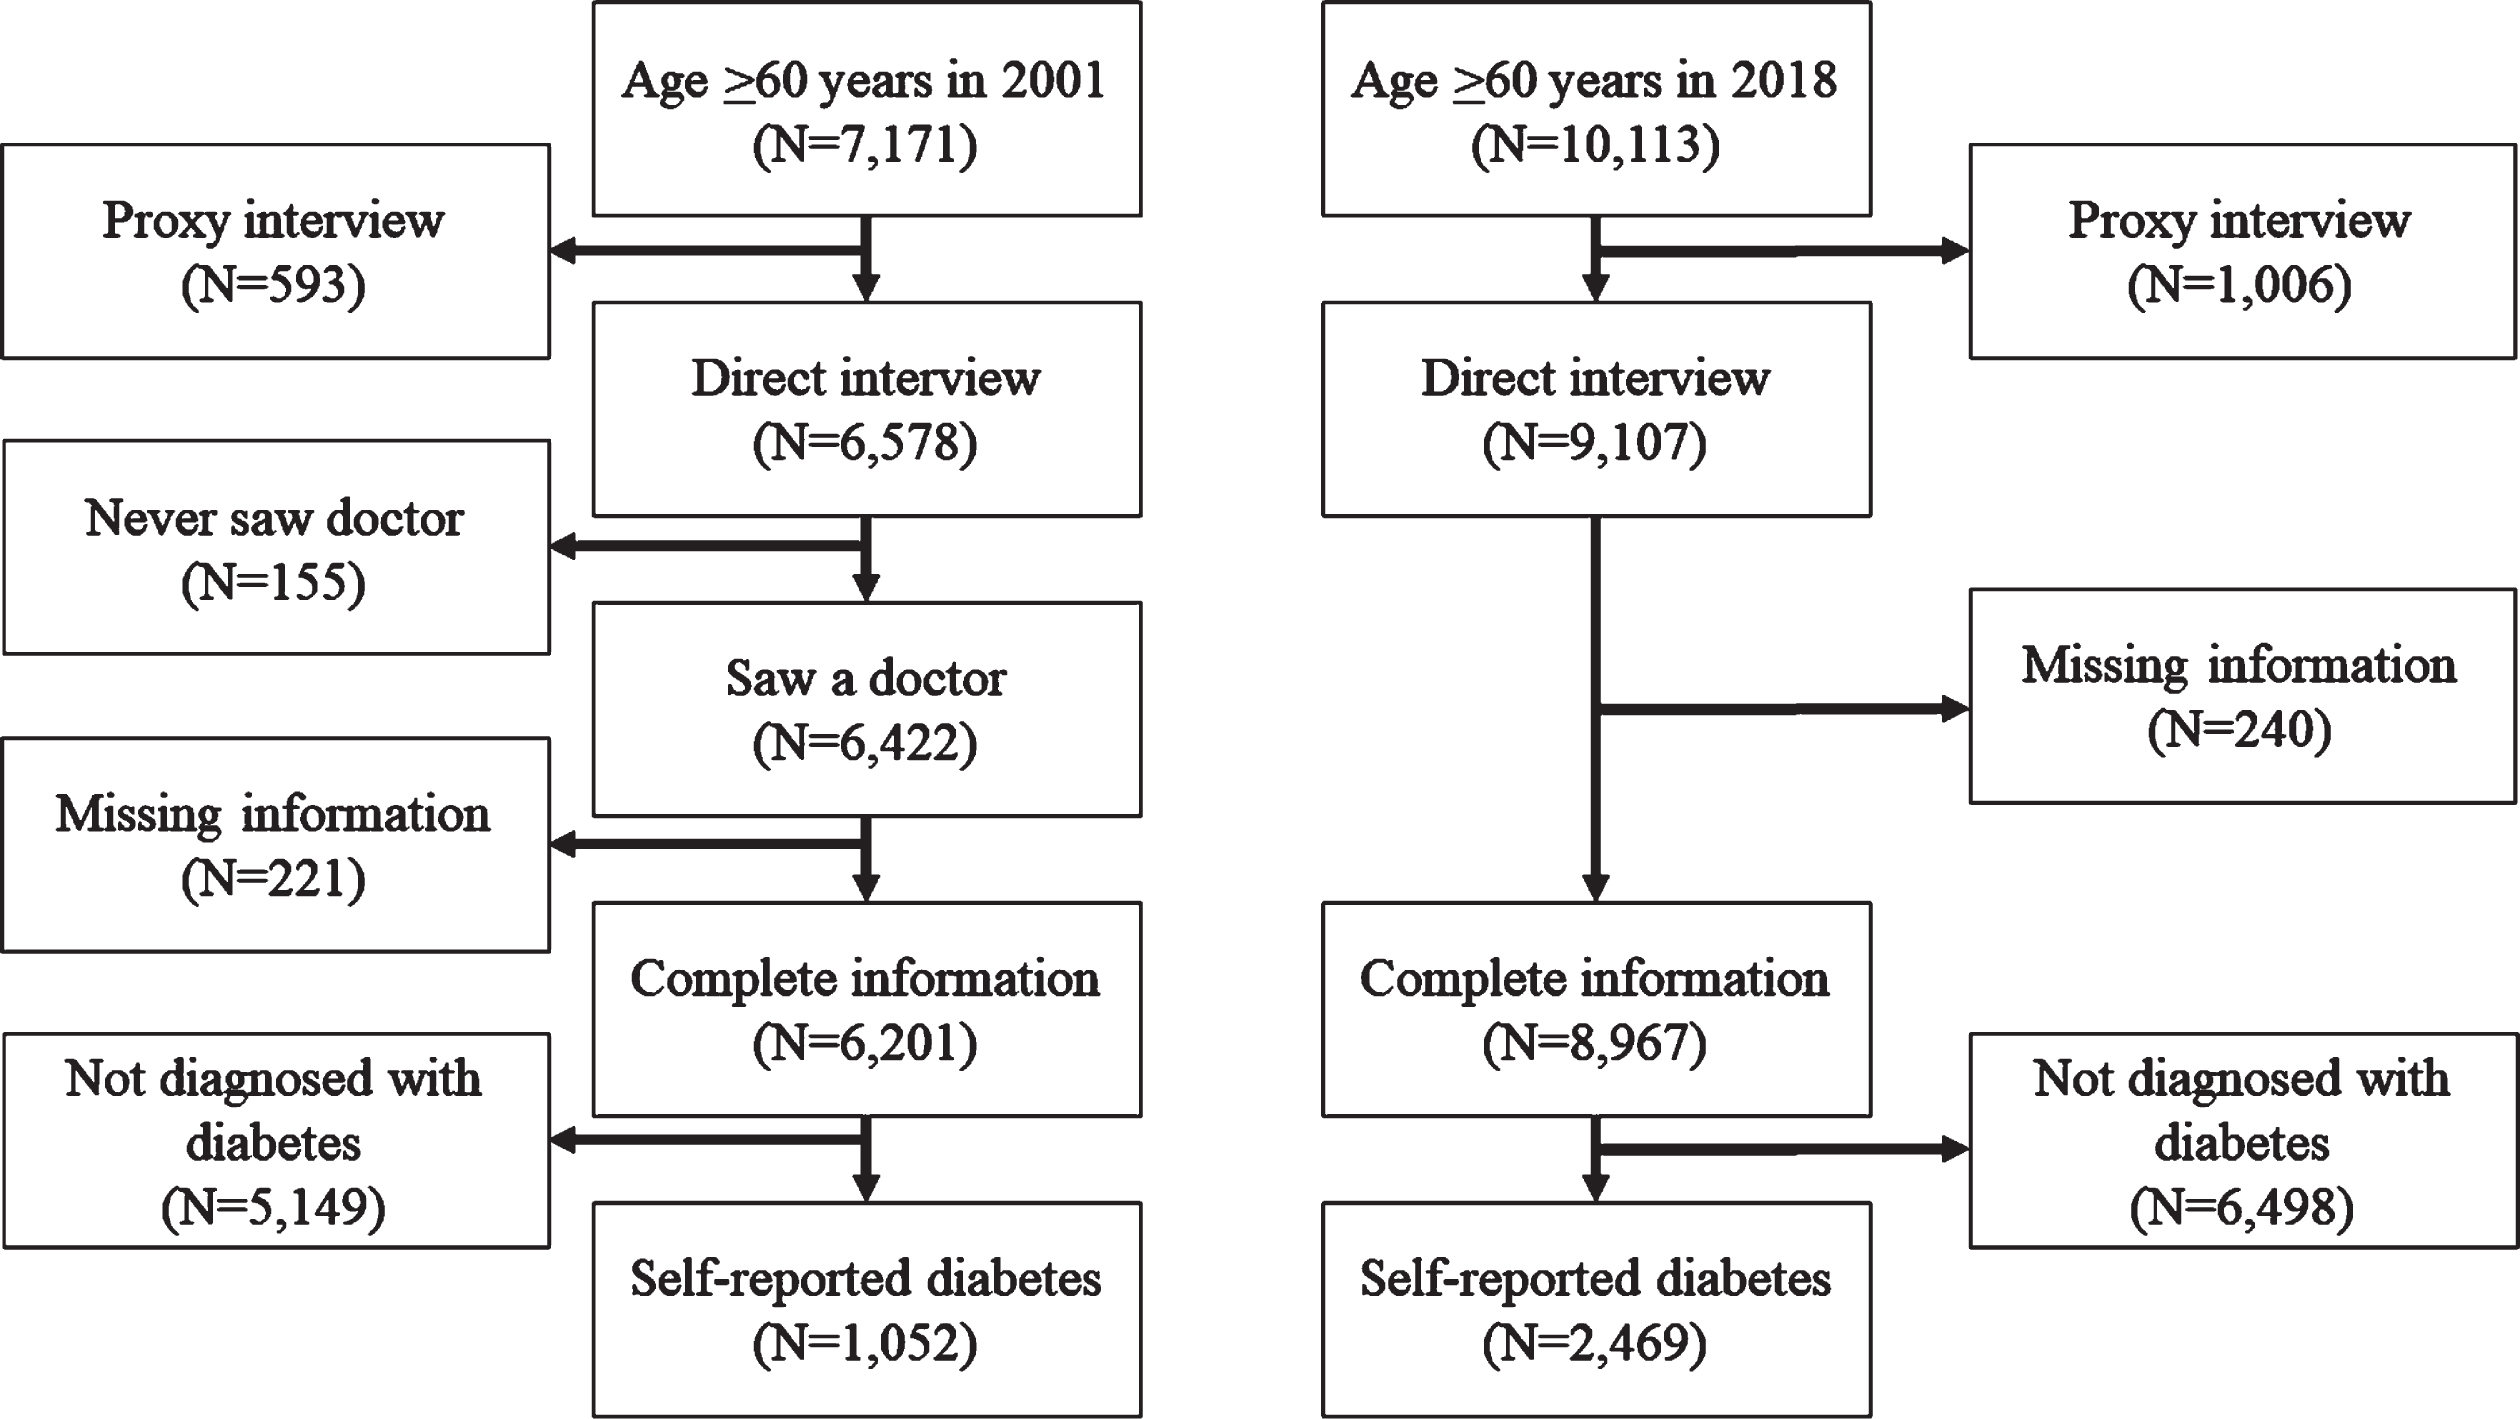
Figure 1 shows the sample selection criteria for participants aged 60 and older with self-reported diabetes during the 2001 and 2018 observation waves. A total of 7,171 participants aged 60 and older were interviewed in 2001, and 10,113 were interviewed in 2018. We first selected 6,578 participants who completed a direct interview in 2001 and 9,107 participants who completed a direct interview in 2018. We excluded participants who received a proxy interview because they did not complete a direct assessment of cognitive functioning. Participants interviewed in 2001 were asked if they had ever seen a doctor. Next, we excluded 155 participants in 2001 who reported never seeing a doctor. We removed these participants were not asked about self-reported medical conditions. Compared to the 6,422 participants who reported having seen a doctor, these 155 participants had fewer years of education (2.3 years, 3.7 years, p < 0.05), less likely to have health insurance (30.5%, 63.2%, p < 0.05), and less likely to live in a community of 100,000 or more people (41.6%, 57.6%, p < 0.05). We then selected 6,201 participants in 2001 and 8,967 participants in 2018 who had complete information for demographic and health characteristics. Lastly, we selected participants who reported having diabetes or hyperglycemia. The final sample included 1,052 participants in 2001 and 2,469 participants in 2018. Our analysis included 131 participants who were interviewed during the 2001 and 2018 observation waves.
Fig. 1
Sample selection criteria for Mexican Health and Aging participants aged 60 and older with self-reported diabetes during the 2001 and 2018 observation waves.
Measures
Cognitive functioning
All MHAS waves have included five cognitive assessments [35]. Participants were asked to repeat a list of eight words (0–8 points), recall the eight words after a delay (0–8 points), copy a figure (0–2 points), draw the figure from memory (0–2 points), and circle a target stimulus in a visual array (0–60 points). We used the MHAS datasets with imputed scores for cognitive functioning to account for missing values [36]. We used the raw scores from the five cognitive assessments to create a summary score that represents global cognitive functioning. We first grouped participants in both observation waves to standardize each cognitive test score into a z-score using the sample mean and standard deviation. We then averaged the z-scores to create the global cognition score.
Diabetes management behaviors
Participants with self-reported diabetes were asked if they take oral medications to control their diabetes, use insulin shots, follow a special diet, and the number of times they check their blood sugar and over what period (i.e., week, month, year). We categorized the frequency of checking blood sugar as never / yearly, monthly, and weekly. We also summed the number of diabetes treatments and behaviors participants reported. We categorized this variable as zero, one, two, and three-four treatments and behaviors.
Covariates
We selected variables for demographic characteristics, health characteristics, and health behaviors based on evidence from prior research using the MHAS to investigate late-life cognitive functioning and the association between T2DM and cognition among older adults [8, 10, 11].
Demographic characteristics included age, sex, education, marital status, health insurance coverage (yes, no), and community size. Education was categorized as 0 years, 1–6 years, and ≥7 years. We categorized marital status as married, not married, and widowed. The MHAS survey categorized community size as ≥100,000 people, 99,000 –15,000 people, 14,999 –2,500 people, and <2,500 people.
Self-reported health conditions and body mass index (BMI) were used as measures of health. Self-reported health conditions included hypertension, stroke, heart attack, stroke, and arthritis. We used the MHAS datasets with imputed height and weight to calculate BMI. BMI was categorized as underweight (<18.5 kg/m2), normal weight (≥18.5 kg/m2 -<25 kg/m2), overweight (≥25 kg/m2 -<30 kg/m2), and obese (≥30 kg/m2).
We included measures for alcohol consumption, smoking status, and physical activity. Participants were asked if they ever drink alcoholic beverages such as beer, wine, liquor, or pulque (alcohol made from fermented cactus sap). Participants could reply with yes, no, or never drank alcohol. Participants were asked if they had smoked more than 100 cigarettes or five packs in their lifetime, not including pipes or cigars (yes, no). Participants were asked if they have regularly exercised or done hard work three or more times a week during the last two years (yes, no).
Statistical analysis
The descriptive characteristics of the 2001 and 2018 cohorts were compared using chi-square tests and non-independent sample t-tests. Generalized estimating equation (GEE) models with clustering by participant, exchangeable correlation structure, and identity link function were used to estimate cohort differences in global cognition. All analyses were adjusted for age, sex, education, marital status, and health insurance coverage (model 1). We also adjusted for self-reported health conditions and health behaviors (model 2) and the number of diabetes treatments and behaviors (model 3).
Generalized estimating equation models with clustering by participant, exchangeable correlation structure, and a log link function were used to estimate cohort differences in taking oral medications, using insulin shots, following a special diet, and checking blood glucose levels weekly. These models adjusted for demographic characteristics, health behaviors, and self-reported health conditions.
All statistical analyses were performed using R version 4.1.2 [1]
RESULTS
Table 1 shows the demographic and health characteristics of the MHAS participants with self-reported diabetes in 2001 and 2018. The mean age of participants in 2001 was 68.4 years, and 59.6% were female. Participants interviewed in 2018 were 70.6 years of age, and 62.0% were female. Participants in 2018 were more likely to have seven or more years of education and health insurance compared to participants in 2001. The percentage of participants with hypertension and obesity was higher in 2018, whereas the percentage of participants with arthritis and who ever smoked cigarettes was lower than in 2001. The average z-score for global cognitive function was higher in 2018 (mean = 0.14, interquartile range = 0.86) than in 2001 (mean = –0.32, interquartile range = 1.02). Finally, participants in 2018 were more likely to take oral medications for diabetes, use insulin, and report checking their blood sugar weekly than in 2001. However, they were less likely to report following a special diet to manage their diabetes. Nearly 29% of participants in 2018 followed 3 to 4 diabetes treatments and behaviors compared to 11.7% of participants in 2001.
Table 1
Demographic, health, and behavioral characteristics of Mexican Health and Aging Study participants with self-reported diabetes aged 60 and older in 2001 and 2018
| 2001 Cohort (n = 1,052) | 2018 Cohort (n = 2,469) | p | |
| Demographics | |||
| Age, mean (SD) | 68.4 (6.6) | 70.6 (7.0) | <0.01 |
| Sex | 0.18 | ||
| Male | 425 (40.4) | 938 (38.0) | |
| Female | 627 (59.6) | 1,531 (62.0) | |
| Education (y) | <0.01 | ||
| 0 | 318 (29.8) | 410 (16.6) | |
| 1–6 | 577 (54.8) | 1,388 (56.2) | |
| 7+ | 162 (15.4) | 671 (27.2) | |
| Marital status | 0.86 | ||
| Married | 662 (62.9) | 1,554 (62.9) | |
| Not married | 109 (10.4) | 242 (9.8) | |
| Widowed | 281 (26.7) | 673 (27.3) | |
| Health insurance | <0.01 | ||
| No | 263 (25.0) | 116 (4.7) | |
| Yes | 789 (75.0) | 2,353 (95.3) | |
| Health characteristics | |||
| Hypertension | 616 (58.6) | 1,672 (67.7) | <0.01 |
| Heart attack | 73 (6.9) | 170 (6.9) | 0.95 |
| Stroke | 50 (4.8) | 87 (3.5) | 0.08 |
| Arthritis | 289 (27.5) | 376 (15.2) | <0.01 |
| BMI categories | <0.01 | ||
| Underweight | 15 (1.4) | 19 (0.8) | |
| Normal weight | 345 (32.8) | 699 (28.3) | |
| Overweight | 478 (45.4) | 1,046 (42.4) | |
| Obese | 214 (20.3) | 705 (28.6) | |
| Cognition, mean (SD) | –0.32 (0.68) | 0.14 (0.62) | <0.01 |
| Health behaviors | |||
| Current alcohol consumption, n (%) | 0.50 | ||
| Never drank alcohol | 132 (12.5) | 339 (13.7) | |
| No | 705 (67.0) | 1,657 (67.1) | |
| Yes | 215 (20.4) | 473 (19.2) | |
| Ever smoke cigarettes, n (%) | <0.01 | ||
| No | 584 (55.5) | 1,594 (64.6) | |
| Yes | 468 (44.5) | 875 (35.4) | |
| Physically active, n (%) | 0.45 | ||
| No | 814 (77.4) | 1,881 (76.2) | |
| Yes | 238 (22.6) | 588 (23.8) | |
| Diabetes management behaviors | |||
| Oral medicine, n (%) | 904 (85.9) | 2,258 (91.5) | <0.01 |
| Using insulin, n (%) | 124 (11.8) | 657 (26.6) | <0.01 |
| Special diet, n (%) | 668 (63.5) | 1,454 (58.9) | <0.01 |
| Checks blood sugar, n (%) | <0.01 | ||
| Weekly | 73 (6.9) | 645 (26.1) | |
| Monthly | 938 (89.2) | 1,746 (70.7) | |
| Yearly / never | 41 (3.9) | 78 (3.2) | |
| Number of T2DM management behaviors, n (%) | <0.01 | ||
| Zero | 67 (6.4) | 84 (3.4) | |
| One | 328 (31.2) | 638 (25.8) | |
| Two | 534 (50.8) | 1,033 (41.8) | |
| Three –four | 123 (11.7) | 714 (28.9) |
When adjusting for demographic characteristics, health conditions, and health behaviors (Fig. 2), participants in 2018 had a 5% higher risk of taking oral medications than in 2001 (RR = 1.05, 95% CI = 1.02–1.09). The 2018 cohort had 1.98 and 3.63 times higher risk for using insulin and to check their blood sugar weekly, respectively. Participants in 2018 had an 11% lower risk to report following a special diet for diabetes. As shown in Table 2, having health insurance was associated with significantly higher RR for using insulin (RR = 1.97, 95% CI = 1.40–2.78) and following a special diet for diabetes (RR = 1.13, 95% CI = 1.03–1.24). Participants who completed seven or more years of education had significantly higher RR to follow a special diet (RR = 1.19, 95% CI = 1.09–1.29) and had 2.42 times higher risk to check their blood glucose at least weekly. Participants with hypertension were more likely to report following a special diet (RR = 1.09, 95% CI = 1.03–1.16). Participants who were overweight or obese, currently consumed alcohol, or were ever smokers were less likely to report following a special diet. Other characteristics associated with higher RR to check blood sugar weekly were having 1–6 years of education, hypertension, heart attack, and stroke.
Fig. 2
Adjusted risk ratios for the use of oral medications, insulin, diet, and weekly blood glucose checks for adults with self-reported diabetes aged ≥60 years in 2018 compared to adults aged ≥60 years in 2001. RR estimated from generalized estimating equation models with clustering by participant, exchangeable correlation structure, and a log link function. Oral medication, insulin, diet, and check blood glucose were modeled separately. All analyses adjusted for demographic characteristics, health behaviors, and self-reported health conditions.
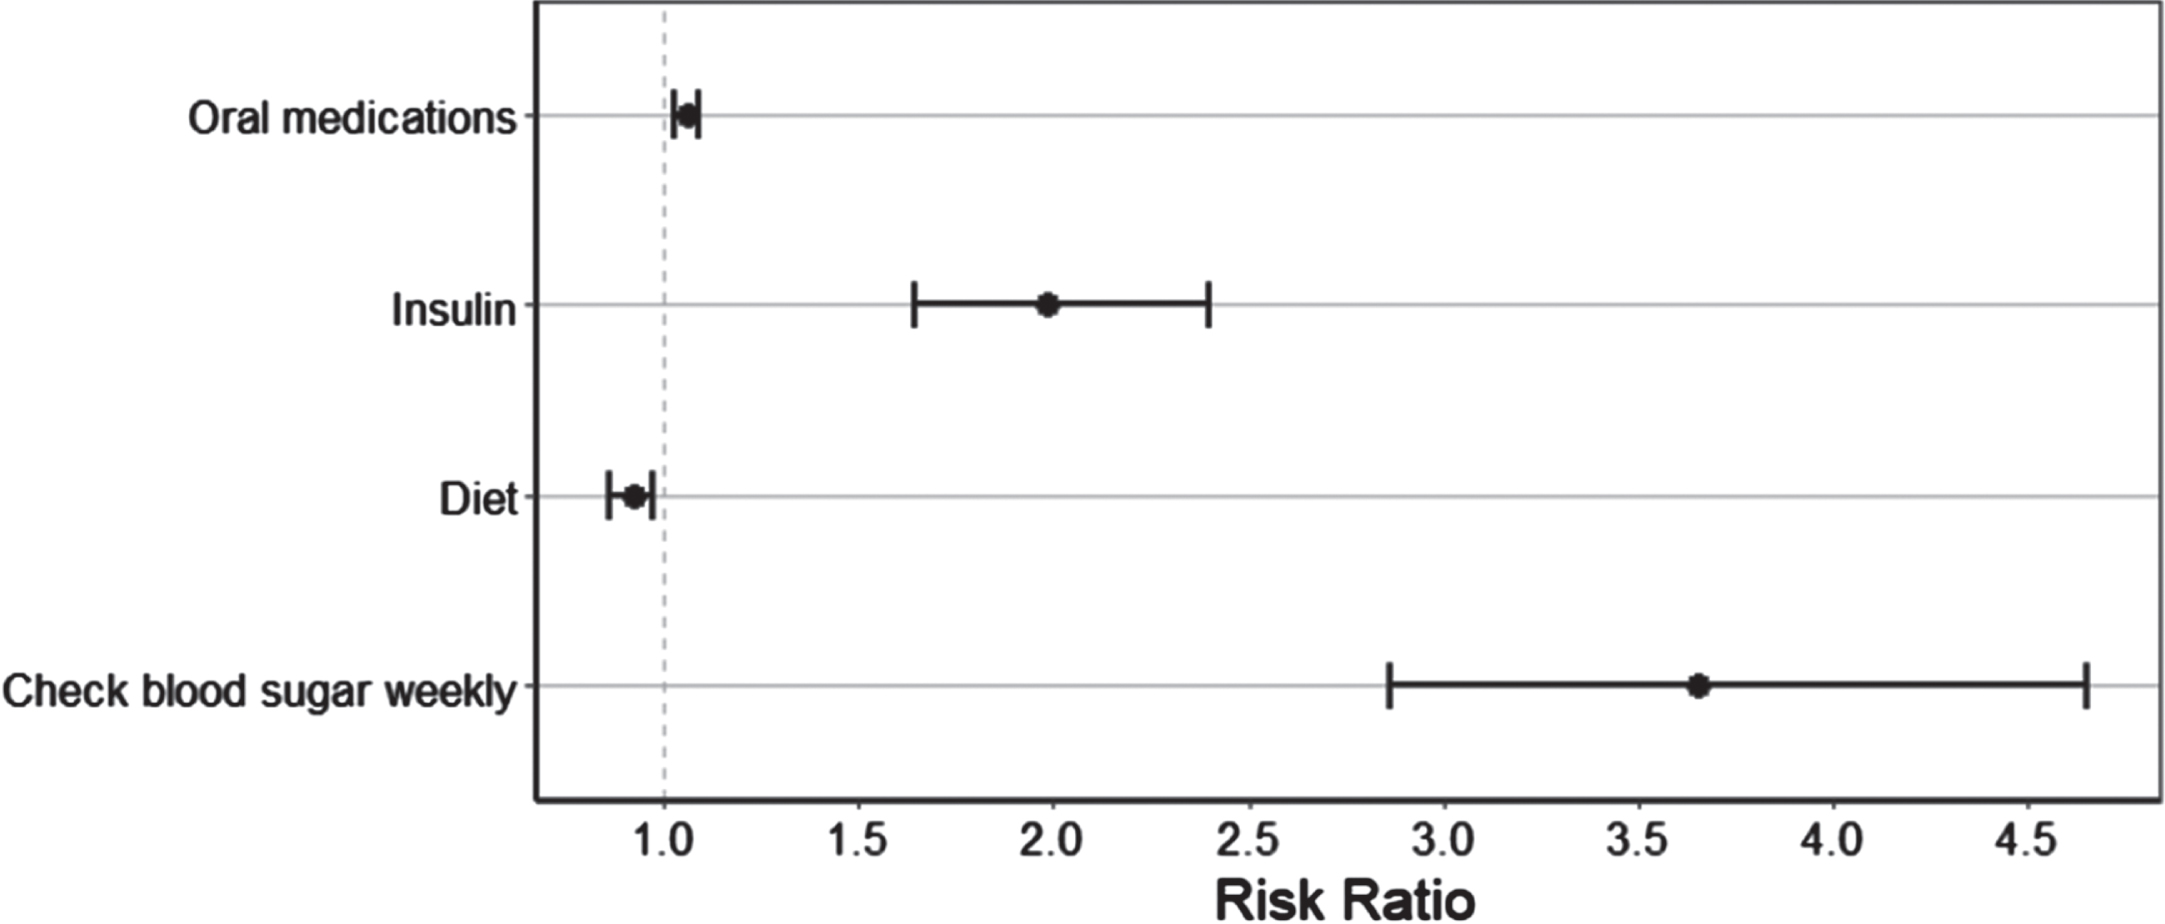
Table 2
Adjusted risk ratios for the use of oral medications, insulin, diet, and weekly blood sugar checks for adults with self-reported diabetes aged ≥60 years in 2018 compared to adults aged ≥60 years in 2001
| Medications | Insulin | Diet | Check Blood | |
| Characteristic | RR (95% CI) | RR (95% CI) | RR (95% CI) | Glucose Weekly |
| RR (95% CI) | ||||
| 2018 year (ref: 2001) | 1.05 (1.02–1.09) | 1.98 (1.63–2.40) | 0.89 (0.84–0.95) | 3.63 (2.85–4.62) |
| Age | 0.99 (0.99–1.00) | 0.99 (0.98–0.99) | 0.99 (0.99–1.00) | 1.00 (0.99–1.01 |
| Female (ref: male) | 1.02 (0.99–1.05) | 1.16 (0.99–1.35) | 0.97 (0.90–1.04) | 1.09 (0.93–1.28) |
| Education (ref: 0 y) | ||||
| 1–6 | 1.02 (0.99–1.06) | 1.12 (0.94–1.34) | 1.06 (0.99–1.15) | 1.41 (1.13–1.75) |
| 7+ | 1.01 (0.97–1.04) | 1.10 (0.90–1.34) | 1.19 (1.09–1.29) | 2.42 (1.93–3.04) |
| Marital status | ||||
| Not married | 1.00 (0.97–1.04) | 0.99 (0.81–1.22) | 0.98 (0.89–1.08) | 0.98 (0.80–1.20) |
| Widowed | 0.99 (0.96–1.01) | 0.99 (0.86–1.15) | 1.03 (0.96–1.10) | 0.92 (0.78–1.08) |
| Health insurance | 1.04 (0.99–1.08) | 1.97 (1.40–2.78) | 1.13 (1.03–1.24) | 0.81 (0.63–1.05) |
| Health conditions | ||||
| Hypertension | 1.02 (0.99–1.05) | 1.24 (1.08–1.43) | 1.09 (1.03–1.16) | 1.17 (1.01–1.35) |
| Heart attack | 1.00 (0.96–1.05) | 1.25 (1.02–1.54) | 1.02 (0.92–1.14) | 1.39 (1.13–1.70) |
| Stroke | 1.00 (0.95–1.06) | 1.02 (0.75–1.37) | 1.07 (0.95–1.22) | 1.41 (1.08–1.84) |
| Arthritis | 0.98 (0.95–1.01) | 0.86 (0.72–1.02) | 1.00 (0.94–1.08) | 0.99 (0.83–1.18) |
| BMI categories (ref: normal) | ||||
| Underweight | 0.94 (0.80–1.09) | 0.99 (0.51–1.96) | 0.74 (0.52–1.06) | 1.11 (0.56–2.23) |
| Overweight | 1.01 (0.98–1.04) | 0.92 (0.79–1.07) | 0.91 (0.86–0.97) | 0.91 (0.78–1.06) |
| Obese | 1.00 (0.97–1.04) | 1.01 (0.86–1.19) | 0.82 (0.76–0.88) | 0.91 (0.76–1.07) |
| Current alcohol consumption (ref: never) | ||||
| No | 1.01 (0.97–1.04) | 1.17 (0.97–1.41) | 0.97 (0.90–1.05) | 1.12 (0.92–1.36) |
| Yes | 0.99 (0.95–1.00) | 0.92 (0.72–1.18) | 0.86 (0.78–0.96) | 0.96 (0.75–1.22) |
| Ever smoker (ref: no) | 0.98 (0.95–1.00) | 0.88 (0.76–1.01) | 0.86 (0.80–0.91) | 1.03 (0.90–1.19) |
| Physically active (ref: no) | 0.98 (0.95–1.00) | 0.67 (0.57–0.80) | 1.03 (0.97–1.10) | 1.06 (0.92–1.23) |
RR, relative risk. RR estimated from generalized estimating equation models with clustering by participant, exchangeable correlation structure, and a log link function. Oral medication, insulin, diet, and check blood glucose were modeled separately. Regression models adjusted for all the variables shown in the table.
Table 3 shows the results of the three models comparing global cognitive function in the 2018 cohort to the 2001 cohort. The global cognition of participants was 0.38 standard deviations higher for participants in 2018 than in 2001 when adjusting for age, sex, education, marital status, and health insurance coverage. This cohort difference in global cognition was similar after adjusting for health conditions and behaviors (model 2) and the T2DM treatments and behaviors (model 3). Other characteristics associated with global cognition included educational attainment, stroke, overweight and obesity, alcohol consumption, smoking, and physical activity (Table 3). Finally, oral medication use, insulin use, following a special diet, and checking blood sugar weekly were not significantly associated with cognitive functioning (Table 3).
Table 3
Cohort differences in global cognitive functioning for adults with self-reported diabetes aged ≥60 years in 2018 compared to adults aged ≥60 years in 2001
| Model 1 | Model 2 | Model 3 | |
| Characteristic | B (SE) | B (SE) | B (SE) |
| 2018 year (ref: 2001) | 0.38 (0.02) ** | 0.38 (0.02) ** | 0.38 (0.02) ** |
| Age | –0.03 (0.001) ** | –0.03 (0.001) ** | –0.03 (0.002) ** |
| Female | 0.03 (0.02) | 0.08 (0.02) ** | 0.08 (0.03) ** |
| Education (ref: 0 y) | |||
| 1–6 y | 0.46 (0.03) ** | 0.45 (0.03) ** | 0.45 (0.03) ** |
| 7+ y | 0.85 (0.03) ** | 0.82 (0.03) ** | 0.82 (0.03) ** |
| Marital status | |||
| Not married | –0.02 (0.03) | –0.03 (0.03) | –0.03 (0.03) |
| Widowed | –0.006 (0.02) | –0.01 (0.02) | –0.01 (0.02) |
| Health insurance | 0.15 (0.03) ** | 0.13 (0.03) ** | 0.13 (0.03) ** |
| Health conditions | |||
| Hypertension | –0.01 (0.02) | –0.01 (0.02) | |
| Heart attack | 0.01 (0.04) | 0.02 (0.04) | |
| Stroke | –0.18 (0.05) ** | –0.19 (0.05) ** | |
| Arthritis | 0.02 (0.02) | 0.02 (0.02) | |
| BMI categories | |||
| Underweight | –0.05 (0.10) | –0.05 (0.10) | |
| Overweight | 0.09 (0.02) ** | 0.09 (0.02) ** | |
| Obese | 0.16 (0.02) ** | 0.15 (0.02) ** | |
| Alcohol consumption (ref: never drank) | |||
| No | 0.03 (0.03) | 0.03 (0.03) | |
| Yes | 0.09 (0.03) ** | 0.09 (0.03) ** | |
| Ever smoker (ref: no) | 0.10 (0.02) ** | 0.09 (0.02) ** | |
| Physically active (ref: no) | 0.09 (0.02) ** | 0.09 (0.02) ** | |
| Oral medication | –0.01 (0.03) | ||
| Insulin | –0.04 (0.02) | ||
| Diabetes diet | 0.003 (0.02) | ||
| Check blood sugar weekly | 0.009 (0.02) |
*p < 0.05; **p < 0.001. Beta coefficients were estimated from generalized estimating equation models with clustering by participant, exchangeable correlation structure, and identity link function.
DISCUSSION
We used data from the Mexican Health and Aging Study to compare the cognitive functioning of Mexican adults aged 60 and older with self-reported diabetes in 2001 and 2018. Consistent with our hypothesis, we found that older adults in 2018 had significantly higher cognitive functioning than older adults in 2001, even after adjusting for demographic characteristics, co-morbid health conditions, and health behaviors. Similar to our findings, Diaz-Venegas et al. reported that male and female MHAS participants aged 60 and older in 2012 had significantly higher cognitive functioning than those in 2001 [34]. An analysis of MHAS participants aged 60 and older reported a decreasing trend in the prevalence of cognitive impairment no dementia from 2001 to 2015 but an increasing trend in the percentage of participants classified with dementia [16].
We also found notable cohort differences in sociodemographic and health characteristics associated with cognitive functioning. A large difference was in the percentage of participants with seven or more years of education. Higher educational attainment has consistently been associated with higher cognitive functioning and lower dementia risk [37, 38]. The benefits of education for cognitive functioning are attributed mostly to older adults with high educational attainment having higher levels of cognitive and brain reserves [39]. Educational attainment also correlates with other measures of reserve, such as occupational complexity and participation in mentally stimulating activities, which are associated with higher cognitive functioning among Mexican older adults with diabetes [40]. Educational attainment also appears to mediate the association between early-life socioeconomic status and cognitive functioning later in life [41, 42].
We also found that participants with higher educational attainment were more likely to report checking their blood glucose levels weekly. This finding is consistent with previous studies that observed an association between health literacy and self-care measures, including blood monitoring [43]. Prior research also indicates older adults with health insurance and higher educational attainment have better controlled diabetes [44].
We detected statistically significant differences in all four measures of T2DM management behaviors between the 2001 and 2018 periods. We found a large increase in the use of insulin among MHAS participants with diabetes in 2018 compared to 2001. Consistent with our findings, research using the National Health and Nutrition Survey in Mexico reported that the percentage of adults aged 60 and older who exclusively used insulin increased from 6.8% in 2012 to 13.4% in 2016 [45]. Conversely, the percentage of older adults only using oral hypoglycemic agents decreased from 84.8% in 2006 to 72.4% in 2012 and 67.9% in 2016 [45]. These trends reflect the changes in pharmacological treatments for diabetes that have occurred in Mexico over the last several decades. The introduction of insulin formulations such as Lispro in 1996, Glargine in 2000, and Determir in 2005 made insulin more accessible and treatment regimens more flexible [46]. The Mexican government has also introduced public health initiatives to address the rising prevalence of type 2 diabetes. The 2013 National Strategy for the Prevention and Control of Overweight, Obesity, and Diabetes promoted diabetes prevention and increased access to treatment for people with diabetes or who were at an increased risk for diabetes [47].
We did not find a statistically significant association between T2DM management behaviors and cognitive functioning. This evidence suggests that the greater use of diabetes management behaviors for participants in 2018 does not reflect more severe diabetes than in 2001. Continued research is needed before definitive statements on how temporal trends in disease management among older adults in Mexico with T2DM may influence cognitive aging.
Strengths and limitations
Our analysis used data from a large, nationally representative study of population aging in Mexico. Recruiting new MHAS participants allowed us to compare two cohorts of participants who have aged in dramatically different social contexts. Finally, MHAS participants provide a wealth of information on sociodemographic characteristics, health history, health behaviors, and cognitive functioning.
A limitation of our study is that the MHAS does not include information for the type of oral medications. Metformin is the predominant medication for T2DM used in Mexico, with an 82% usage rate among people with diabetes [48]. Long-term Metformin has been found to have a protective association with Alzheimer’s disease among older adults with T2DM [49]. A second limitation is that the 2001 and 2018 MHAS waves do not include information on how well participants manage their diabetes, such as blood glucose levels and adherence to diabetes treatments. We also did not know when participants were diagnosed with T2DM and how long they had been taking oral medications, using insulin, or following a special diet to manage their diabetes. Dementia risk has been found to vary between older adults with treated versus untreated T2DM [50].
Conclusions
Our findings show that older Mexican adults with self-reported diabetes in 2018 had higher cognitive function than in 2001. The cohort difference in cognitive functioning was independent of population-level increases in education, health insurance coverage, and T2DM management behaviors. Future research is still needed to investigate the causes of the cohort differences in cognitive functioning among Mexican older adults with self-reported diabetes.
ACKNOWLEDGMENTS
The authors have no acknowledgments to report.
FUNDING
This research was supported in part by the National Institutes of Health (grant numbers RF1AG068988, R01AG018016, P30AG059301, and P30AG024832). The manuscript’s contents are solely the responsibility of the authors and do not represent the official views of the NIH.
CONFLICT OF INTEREST
Brian Downer is an Associate Member of the Editorial Board of this journal but was not involved in the peer-review process nor had access to any information regarding its peer-review.
All other authors have no conflict of interest to report.
DATA AVAILABILITY
All datasets used in this analysis are publicly available for download at http://www.mhasweb.org.
REFERENCES
[1] | Biessels GJ , Strachan MW , Visseren FL , Kappelle LJ , Whitmer RA ((2014) ) Dementia and cognitive decline in type 2 diabetes and prediabetic stages: Towards targeted interventions. Lancet Diabetes Endocrinol 2: , 246–255. |
[2] | Huang CC , Chung CM , Leu HB , Lin LY , Chiu CC , Hsu CY , Chiang CH , Huang PH , Chen TJ , Lin SJ , Chen JW , Chan WL ((2014) ) Diabetes mellitus and the risk of Alzheimer’s disease: A nationwide population-based study. PLoS One 9: , e87095. |
[3] | Rizzo MR , Marfella R , Barbieri M , Boccardi V , Vestini F , Lettieri B , Canonico S , Paolisso G ((2010) ) Relationships between daily acute glucose fluctuations and cognitive performance among aged type 2 diabetic patients. Diabetes Care 33: , 2169–2174. |
[4] | Marseglia A , Fratiglioni L , Kalpouzos G , Wang R , Backman L , Xu W ((2019) ) Prediabetes and diabetes accelerate cognitive decline and predict microvascular lesions: A population-based cohort study. Alzheimers Dement 15: , 25–33. |
[5] | Moran C , Beare R , Wang W , Callisaya M , Srikanth V , Alzheimer’s Disease Neuroimaging Initiative ((2019) ) Type 2 diabetes mellitus, brain atrophy, and cognitive decline. Neurology 92: , e823–e830. |
[6] | OECD (2015) Cardiovascular Disease and Diabetes: Policies for Better Health and Quality of Care. |
[7] | Gutierrez JP , Rivera-Dommarco J , Shamah-Levy T , Villalpando-Hernández S , Franco A , Cuevas-Nasu L , Romero-Martínez M , Hernández-Ávila M ((2012) ) Encuesta nacional de salud y nutrición 2012. Resultados Nacionales. Cuernavaca, México: Instituto Nacional de Salud Pública (MX) 2012: , 1–200. |
[8] | Gonzalez-Gonzalez C , Tysinger B , Goldman DP , Wong R ((2017) ) Projecting diabetes prevalence among Mexicans aged 50 years and older: The Future Elderly Model-Mexico (FEM-Mexico). BMJ Open 7: , e017330. |
[9] | Avila JC , Mejia-Arangom S , Jupiter D , Downer B , Wong R ((2021) ) The effect of diabetes on the cognitive trajectory of older adults in Mexico and the United States. J Gerontol B Psychol Sci Soc Sci 76: , e153–e164. |
[10] | Downer B , Kumar A , Mehta H , Al Snih S , Wong R ((2016) ) The effect of undiagnosed diabetes on the association between self-reported diabetes and cognitive impairment among older Mexican adults. Am J Alzheimers Dis Other Demen 31: , 564–569. |
[11] | Milani SA , Lopez DS , Downer B , Samper-Ternent R , Wong R ((2022) ) Effects of diabetes and obesity on cognitive impairment and mortality in older mexicans. Arch Gerontol Geriatr 99: , 104581. |
[12] | United Nations (2017) World Population Ageing, Department of Economic and Social Affairs Population Division, https://www.un.org/en/development/desa/population/publications/pdf/ageing/WPA2017_Highlights.pdf |
[13] | Prince M , Acosta D , Ferri CP , Guerra M , Huang Y , Llibre Rodriguez JJ , Salas A , Sosa AL , Williams JD , Dewey ME , Acosta I , Jotheeswaran AT , Liu Z ((2012) ) Dementia incidence and mortality in middle-income countries, and associations with indicators of cognitive reserve: A 10/66 Dementia Research Group population-based cohort study. Lancet 380: , 50–58. |
[14] | Wong R , Michaels-Obregon A , Palloni A ((2017) ) Cohort Profile: The Mexican Health and Aging Study (MHAS). Int J Epidemiol 46: , e2. |
[15] | Lovden M , Fratiglioni L , Glymour MM , Lindenberger U , Tucker-Drob EM ((2020) ) Education and cognitive functioning across the life span. Psychol Sci Public Interest 21: , 6–41. |
[16] | Mejia-Arango S , Avila J , Downer B , Garcia MA , Michaels-Obregon A , Saenz JL , Samper-Ternent R , Wong R ((2021) ) Effect of demographic and health dynamics on cognitive status in Mexico between 2001 and 2015: Evidence from the Mexican Health and Aging Study. Geriatrics (Basel) 6: , 63. |
[17] | Knaul FM , Gonzalez-Pier E , Gomez-Dantes O , Garcia-Junco D , Arreola-Ornelas H , Barraza-Llorens M , Sandoval R , Caballero F , Hernandez-Avila M , Juan M , Kershenobich D , Nigenda G , Ruelas E , Sepulveda J , Tapia R , Soberon G , Chertorivski S , Frenk J ((2012) ) The quest for universal health coverage: Achieving social protection for all in Mexico. Lancet 380: , 1259–1279. |
[18] | Parker SW , Saenz J , Wong R ((2018) ) Health insurance and the aging: Evidence from the Seguro Popular Program in Mexico. Demography 55: , 361–386. |
[19] | Beltran-Sanchez H , Drumond-Andrade FC , Riosmena F ((2015) ) Contribution of socioeconomic factors and health care access to the awareness and treatment of diabetes and hypertension among older Mexican adults. Salud Publica Mex 57: (Suppl 1), S6–14. |
[20] | Saenz JL , Downer B , Garcia MA , Wong R ((2018) ) Cognition and context: Rural-urban differences in cognitive aging among older Mexican adults. J Aging Health 30: , 965–986. |
[21] | Rivera-Hernandez M , Rahman M , Mor V , Galarraga O ((2016) ) The impact of social health insurance on diabetes and hypertension process indicators among older adults in Mexico. Health Serv Res 51: , 1323–1346. |
[22] | Zheng B , Su B , Price G , Tzoulaki I , Ahmadi-Abhari S , Middleton L ((2021) ) Glycemic control, diabetic complications, and risk of dementia in patients with diabetes: Results from a large U.K. Cohort Study. Diabetes Care 44: , 1556–1563. |
[23] | Bucheli JR , Manshad A , Ehrhart MD , Camacho J , Burge MR ((2017) ) Association of passive and active smoking with pre-diabetes risk in a predominantly Hispanic population. J Investig Med 65: , 328–332. |
[24] | Anstey KJ , Kingston A , Kiely KM , Luszcz MA , Mitchell P , Jagger C ((2014) ) The influence of smoking, sedentary lifestyle and obesity on cognitive impairment-free life expectancy. Int J Epidemiol 43: , 1874–1883. |
[25] | Ottenbacher AJ , Snih SA , Bindawas SM , Markides KS , Graham JE , Samper-Ternent R , Raji M , Ottenbacher KJ ((2014) ) Role of physical activity in reducing cognitive decline in older Mexican-American adults. J Am Geriatr Soc 62: , 1786–1791. |
[26] | Carmichael OT , Neiberg RH , Dutton GR , Hayden KM , Horton E , Pi-Sunyer FX , Johnson KC , Rapp SR , Spira AP , Espeland MA ((2020) ) Long-term change in physiological markers and cognitive performance in type 2 diabetes: The Look AHEAD Study. J Clin Endocrinol Metab 105: , e4778–4791. |
[27] | Zavala-Arciniega L , Reynales-Shigematsu LM , Levy DT , Lau YK , Meza R , Gutierrez-Torres DS , Arillo-Santillan E , Fleischer NL , Thrasher J ((2020) ) Smoking trends in Mexico, 2002-2016: Before and after the ratification of the WHO’s Framework Convention on Tobacco Control. Tob Control 29: , 687–691. |
[28] | Reynales-Shigematsu LM , Fleischer NL , Thrasher JF , Zhang Y , Meza R , Cummings KM , Levy DT ((2015) ) Effects of tobacco control policies on smoking prevalence and tobacco-attributable deaths in Mexico: The SimSmoke model. Rev Panam Salud Publica 38: , 316–325. |
[29] | Medina C , Jauregui A , Hernandez C , Shamah T , Barquera S ((2021) ) Physical inactivity and sitting time prevalence and trends in Mexican adults. Results from three national surveys. PLoS One 16: , e0253137. |
[30] | Langa KM , Larson EB , Crimmins EM , Faul JD , Levine DA , Kabeto MU , Weir DR ((2017) ) A comparison of the prevalence of dementia in the United States in 2000 and 2012. JAMA Intern Med 177: , 51–58. |
[31] | Matthews FE , Arthur A , Barnes LE , Bond J , Jagger C , Robinson L , Brayne C , Medical Research Council Cognitive F, Ageing C ((2013) ) A two-decade comparison of prevalence of dementia in individuals aged 65 years and older from three geographical areas of England: Results of the Cognitive Function and Ageing Study I and II. Lancet 382: , 1405–1412. |
[32] | Crimmins EM , Saito Y , Kim JK ((2016) ) Change in cognitively healthy and cognitively impaired life expectancy in the United States: 2000-2010. SSM Popul Health 2: , 793–797. |
[33] | Wu YT , Beiser AS , Breteler MMB , Fratiglioni L , Helmer C , Hendrie HC , Honda H , Ikram MA , Langa KM , Lobo A , Matthews FE , Ohara T , Peres K , Qiu C , Seshadri S , Sjolund BM , Skoog I , Brayne C ((2017) ) The changing prevalence and incidence of dementia over time - current evidence. Nat Rev Neurol 13: , 327–339. |
[34] | Diaz-Venegas C , Samper-Ternent R , Michaels-Obregon A , Wong R ((2019) ) The effect of educational attainment on cognition of older adults: Results from the Mexican Health and Aging Study 2001 and 2012. Aging Ment Health 23: , 1586–1594. |
[35] | Mejia-Arango S , Wong R , Michaels-Obregon A ((2015) ) Normative and standardized data for cognitive measures in the Mexican Health and Aging Study. Salud Publica Mex 57: (Suppl 1), S90–96. |
[36] | Downer B , Avila J , Chen NW , Wong R ((2021) ) Imputation procedures for cognitive variables in the Mexican Health and Aging Study: Evaluating the bias from excluding participants with missing data. Real Datos Espacio 12: , 90–105. |
[37] | Garcia MA , Downer B , Chiu CT , Saenz JL , Ortiz K , Wong R ((2021) ) Educational benefits and cognitive health life expectancies: Racial/ethnic, nativity, and gender disparities. Gerontologist 61: , 330–340. |
[38] | Nguyen TT , Tchetgen Tchetgen EJ , Kawachi I , Gilman SE , Walter S , Liu SY , Manly JJ , Glymour MM ((2016) ) Instrumental variable approaches to identifying the causal effect of educational attainment on dementia risk. Ann Epidemiol 26: , 71-76 e71–73. |
[39] | Stern Y , Arenaza-Urquijo EM , Bartres-Faz D , Belleville S , Cantilon M , Chetelat G , Ewers M , Franzmeier N , Kempermann G , Kremen WS , Okonkwo O , Scarmeas N , Soldan A , Udeh-Momoh C , Valenzuela M , Vemuri P , Vuoksimaa E , the Reserve, Resilience and Protective Factors PIA Empirical Definitions and Conceptual Frameworks Workgroup ((2020) ) Whitepaper: Defining and investigating cognitive reserve, brain reserve, and brain maintenance. Alzheimers Dement 16: , 1305–1311. |
[40] | Pena-Gonzalez P , Mondragon-Maya A , Silva-Pereyra J , Roa-Rojas P ((2020) ) Cognitive reserve and executive functions in adults with type 2 diabetes. J Diabetes Res 2020: , 7941543. |
[41] | Al Hazzouri AZ , Haan MN , Galea S , Aiello AE ((2011) ) Life-course exposure to early socioeconomic environment, education in relation to late-life cognitive function among older Mexicans and Mexican Americans. J Aging Health 23: , 1027–1049. |
[42] | Singh-Manoux A , Richards M , Marmot M ((2005) ) Socioeconomic position across the lifecourse: How does it relate to cognitive function in mid-life? Ann Epidemiol 15: , 572–578. |
[43] | Marciano L , Camerini AL , Schulz PJ ((2019) ) The role of health literacy in diabetes knowledge, self-care, and glycemic control: A meta-analysis. J Gen Intern Med 34: , 1007–1017. |
[44] | Dupre ME , Silberberg M , Willis JM , Feinglos MN ((2015) ) Education, glucose control, and mortality risks among U.S. older adults with diabetes. Diabetes Res Clin Pract 107: , 392–399. |
[45] | Rojas-Martinez R , Basto-Abreu A , Aguilar-Salinas CA , Zarate-Rojas E , Villalpando S , Barrientos-Gutierrez T ((2018) ) [Prevalence of previously diagnosed diabetes mellitus in Mexico.]. Salud Publica Mex 60: , 224–232. |
[46] | Quianzon CC , Cheikh I ((2012) ) History of insulin. J Community Hosp Intern Med Perspect 2: , doi: 10.3402/jchimp.v2i2.18701. |
[47] | Dirección General de Promoción de la Salud Secretaría de Salud México ((2014) ) Estrategia Nacional para la Prevención y el Control del Sobrepeso, la Obesidad y la Diabetes. Rev Enferm Inst Mex Seguro Soc 22: , 113–116. |
[48] | Salas A , Acosta D , Ferri CP , Guerra M , Huang Y , Jacob KS , Jimenez-Velazquez IZ , Llibre Rodriguez JJ , Sosa AL , Uwakwe R , Williams JD , Jotheeswaran AT , Liu Z , Lopez Medina AM , Salinas-Contreras RM , Prince MJ ((2016) ) The prevalence, correlates, detection and control of diabetes among older people in low and middle income countries. A 10/66 Dementia Research Group population-based survey. PLoS One 11: , e0149616. |
[49] | Sluggett JK , Koponen M , Bell JS , Taipale H , Tanskanen A , Tiihonen J , Uusitupa M , Tolppanen AM , Hartikainen S ((2020) ) Metformin and risk of Alzheimer’s disease among community-dwelling people with diabetes: A national case-control study. J Clin Endocrinol Metab 105: , dgz234. |
[50] | Mayeda ER , Haan MN , Kanaya AM , Yaffe K , Neuhaus J ((2013) ) Type 2 diabetes and 10-year risk of dementia and cognitive impairment among older Mexican Americans. Diabetes Care 36: , 2600–2606. |


