
Timing of Alzheimer’s Disease by Intellectual Disability Level in Down Syndrome
Abstract
Background:
Trisomy 21 causes Down syndrome (DS) and is a recognized cause of early-onset Alzheimer’s disease (AD).
Objective:
The current study sought to determine if premorbid intellectual disability level (ID) was associated with variability in age-trajectories of AD biomarkers and cognitive impairments. General linear mixed models compared the age-trajectory of the AD biomarkers PET Aβ and tau and cognitive decline across premorbid ID levels (mild, moderate, and severe/profound), in models controlling trisomy type, APOE status, biological sex, and site.
Methods:
Analyses involved adults with DS from the Alzheimer’s Biomarkers Consortium-Down Syndrome. Participants completed measures of memory, mental status, and visuospatial ability. Premorbid ID level was based on IQ or mental age scores prior to dementia concerns. PET was acquired using [11C] PiB for Aβ, and [18F] AV-1451 for tau.
Results:
Cognitive data was available for 361 participants with a mean age of 45.22 (SD = 9.92) and PET biomarker data was available for 154 participants. There was not a significant effect of premorbid ID level by age on cognitive outcomes. There was not a significant effect of premorbid ID by age on PET Aβ or on tau PET. There was not a significant difference in age at time of study visit of those with mild cognitive impairment-DS or dementia by premorbid ID level.
Conclusion:
Findings provide robust evidence of a similar time course in AD trajectory across premorbid ID levels, laying the groundwork for the inclusion of individuals with DS with a variety of IQ levels in clinical AD trials.
INTRODUCTION
Down syndrome (DS), which is caused by trisomy 21, is the most common known genetic cause of intellectual disability [1]. Trisomy 21 is also recognized as a genetic cause of Alzheimer’s disease (AD) [2, 3], with a 90% or higher lifetime incidence of AD dementia [4–6]. The triplication of the amyloid precursor protein, located on chromosome 21, leads to an overexpression of amyloid-beta (Aβ), which accumulates over time into extracellular Aβ plaques, an early pathologic feature of AD. These plaques are followed by the formation of intracellular neurofibrillary tangles of the protein tau [2, 7]. Natural history studies are documenting the timeline of AD biomarkers and clinical AD dementia in large DS cohorts [4, 8]. In positron emission tomography (PET) studies, 40–60% of individuals with DS have elevated Aβ across various cortical regions in their early- to mid-40 s [9] and the estimated age of onset of AD dementia is 53.8 years [10]. However, there is marked variability in these data: elevated PET cortical Aβ is present in many individuals with DS before the mid-30 s [9] and age of onset of AD dementia spans 32 years in DS [5, 6, 10]. As clinical trials become available to people with DS field, it is critical to identify factors that influence this individual variability. Premorbid intellectual disability (ID) may be one of these factors.
People with DS vary in ID level prior to onset of AD (referred to as premorbid ID), with IQ scores ranging from the 30 s to 70 s [11–13]. The majority of adults with DS (75–80%) have mild or moderate ID; however, 2–5% of individuals with DS have an IQ in the borderline to normal IQ range and 15–25% have severe to profound ID [11–13]. In part, heterogeneity in premorbid ID is tied to type of trisomy 21, with mosaicism (2–3% of DS cases) associated with a higher IQ than the full (96% of DS cases) or translocation (1–2% of DS cases) types [14, 15]; however, other factors such as co-occurring medical conditions are also linked to IQ variability [16]. It is not known if differences in premorbid ID alter the trajectory of AD in DS. These effects could operate through biological mechanisms related to brain reserve, which is the idea that neural resources that contribute to differences in premorbid ID level may alter the ability to compensate for early AD pathology [17]. For example, in non-DS populations, higher (versus lower) intracranial volume appears to protect against cognitive decline in the presence of early AD pathology [18, 19]. Alternatively, variability in premorbid ID may impact the trajectory of AD in DS through cognitive reserve, or the concept that those with higher premorbid intelligence can better recruit alternate neural networks or more efficiently use existing networks to cope with early AD-related pathology [20]. Indeed, there is evidence outside of DS that adults with higher education have more pronounced levels of AD pathology before showing the clinical AD symptomology relative to adults with lower education, and thus maintained cognitive functioning for a longer period of time in the presence of early pathology [18, 21, 22]. In line with these findings, it is possible that adults with DS with a higher premorbid ID level would have a later age of onset of clinical AD symptomology, despite a similar time course of AD pathology, relative to those with a lower premorbid ID level.
To date, only a handful of large-sized studies have compared the trajectory of AD by premorbid ID level in DS [4, 23, 24]. These studies were limited in that they only stratified by mild versus moderate ID (excluded those with severe/profound ID), examined differences on only one or two cognitive measures, and analyses did not control for type of trisomy (full, mosaic, or translation) or apolipoprotein E (APOE) status (e.g., allele ɛ4), genetic status, each which may have its own effect on the time course of AD clinical signs. Mixed results were reported in these studies. For example, Videla et al. [24] used a longitudinal design (follow-up visit occurred ≥6 months following baseline) and reported a similar age-trajectory of cognitive decline for adults with DS with mild versus moderate premorbid ID on the Cambridge Cognitive Examination for Older Adults (CAMOG-DS) [25] and modified Cued Recall Test (mCRT) [26]. Conversely, Fortea et al. [4], who used a cross-sectional design, reported that adults with DS with moderate premorbid ID had an earlier age of decline than those with mild premorbid ID. Neither study compared age-trajectories in AD biomarkers of PET Aβ and tau PET or evaluated the timing of prodromal AD (i.e., mild cognitive impairment) or dementia by premorbid ID level.
The current study drew on a large cross-sectional cohort of adults with DS to compare the estimated age-trajectory of AD biomarkers of PET Aβ and tau PET and cognitive decline (across four instruments) between three premorbid ID levels (mild, moderate, and severe/profound) in models controlling trisomy type and APOE status. The average age of adults with DS with a clinical status of mild cognitive impairment (MCI-DS) or dementia were also compared across the three premorbid ID groups. It was predicted that there would be a similar age-trajectory in PET Aβ and tau PET across the premorbid ID groups. However, based on the concepts of brain and cognitive reserve, the mild ID group was expected to have a slower estimated trajectory of cognitive decline and those with a clinical status of MCI-DS and dementia would be older relative to the moderate and severe/profound ID groups.
METHODS
Participants
Analyses involved cognitive data on adults with DS, a subset of whom also had brain imaging data. Data was collected at baseline from eight sites involved in the Alzheimer’s Biomarkers Consortium-Down Syndrome (ABC-DS). Study inclusion criteria included aged 25 years or older, karyotyping testing confirming DS, the absence of conditions contraindicative for brain imaging scans (e.g., pregnant or metal in the body), and the absence of non-AD untreated medical or psychiatric conditions that altered cognitive functioning. In addition, for the current analyses, a documented IQ or mental age score prior to any AD-related concerns was required. Adults with DS who had a clinical AD status of ‘unable to determine’ were also removed from analyses. Internal Review Boards approved the study, and consent and assent were obtained prior to participation.
Procedures
Data included in present analyses was part of a larger study protocol completed across multiple days. Participants completed a battery of directly-administered cognitive measures and a blood draw for karyotyping. Caregivers provided information on the adult with DS’s medical history and their cognitive, adaptive, and behavioral functioning. At four sites, PET and MRI imaging were conducted on the adults with DS. A physical and neurological exam were also completed at all sites with the adult with DS.
Measures
Socio-demographics
Date of birth was reported by the caregiver and used to calculate age in years. Karyotyping was used to evaluate APOE allele status (coded: ɛ4 present = 1, ɛ4 absent = 2) and type of DS (trisomy = 1, mosaic = 2, or translocation = 3). Biological sex (female = 1, male = 2) and race/ethnicity (white, non-Hispanic = 1, other = 2) were reported by caregivers.
Premorbid ID level
Premorbid ID was defined as intellectual disability level prior to a clinical status of MCI-DS or AD dementia and was based on scores from the Stanford-Binet Intelligence Scales, Fifth Edition (SB5) [27], Abbreviated Battery or medical records documenting IQ using the Wechsler Adult Intelligence Scale [28], or Kaufman Brief Intelligence Test [29]. Premorbid ID level was coded as mild (1), moderate (2), or severe/profound (3) based on IQ standard scores (borderline: 70–85; mild: 50–69, moderate: 35–49, and severe/profound: <35) or age equivalent scores (borderline: >15 years; mild: 9–14 years, moderate: 4–8 years, and severe/profound: ≤3 years). For participants with a clinical status of MCI-DS or AD dementia, a prior IQ or mental age equivalent score, taken before AD-related concerns, wasused.
Clinical AD status
Clinical AD status was based on a case consensus process that involved at least three staff with expertise in AD in DS (including at least one psychologist and physician) who were blind to imaging/biofluid data. This process reviewed information from the current study visit and any prior visits from caregiver-reported and direct measures of cognitive functioning, adaptive behavior, and maladaptive behaviors, a neurological exam, medical and psychiatric history and recent life events [8]. Clinical AD statuses were: 0 = cognitively stable, indicating no evidence of cognitive or functional decline from prior levels; 1 = MCI-DS, indicating evidence of cognitive and/or functional decline that is not severe enough to meet criteria for AD dementia; 2 = AD dementia, indicating marked cognitive and functional decline across multiple domains; and 3 = unable to determine, which was used when there was evidence of cognitive and/or functional decline but the participant had also experienced a new (or increased severity) medical condition or major life event, making the underlying cause of the decline unclear. Published data on measure norms guided the interpretation of scores. However, the determination of AD clinical status was based clinical judgement and the overall pattern rather than a cut-off scores or a single measure and reached following group discussions. One member of the consensus team typically included someone who was not part of that ABC-DS site. A subset of cases at each site were also reviewed by staff at other sites to harmonize theprocess.
Cognitive function
Four cognitive instruments were selected from a larger battery because they had assessed a cognitive domain shown in prior work [30–32] to decline early on in AD progression in DS.
Visuospatial ability. The Wechsler Intelligence Scale for Children, Fourth Edition (WISC-IV) [33] Block Design subtest declines early in the progression to AD and distinguishes adults with DS with AD dementia from those without [3, 30–32] and has excellent test-retest reliability (α= 0.94) [31]. The Haxby extension, which is a downward (i.e., more training and easier items) extension of the WISC-IV, was also used. The total Block Design score was created by summing the raw score of the Haxby and WISC-IV items.
Memory. The modified Cued Recall Test (mCRT) [26, 35] assesses episodic memory by asking participants to recall pictures freely (free recall) and when given a category cue (cued recall). The free and cued recall scores were summed to create a mCRT Total score. This assessment has been identified as a strong indicator of dementia diagnostic status among adults with DS 25 to 81 years old [32]. Additionally, the mCRT is associated with AD biomarkers of PET Aβ and tau PET prior to the onset of AD dementia in DS [29, 36].
Mental status. The Down Syndrome Mental Status Examination (DSMSE) [37] assesses broad dementia symptoms including personal information, orientation, memory, and language. This measure has excellent test-retest reliability (α= 0.97) [31] and demonstrated sensitivity in identification of MCI-DS and AD dementia in adults with DS [30, 31]. Moreover, this measure has limited floor effects in adults with DS with a range of intellectual levels[30].
Caregiver-reported dementia symptoms. Dementia Questionnaire for People with Learning Disabilities (DLD) [38] is an informant-reported measure of cognitive (Sum of Cognitive Score; SCS) and social (Sum of Social Score; SSS) declines related to AD in DS. Both the DLD-SCS (referred to as DLD Cognitive) and DLD-SSS (referred to as DLD Social) scores differentiate adults with DS with and without AD dementia [30, 39].
MRI and PET
PET data were acquired using [11C] PiB for Aβ and [18F] AV-1451 for tau quantification, and MRI was used for anatomical reference. Scanning was performed on Siemens HR+, Siemens 4-ring Biograph mCT or GE Signa PET/MR (see [6] for details). Tracers were administered as 20–30 s bolus injections and saline flush. Images were acquired in 5-min frames and inspected and corrected for motion on a frame-by-frame basis. Time-averaged images were 50–70 min post injection for [11C] PiB and 80–100 min for [18F] AV-1451. Data were reconstructed using iterative methods and corrected for deadtime, attenuation, scatter, and radioactivedecay.
[11C] PiB and [18F] PET processing
[11C] PiB PET scans and associated T1 MRI were analyzed with the centiloid method [40] using SPM8 software. The 50–70-min PET images were registered to corresponding anatomical MR images. The MR scan was deformed to match the 152-subject template of the Montreal Neurological Institute (MN152) included with SPM8 and corresponding PET images were co-warped using the determined parameters. PiB radioactivity concentration was extracted for the centiloid standard global region and whole cerebellum, defined on the MNI152 template. Global SUVR was the ratio of tracer concentration in the global region to that of whole cerebellum. This tissue ratio was converted to centiloid values using linear+constant transformation specified for [11C] PiB [40].
The 80–100 min [18F] AV-1451 tau images were registered to T1 MRI. The next step was typically to parcellate the T1 MR images to determine regions of interest for the PET quantitation. However, the DS population presents analysis challenges due to anatomical differences between DS subjects and the neurotypical subjects used in the construction of FreeSurfer templates and also due to motion artifacts often seen with MR scans of DS subjects. Thus, an extended methodology (multi-template method) was employed. First, Subject T1 MR scans were processed through FreeSurfer 5.3 [41] resulting in each being parcellated into regions defined by the Desikan-Killiany (DK) atlas [41]. An automated labeling system for subdividing the human cerebral cortex on MRI scans into gyral based regions of interest. Results were then inspected, and 12 high-quality scans were selected for use as templates, as part of the extended analysis. In most cases the FreeSurfer parcellations were edited to provide better conformation of the FS-based atlas to the template anatomy.
For each subject, each of the 12 templates was warped to the subject’s T1 MR using the Advanced Neuroimaging Tools (ANTs) software package [42, 43] resulting in 12 versions of the DK atlas in subject space. Each subject-space voxel was labeled with a final DK region name which was taken to be the region most often chosen by the 12 atlases. All results were accepted or rejected based on a visual rating of the final atlas adherence to subject MR anatomy. The object of this method is to produce high quality parcellations without the need for parcellation editing. In a few cases it was found that the previously performed direct application of FreeSurfer, i.e., not the multi-template method, along with previously performed editing, produced acceptable parcellations whereas the multi-template method did not. In such cases the direct FreeSurfer parcellations were used.
Radioactivity concentration of regions of interest of [18F] AV-1451 was expressed as SUVr and was determined using volume weighted average of tracer concentration within FS-based components reproducing the composite region defined by Jack et al. [44] divided by the cerebellar cortex concentration. The Aβ centiloid value and tau Mayo-composite SUVr were used to classify participants as Aβ±(threshold value 19) and tau±(threshold value 1.21) [44].
Statistical analysis
To examine variable distribution and potential outliers, boxplots, histograms, and descriptive statistics were used. In addition, Loess plots conducted in R 4.2.0 were used to visualize a smoother scatter plot of the relationship between age, cognitive performance, and AD biomarkers by premorbid ID group. We conducted general linear mixed models in SAS 9.4 to examine the associations between age and premorbid ID level, as well as their interactions, on cognitive functioning and AD biomarkers of PET Aβ and tau PET. A mixed model was conducted as site was included as a random effect; all other variables were added as fixed effects. The linear and non-linear effects of age and age by premorbid ID were explored in all models. Biological sex, trisomy type, APOE status, and the random effect of site (as recommended by [45]) were added to models to adjust for the effect of these variables on each outcome. Differences in the mean of age between adults with a clinical status DS, MCI-DS and/or dementia across the three premorbid ID groups were assessed using the estimates of the coefficients from the models using a dummy variable.
RESULTS
Preliminary analyses
Table 1 presents information on the sample socio-demographics. Of the 388 participants who met inclusion criteria for the larger ABC-DS study, 8 (2.1%) did not have an IQ or mental age score prior to AD-related concerns, and 19 (4.9%) had a clinical AD status of ‘unable to determine’. The remaining 361participants ranged in age from 25 to 81 years, with a mean of 45.19 years (SD = 9.88). About half were female (n = 162, 44.9%) and the majority were White (n = 340, 94.2%). The majority of participants had full trisomy (n = 306, 84.8%), while 17 (5.5%) had mosaic, 19 (5.2%) had translocation, and the karyotype was unknown for 19 (5.2%) participants. The latter missing karyotype group was retained in analyses but not a focus of contrast effects in models. In terms of premorbid ID level, 187 (51.8%) participants had mild ID, 140 (38.8%) had moderate ID, and 34 (9.4%) had severe/profound ID. The majority of participants had a clinical status of cognitively stable (n = 263, 72.9%), while 53 (14.7%) had MCI-DS and 45 (12.5%) had AD dementia. There were 162 participants who had completed PET and MRI imaging. These scans provided usable PET Aβ and tau PET data on 154 participants; 8 (4.94%) of the scans were unreadable due to motion/other.
Table 1
Participant characteristics and mean and standard deviation for study variables
| Total (n = 361) | Mild ID (n = 187) | Moderate ID (n = 140) | Severe/Profound ID (n = 34) | F or χ2 value (p) | |
| Trisomy type, No. (%) | 10.902 (0.028) | ||||
| Full | 306 (84.8) | 160 (85.5) | 120 (85.7) | 26 (76.5) | |
| Mosaic | 17 (5.5) | 9 (4.8) | 7 (5.0) | 1 (2.9) | |
| Translocation | 19 (5.2) | 8 (4.2) | 5 (3.6) | 6 (17.6) | |
| Unknown | 19 (5.2) | 10 (5.3) | 8 (5.7) | 1 (2.9) | |
| APOE ɛ4, No. (%) | 87 (24.1) | 47 (25.1%) | 29 (20.7%) | 11 (32.4%) | 1.732 (0.421) |
| Age in years, M (SD) | 45.19 (9.88) | 44.89 (9.42) | 45.92 (9.96) | 43.88 (11.93) | 1.593 (0.205) |
| Sex, No. (%) | 4.746 (0.093) | ||||
| Male | 199 (55.1) | 96 (51.3) | 87 (62.1) | 16 (47.1) | |
| Female | 162 (44.9) | 91 (48.7) | 53 (37.9) | 18 (52.9) | |
| Clinical Status, No. (%) | 7.310 (0.120) | ||||
| CS | 263 (72.9) | 144 (77.0) | 93 (66.4) | 26 (76.5) | |
| MCI-DS | 53 (14.7) | 22 (11.8) | 28 (20.0) | 3 (8.8) | |
| Dementia | 45 (12.5) | 21 (11.2) | 19 (13.6) | 5 (14.7) | |
| Race, No. (%) | 2.364 (0.307) | ||||
| White | 340 (94.2) | 179 (95.7) | 129 (92.1) | 32 (94.1) | |
| Non-white | 21 (5.8) | 8 (4.3) | 11 (7.9) | 2 (5.9) | |
| Cholinesterase inhibitors, NO. (%) | 35 (9.6%) | 16 (8.6%) | 13 (9.3%) | 5 (14.7) | 0.829 (0.661) |
| Cognition, M (SD) | |||||
| Block Design | 22.16 (12.38) | 26.33 (12.14) | 18.74 (11.24) | 12.26 (7.78) | 28.223 (<0.001) |
| mCRT | 27.31 (10.66) | 29.17 (9.83) | 25.26 (11.34) | 24.07 (10.71) | 5.639 (0.004) |
| DSMSE | 59.27 (15.79) | 65.77 (13.23) | 53.96 (14.95) | 43.23 (13.63) | 48.887(<0.001) |
| DLD Cognitive | 7.10 (9.22) | 4.02 (6.56) | 9.30 (10.06) | 14.94 (10.99) | 29.208 (<0.001) |
| DLD Social | 6.27 (6.93) | 4.97 (5.66) | 7.31 (7.46) | 9.21 (9.25) | 8.510 (<0.001) |
| Biomarkers, M (SD) | |||||
| PET Aβ | 16.23 (28.70) | 17.46 (31.51) | 15.82 (26.56) | 11.63 (19.59) | 0.812 (0.446) |
| Tau PET | 1.19 (0.26) | 1.20 (0.29) | 1.21 (0.08) | 1.12 (0.08) | 0.943 (0.323) |
M, mean; SD, standard deviation; ID, intellectual disability; CS, cognitively stable; MCI-DS, mild cognitive impairment-Down syndrome; mCRT, modified Cued Recall Test; DSMSE, Down Syndrome Mental Status Examination; DLD, The Dementia Questionnaire for People with Learning Disabilities. PET Aβ is in centiloids. Tau PET is in standard uptake value ratio.
Premorbid ID and cognitive functioning
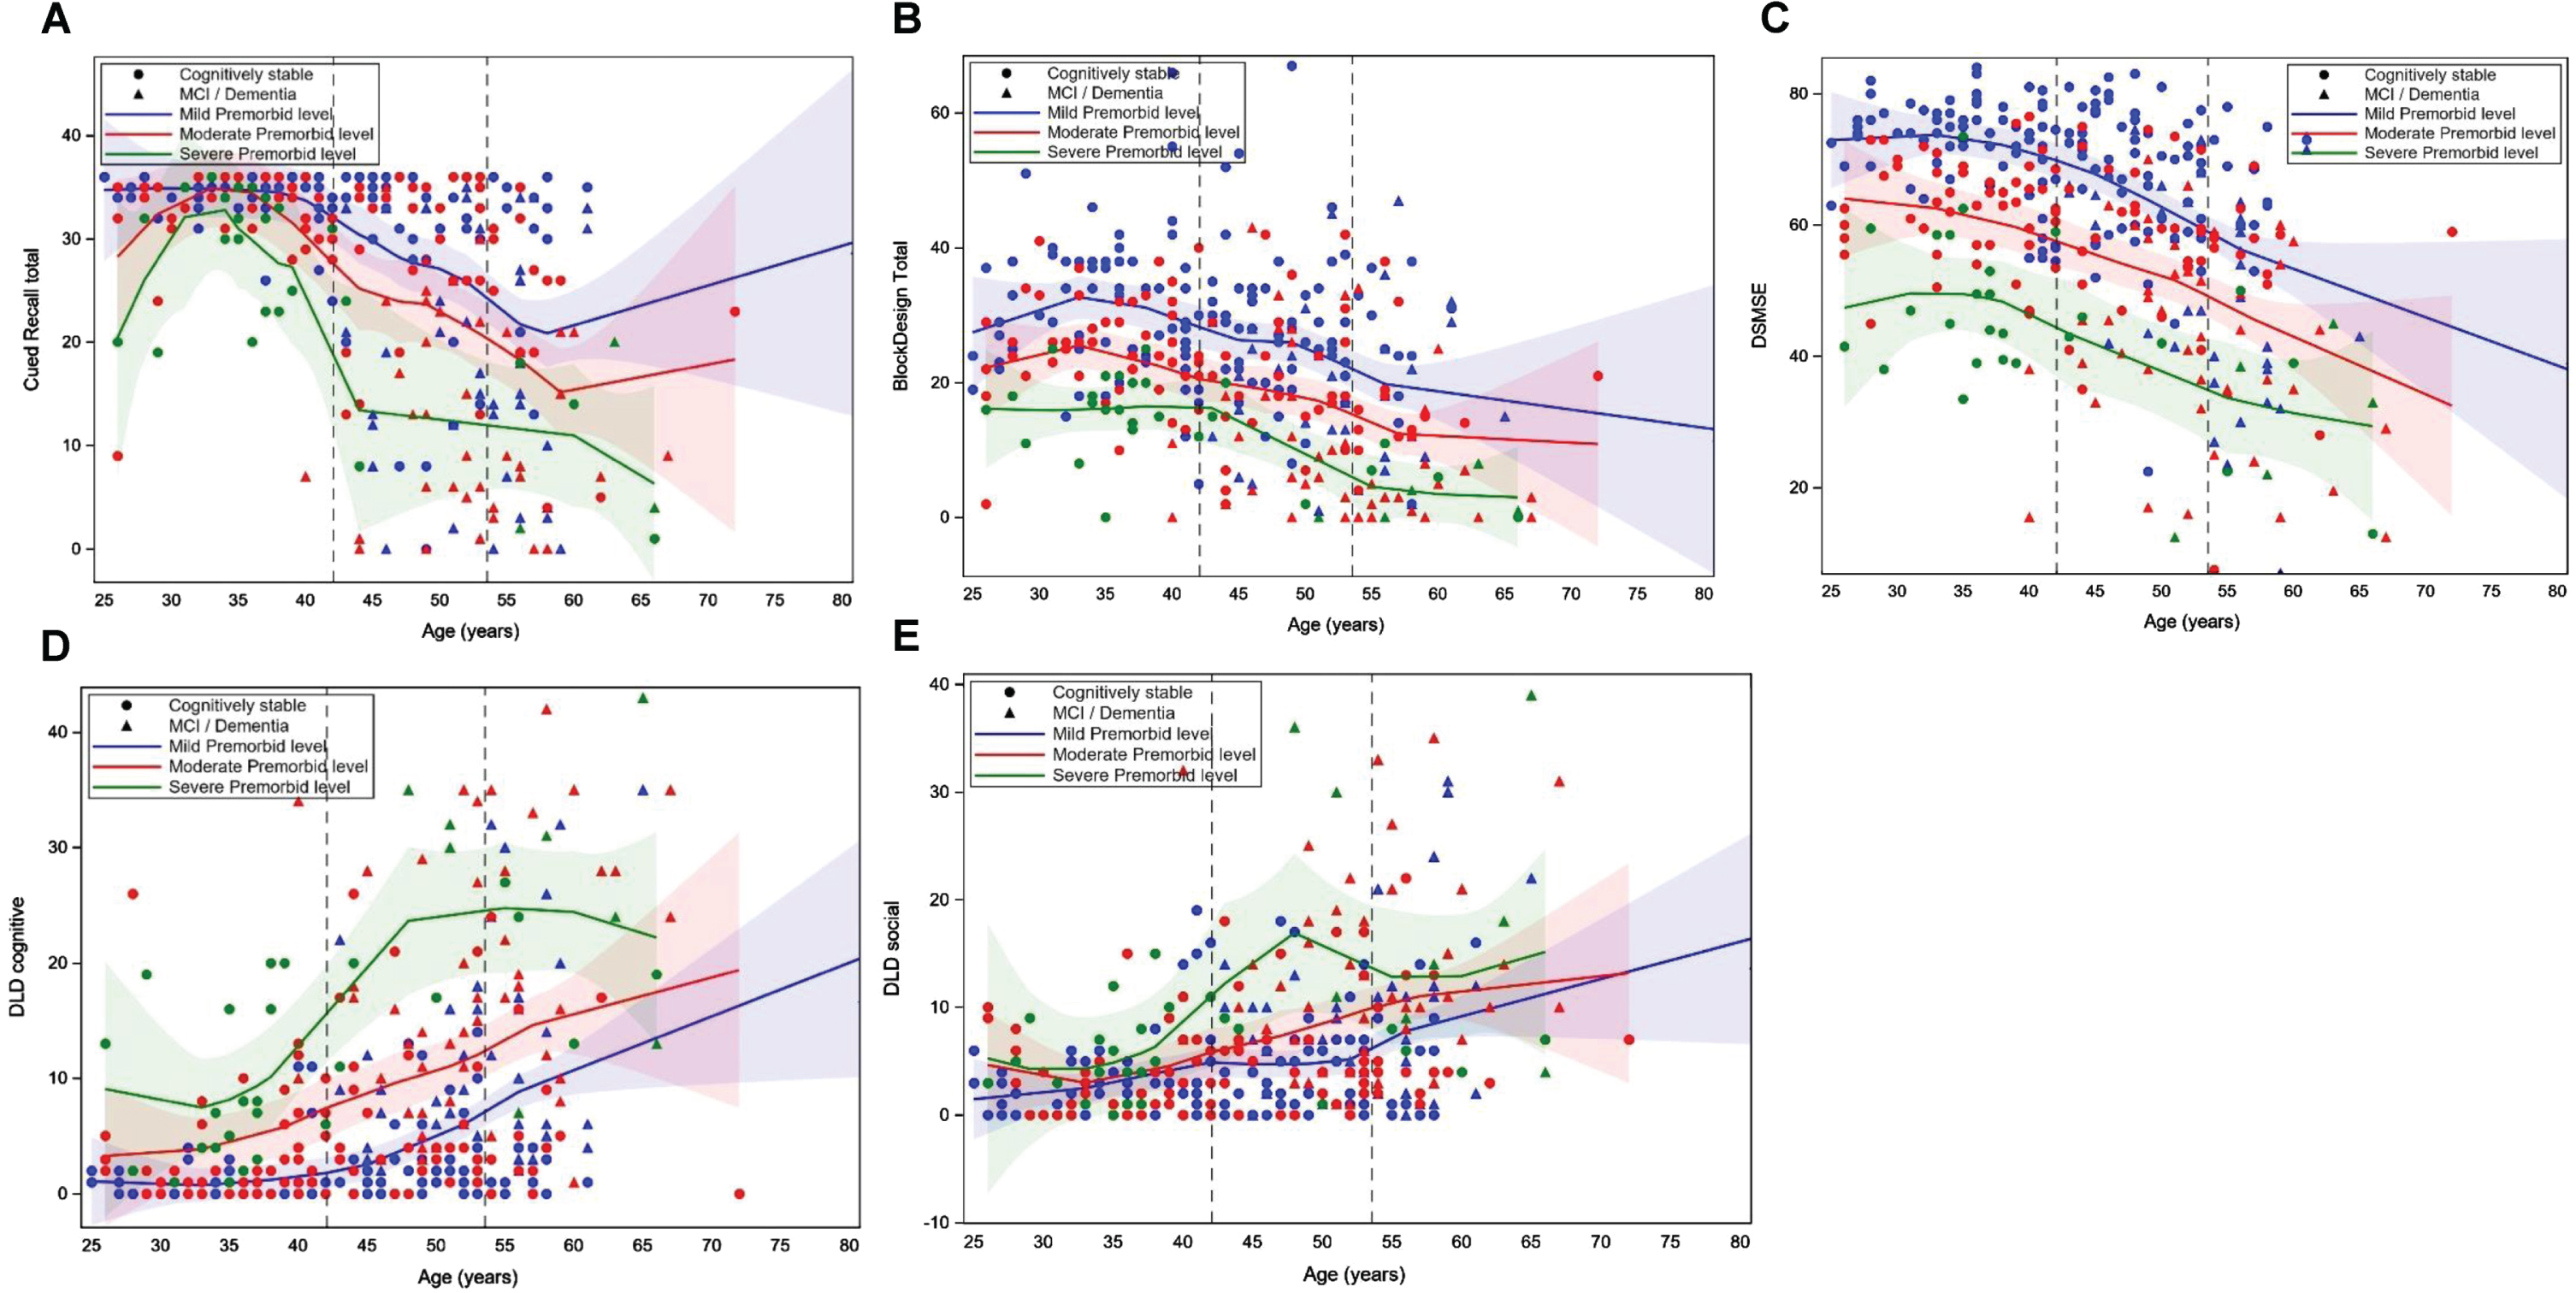
Table 2 shows the results of the mixed general linear mixed models examining the effects of age and premorbid ID level, and their interaction, on cognitive performance in models that controlled for clinical AD status, biological sex, trisomy karyotype, APOE ɛ4 allele status, and site. The quadratic effect of age on cognitive performance was also tested. However, there was not a significant age2 or age2 by premorbid ID effect when all covariates were included; thus, only the linear effect of age is included in final models (see Table 2 footnote). There was a significant random effect of site for Block Design (F = 3.227, p = 0.003), DLD sum of cognitive (F = 3.671, p = 0.001) and social (F = 3.286, p = 0.002) scores, and mCRT (F = 5.297, p < 0.001) Total score, indicating that sites differed in the age of recruited participants. Clinical status had a significant effect on Block Design (F = 32.949, p < 0.001), mCRT (F = 75.578, p < 0.001), DSMSE (F = 47.770, p < 0.001), and the DLD cognitive (F = 104.733, p < 0.001) and Social (F = 53.556, p < 0.001) scores. Participants with MCI-DS or AD dementia performed worse than those who were cognitively stable. There was a significant negative effect of age on the DSMSE (–0.294 [SE = 0.106], p = 0.006), with older participants performing worse than younger participants. There was a significant effect of premorbid ID level on DSMSE (F = 5.188, p = 0.006) with adults with mild ID scoring higher than those with moderate ID (–13.034 [SE = 5.990], p = 0.030) and severe/profound ID (–24.734 [SE = 8.506], p = 0.004). There was not a significant premorbid ID level by age interaction on any of the cognitive outcomes. Thus, the association between age and performance on the cognitive measures was similar across the premorbid ID level groups. Figure 1A– E displays loess scatterplots of age and cognitive performance by premorbid ID group, which provides a visualization of the associations.
Table 2
General linear mixed models of premorbid intellectual disability (ID) level on cognitive outcomes
| Estimate (Standard Error) or F value | |||||
| Block Design | mCRT | DSMSE | DLD Social | DLD Cognitive | |
| Site (random effect) | 3.227** | 5.297** | 1.245 | 3.286** | 3.671** |
| Age | –0.110 (0.093) | –0.044 (0.073) | –0.294 (0.106)* | 0.016 (0.049) | 0.060 (0.055) |
| Biological Sex | –0.933 (1.104) | 0.332 (0.863) | 1.385 (1.256) | 0.393 (0.584) | –0.579 (0.650) |
| Trisomy type (versus full), F value | 1.957 (0.143) | 1.647 (0.194) | 0.495 (0.610) | 0.202 (0.817) | 0.602 (0.548) |
| Mosaic | –1.317 (2.577) | –3.645 (2.196) | –1.470 (2.956) | 0.789 (1.372) | 1.293 (0.527) |
| Translocation | 4.275 (2.256) | 1.190 (1.734) | 2.169 (2.562) | –0.303 (1.202) | –0.898 (1.338) |
| APOE ɛ4 | –0.472 (1.146) | 0.197(0.994) | 0.057 (1.416) | –0.486 (0.662) | 0.064 (0.737) |
| Clinical Status (versus CS), F value | 32.949** | 75.578** | 47.770** | 53.556** | 104.733** |
| MCI-DS | –3.922 (1.698)* | –9.329 (1.329)** | – 5.733 (1.951)** | 2.060 (0.906)* | 4.021 (1.008)** |
| Dementia | –15.270 (1.881)** | –18.560 (1.617)** | –20.869 (2.136)** | 10.011 (0.969)** | 15.608 (1.078)** |
| Premorbid ID (versus mild), F value | 2.603 | 0.166 | 5.188** | 0.491 | 0.308 |
| Moderate | –7.609 (5.256) | 2.387 (4.165) | –13.0334 (5.990)* | 0.848 (2.797) | 0.543 (3.114) |
| Severe/Profound | –15.801 (7.490)* | 0.0695 (5.958) | –24.734 (8.506)** | 3.954 (3.988) | 3.478 (4.439) |
| Age×Premorbid ID, F value | 0.054 | 1.672 | 0.194 | 0.003 | 1.678 |
| Age×Moderate | 0.029 (0.114) | –0.113 (0.091) | 0.072 (0.130) | 0.004 (0.060) | 0.070 (0.067) |
| Age×Severe/Profound | –0.019 (0.166) | –0.220 (0.137) | –0.020 (0.189) | –0.002 (0.088) | 0.171 (0.098) |
ID, intellectual disability; CS, cognitively stable; MCI-DS, mild cognitive impairment-Down syndrome; AD, Alzheimer’s disease; DSMSE, Down Syndrome Mental Status Examination; DLD, The Dementia Questionnaire for People with Learning Disabilities. Age2 was not significantly related to Block Design (–0.045 [0.657]), mCRT (–0.012[(0.09]), DSMSE (0.003 [0.002]), DLD Social (0.033 [0.029]) or DLD Cognitive (0.002 [0.002]). Age2×Premorbid ID was not significantly related to Block Design (F = 0.087, p = 0.765), mCRT (F = 01.654, p = 0.322), DSMSE (0.176, p = 0.829), DLD Social (F = 0.006, p = 0.711). or DLD Cognitive (F = 1.50, p = 0.231]). *p < 0.05; **p < 0.01.
Fig. 1A–E.
Loess scatterplots of the association between age and performance on the modified Cued Recall Test (A), Block Design Tasks (B), Down Syndrome Mental Status Exam (DSMSE) (C), Dementia Questionnaire for People with Learning Disorders (DLD) sum of cognitive score (D) and DLD sum of social score (E) by premorbid level of intellectual disability. The first dashed vertical line is the mean age of the cognitively stable group and the second line is the mean age of those with mild cognitive impairment (MCI) or dementia.
Premorbid ID and AD biomarkers
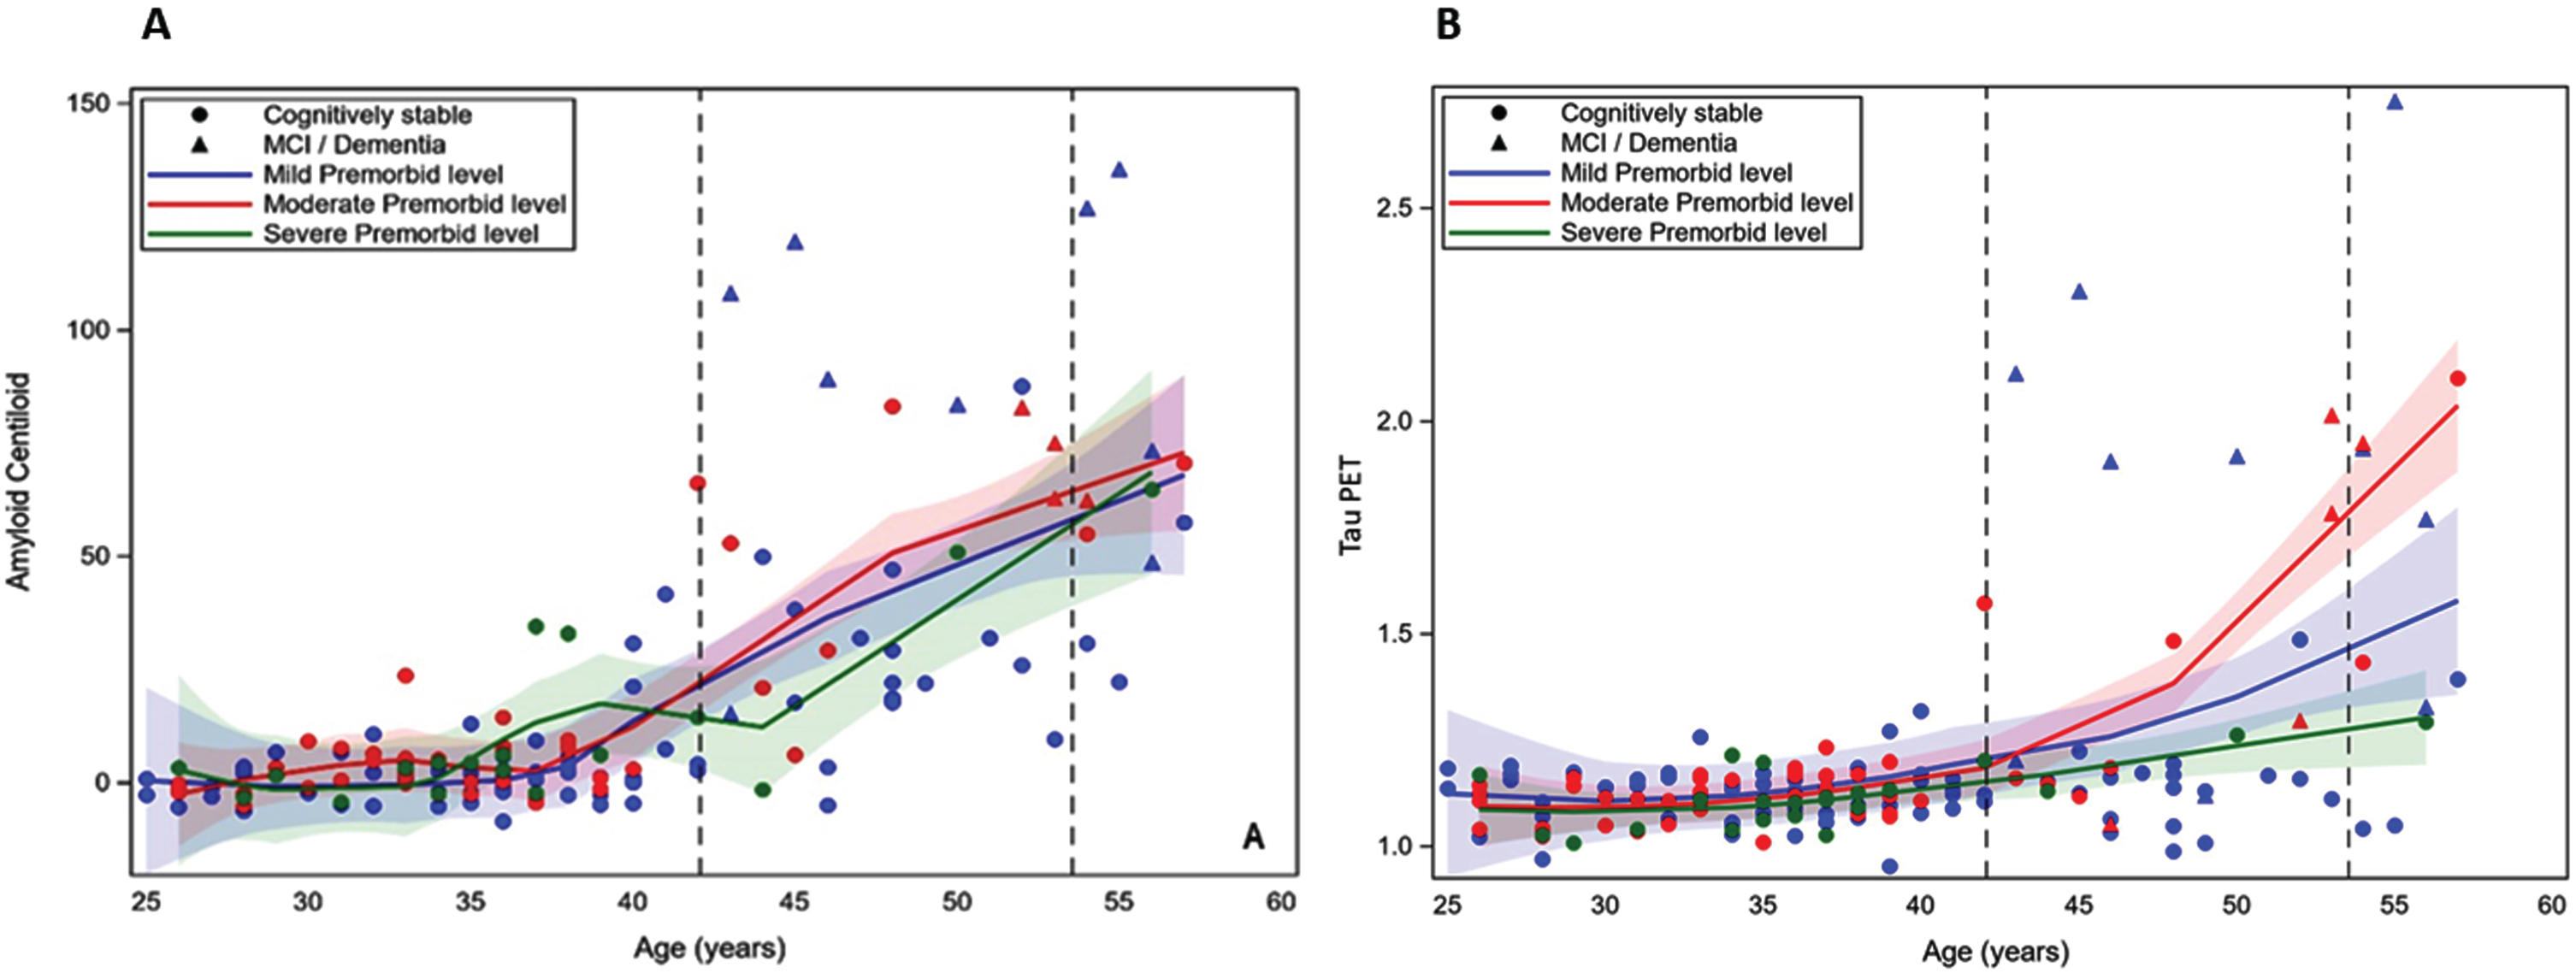
Table 3 shows the results of the general linear mixed model regressions examining the effect of age and premorbid ID level, and their interaction, on PET Aβ and tau PET in models controlling for the same set of control variables as above. The quadradic effect of age on cognitive performance was also tested. However, there was not a significant age2 or age2 by premorbid ID effect (see Table 2 footnote); thus, only the linear effect of age is included in final models. There was a significant positive effect of age on both PET Aβ (1.622 [SE = 0.233], p < 0.001) and tau PET (0.017 [SE = 0.002], p < 0.001). There was also a significant effect of clinical AD status on PET Aβ (F = 48.681, p < 0.001) and tau PET (F = 43.185, p < 0.001). Participants who were cognitively stable had lower levels of both biomarkers than those with MCI-DS or AD Dementia. There was not a significant premorbid ID by age interaction on PET Aβ or on tau PET. Thus, age had a similar association with the PET biomarkers across premorbid ID levels. Figure 2A and 2B displays the loess scatterplots of age and PET biomarkers by premorbid ID group.
Table 3
General linear mixed models of premorbid intellectual disability (ID) level on PET Biomarkers
| Estimate (Standard Error) or F value | ||
| Aβ | Tau | |
| Site (random effect) | 0.554 | 0.498 |
| Age | 1.622 (0.233)** | 0.017 (0.002)** |
| Biological Sex | –2.033 (2.774) | –0.022 (0.031) |
| Trisomy type (versus full) | 0.531 | 0.481 |
| Mosaic | 2.443 (7.041) | 0.080 (0.087) |
| Translocation | –4.877 (5.087) | –0.018 (0.056) |
| APOE ɛ4 | 2.461(3.333) | 0.026 (0.036) |
| Clinical Status (versus CS) | 48.681** | 43.185** |
| MCI-DS | 37.720 (6.882)** | 0.437 (0.073)** |
| Dementia | 66.874 (7.411)** | 0.624 (0.078)** |
| Premorbid ID (versus mild) | 0.093 | 1.351 |
| Moderate | 2.53 (13.755) | –2.57 (0.155) |
| Severe/Profound | –7.823 (22.867) | –0.141 (0.256) |
| Age×Premorbid ID (versus mild) | 0.182 | 1.797 |
| Age×Moderate | –0.016 (0.354) | 0.008 (0.004) |
| Age×Severe/Profound | 0.349 (0.602) | 0.004 (0.007) |
ID, intellectual disability; CS, cognitively stable; MCI-DS, mild cognitive impairment-Down syndrome; Aβ, amyloid-beta assessed in centiloids. Age2 was not significantly related to Aβ (0.099 [0.067]) or Tau (0.003 [0.002]). Age2×Premorbid ID was not significantly related to Aβ (F = 0.134, p = 0.865) or Tau (F = 0.184, p = 0.465). *p < 0.05; **p < 0.01.
Fig. 2
A and B. Loess scatterplots of the association between age and PET amyloid-beta (centiloids) and tau PET by premorbid level of intellectual disability. The first dashed vertical line is the mean age of the cognitively stable group and the second line is the mean age of those with mild cognitive impairment (MCI) or dementia.
Premorbid ID and MCI-DS and dementia
Table 4 displays the results of the general linear mixed models examining the interaction of premorbid ID level by clinical AD status (MCI-DS and AD dementia) on age in models controlling for biological sex, trisomy karyotype, APOE ɛ4 allele status, and site. There was not a significant quadradic effect of age2 or age2×premorbid ID level interaction on clinical AD status (see Table 4 footnote) and thus only the linear effect of age is shown in the final model. There was not a significant effect of premorbid ID level by MCI-DS or premorbid ID level by AD dementia on age. As shown in Fig. 3, the mean age of adults with DS in each clinical status group did not significantly differ by premorbid ID level.
Table 4
General linear mixed models of premorbid intellectual disability (ID) level and clinical Alzheimer’s disease Status and their interaction on age
| Estimate (Standard Error) or F value | |
| Site (random effect) | 21.909 (<0.001)** |
| Trisomy type (versus full) | 3.928 (0.021) |
| Mosaicism | 3.079 (1.970) |
| Translocation | –3.891 (1.726)* |
| APOE ɛ4 | –2.596 (0.947)* |
| Biological Sex | –1.234 (0.841)* |
| Clinical Status (versus CS) | 13.901 (<0.001)** |
| MCI-DS | 6.602 (1.804)** |
| Dementia | 8.446 (1.771)** |
| Premorbid ID (versus mild) | 0.999 (0.369) |
| Moderate | –0.670 (1.018) |
| Severe/Profound | 1.508 (1.585) |
| Premorbid ID×Clinical Status (versus CS) | 1.531 (0.193) |
| Moderate×MCI-DS | –2.626 (2.504) |
| Moderate×Dementia | 0.389 (2.757) |
| Severe/Profound×MCI-DS | 4.548 (4.703) |
| Severe/Profound×Dementia | –6.321 (4.227) |
ID, intellectual disability; CS, cognitively stable; MCI-DS, mild cognitive impairment-Down syndrome; Aβ, amyloid-beta assessed in centiloids. *p < 0.05; **p < 0.01.
DISCUSSION
As we prepare for AD clinical trials in DS, it is essential to understand whether phenotypic variability, including premorbid ID level, is associated with differences in AD progression. Findings from the present study provide the strongest evidence to-date that the timing of AD is similar across premorbid ID levels in DS. The age-trajectory of PET Aβ and tau PET was similar in adults with DS with mild, moderate, and severe/profound premorbid ID based on our cohort of adults with DS. Across all premorbid ID levels, PET Aβ increases occurred in the late 30 s, and tau PET increases occurred in the 40 s, which is a decade prior to the expected average age of transition to MCI-DS and AD dementia in DS, in line with studies on autosomal dominant AD [46] and previous studies on DS [2, 47]. The age-trajectory of early cognitive decline on tests of episodic memory, visuospatial ability, and overall dementia symptoms was also similar across premorbid ID groups. Despite the groups having different baseline performance levels, adults with mild, moderate, and severe/profound premorbid ID demonstrated a similar age trajectory of cognitive declines. The average age at time of study visit of adults with DS diagnosed with MCI-DS and AD dementia also did not differ by premorbid ID level, occurring in the early to mid-50 s, respectively. These mean ages are in line with prior work showing a mean age of AD dementia onset across studies of 53.8 years [10].
Fig. 3
Boxplot of age on clinical status (cognitively stable [none], mild cognitive impairment [MCI], and dementia) by premorbid level of intellectual disability (mild, moderate, or severe/profound).
![Boxplot of age on clinical status (cognitively stable [none], mild cognitive impairment [MCI], and dementia) by premorbid level of intellectual disability (mild, moderate, or severe/profound).](https://ip.ios.semcs.net:443/media/jad/2023/95-1/jad-95-1-jad230200/jad-95-jad230200-g003.jpg)
These findings are aligned with those from another large cohort of adults with DS, which reported a similar rate of decline in AD-related cognitive functioning for adults with mild versus moderate premorbid ID using the CAMCOG-DS and mCRT [24]. These findings are also in line with studies reporting no difference in age of dementia onset based on premorbid ID level in samples of people with ID due to etiologies other than DS [48]. Overall, these findings suggest that the time course of AD is comparable across premorbid ID levels in DS. Thus, AD clinical trials should not exclude individuals with DS based on premorbid ID level; rather, projected age trajectories of AD progression such provide sufficient inclusion criteria for participation in clinical trials. While premorbid ID level may not confer cognitive or brain reserve effects in people with DS— given that the time course of AD progression did not vary based on premorbid ID level— it is still possible that brain or cognitive reserve effects occur in this population. Indeed, there is some evidence that engagement in cognitively-stimulating leisure activities and employment complexity, which vary widely even among those with the same level of ID, are associated with less decline in cognitive functioning with age among individuals with DS [49, 50].
Results should be interpreted with consideration of study strengths and limitations. In terms of strengths, the study leveraged a large cohort of adults with DS. The focus was on cognitive measures with adequate testing properties across premorbid ID levels, and, thus, floor effects were limited. However, it is still possible that these floor effects, especially on the mCRT, obscured accurate detection of age-trajectories of decline for the severe/profound premorbid ID group, as has been reported by other groups [24]. In terms of other limitations, modeling of the timing of AD progression was based on cross-sectional data. Future within-person longitudinal data is needed to validate estimated trajectories in AD biomarkers and cognitive decline and better understand within-person declines. While the mean age of participants in the MCI-DS and dementia status groups at the time of the study visit did not differ by premorbid ID level, it is still possible that the age of initial transition to MCI-DS or dementia does. The sample included a relatively small number of individuals with severe/profound premorbid ID, and the inclusion criteria necessary for PET imaging restricted the participation of adults with DS with certain medical conditions. As a result, our sample may reflect healthier and higher functioning folks within each premorbid ID level relative to the broader DS population. The sample was also primarily white and non-Hispanic, and future work should make concerted efforts to recruit diverse samples. In the current study, clinical AD status groups (MCI-DS and AD dementia) focused on the presence of cognitive and/or functional decline from a baseline level. Behavioral changes often occurred alongside of the cognitive and functional changes, and thus potential differences in behavioral AD symptoms by premorbid ID level should be examined in future studies. Finally, our visualizations of age-trajectories suggest possible increases in cognitive performance and/or practice effects on some measures (e.g., mCRT) in early adulthood (20 s and early 30 s), which should be evaluated in the future.
Overall, the study adds to the characterization of the time course of AD pathology and clinical symptomology in DS. Understanding this progression across the varying phenotypic presentation of DS is essential for anticipated AD clinical trials in the DS population. The present study provides robust evidence of a similar time course in AD progression across mild, moderate, and severe/profound premorbid ID levels in DS. Importantly, these findings lay the groundwork for the inclusion of individuals with DS with a variety of IQ levels in clinical AD trials. Finally, while evidence suggests that the timing of AD progression does not differ by premorbid ID level, it is still possible that lifestyle factors such as employment or engagement in cognitively stimulating leisure activities, which vary widely among individuals with DS, effects AD progression which may not necessarily align with premorbid ID level among individuals with DS.
ACKNOWLEDGMENTS
The authors thank the adults with Down syndrome volunteering as participates in this study for their invaluable contributions to this work, along with their service providers and families. We also thank the broader ABC-DS research team.
FUNDING
Data collection and sharing for this project was supported by The Alzheimer Disease Biomarker Consortium on Down Syndrome (ABC-DS). Funding was received from the National Institute on Aging and the Eunice Kennedy Shriver National Institute of Child Health and Human Development (UO1 AG051406, UO1 AG051412, R01AG070028, P50HD105353, and T32HD007489).
CONFLICT OF INTEREST
GE Healthcare holds a license agreement with the University of Pittsburgh for the [11C]PiB PET technology involved in this study. William Klunk is a co-inventor of [11C]PiB and has financial interest in this license agreement. GE Healthcare did not provide financial support for this study nor did it have a role in designing the study or interpreting the results. Elizabeth Head is an Editorial Board Member of this journal but was not involved in the peer-review process now had access to any information regarding its peer-review.
DATA AVAILABILITY
The data used in the study are publicly available at https://www.nia.nih.gov/rserach/abc-ds#data.
REFERENCES
[1] | Sherman SL , Allen EG , Bean LH , Freeman SB ((2007) ) Epidemiology of Down syndrome. Ment Retard Dev Disabil Res Rev 13: , 221–227. |
[2] | Fortea J , Zaman SH , Hartley S , Rafii MS , Head E , Carmona-Iragui M ((2021) ) Alzheimer’s disease associated with Down syndrome: A genetic form of dementia. Lancet Neurol 20: , 930–942. |
[3] | Wiseman FK , Al-Janabi T , Hardy J , Karmiloff-Smith A , Nizetic D , Tybulewicz LJ , Fisher EMC , Strydom A ((2015) ) A genetic cause of Alzheimer disease: Mechanistic insights from Down syndrome. Nat Rev Neurosci 16: , 564–574. |
[4] | Fortea J , Vilaplana E , Carmona-Iragui M , Benejam B , Videla L , Barroeta I , Fernández S , Altuna M , Pegueroles J , Montal V , Valldeneu S , Giménez S , González-Ortiz S , Muñoz L , Estellés T , Illán-Gala I , Belbin O , Camacho V , Wilson LR , Annus T , Osorio RS , Videla S , Lehmann S , Holland AJ , Alcolea D , Clarimón J , Zaman SH , Blesa R , Lleó A ((2020) ) Clinical and biomarker changes of Alzheimer’s disease in adults with Down syndrome: A cross-sectional study. Lancet 395: , 1988–1997. |
[5] | Margallo-Lana ML , Moore PB , Kay DW , Perry RH , Reid BE , Berney TP , Tyrer SP ((2007) ) Fifteen-year follow-up of 92 hospitalized adults with Down’s syndrome: Incidence of cognitive decline, its relationship to age and neuropathology. J Intellect Disabil Res 51: , 463–477. |
[6] | McCarron M , McCallion P , Reilly E , Dunne P , Carroll R , Mulryan N ((2017) ) A prospective 20-year longitudinal follow-up of dementia in persons with Down syndrome. J Intellect Disabil Res 61: , 843–852. |
[7] | Lott IT , Head E ((2019) ) Dementia in Down syndrome: Unique insights for Alzheimer disease research. Nat Rev Neurol 15: , 135–147. |
[8] | Handen BL , Lott IT , Christian BT , Schupf N , OBryant S , Mapstone M , Fagan AM , Lee JH , Tudorascu D , Wang MC , Head E , Klunk W , Ances B , Lai F , Zaman S , Krinsky-McHale S , Brickman AM , Rosas HD , Cohen A , Andrews H , Hartley S , Silverman W Alzheimer’s Biomarker Consortium-Down Syndrome (ABC-DS) ((2020) ) The Alzheimer’s Biomarker Consortium-Down Syndrome: Rationale and methodology. Alzheimers Dement 12: , e12065. |
[9] | Lao PJ , Betthauser TJ , Hillmer AT , Price JC , Klunk WE , Mihaila I , Higgins AT , Bulova , PD , Hartley , S L , Hardison R , Tumuluru RV , Murali D , Mathis CA , Cohen AD , Barnhart TE , Devenny D A , Mailick MR , Johnson SC , Handen BL , Christian BT ((2016) ) The effects of normal aging on amyloid-β deposition in nondemented adults with Down syndrome as imaged by carbon 11-labeled Pittsburgh compound B. Alzheimers Dement 12: , 380–390. |
[10] | Iulita MF , Garzón Chavez D , Klitgaard Christensen M , Valle Tamayo N , Plana-Ripoll O , Rasmussen SA , Roqué Figuls M , Alcolea D , Videla L , Barroeta I , Benejam B , Altuna M , Padilla C , Pegueroles J , Fernandez S , Belbin O , Carmona-Iragui M , Blesa R , Lleó A , Fortea J ((2022) ) Association of Alzheimer disease with life expectancy in people with Down syndrome. JAMA Network Open 5: , e2212910. |
[11] | Chapman RS , Hesketh LJ ((2000) ) Behavioral phenotype of individuals with Down syndrome. Mental Retard Develop Disabil Res Rev 6: , 84–95. |
[12] | Hamburg S , Lowe B , Startin CM , Padilla C , Coppus A , Silverman W , Fortea J , Zaman S , Head E , Handen BL , Lott I , Song W , Strydom A ((2019) ) Assessing general cognitive and adaptive abilities in adults with Down syndrome: A systematic review. J Neurodev Disord 11: , 20. |
[13] | Mégarbané A , Noguier F , Stora S , Manchon L , Mircher C , Bruno R , Dorison N , Pierrat F , Rethoré MO , Trentin B , Ravel A , Morent M , Lefranc G , Piquemal D ((2013) ) The intellectual disability of trisomy 21: Differences in gene expression in a case series of patients with lower and higher IQ. Eur J Hum Genet 21: , 1253–1259. |
[14] | Noble J ((1998) ) Natural history of Down’s syndrome: A brief review for those involved in antenatal screening. J Med Screen 5: , 172–177. |
[15] | Fishler K , Koch R ((1991) ) Mental development in Down syndrome mosaicism. Am J Ment Retard 96: , 345–351. |
[16] | Startin CM , D’Souza H , Ball G , Hamburg S , Hithersay R , Hughes KMO , Massand E , Karmiloff-Smith A , Thomas MSC; LonDownS Consortium; Strydom A ((2020) ) Health comorbidities and cognitive abilities across the lifespan in Down syndrome. J Neurodevelop Disord 12: , 4. |
[17] | Stern Y ((2006) ) Cognitive reserve and Alzheimer disease. Alzheimer Dis Assoc Dis 20: , S69–S74. |
[18] | Groot C , van Loenhoud AC , Barkhof F , van Berckel BN , Koene T , Teunissen CC , Scheltens P , van der Flier WM , Ossenkoppele R ((2018) ) Differential effects of cognitive reserve and brain reserve on cognition in Alzheimer disease. Neurol 90: , e149–e156. |
[19] | Guo LH , Alexopoulos P , Wagenpfeil S , Kurz A , Perneczky R ((2013) ) Brain size and the compensation of Alzheimer’s disease symptoms: A longitudinal cohort study. Alzheimers Dement 9: , 580–586. |
[20] | Stern Y ((2012) ) Cognitive reserve in ageing and Alzheimer’s disease. Neurol 11: , 1006–1012. |
[21] | Liu Y , Julkunen V , Paajanen T , Westman E , Wahlund LO , Aitken A , Sobow T , Mecocci P , Tsolaki M , Vellas B , Muehlboeck S , Spenger C , Lovestone S , Simmons A , Soininen H ((2012) ) Education increases reserve against Alzheimer’s disease— evidence from structural MRI analysis. Neuroradiology 54: , 929–938. |
[22] | Perneczky R , Wagenpfeil S , Lunetta KL , Cupples LA , Green RC , DeCarli C , Farrer LA , Kurz A ((2009) ) Education attenuates the effect of medial temporal lobe atrophy on cognitive function in Alzheimer’s disease: The MIRAGE study. J Alzheimers Dis 17: , 855–862. |
[23] | Hom CL , Kirby KA , Ricks-Oddie J , Keator DB , Krinsky-McHale SJ , Pulsifer MB , Rosas HD , Lai F , Schupf N , Lott IT , Silverman W ((2021) ) Cognitive function during the prodromal stage of Alzheimer’s disease in Down syndrome: Comparing models. Brain Sci 11: , 1220. |
[24] | Videla L , Benejam B , Pegueroles J , Carmona-Iragui M , Padilla C. , Fernández S , Barroeta I , Altuna M , Valldeneu S , Garzón D , Ribas L , Montal V , Arranz Martínez J , Rozalem Aranha M , Alcolea D , Bejanin A , Iulita MF , Videla Cés S , Blesa , Fortea J ((2022) ) Longitudinal clinical and cognitive changes along the Alzheimer disease continuum in Down syndrome. JAMA Network Open 5: , e2225573. |
[25] | Esteba-Castillo S , Dalmau-Bueno A , Ribas-Vidal N , Vilà-Alsina M , Novell-Alsina R , García-Alba J ((2013) ) Adaptation and validation of CAMDEX-DS (Cambridge Examination for Mental Disorders of Older People with Down’s Syndrome and others with intellectual disabilities) in Spanish population with intellectual disabilities]. Rev Neurol 57: , 337–346. |
[26] | Devenny DA , Zimmerli EJ , Kittler P , Krinsky-McHale SJ ((2002) ) Cued recall in early-stage dementia in adults with Down’s syndrome. J Intellect Disabil Res 46: , 472–483. |
[27] | Roid G ((2003) ) Stanford Binet Intelligence Scales. Riverside Publishing, Itasca, IL. |
[28] | WechslerD (2008) Wechsler Adult Intelligence Scale–Fourth Edition (WAIS-IV), PsycTESTS. |
[29] | Kaufman AS , Kaufman NL ((2004) ) Kaufman Brief Intelligence Test, second edition. American Guidance Services, Circle Pines, MN. |
[30] | Hartley SL , Handen BL , Devenny D , Tudorascu D , Piro-Gambetti B , Zammit MD , Laymon CM , Klunk WE , Zaman S , Cohen A , Christian BT ((2020) ) Cognitive indicators of transition to preclinical and prodromal stages of Alzheimer’s disease in Down syndrome. Alzheimers Dement 12: , e12096. |
[31] | Krinsky-McHale SJ , Zigman WB , Lee JH , Schupf N , Pang D , Listwan T , Kovacs C , Silverman W ((2020) ) Promising outcome measures of early Alzheimer’s dementia in adults with Down syndrome. Alzheimers Dement 12: , e12044. |
[32] | Krinsky-McHale SJ , Hartley S , Hom C , Pulsifer M , Clare ICH , Handen BL , Lott IT , Schupf N , Silverman W , Alzheimer’s Biomarker Consortium— Down Syndrome (ABC-DS) Investigators ((2022) ) A modified Cued Recall Test for detecting prodromal AD in adults with Down syndrome. Alzheimers Dement 14: , e12361. |
[33] | Wechsler D ((2004) ) Wechsler Intelligence Scale-Children. Revised. Psychological Corporation, New York, NY. |
[34] | Schapiro MB , Haxby JV , Grady CL ((1992) ) Nature of mental retardation and dementia in Down syndrome: Study with PET, CT, and neuropsychology. Neurobiol Aging 13: , 723–734. |
[35] | Zimmerli E , Devenny DA ((1995) ) Paper presented at the Gatlinburg conference on research and theory in mental retardation and developmental disabilities. Cued recall as a screen for dementia in the MR population. Gatlinburg, TN. |
[36] | Hartley SL , Handen BL , Tudorascu D , Lee L , Cohen A , Piro-Gambetti B , Zammit M , Klunk W , Laymon C , Zaman S , Ances BM , Sabbagh M , Christian BT ((2022) ) Role of tau deposition in early cognitive decline in Down syndrome. Alzheimers Dement 14: , e12256. |
[37] | Haxby JV ((1989) ) Neuropsychological evaluation of adults with Down’s syndrome: Patterns of selective impairment in non-demented old adults. J Ment Defic Res 33: , 193–210. |
[38] | Evenhuis H ((2018) ) The Dementia Questionnaire for People with Learning Disabilities. In Neuropsychological Assessments of Dementia in Down Syndrome and Intellectual Disabilities, Second edition, PrasherVP, ed. Springer International Publishing, pp. 43–56. |
[39] | Koehl L , Harp J , Van Pelt KL , Head E , Schmitt FA ((2020) ) Longitudinal assessment of dementia measures in Down syndrome, Alzheimers Dement 12: , e12075. |
[40] | Klunk WE , Koeppe RA , Price JC , Benzinger TL , Devous MD Sr , Jagust WJ , Johnson KA , Mathis CA , Minhas D , Pontecorvo MJ , Rowe CC , Skovronsky DM , Mintun MA ((2015) ) The Centiloid Project: Standardizing quantitative amyloid plaque estimation by PET. Alzheimers Dement 11: , .1-15. 1–4. |
[41] | Desikan RS , Ségonne F , Fischl B , Quinn BT , Dickerson BC , Blacker D , Buckner RL , Dale AM , Maguire RP , Hyman BT , Albert MS , Killiany RJ ((2006) ) An automated labeling system for subdividing the human cerebral cortex on MRI scans into gyral based regions of interest. Neuroimage 31: , 968–980. |
[42] | Avants BB , Tustison NJ , Song G , Cook PA , Klein A , Gee JC ((2011) ) A reproducible evaluation of ANTs similarity metric performance in brain image registration. Neuroimage 54: , 2033–2044. |
[43] | Avants BB , Epstein CL , Grossman M , Gee JC ((2008) ) Symmetric diffeomorphic image registration with cross-correlation: Evaluating automated labeling of elderly and neurodegenerative brain. Med Image Anal 12: , 26–41. |
[44] | Jack CR , Wiste HJ , Weigand SD , Therneau TM , Lowe VJ , Knopman DS , Gunter JL , Senjem ML , Jones DT , Kantarci K , Machulda MM , Mielke MM , Roberts RO , Vemuri P , Reyes DA , Petersen RC ((2017) ) Defining imaging biomarker cut points for brain aging and Alzheimer’s disease. Alzheimers Dement 13: , 205–216. |
[45] | Bing D , He X ((2010) ) Linear mixed models in clinical trials using PROC MIXED. ParmaSUG2010-Paper SP07. |
[46] | Bateman RJ , Xiong C , Benzinger TLS , Fagan AM , Goate A , Fox NC , Marcus DS , Cairns NJ , Xie X , Blazey TM , Holtzman DM , Santacruz A , Buckles V , Oliver A , Moulder K , Aisen PS , Ghetti B , Klunk WE , McDade E , Martin RN , masters CL , Mayeux R , Ringerman JM , Rossor MN , Schofield PR , Sperling RA , Salloway S , Morris JC ((2012) ) Dominantly Inherited Alzheimer Network. Clinical and biomarker changes in dominantly inherited Alzheimer’s diease. New Eng J Med 367: , 795–804. |
[47] | Boerwinkle AH , Gordon BA , Wisch JK , Flores S , Henson RL , Butt OH , Chen CD , Benzinger TLS , Fagan AM , Handen BL , Christian BT , Head E , Mapstone M , Klunk WE , Rafii MS , O’Bryant SE , Price JC , Schupf N , Laymon CM , Krinsky-McHale SJ , Lai F , Rosas HD , Hartley SL , Zaman S , Lott IT , Silverman W , Brickman AM , Lee JH , Allegri RF , Berman S , Chhatwal JP , Chui HC , Cruchaga C , Farlow MR , Fox NC , Goate A , Day GS , Graff-Radford NR , Jucker M , Lee J-H , Levin J , Martins RN , Mori H , Perrin RJ , Salloway SP , Sanchez-Valle R , Schofield PR , Xiong C , Karch CM , Hassenstab JJ , McDade E , Bateman RJ , Ances BM , Alzheimer’s Biomarker Consortium-Down Syndrome and the Dominantly Inherited Alzheimer Network ((2022) ) Comparison of amyloid accumulation between Down syndrome and autosomal-dominant Alzheimer disease. Alzheimers Dement 18: , e064684. |
[48] | Strydom A , Hassiotis A , King M , Livingston G ((2009) ) The relationship of dementia prevalence in older adults with intellectual disability to age and severity of ID. Psychol Med 39: , 13–21. |
[49] | Mihaila I , Handen B , Christian BT , Lao P , Cody K , Klunk WE , Tudorascu D , Cohen AD , Okonkwo O , Hartley SL ((2019) ) Leisure activity, brain β-amyloid, and episodic memory in adults with Down syndrome. Dev Neurobiol 79: , 738–749. |
[50] | Piro-Gambetti B , Schworer E , Handen B , Glukhovskaya M , Hartley SL ((2023) ) Does employment protect against cognitive aging in Down syndrome? J Intellect Disabil doi: 10.1177/17446295231169379. |


