
Erratum to: Blood TDP-43 Combined with Demographics Information Predicts Dementia Occurrence in Community Non-Dementia Elderly
[Journal of Alzheimer’s Disease, 79(1) (2021), 301-309, 10.3233/JAD-201263]
https://content.iospress.com/articles/journal-of-alzheimers-disease/jad201263
In Table 3 on page 306 of the original version of this article, the fourth image was inadvertently duplicated as the fifth image. This issue is only related to Table 3, and the in-text results are correct.
The updated and corrected Table 3 has been placed in its entirety below.
Table 3
The prediction model of plasma TDP-43 combing with demographics is a good parameter to distinguish subjects (from NC/MCI to dementia) from subjects (non-dementia) through a single cross-sectional analysis at baseline
| Subjects (from NC/MCI to dementia, n = 18) vs. subjects (non-dementia, n = 68) | |||||
| Plasma TDP-43 level | Age | Education | Prediction model 1* | Prediction model 2* | |
| AUC | 0.576 | 0.712 | 0.659 | 0.756 | 0.836 |
| Specificity | 0.868 | 0.779 | 0.132 | 0.853 | 0.750 |
| Sensitivity | 0.333 | 0.611 | 0.556 | 0.611 | 0.833 |
| Cutoff value | 303.86 | 72.500 | 3.5 | –0.926 | –1.234 |
| p-value | 0.324 | 0.006 | 0.037 | 0.001 | <0.0001 |
| ROC curve | 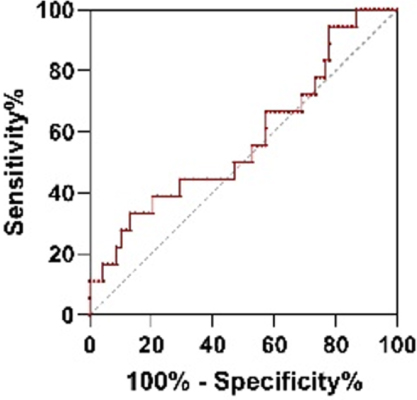 | 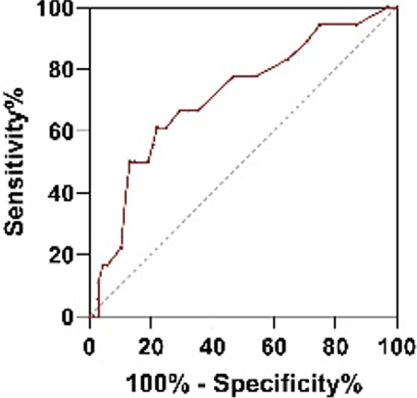 | 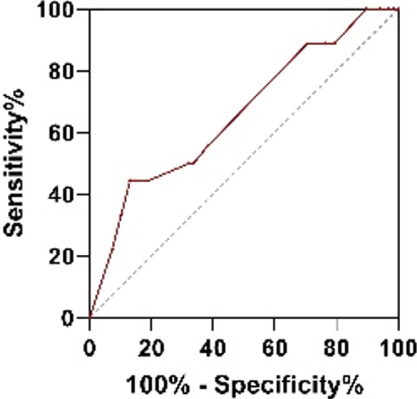 | 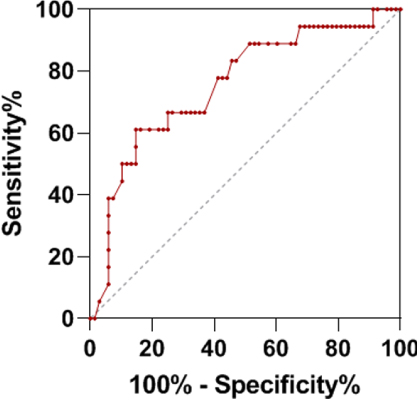 | 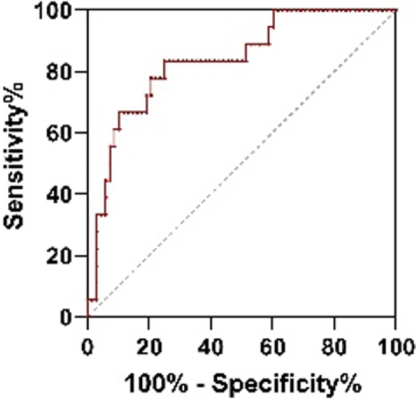 |
*prediction model 1=–8.394 + 0.074×age-0.115×education+1.403×diabetes *prediction model 2 : 15.378 + 0.102×age – 0.149×education+3.341×diabetes+0.006×plasma TDP-43 95% CI:95% confidence interval; AUC: area under the curves; ROC: receiver operation characteristic.


