
The Construction of a Multidomain Risk Model of Alzheimer’s Disease and Related Dementias
Abstract
Background:
Alzheimer’s disease (AD) and related dementia (ADRD) risk is affected by multiple dependent risk factors; however, there is no consensus about their relative impact in the development of these disorders.
Objective:
To rank the effects of potentially dependent risk factors and identify an optimal parsimonious set of measures for predicting AD/ADRD risk from a larger pool of potentially correlated predictors.
Methods:
We used diagnosis record, survey, and genetic data from the Health and Retirement Study to assess the relative predictive strength of AD/ADRD risk factors spanning several domains: comorbidities, demographics/socioeconomics, health-related behavior, genetics, and environmental exposure. A modified stepwise-AIC-best-subset blanket algorithm was then used to select an optimal set of predictors.
Results:
The final predictive model was reduced to 10 features for AD and 19 for ADRD; concordance statistics were about 0.85 for one-year and 0.70 for ten-year follow-up. Depression, arterial hypertension, traumatic brain injury, cerebrovascular diseases, and the APOE4 proxy SNP rs769449 had the strongest individual associations with AD/ADRD risk. AD/ADRD risk-related co-morbidities provide predictive power on par with key genetic vulnerabilities.
Conclusion:
Results confirm the consensus that circulatory diseases are the main comorbidities associated with AD/ADRD risk and show that clinical diagnosis records outperform comparable self-reported measures in predicting AD/ADRD risk. Model construction algorithms combined with modern data allows researchers to conserve power (especially in the study of disparities where disadvantaged groups are often grossly underrepresented) while accounting for a high proportion of AD/ADRD-risk-related population heterogeneity stemming from multiple domains.
INTRODUCTION
Alzheimer’s disease (AD) is a progressive neurodegenerative disorder, which accounts for approximately 80% of all dementia cases diagnosed in the U.S. with associated healthcare costs approaching $215 billion a year [1]. The importance of the assessment of risk-related and protective factors associated with AD and related dementias (ADRD) becomes increasingly important as the population of individuals at risk for AD/ADRD grows both in size (e.g., population growth) and exposure times (e.g., gains in longevity). However, existing literature on AD/ADRD risk provides a highly varied picture spanning a wide range of study design, structure of utilized data, and population focus [2]. Multiple studies investigated the role of cardiovascular disease [3, 4], cancer [5], and diabetes mellitus [6] in AD/ADRD risk [7, 8], but results often remained inconsistent, likely due to the differences in methodological approaches across the studies, different target populations, and a focus on identifying individual risk factors without determining the role of multiple co-existing factors [9, 10]. More recently, the 2020 Lancet Commission on dementia prevention, identified twelve potentially modifiable risk factors suggested to increase dementia risk [11] across three groups based on the critical age region for modifying each risk factor. These were: 1) early life (education), 2) midlife (hypertension, obesity, hearing loss, traumatic brain injury (TBI), and alcohol misuse), and 3) later life (smoking, depression, physical inactivity, social isolation, diabetes, and air pollution) [11]. This framework can be extended with further modifiable or non-modifiable (genetics) risk factors; but the original 12 features clearly demonstrate the complexity of the multifactorial process of AD/ADRD onset.
Increased scope and availability of high-power longitudinal studies of aging as well as individual-level administrative/health records from health and health insurance providers, makes the incorporation of the multiple aspects of AD/ADRD development into a single, sufficiently powered model, increasingly feasible, especially with the growing trend in the incorporation of data on genetics and other biomarkers. However, the construction of such complex models brings its own challenges. Among them are the multiple pathways of creating an indicator/measure of a risk-related characteristic, and the multiple dependencies between AD/ADRD risk factors, which reflect real-life disease processes, but are a significant challenge for risk models, many of which require independence between included features. In this study, we will use data from the Health and Retirement Study (HRS) to assess the impacts and relative ranks of known AD/ADRD risk factors spanning several domains: comorbidities, demographics/socioeconomics, health-related behavior, genetics, and environmental exposure. All twelve factors identified by the 2020 Lancet Commission on dementia prevention were represented by at least one measure and expanded with additional modifiable and non-modifiable risk factors. The HRS is a complex study linkable to administrative health insurance records from the Medicare health insurance program and genetic biomarkers [9, 12] and has the necessary scope and power for the construction and testing of such a model. This study offers an approach for the selection of an optimal set of AD/ADRD predictors, that recognizes that many of these predictors demonstrate mutual dependencies or can be represented through alternative data features. We estimate the strength of the associations between AD/ADRD and risk-related/protective factors (collectively “predictors”) in univariable analyses, identify optimal predictors of AD/ADRD risk, create a multivariable predictive model, and study its predictive power.
METHODS
Data
The Health and Retirement Study is an ongoing study that has been fielded every other year since 1992. It collects data on a battery of demographic, socioeconomic, behavioral, and health-related characteristics and is nationally representative of U.S. older adults age 50+ [13]. The HRS provides linkages to administrative claims data from the Medicare program for eligible individuals (most of the U.S. population becomes eligible at age 65), which contains information on medical services paid by either Medicare Part A (facility-based services), Medicare Part B (professional services), or Medicare Part D (prescription drugs), as well as supplementary demographic and enrollment information. A subset of the HRS population has been genotyped (∼2.5 M single nucleotide polymorphisms (SNPs) genotyped on Illumina HumanOmni2.5 chipset).
Zip-code level data on the daily and annual estimates of the concentration of fine particulate matter (PM2.5), ozone (O3), and nitrogen dioxide (NO2) over the 2000–2016 period from Socioeconomic Data and Applications Center (SEDAC) [14, 15] were used to create indicators of adverse environmental conditions, specifically exposure to air pollutants.
Sample
At the time of this study, the HRS contained data on 37,319 respondents age 50+. Of these, 15,620 were genotyped and 12,872 had polygenic risk scores officially produced by the HRS. Within this latter group 8,603 were enrolled in the Medicare program. For inclusion in this study, we required respondents to be genotyped and have Medicare fee-for-service Parts A and B coverage during the 2000–2015 period. Using Medicare enrollment files, we identified the first and last month/year during which an individual was enrolled in a traditional Medicare fee-for-service plan with both Parts A and B coverage. These two points in time served as the bounds over which an individual was followed. Individuals with significant gaps (≥50% of total follow-up time for an individual) in fee-for-service coverage (such as due to non-payment of Part B premiums or membership in a non-fee-for-service Medicare plan, e.g., Medicare Advantage) were dropped. Finally, we required that the age at the start of the follow-up period be between 65–80 and that there be no history of AD or ADRD diagnoses prior to this baseline age. After restrictions, the final sample included 8,094 individuals for the AD sample and 8,084 for ADRD.
Outcomes
The onset of AD (International Classification of Disease 9th Edition [ICD-9]: 331.0) and ADRD [16] (see also Supplementary Table 1) based on individual diagnoses from health insurance claims records were the primary outcomes of this study. Disease ascertainment algorithms described in other publications [17] were used to identify the presence of AD and ADRD as well all other co-morbidities. Briefly, we required the presence of two distinct claims with a diagnosis of AD/ADRD within 90 days of each other with the earliest date in the pair designated as the date of onset. Once the date of onset was identified, the individual was considered diagnosed during the entire follow-up period. Sensitivity analysis was conducted with algorithms utilizing confirmation periods >90 days and treating death within the confirmation period as a confirmatory record.
Medicare diagnosis records-based predictors
We included the following AD/ADRD risk-related morbidities/morbidity groups based on existing literature: 1) cardiovascular diseases including myocardial infarction, angina pectoris, congestive heart failure, valvular heart disease, rheumatic heart disease, arterial hypertension, systemic hypotension, and cardiac arrhythmias [18–20]; 2) cerebrovascular diseases including ischemic stroke, hemorrhagic stroke, and other cerebrovascular diseases [19, 21]; 3) chronic kidney disease [20, 22]; 4) chronic obstructive pulmonary disease (COPD) [23]; 5) diabetes mellitus [6]; 6) thyroid dysfunction [24]; 7) metabolic syndrome (obesity, dyslipidemia, hypertension, impaired insulin tolerance [6, 25, 26]); 8) obstructive sleep apnea [27, 28]; 9) depression [29]; and 10) TBI or head trauma [30]. To account for a possible link between liver function and metabolism of common medications (e.g., medications for cardiovascular diseases), which may contribute to the drug efficacy and adverse effects, we also evaluated liver diseases with hepatic failure. Finally, we included cancers because of evidence [31–34] that there may be a trade-off between cancer and AD risk. The dates of diagnoses of these diseases were identified from Medicare administrative claims records selected based on ICD-9 codes shown in Supplementary Table 1. Disease onset was identified using the same ascertainment algorithm as for AD/ADRD. Cardiovascular and cerebrovascular disease events such as myocardial infarction and stroke reflect pathological processes in circulatory system and likely contribute to the future risks of AD/ADRD through this mechanism, therefore these conditions were treated similarly to chronic diseases.
HRS survey-based predictors
The HRS survey was used to generate (See Supplementary Table 1 for complete list and variable definitions) indicators of: self-reported disease status; activities of daily living (ADL) and instrumental ADL (IADL) limitations; scores on Center for Epidemiologic Studies Depression Scale (CESD); hearing and vision problems; health behaviors (current smoking status, hard drinking, no physical activity, and body mass index (BMI)), socioeconomics (social isolation index, education level, and low income), and demographics. All survey-based predictors were time dependent with values being drawn from the most recent wave prior to any age during an individual’s follow-up.
Genetic predictors
Genetic predictors were treated as time-invariant and included through several alternative specifications. First, we included candidate SNPs that were shown to be associated with AD/ADRD risk (Table 1 of [35]). Second, we used polygenic risk scores (PRS) provided by the HRS (version 4). These were constructed using effect sizes from the IGAP study [36] and SNPs measured for HRS individuals. Four different PRS specifications were assessed: with/without inclusion of APOE-related genes/SNPs and with/without the deselection of SNPs not associated with AD in GWAS at the p = 0.01 threshold. Third, we replicated the methodology used to generate the official HRS PRS, to generate 12 alternative PRS hypothesized to better reflect the specific mechanisms of AD/ADRD development. These were based on gene/SNP sets associated with a pathway potentially contributing to a specific mechanism of AD/ADRD development and known as AD hallmarks. Specifically, markers of neuro-inflammation, mitochondrial dysfunction, synapse loss, de-myelination, and neuronal death, in addition to the extracellular amyloid-β plaques, and intracellular neurofibrillary tangles of hyperphosphorylated tau protein— the two primary hallmarks of AD— were included. SNP sets for these hallmarks were specified using: 1) results of GWAS of AD using the HRS and other AD/ADRD-related datasets [2]; 2) SNPs located in ∼280 AD-related genes available from NHGRI-EBI Catalog of published GWAS (https://www.ebi.ac.uk/gwas/); 3) AD-related genes selected from other recent publications [37–52]; and 4) gene sets representing pathways and processes that are thought to play role in AD and available from established online collections of the gene sets and pathways, such as MsigDB/GSEA, KEGG, REACTOME, BioCarta, GO, and others. We used available software for automated high-resolution computations of the polygenic risk scores for binary and quantitative traits (PRSice [53]). The list of specific genes to each PRS is shown in Supplementary Table 2. SNPs associated with APOE in dbSNP database were additionally unselected.
Table 1
AD/ADRD hazard ratios evaluated in univariable analyses for the total sample of older adults; male, female and Black strata; and with the predictors entering at a 1-, 3-, and 5- years of lag
| Predictors | Hazard Ratios | |||||||
| AD, Total (CI) | Male | Female | Black | Lag1 | Lag3 | Lag5 | ADRD, Total (CI) | |
| Myocardial infarction | 1.52 (1.19,1.94) | 1.57 | 1.51 | 0.95 | 1.46 | 1.51 | 1.31 | 1.74 (1.50,2.03) |
| Angina pectoris | 1.53 (1.17,1.99) | 1.63 | 1.47 | 1.02 | 1.42 | 1.40 | 1.41 | 1.64 (1.38,1.94) |
| Heart failure | 1.86 (1.47,2.35) | 1.94 | 1.80 | 1.36 | 1.67 | 1.68 | 1.47 | 2.48 (2.15,2.87) |
| Valvular heart disease | 1.57 (0.81,3.05) | 1.75 | 1.34 | n/a | 1.72 | 1.83 | 1.98 | 1.81 (1.21,2.72) |
| Rheumatic heart disease | 2.36 (1.65,3.38) | 1.60 | 2.96 | 3.30 | 2.29 | 2.59 | 2.82 | 2.24 (1.76,2.85) |
| Arterial hypertension | 2.72 (1.99,3.72) | 2.45 | 2.94 | 2.93 | 1.82 | 1.54 | 1.48 | 2.87 (2.35,3.51) |
| Cardiac arrhythmias | 1.61 (1.30,1.99) | 1.68 | 1.59 | 1.32 | 1.40 | 1.44 | 1.45 | 2.00 (1.75,2.29) |
| Ischemic stroke | 2.13 (1.71,2.65) | 1.98 | 2.27 | 1.74 | 1.75 | 1.77 | 1.48 | 2.87 (2.50,3.29) |
| Hemorrhagic stroke | 2.86 (1.67,4.89) | 1.16 | 4.76 | 8.04 | 2.20 | 2.59 | 2.87 | 4.06 (2.95,5.59) |
| Other cerebrovascular disease | 2.48 (1.93,3.18) | 2.30 | 2.66 | 2.70 | 1.92 | 1.94 | 1.87 | 3.79 (3.27,4.40) |
| Systemic hypotension | 2.03 (1.46,2.83) | 2.14 | 1.97 | 3.63 | 2.06 | 2.33 | 1.86 | 2.65 (2.17,3.24) |
| Chronic kidney disease | 1.53 (1.15,2.03) | 1.20 | 1.84 | 1.30 | 1.09 | 1.07 | 0.97 | 2.43 (2.07,2.86) |
| COPD | 1.54 (1.24,1.91) | 1.50 | 1.57 | 0.99 | 1.50 | 1.59 | 1.38 | 1.88 (1.65,2.16) |
| Diabetes mellitus | 1.67 (1.35,2.07) | 1.34 | 1.95 | 1.57 | 1.56 | 1.51 | 1.39 | 1.83 (1.60,2.09) |
| Thyroid dysfunction | 1.20 (0.96,1.50) | 1.35 | 1.14 | 0.90 | 1.14 | 1.02 | 1.07 | 1.45 (1.26,1.67) |
| Metabolic syndrome | 1.68 (0.54,5.22) | 1.23 | 2.09 | n/a | 1.87 | 2.52 | 1.19 | 0.89 (0.33,2.38) |
| Obstructive sleep apnea | 1.59 (1.02,2.47) | 1.49 | 1.78 | 0.60 | 1.43 | 1.26 | 1.73 | 2.11 (1.63,2.74) |
| Depression | 3.82 (3.09,4.71) | 3.70 | 3.94 | 2.93 | 2.67 | 2.67 | 2.28 | 3.55 (3.09,4.07) |
| Traumatic brain injury | 2.90 (1.92,4.36) | 3.78 | 2.55 | n/a | 2.34 | 2.07 | 1.64 | 3.26 (2.51,4.24) |
| Chronic liver disease | 1.92 (1.27,2.90) | 1.65 | 2.09 | 2.16 | 1.85 | 1.71 | 1.73 | 2.11 (1.62,2.74) |
| Solid malignant tumors | 1.12 (0.90,1.38) | 1.39 | 0.97 | 1.21 | 1.04 | 1.03 | 1.11 | 1.16 (1.01,1.33) |
| Nonsolid cancer | 1.10 (0.52,2.32) | 1.78 | 0.57 | n/a | 1.10 | 1.23 | 0.99 | 1.42 (0.92,2.19) |
| Cancer, unspecified | 1.08 (0.84,1.39) | 1.28 | 0.94 | 1.06 | 1.01 | 1.01 | 1.04 | 1.14 (0.97,1.34) |
| Heart diseases (SR) | 1.19 (0.96,1.46) | 1.13 | 1.26 | 1.39 | 1.16 | 1.15 | 1.15 | 1.22 (1.07,1.39) |
| Stroke (SR) | 1.52 (1.14,2.02) | 1.33 | 1.70 | 1.29 | 1.47 | 1.33 | 1.47 | 2.42 (2.06,2.84) |
| Lung diseases (SR) | 1.14 (0.84,1.55) | 0.69 | 1.50 | 1.43 | 1.20 | 1.31 | 1.55 | 1.24 (1.02,1.49) |
| Cancer (SR) | 0.85 (0.66,1.10) | 0.87 | 0.84 | 0.88 | 0.77 | 0.80 | 0.95 | 0.86 (0.73,1.01) |
| Diabetes (SR) | 1.15 (0.91,1.47) | 1.00 | 1.30 | 1.13 | 1.21 | 1.30 | 1.33 | 1.38 (1.19,1.60) |
| Arthritis (SR) | 0.85 (0.68,1.06) | 0.80 | 0.88 | 1.26 | 0.90 | 1.00 | 1.18 | 0.91 (0.79,1.05) |
| Depression (SR) | 1.64 (1.27,2.12) | 1.66 | 1.62 | 1.16 | 1.62 | 1.88 | 1.72 | 1.85 (1.58,2.17) |
| High Blood Pressure (SR) | 1.06 (0.85,1.31) | 1.02 | 1.07 | 0.89 | 0.97 | 1.02 | 1.15 | 1.08 (0.94,1.24) |
| Disability (ADL) | 1.51 (1.41,1.62) | 1.55 | 1.48 | 1.35 | 1.39 | 1.25 | 1.32 | 1.45 (1.38,1.53) |
| Instrumental ADL | 1.77 (1.66,1.88) | 1.79 | 1.75 | 1.54 | 1.61 | 1.42 | 1.44 | 1.63 (1.56,1.70) |
| CESD scale | 1.14 (1.09,1.20) | 1.17 | 1.12 | 1.10 | 1.10 | 1.14 | 1.15 | 1.17 (1.13,1.20) |
| Current smoking | 1.08 (0.69,1.68) | 1.16 | 1.00 | 1.74 | 1.08 | 0.98 | 0.75 | 1.39 (1.08,1.79) |
| Hard drinking | 1.63 (0.52,5.07) | 1.46 | 2.21 | n/a | 1.63 | 1.63 | 1.63 | 1.31 (0.59,2.92) |
| Body mass index | 0.96 (0.94,0.98) | 0.97 | 0.95 | 0.99 | 0.96 | 0.98 | 0.99 | 0.97 (0.95,0.98) |
| No physical activities | 1.92 (1.47,2.51) | 1.98 | 1.88 | 1.55 | 1.99 | 1.70 | 1.57 | 1.74 (1.48,2.06) |
| Hearing problems | 1.22 (0.98,1.51) | 1.04 | 1.42 | 1.03 | 1.14 | 1.37 | 1.33 | 1.25 (1.09,1.44) |
| Vision problems | 1.43 (1.15,1.79) | 1.26 | 1.56 | 1.03 | 1.35 | 1.18 | 1.43 | 1.62 (1.41,1.87) |
| Social isolation | 1.29 (1.01,1.64) | 1.09 | 1.42 | 1.10 | 1.23 | 0.88 | 1.40 | 1.44 (1.24,1.67) |
| Low income | 1.59 (1.29,1.96) | 1.43 | 1.72 | 1.39 | 1.36 | 1.47 | 1.31 | 1.84 (1.61,2.10) |
| Low education | 1.36 (1.08,1.73) | 1.14 | 1.53 | 1.04 | 1.36 | 1.36 | 1.36 | 1.35 (1.16,1.57) |
| Female | 1.06 (0.86,1.30) | . | . | 1.08 | 1.06 | 1.06 | 1.06 | 0.99 (0.87,1.13) |
| Black | 1.63 (1.23,2.16) | 1.62 | 1.63 | . | 1.63 | 1.63 | 1.63 | 1.65 (1.38,1.97) |
| PM 2.5 | 1.06 (1.01,1.11) | 1.12 | 1.02 | 1.14 | 1.06 | 1.06 | 1.06 | 1.06 (1.03,1.09) |
| Ozone | 1.01 (0.99,1.04) | 1.02 | 1.01 | 1.00 | 1.01 | 1.01 | 1.01 | 1.01 (0.99,1.02) |
| NO2 | 0.99 (0.98,1.01) | 1.01 | 0.99 | 1.00 | 0.99 | 0.99 | 0.99 | 1.00 (1.00,1.01) |
AD, Alzheimer’s disease; ADRD, Alzheimer’s disease and related dementia; HR, hazard ratio; CI, confidence interval; COPD, chronic obstructive pulmonary disease; SR, self-reported indicator; ADL, activities of daily living; CESD, Center for Epidemiologic Studies Depression Scale.
Measures of ambient air pollution
Adverse environmental exposures to PM2.5 (μg/m3), O3 (ppb), and NO2 (ppb) were derived from ensemble predictions of three machine-learning models that estimate daily concentrations at the centroids of 1 km×1 km grid cells across the U.S. over the 2000–2016 period. Model predictors included air monitoring data, satellite data, weather data, and chemical transport model simulations [14, 54, 55]. Zip code-level pollution concentrations were estimated by averaging the predictions of grid cells falling within zip code polygons or— for single-point zip codes— the value of the nearest grid cell. This data was then aggregated at the annual level and linked to the zip-code associated with each HRS individual for that year. The dataset includes approximately 31,000 zip codes with polygon representations and about 10,000 zip codes as single points.
Statistical analysis
The analysis included three steps. First, we investigated the associations of specific predictors with AD and ADRD risks in a series of univariable Cox models. Indicators at age α of a disease diagnosed at adiag was defined as p (a) = I (a > adiag), and the latest measurement before a current age was used for HRS survey variables. Since the effect of a specific time-dependent predictor can be delayed, models with lagged indicators p (a) = I (a > adiag + alag) of alag =1, 3, and 5 years were also estimated. All genetic indicators were used in these univariable analyses as time-independent predictors.
Second, we used multivariable models to identify the optimal combination of predictors with AD and ADRD risks. Predictors for the final multivariable models for AD and ADRD were selected applying the stepwise-AIC-best-subset blanket algorithm. Specifically, we first use stepwise selection to create a sequence of models from the null model (with no predictors) through the full model (with all predictors). Next, we identified the numbers of predictors, n, that correspond to the models with minimal Akaike and Bayesian information criteria (AIC and BIC) and identify the best models for each n. The best model is characterized by the set of n predictors with the best χ2-score test. Since BIC has a larger penalty term for additional parameters than the AIC, resulting in the BIC favoring more parsimonious models than the AIC [57], we started with the best model with the minimal BIC and considered models with sequentially higher n for as long as each added predictor remained significant. The resulting model was then tested to ensure stability across subpopulations, analyses with lag-periods, and alternative definitions for outcomes. In addition, mutual correlation between predictors was accounted for when selecting the initial set of predictors. This is especially important for selecting between claims-based and survey-based measures representing the same health condition as well as for genetic markers. In such cases, we used information criteria for separate models utilizing each of the alternative specifications in turn; this is equivalent to choosing an indicator with the better p-value from a model with both predictors included.
Third, the predictive powers of the multivariable models were evaluated using the concordance statistic and ROC curves. This statistic is a well-known c-index defined as the area under the ROC curve which is widely used in logistic regression models. The validation datasets were created at integer baseline ages, and all predictors were evaluated at the baseline and considered time independent. For survival models, ROC curves are time-sensitive, therefore we estimated statistics for different follow-up times time from one to 10 years. Two approaches for evaluation of the c-index introduced by Harrell et al. [58, 59] and Uno et al. [60] were used and compared. Standard error for the c-index was evaluated using bootstrapping with 100 resampling of the original sample.
RESULTS
The AD and ADRD analysis subsamples differed primarily by the size of the outcome group (375/8,094 for AD; 919/8,084 for ADRD). follow-up time (10.7 years for AD and 10.5 years for ADRD), and percent of individuals lost to mortality during follow-up. In all other aspects the samples were approximately identical (Supplementary Table 3). The age at baseline was 67.5 (4.0) for both samples. The sex makeup of the sample is consistent with that of the general population (57.4% female; 42.6% male for both samples). The race/ethnicity composition provides good statistical power for the White (84.1% for AD and 84.2% for ADRD) and Black (13.8% for AD and ADRD) American subgroups. Detailed summary statistics are presented in Supplementary Table 3.
Parameter estimates for non-genetic predictors used in the univariable Cox proportional hazard model are presented in Table 1 for AD and Supplementary Table 4 for ADRD. The results for ADRD for the entire sample are also shown in Table 1. Estimates are marked “n/a” for analyses with an insufficient number of cases in a specific subgroup. The patterns of the results are similar between AD and ADRD, though the magnitudes are significantly stronger for ADRD in several diagnosis-based disease indicators (heart failure, cardiac arrhythmias, ischemic stroke, other cerebrovascular diseases, and chronic kidney disease) and one self-reported disease indicator (stroke). The strongest associations with AD risk were detected for depression (Hazard Ratio [HR] = 3.9), hypertension (HR = 2.7), traumatic brain injury (HR = 2.9), and hemorrhagic stroke (HR = 2.9). These diseases were also among the strongest predictors for ADRD with HRs >2.8. Four additional strong predictors of ADRD were ischemic stroke (HR = 2.9), other cerebrovascular diseases (HR = 3.8), systemic hypotension (HR = 2.7), and heart failure (HR = 2.5).
For the majority of the predictors the associations with AD/ADRD were similar for both sexes, though for several predictors the magnitude was much stronger for females, e.g., hemorrhagic stroke (AD HR = 4.4 for females versus 1.2 for males) and arterial hypertension (HR = 2.9 versus 2.5). In contrast the association of traumatic brain injury was stronger for males (HR = 3.8 versus 2.6). The variability in estimates for the Black population was higher because of lower statistical power for this group; however, their patterns, represented by the rank of the associations, were similar to those observed in the entire sample, though several diseases demonstrated higher magnitude in the Black population: hemorrhagic stroke (HR = 8.0), systemic hypotension (HR = 3.6), and rheumatic heart disease (HR = 3.3). For almost all time-dependent predictors, magnitude declined as the lag period increased; however, this decline was small for most predictors. The HRs for models with a lag period of 1, 3, and 5 years were within the range of the confidence intervals of the estimates for the entire sample. A stable increase in the magnitude of the association with the length of the lag period was detected for valvular and rheumatic heart diseases.
The following associations were detected for non-disease-related predictors of AD/ADRD: 1) the number of instrumental ADLs, lack of physical activities, and Black race were the strongest predictors, 2) higher BMI was associated with reduced risk, 3) low income was a better predictor of AD/ADRD than low education or social isolation; 4) female sex was not significant, 5) vision and hearing problems demonstrated low predictive power, and 6) PM2.5 was the only significant predictor among the three measures of exposure to air pollutants. The results for non-disease predictors were very similar for AD and ADRD risk.
Table 2 and Supplementary Table 5 provide estimates for genetic predictors. These predictors are time-independent, so the estimates for lag-time models are identical to the main model and are not shown. The results show that associative effects of the HRS PRS are significant, with the strongest associations observed for the standard PRS calculated by HRS with the threshold p = 0.01. We also found the PRS constructed by us using the entire set of SNPs available in HRS data reproduces the estimate obtained for the respective HRS PRS. No significant associations were found among pathway-specific PRS from which 15 SNPs from the APOE region relevant to AD/ADRD were excluded. One minor exception was the pathway associated with inflammation for which the association at the level of significance was found. The SNPs rs769449 and rs2075650, in APOE and TOMM40 genes respectively, had the largest associations with AD/ADRD. Genetic associations with AD risk were much stronger than for ADRD.
Table 2
AD/ADRD hazard ratios evaluated in univariable analysis for genetic indicators of risk
| Genetic Risk Factors | Hazard Ratios | ||||
| (PRS for pathways*, PRS for all | AD total (HR with CI) | Male | Female | Black | ADRD, total (CI) |
| genotyped SNPs, and Individual SNPs*) | |||||
| PRS Amyl_React Pathway | 0.98 (0.89,1.08) | 0.97 | 0.99 | 1.09 | 0.96 (0.90,1.03) |
| PRS Apopt_PosReg_GO Pathway | 1.03 (0.93,1.14) | 0.99 | 1.05 | 1.19 | 0.98 (0.91,1.04) |
| PRS Apopt_NegReg_GO | 0.96 (0.87,1.06) | 0.78 | 1.09 | 0.94 | 1.00 (0.93,1.06) |
| PRS NDea_NegReg_GO Pathway | 0.95 (0.86,1.06) | 0.81 | 1.06 | 0.96 | 1.00 (0.94,1.07) |
| PRS Tau_Liter Pathway | 1.06 (0.96,1.17) | 1.01 | 1.10 | 1.12 | 1.06 (0.99,1.13) |
| PRS Reactome_Dopa Pathway | 1.04 (0.94,1.15) | 1.07 | 1.03 | 0.87 | 1.01 (0.95,1.08) |
| PRS Nsig_KEGG Pathway | 1.01 (0.91,1.12) | 0.96 | 1.05 | 1.03 | 0.99 (0.92,1.05) |
| PRS Reactome_Neuro_Receptor | 1.04 (0.94,1.15) | 1.09 | 1.01 | 0.95 | 0.98 (0.92,1.05) |
| PRS Mitoch Pathway | 1.00 (0.91,1.11) | 1.01 | 1.00 | 0.90 | 1.02 (0.95,1.08) |
| PRS BioMitoch Pathway | 1.03 (0.93,1.14) | 0.92 | 1.11 | 1.20 | 1.07 (1.00,1.14) |
| PRS Infl_Hallm Pathway | 1.12 (1.01,1.24) | 1.12 | 1.12 | 0.94 | 1.10 (1.03,1.17) |
| PRS Ninfl+ Pathway | 0.97 (0.88,1.07) | 0.92 | 1.00 | 1.00 | 0.98 (0.92,1.04) |
| PRS (HRS, v.4, no APOE) | 1.12 (1.01,1.23) | 1.04 | 1.18 | 0.83 | 1.05 (0.98,1.12) |
| PRS (HRS, 0.01 v.4, no APOE) | 1.22 (1.10,1.35) | 1.15 | 1.27 | 0.87 | 1.10 (1.03,1.17) |
| PRS (HRS, v.4, with APOE) | 1.14 (1.04,1.26) | 1.06 | 1.20 | 0.83 | 1.06 (1.00,1.13) |
| PRS (HRS, 0.01 v.4, with APOE) | 1.35 (1.22,1.50) | 1.29 | 1.40 | 0.90 | 1.17 (1.10,1.25) |
| rs12539172 | 0.85 (0.73,1.00) | 0.92 | 0.81 | 0.90 | 0.88 (0.80,0.98) |
| rs3851179 | 0.85 (0.73,1.00) | 0.84 | 0.87 | 0.69 | 0.97 (0.88,1.07) |
| rs405509 (APOE) | 1.22 (1.06,1.40) | 1.13 | 1.28 | 1.85 | 1.12 (1.03,1.23) |
| rs769449 (APOE) | 2.31 (1.92,2.77) | 2.49 | 2.21 | 3.21 | 1.73 (1.52,1.96) |
| rs2075650 (TOMM40) | 1.83 (1.53,2.18) | 2.11 | 1.67 | 1.02 | 1.57 (1.39,1.76) |
| rs8106922 (TOMM40) | 0.76 (0.65,0.89) | 0.73 | 0.79 | 1.01 | 0.84 (0.77,0.93) |
| rs6859 (NECTIN2) | 1.28 (1.11,1.48) | 1.11 | 1.40 | 1.14 | 1.20 (1.10,1.32) |
| rs157580 (TOMM40) | 0.73 (0.63,0.85) | 0.75 | 0.72 | 0.90 | 0.81 (0.73,0.89) |
| rs4311 | 0.88 (0.77,1.02) | 0.89 | 0.88 | 0.75 | 0.92 (0.84,1.01) |
*Sets of genes included in these pathways are provided in Supplementary Table 2. **SNPs with insignificant effects were not shown. AD, Alzheimer’s disease; ADRD, Alzheimer’s disease and related dementia; HR, hazard ratio; CI, confidence interval; PRS, Polygenic risk score.
Sets of predictors for multivariable models of the risks of AD and ADRD were identified using the procedure described in Methods Section. The final models contained 10 predictors for AD and 19 for ADRD (Table 3). In the final models, time-dependent diagnosis-based measures of co-morbidity was the most powerful group of predictors. Comorbidity self-reports performed poorly and were not selected for the model due to the higher predictive power of diagnosis-based comorbidities. Genetic factors that were incorporated in the final model included rs769449 SNP in intron of APOE gene (this SNP is also a proxy for APOE4 in Whites [61]) and the standard HRS PRS that was constructed with the threshold p < 0.01 and for which APOE-related SNPs were not selected for the final set for multivariable modeling. This was expected because of the results of univariable analyses. Five diseases were identified as the primary predictors of AD: depression (HR = 2.5), arterial hypertension (HR = 2.1), TBI (HR = 1.6), rheumatic heart disease (HR = 1.6), and stroke (HR = 1.5). Three self-reported predictors (Black race, number of IADLs, BMI) were also retained. These chosen variables have similar HR as in univariable analyses. The model for ADRD contains additional 5 risk-related diseases (heart failure, systemic hypotension, chronic kidney disease, diabetes mellitus, and chronic liver disease). Three variables representing stoke (i.e., ischemic stroke, hemorrhagic stroke, and other cerebrovascular diseases) were identified by the variable selection algorithm in contrast to the case of AD when only one variable for stroke (i.e., any type) was identified as a predictor for multivariable modeling. The association with female sex was protective and significant for ADRD. Genetic variants were stronger predictors of AD than ADRD but rs769449 in the APOE region is still significant for ADRD. PM2.5 was selected as a significant predictor for ADRD model. Depression was the main AD predictor for females, traumatic brain injury––for males, and arterial hypertension––for Black population. These predictors and hemorrhagic stroke were strongest predictors of ADRD among these strata.
Table 3
AD and ADRD hazard ratios evaluated in multivariable analyses for i) the overall population of older adults (All) with 95% confidence intervals (Lo.CI, Up.CI), sex-specific subpopulations (Male, Female), Black population, and for models with 1, 3, and 5 years of lag (Lag1, Lag3, and Lag5)
| Hazard Ratios | |||||||
| Predictors | AD or ADRD HR (CI) | Male | Female | Black | Lag1 | Lag3 | Lag5 |
| AD | |||||||
| Rheumatic heart disease | 1.55 (1.07,2.24) | 1.27 | 1.76 | 2.17 | 1.79 | 2.08 | 2.40 |
| Arterial hypertension | 2.09 (1.51,2.89) | 2.21 | 2.08 | 2.43 | 1.56 | 1.30 | 1.29 |
| Stroke | 1.50 (1.20,1.87) | 1.13 | 1.75 | 1.27 | 1.25 | 1.47 | 1.30 |
| Depression | 2.50 (2.01,3.13) | 2.37 | 2.63 | 1.98 | 2.05 | 2.31 | 2.01 |
| Traumatic brain injury | 1.63 (1.07,2.48) | 2.40 | 1.35 | n/a | 1.56 | 1.56 | 1.35 |
| Black | 1.72 (1.28,2.31) | 1.81 | 1.71 | . | 1.83 | 1.97 | 1.95 |
| Disability (IADL) | 1.56 (1.46,1.66) | 1.64 | 1.52 | 1.46 | 1.45 | 1.27 | 1.31 |
| Body mass index | 0.96 (0.94,0.98) | 0.97 | 0.95 | 0.98 | 0.96 | 0.98 | 0.99 |
| PRS (HRS, 0.01 v.4, with APOE) | 1.17 (1.06,1.29) | 1.13 | 1.22 | 0.85 | 1.18 | 1.19 | 1.19 |
| rs769449 (proxy for APOE4) | 2.34 (1.94,2.83) | 2.63 | 2.19 | 2.43 | 2.39 | 2.47 | 2.49 |
| ADRD | |||||||
| Rheumatic heart disease | 1.30 (1.01,1.67) | 0.95 | 1.47 | 1.22 | 1.33 | 1.70 | 1.84 |
| Heart failure | 1.25 (1.06,1.47) | 1.36 | 1.12 | 1.42 | 1.37 | 1.38 | 1.40 |
| Arterial hypertension | 1.80 (1.45,2.23) | 1.74 | 1.90 | 3.92 | 1.40 | 1.27 | 1.23 |
| Ischemic stroke | 1.64 (1.39,1.92) | 1.39 | 1.79 | 1.76 | 1.43 | 1.35 | 1.23 |
| Hemorrhagic stroke | 1.47 (1.00,2.16) | 0.69 | 2.15 | 7.83 | 1.20 | 1.74 | 2.37 |
| Other cerebrovascular diseases | 1.66 (1.39,1.98) | 1.56 | 1.78 | 1.78 | 1.52 | 1.52 | 1.71 |
| Systemic hypotension | 1.25 (1.01,1.54) | 1.47 | 1.03 | 1.43 | 1.12 | 1.11 | 1.03 |
| Chronic kidney disease | 1.26 (1.06,1.51) | 1.13 | 1.34 | 0.95 | 0.96 | 0.94 | 0.72 |
| Diabetes mellitus | 1.26 (1.09,1.46) | 1.24 | 1.28 | 0.92 | 1.34 | 1.33 | 1.36 |
| Depression | 2.44 (2.11,2.83) | 3.24 | 2.13 | 2.30 | 1.77 | 1.82 | 1.83 |
| Traumatic brain injury | 1.77 (1.29,2.41) | 3.24 | 1.37 | 0.89 | 1.76 | 1.49 | 1.19 |
| Chronic liver disease | 1.43 (1.10,1.87) | 1.22 | 1.67 | 1.33 | 1.53 | 1.53 | 1.76 |
| Female | 0.80 (0.70,0.92) | . | . | 0.97 | 0.86 | 0.90 | 0.93 |
| Black | 1.40 (1.15,1.70) | 1.15 | 1.56 | . | 1.45 | 1.54 | 1.60 |
| Disability | 1.35(1.28,1.42) | 1.47 | 1.31 | 1.20 | 1.36 | 1.22 | 1.16 |
| Body mass index | 0.95(0.94,0.97) | 0.96 | 0.94 | 0.98 | 0.96 | 0.97 | 0.98 |
| Low income | 1.43(1.24,1.65) | 1.31 | 1.56 | 1.39 | 1.28 | 1.26 | 1.20 |
| rs769449 (proxy for APOE4) | 1.86(1.63,2.12) | 1.70 | 1.92 | 1.66 | 1.81 | 1.84 | 1.86 |
| PM 2.5 | 1.04(1.01,1.07) | 1.10 | 1.00 | 1.06 | 1.04 | 1.05 | 1.05 |
AD, Alzheimer’s disease; ADRD, Alzheimer’s disease and related dementia; HR, hazard ratio; CI, confidence interval; IADL, instrumental activities of daily living.
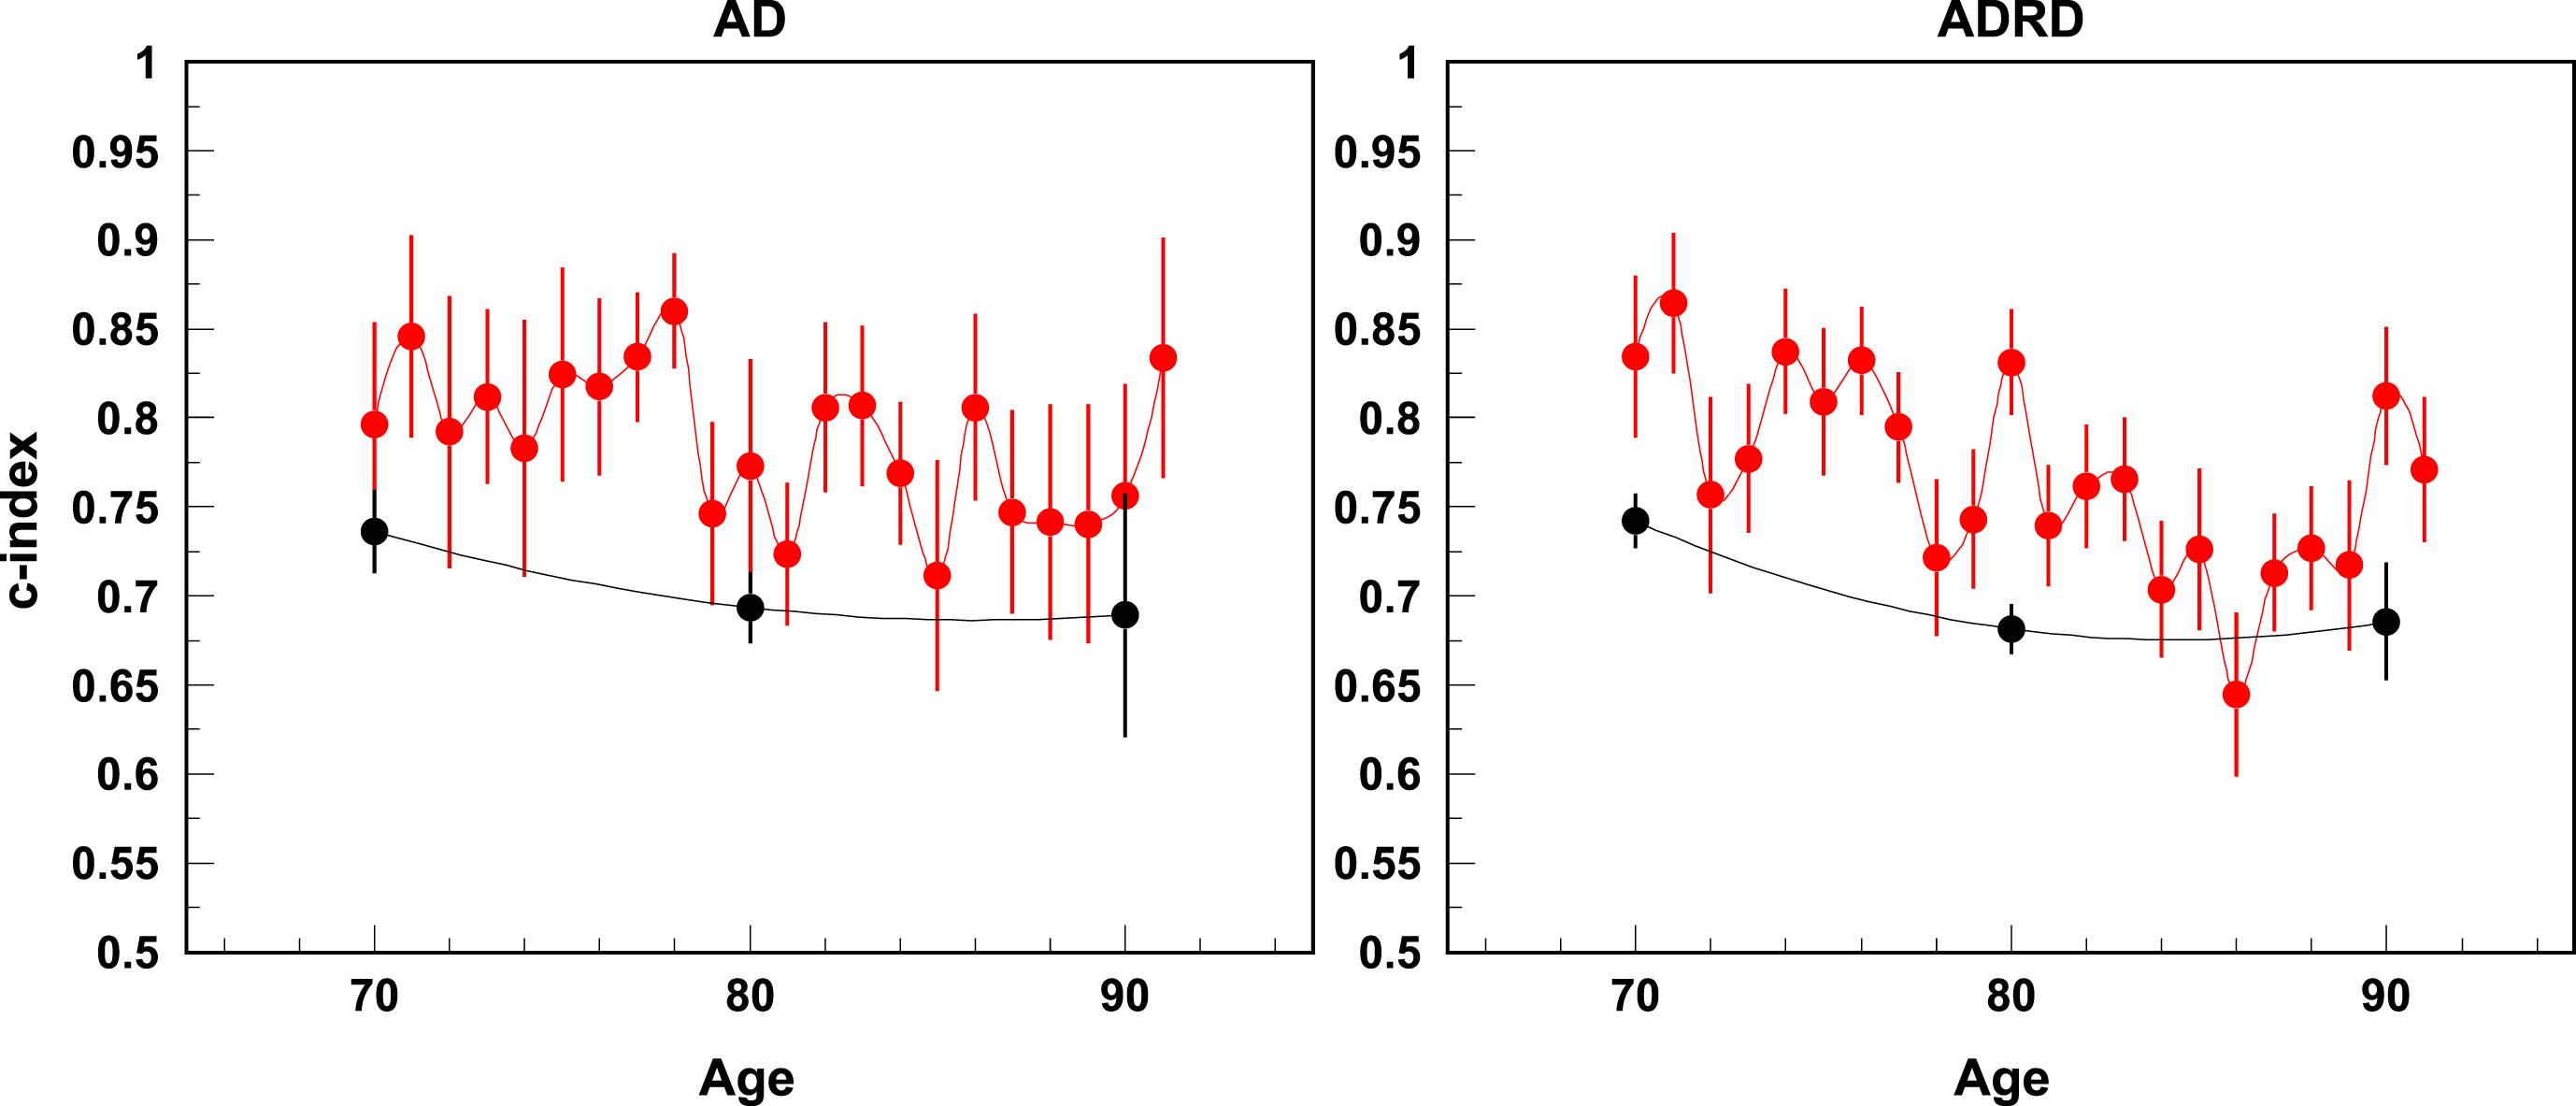
The predictive power of the multivariable models was evaluated using the concordance statistic (c-index). For a survival model, ROC curves are time-sensitive, i.e., we can have different ROC curves at different time points of survival, we compared follow-up times of one-, three-, five-, and ten-years. The estimates of the concordance (c-index) statistics for one- and ten-year follow-up are shown in Fig. 1. The results of sensitivity analysis using alternative algorithms for ascertainment of AD/ADRD onset are shown in Supplementary Figures 1 and 2. The quality for one-year predictions is high. For one year of follow-up the c-index can reach 0.85; this number falls to about 0.70 for ten-year forecasts. A minor decline in the c-index with higher ages at the start of the follow-up period was detected. The concordance statistics are similar for AD and ADRD.
Fig. 1
C-index for AD and ADRD risk for one year (red) and ten years of follow-up (black).
DISCUSSION
The main objective of this study was to identify a minimal subset of AD/ADRD-related risk and protective factors (out of larger set of possibly correlated factors) that collectively influence these health outcomes. Four sources of information were linked together to produce a single study sample: 1) the presence of diseases based on diagnosis records from the Medicare program; 2) self-reported diseases and non-disease health measures, health-related behaviors, functional status, and socioeconomic status; 3) genetic markers including polygenic risk scores and known-to-date genetic risk factors for AD/ADRD, and 4) zip-code based measures of environmental exposure. The associations of predictors with AD/ADRD risks were evaluated in univariable analyses, and then the optimal set of predictors for multivariable models of AD/ADRD risk was selected using formal statistical criteria, ensuring the replicability of the process in future applications.
The constructed multivariable models of AD/ADRD risk improve our knowledge of how the risk factors present at ages 65+ predict the risks of AD/ADRD. The current status quo for the role of preventable risk factors of AD/ADRD was described by the 2020 Lancet Commission on dementia prevention [11] and summarized in the 2023 Alzheimer’s disease facts and figures [62]. In a life-course model, it has been estimated that modifying these factors can prevent or delay up to 40% of dementias by delaying the onset of cognitive impairment and dementia and improving the quality of life of patients with dementia and their caregivers [11]. Available information comes from different studies for varying subpopulations; therefore, we considered the extended list of disease-related predictors together with other factors in the same study. Such design allowed us to evaluate the rank of multiple risk factors in their ability to predict the risk of AD/ADRD and compare power of alternative data sources, e.g., health records and self-reports.
Methodologically, the paper is focused on the analyses of the effects of risk/protective factors that impact AD/ADRD risk focusing on identification of the multivariable model of the risk in AD/ADRD in which the most powerful factors from available sources of information are selected. We found that the effects of diagnosis record-based morbidity indicators were stronger than those based on self-reports, though they shared general effect patterns. A possible reason could be the ability to tailor a claims ascertainment algorithm (e.g., sets of ICD-9/10 codes utilized; type of medical encounter(s) assessed; diagnosis verification method etc.) to the exact disease being studied not present in self-reported data; shorter times between updates in an electronic health database vs. a survey cohort; and lack of recall-related errors. Both self-report and administrative data have well known methodological limitations [63, 64], and the accuracy of the resulting epidemiological estimates involve uncertainties which can further vary from disease to disease.
Three high-prevalent factors (hypertension, depression, and rs769449, proxy SNP for APOE4) had the highest effect on the risk of AD, this suggests central role of these factors in AD etiology. They may represent different pathways contributing to heterogeneity of AD or be connected through a common AD mechanism. For instance, all three factors may compromise blood–brain barrier integrity and increase chances of damaging factors (such as infection and air pollution) to reach the brain and trigger neuroinflammation in turn contributing to neurodegeneration. Current evidence supports the role of disruption of the blood–brain barrier as a common mediator of hypertension and depression-induced cognitive impairment, and APOE4 detrimental effects on the brain [65–70]. This study also replicated protective effects on AD of rs157580 (G) and rs8106922 (G), SNPs in TOMM40 gene, that were previously reported by us in LOADFS and CHS data [61]. This suggests a possibility that simultaneous presence of these protective variants with APOE4, or its proxies, in an individual, might offset some or all negative effect of APOE4 on AD, which deserves further investigation.
Our results confirm the overall consensus that circulatory diseases are the main comorbidities contributing to AD/ADRD risk [71]: more than half of the diseases selected for the final model of AD/ADRD risk (3 of 5 for AD and 7 of 12 for ADRD) were cardio- or cerebrovascular diseases. Positive associations between the presence of disease and higher risk of AD/ADRD observed in our study also have been reported in other studies for heart [18–20] and cerebrovascular diseases [19].. In our study, the effects of hemorrhagic stroke is much higher than the effect of ischemic stroke that is in agreement with earlier studies [21]. Cerebral microhemorrhage has been shown to be associated with Aβ deposition [72], with shared genetic mechanisms for both hemorrhagic stroke and dementia [73]. Neuropathological studies have suggested specific mechanisms (e.g., cerebrovascular lesions, atherosclerosis, and neurodegenerative changes) that often coexist with a clinical manifestation of dementia [74, 75]. These mechanisms generate a link between cardiovascular health and AD [76] through onset of diseases such as heart failure, coronary artery disease, atrial fibrillation, and vasculopathy. A cardiovascular health score based on clustering of behavior- and biological-related measures associated with the increased risk of cardiovascular diseases was constructed using data from Whitehall II cohort study. This score was associated with a risk of dementia [77], though individual risk factors in this sample can give insignificant associations when controlling for other individual risk factors [78].
Depression and TBI were selected for both AD and ADRD. Observed associations with higher risk of AD among patients with depression have been also reported in other studies [11, 29] with potential contribution of anti-depressant therapy to increased AD risk, shared genetic characteristics, and recognizing depression as one of the early symptoms of AD/ADRD. TBI also appeared in the list of 12 risk factors [11]. In that study TBI explained 3% of variance in AD risk and was set in the group of midlife predictors. TBI is usually caused by car, motorcycle, and bicycle injuries; military exposures; boxing, horse riding, and other recreational sports; firearms; and falls, [79], i.e., events with reasonable prevalence in midlife period. In our study TBI is measured by the presence of the condition in individuals independently when it occurred, however, the event should be sufficiently serious to make an individual have doctor visits with the respective ICD-9 code. There were no essential differences in the effects calculated with other lag periods, that emphasize the chronic nature of the measure of TBI we use. In our study the effect of TBI was much higher for males, potentially due to more severe or more frequent injuries in the male populations.
Other diseases selected for the model of ADRD risk were type 2 diabetes, chronic kidney and chronic liver diseases. Hazard ratios of diabetes on AD/ADRD type 2 diabetes mellitus [6, 18, 26] in other studies were similar to that observed in our study. Diabetes is one of 12 risk factors identified in recent study with only 1% of population attributable fraction [11]. The effects of any particular medication on the risk of AD/ADRD remains unclear, and intensive diabetic control does not seem to decrease the risk of dementia [11]. A possible mechanism of the effect of chronic liver disease could be related with hepatic failure resulting in insufficient detoxication of toxic metabolites including medications. Although cancer-related predictors were not selected for the final model (protective effect of non-specified cancer with p-value ≈0.06 was the most significant not included in the model for ADRD risk), there is some evidence on protective effects of cancer diagnosis on the risk of AD/ADRD. In literature evidence on the risk of dementia and AD among cancer patients varies, e.g., recent study demonstrated higher risk [80], though less recent studies resulted in lowed risks of AD/ADRD [81] or in insignificant estimates [32, 82]. Also, studies demonstrated the role of cancer treatment in the subsequent risk of AD/ADRD [83–85].
Polygenic risk scores associated with specific pathways did not demonstrate strong effects in univariable analyses and were not selected into the final model. Most significant effect came from pathway associated with inflammation, represented by the Hallmark Inflammatory Response set composed of 200 genes and available from MSigDB [86] (Table 2, Supplementary Table 1). Effect size of PRS for this pathway was similar to that for the PRS made of all genotyped SNPs (minus APOE) in HRS data. We note that AD-related SNPs in APOE region on chr 19 were excluded from the definition of PRS. The final model included the standard HRS PRS that was created with the p-value threshold 0.01 and without any exclusion of specific SNPs. Specific SNPs that demonstrated effects in different studies were significant in univariable analyses in our study; however, only SNP rs769449 (proxy for APOE4) remained in the final model. This means that APOE-related genetic effects are detectable in our analyses in the multivariable models for AD/ADRD risks. Other SNPs, detected in different studies [35, 87], may work indirectly, through their effects on different risk factors presented in the final multivariable model.
The effect of IADL was strongest among non-disease predictors. The effect largely comes from two components that are partly symptoms of ADRD: inability to manage money and use the telephone. The effect of higher BMI as a continuous predictor is protective in all models. Its effect is more significant than binarized effects of obesity (BMI⩾30) or underweight (BMI⩽18). Physical activity had a strong protective effect in univariable analysis but was not selected in the final multivariable model likely because of its correlation with other more specific factors representing the current health status of an individual. Generally our results confirm the effects identified by the 2020 Lancet Commission on dementia prevention [11], though other strong predictors were also identified. Thus, the effects of higher income and higher number of education years are protective; low income retained in the final model for ADRD. The social isolation index and hearing/vision issues were significant in univariable analyses but not selected in the final model. With the exception of rheumatic heart disease, the incorporation of lag effects into the model generally decreases the effects. Comparison for the effects in sex-specific subpopulations show, that although women have higher AD prevalence and suffer greater symptoms, there is no consensus on whether this difference extends to incidence and/or mortality once the effects of other predictors have been controlled for [88–92]. The significant effects of PM2.5 on AD/ADRD risk is in agreement with findings of prior studies [93–95]; however, the fact that the effect remains significant in multivariable setting is among new results of our study.
Identification of predictors responsible for the increase or decrease the risks of AD/ADRD allows us to better understand the underlying mechanisms of AD/ADRD development, and also help further improve forecasting models of AD/ADRD-related outcomes. Modern health forecasting of AD/ADRD has been approached from a number of directions ranging from simple prevalence projections based on current prevalence trends and U.S. Census population forecasts [16, 96–100]; to projections based on assumptions on future population dynamics of AD/ADRD outcomes [101] and multistate modeling of healthy and unhealthy states [102, 103]. These forecasts, however, do not involve broad information on risk factor effects. The forecasted prevalence of dementia attributable to risk factors were recently assessed using methods involving methods of population attributable fractions [11, 104]. Models with limited incorporation of morbidity patterns appeared recently [105, 106] but further incorporation of highly predictive factors into the model can essentially decrease the overall uncertainty of the resulting projections and a reduction of the practical applicability of the results.
We acknowledge several study limitations. The HRS provides a sample representative of older U.S. adults; however, its statistical power is still not sufficient for the analysis of some ethnic subgroups in a model involving rare outcomes/measures. Self-reported data is relatively easy to collect, however there are concerns about their accuracy [107, 108]. Administrative claims data does not share the above limitations and has been validated for the study of many diseases [109–112]. However, an insurance claim is at best a proxy for the presence of a disease though in most cases this is a valid proxy a number of serious limitations exist. Differences in the utilization of healthcare services as well as race/ethnicity-specific coding patterns can lead to variation in the frequency of ICD diagnosis between race/ethnicity-specific groups. However, such data allows for more granular identification of disease onset while surveys are limited by the time periods inherent to their design (2 years in the HRS).
Our study confirmed that AD/ADRD risk is multifactorial in nature and that its variation is tied to multiple demographic, socioeconomic, and health-related risk factors. The size and detail of data available for research grows yearly. In many cases, this can lead to multiple measures of the same underlying construct to be available. Consequently, the identification of measures with relatively higher predictive power, and minimization of errors due to mutual correlation becomes an increasingly important question. We identified and ranked the association strengths of multiple possibly correlated risk/protective factors from multiple domains. We found that diagnosis-based disease indicators were superior in terms of predictive power of AD/ADRD risk than their self-reported counterparts. Depression and arterial hypertension were the largest contributors to AD risk; comparable to the additional risk associated with adverse APOE4 profiles. The effect of PRS on AD was significant for genes involved in the inflammatory pathway, which is in line with current views on potentially major roles of inflammation and infections in AD. Significant SNPs in the APOE region included both risk and protective factors, which warrants further investigation of the interactions between these SNPs, which might offset the negative role of APOE4 in AD risk.
ACKNOWLEDGMENTS
The Health and Retirement Study (HRS) data is sponsored by the National Institute on Aging (grant number U01-AG009740) and is conducted by the University of Michigan.
FUNDING
This study was supported by the National Institute on Aging (R01-AG066133, RF1-AG046860, R01-AG057801, R01AG076019, R01AG062623) and the Department of Defense (W81XWH-20-1-0253). The sponsors had no role in the design and conduct of this study.
CONFLICT OF INTEREST
The authors have no conflict of interest to report.
DATA AVAILABILITY
Restrictions apply to the availability of the data. The data used for the analyses is considered identifiable protected research data and access to it is regulated by HIPAA and CMS. Researchers wishing to obtain access to the data must have appropriate professional qualifications to conduct human subjects research, seek approval from IRB and CMS. Researchers wishing to reproduce our research, in whole or in part, will be able to contact the Principal Investigator of the project, Dr. Igor Akushevich, for possible access to the raw materials and the detailed archives of the programs used to prepare the data and perform the analysis.
SUPPLEMENTARY MATERIAL
[1] The supplementary material is available in the electronic version of this article: https://dx.doi.org/10.3233/JAD-221292.
REFERENCES
[1] | Hurd MD , Martorell P , Delavande A , Mullen KJ , Langa KM ((2013) ) Monetary costs of dementia in the United States. N Engl J Med 368: , 1326–1334. |
[2] | Yashin AI , Arbeev KG , Wu D , Arbeeva LS , Bagley O , Stallard E , Kulminski AM , Akushevich I , Fang F , Wojczynski MK , Christensen K , Newman AB , Boudreau RM , Province MA , Thielke S , Perls TT , An P , Elo I , Ukraintseva SV ((2018) ) Genetics of human longevity from incomplete data: New findings from the long life family study. J Gerontol A Biol Sci Med Sci 73: , 1472–1481. |
[3] | de la Torre JC ((2004) ) Is Alzheimer’s disease a neurodegenerative or a vascular disorder? Data, dogma, and dialectics. Lancet Neurol 3: , 184–190. |
[4] | Bunch TJ , Crandall BG , Weiss JP , May HT , Bair TL , Osborn JS , Anderson JL , Muhlestein JB , Horne BD , Lappe DL , Day JD ((2011) ) Patients treated with catheter ablation for atrial fibrillation have long-term rates of death, stroke, and dementia similar to patients without atrial fibrillation. J Cardiovasc Electrophysiol 22: , 839–845. |
[5] | Driver JA , Beiser A , Au R , Kreger BE , Splansky GL , Kurth T , Kiel DP , Lu KP , Seshadri S , Wolf PA ((2012) ) Inverse association between cancer and Alzheimer’s disease: Results from the Framingham Heart Study. BMJ 344: , e1442. |
[6] | Daviglus ML , Plassman BL , Pirzada A , Bell CC , Bowen PE , Burke JR , Connolly ES , Dunbar-Jacob JM , Granieri EC , McGarry K ((2011) ) Risk factors and preventive interventions for Alzheimer disease: State of the science. Arch Neurol 68: , 1185–1190. |
[7] | Vagelatos NT , Eslick GD ((2013) ) Type 2 diabetes as a risk factor for Alzheimer’s disease: The confounders, interactions, and neuropathology associated with this relationship. Epidemiol Rev 35: , 152–160. |
[8] | Norton S , Matthews FE , Barnes DE , Yaffe K , Brayne C ((2014) ) Potential for primary prevention of Alzheimer’s disease: An analysis of population-based data. Lancet Neurol 13: , 788–794. |
[9] | Launer LJ , Andersen K , Dewey ME , Letenneur L , Ott A , Amaducci LA , Brayne C , Copeland JR , Dartigues JF , Kragh-Sorensen P , Lobo A , Martinez-Lage JM , Stijnen T , Hofman A ((1999) ) Rates and risk factors for dementia and Alzheimer’s disease: Results from EURODEM pooled analyses. EURODEM Incidence Research Group and Work Groups. European Studies of Dementia. Neurology 52: , 78–84. |
[10] | Rollo J , Knight S , May HT , Anderson JL , Muhlestein JB , Bunch TJ , Carlquist J ((2015) ) Incidence of dementia in relation to genetic variants at PITX2, ZFHX3, and ApoE epsilon4 in atrial fibrillation patients. Pacing Clin Electrophysiol 38: , 171–177. |
[11] | Livingston G , Huntley J , Sommerlad A , Ames D , Ballard C , Banerjee S , Brayne C , Burns A , Cohen-Mansfield J , Cooper C ((2020) ) Dementia prevention, intervention, and care: 2020 report of the Lancet Commission. Lancet 396: , 413–446. |
[12] | Rocca WA , Petersen RC , Knopman DS , Hebert LE , Evans DA , Hall KS , Gao S , Unverzagt FW , Langa KM , Larson EB ((2011) ) Trends in the incidence and prevalence of Alzheimer’s disease, dementia, and cognitive impairment in the United States. Alzheimers Dement 7: , 80–93. |
[13] | Sonnega A , Weir D ((2014) ) The Health and Retirement Study: A public data resource for research on aging. Open Health Data 2: , e7. |
[14] | Di Q , Amini H , Shi L , Kloog I , Silvern R , Kelly J , Sabath MB , Choirat C , Koutrakis P , Lyapustin A ((2019) ) An ensemble-based model of PM2. 5 concentration across the contiguous United States with high spatiotemporal resolution. Environ Int 130: , 104909. |
[15] | Di Q , Wei Y , Shtein A , Hultquist C , Xing X , Amini H , Shi L , Kloog I , Silvern R , Kelly J 2021 Dailyand annual PM2. 5 concentrations for the contiguous United States, 1-km grids, v1 (2000–2016). NASA Socioeconomic Data and Applications Center (SEDAC),Palisades, NY. |
[16] | Matthews KA , Xu W , Gaglioti AH , Holt JB , Croft JB , Mack D , McGuire LC ((2019) ) Racial and ethnic estimates of Alzheimer’s disease and related dementias in the United States (2015–2060) in adults aged ≥65 years. Alzheimers Dement 15: , 17–24. |
[17] | Akushevich I , Kravchenko J , Ukraintseva S , Arbeev K , Yashin AI ((2012) ) Age patterns of incidence of geriatric disease in the US elderly population: Medicare-based analysis. J Am Geriatr Soc 60: , 323–327. |
[18] | Luchsinger J , Reitz C , Honig LS , Tang MX , Shea S , Mayeux R ((2005) ) Aggregation of vascular risk factors and risk of incident Alzheimer disease. Neurology 65: , 545–551. |
[19] | de la Torre JC ((2006) ) How do heart disease and stroke become risk factors for Alzheimer’s disease? . Neurol Res 28: , 637–644. |
[20] | Murray A , Tupper D , Knopman D , Gilbertson D , Pederson S , Li S , Smith G , Hochhalter A , Collins A , Kane R ((2006) ) Cognitive impairment in hemodialysis patients is common. Neurology 67: , 216–223. |
[21] | Corraini P , Henderson VW , Ording AG , Pedersen L , Horváth-Puhó E , Sørensen HT ((2017) ) Long-term risk of dementia among survivors of ischemic or hemorrhagic stroke. Stroke 48: , 180–186. |
[22] | Tsai CF , Wang SJ , Fuh JL ((2010) ) Moderate chronic kidney disease is associated with reduced cognitive performance in midlife women. Kidney Int 78: , 605–610. |
[23] | Rusanen M , Ngandu T , Laatikainen T , Tuomilehto J , Soininen H , Kivipelto M ((2013) ) Chronic obstructive pulmonary disease and asthma and the risk of mild cognitive impairment and dementia: A population based CAIDE study. Curr Alzheimer Res 10: , 549–555. |
[24] | Tan ZS , Beiser A , Vasan RS , Au R , Auerbach S , Kiel DP , Wolf PA , Seshadri S ((2008) ) Thyroid function and the risk of Alzheimer disease: The Framingham Study. Arch Intern Med 168: , 1514–1520. |
[25] | Kivipelto M , Helkala EL , Laakso MP , Hänninen T , Hallikainen M , Alhainen K , Soininen H , Tuomilehto J , Nissinen A ((2001) ) Midlife vascular risk factors and Alzheimer’s disease in later life: Longitudinal, population based study. BMJ 322: , 1447–1451. |
[26] | Profenno LA , Porsteinsson AP , Faraone SV ((2010) ) Meta-analysis of Alzheimer’s disease risk with obesity, diabetes, and related disorders. Biol Psychiatry 67: , 505–512. |
[27] | Yaffe K , Laffan AM , Harrison SL , Redline S , Spira AP , Ensrud KE , Ancoli-Israel S , Stone KL ((2011) ) Sleep-disordered breathing, hypoxia, and risk of mild cognitive impairment and dementia in older women. JAMA 306: , 613–619. |
[28] | Lim AS , Kowgier M , Yu L , Buchman AS , Bennett DA ((2013) ) Sleep fragmentation and the risk of incident Alzheimer’s disease and cognitive decline in older persons. Sleep 36: , 1027. |
[29] | Ownby RL , Crocco E , Acevedo A , John V , Loewenstein D ((2006) ) Depression and risk for Alzheimer disease: Systematic review, meta-analysis, and metaregression analysis. Arch Gen Psychiatry 63: , 530–538. |
[30] | Sivanandam TM , Thakur MK ((2012) ) Traumatic brain injury: A risk factor for Alzheimer’s disease. Neurosci Biobehav Rev 36: , 1376–1381. |
[31] | Ukraintseva S , Yashin A , Arbeev K , Kulminski A , Akushevich I , Wu D , Joshi G , Land KC , Stallard E ((2016) ) Puzzling role of genetic risk factors in human longevity: “Risk alleles” as pro-longevity variants. Biogerontology 17: , 109–127. |
[32] | Akushevich I , Kravchenko J , Ukraintseva S , Arbeev K , Kulminski A , Yashin AI ((2013) ) Morbidity risks among older adults with pre-existing age-related diseases. Exp Gerontol 48: , 1395–1401. |
[33] | Ukraintseva SV , Arbeev KG , Akushevich I , Kulminski A , Arbeeva L , Culminskaya I , Akushevich L , Yashin AI ((2010) ) Trade-offs between cancer and other diseases: Do they exist and influence longevity? . Rejuvenation Res 13: , 387–396. |
[34] | Yashin AI , Ukraintseva SV , Akushevich IV , Arbeev KG , Kulminski A , Akushevich L ((2009) ) Trade-off between cancer and aging: What role do other diseases play? Evidence from experimental and human population studies. Mech Ageing Dev 130: , 98–104. |
[35] | Kunkle BW , Grenier-Boley B , Sims R , Bis JC , Damotte V , Naj AC , Boland A , Vronskaya M , van der Lee SJ , Amlie-Wolf A , et al.((2019) ) Genetic meta-analysis of diagnosed Alzheimer’s disease identifies new risk loci and implicates Aβ, tau, immunity and lipid processing. Nat Genet 51: , 414–430. |
[36] | Lambert JC , Ibrahim-Verbaas CA , Harold D , Naj AC , Sims R , Bellenguez C , Jun G , DeStefano AL , Bis JC , Beecham GW ((2013) ) Meta-analysis of 74,046 individuals identifies 11 new susceptibility loci for Alzheimer’s disease. Nat Genet 45: , 1452. |
[37] | Liang JW , Fang ZY , Huang Y , Liuyang ZY , Zhang XL , Wang JL , Hui W , Wang JZ , Wang XC , Zeng J ((2018) ) Application of weighted gene co-expression network analysis to explore the key genes in Alzheimer’s disease. J Alzheimers Dis 65: , 1353–1364. |
[38] | Rustenhoven J , Smith AM , Smyth LC , Jansson D , Scotter EL , Swanson ME , Aalderink M , Coppieters N , Narayan P , Handley R ((2018) ) PU. 1 regulates Alzheimer’s disease-associated genes in primary human microglia. Mol Neurodegener 13: , 44. |
[39] | Han ZJ , Xue WW , Tao L , Zhu F ((2018) ) Identification of novel immune-relevant drug target genes for Alzheimer’s Disease by combining ontology inference with network analysis. CNS Neurosci Ther 24: , 1253–1263. |
[40] | Chee LY , Cumming A ((2018) ) Polymorphisms in the cholinergic receptors muscarinic (CHRM2 and CHRM3) genes and Alzheimer’s disease. Avicenna J Med Biotechnol 10: , 196–199. |
[41] | Walker DG , Tang TM , Lue LF ((2018) ) Increased expression of toll-like receptor 3, an anti-viral signaling molecule, and related genes in Alzheimer’s disease brains. Exp Neurol 309: , 91–106. |
[42] | Cruz-Rivera YE , Perez-Morales J , Santiago YM , Gonzalez VM , Morales L , Cabrera-Rios M , Isaza CE ((2018) ) A selection of important genes and their correlated behavior in Alzheimer’s disease. J Alzheimers Dis 65: , 193–205. |
[43] | Ni H , Xu M , Zhan GL , Fan Y , Zhou H , Jiang HY , Lu WH , Tan L , Zhang DF , Yao YG ((2018) ) The GWAS risk genes for depression may be actively involved in Alzheimer’s disease. J Alzheimers Dis 64: , 1149–1161. |
[44] | Yamaguchi-Kabata Y , Morihara T , Ohara T , Ninomiya T , Takahashi A , Akatsu H , Hashizume Y , Hayashi N , Shigemizu D , Boroevich KA , Ikeda M , Kubo M , Takeda M , Tsunoda T ((2018) ) Integrated analysis of human genetic association study and mouse transcriptome suggests LBH and SHF genes as novel susceptible genes for amyloid-β accumulation in Alzheimer’s disease. Hum Genet 137: , 521–533. |
[45] | Barrera J , Subramanian S , Chiba-Falek O ((2018) ) Probing the role of PPARγ in the regulation of late-onset Alzheimer’s disease-associated genes. PloS One 13: , e0196943. |
[46] | Picard C , Julien C , Frappier J , Miron J , Théroux L , Dea D United Kingdom Brain Expression Consortium and for the Alzheimer’s Disease Neuroimaging Initiative; Breitner JCS , Poirier J ((2018) ) Alterations in cholesterol metabolism–related genes in sporadic Alzheimer’s disease. Neurobiol Aging 66: , 180.e1–180.e9. |
[47] | Blue EE , Bis JC , Dorschner MO , Tsuang DW , Barral SM , Beecham G , Below JE , Bush WS , Butkiewicz M , Cruchaga C , DeStefano A , Farrer LA , Goate A , Haines J , Jaworski J , Jun G , Kunkle B , Kuzma A , Lee JJ , Lunetta KL , Ma Y , Martin E , Naj A , Nato AQ , Navas P , Nguyen H , Reitz C , Reyes D , Salerno W , Schellenberg GD , Seshadri S , Sohi H , Thornton TA , Valadares O , van Duijn C , Vardarajan BN , Wang LS , Boerwinkle E , Dupuis J , Pericak-Vance MA , Mayeux R , Wijsman EM on behalf of the Alzheimer’s Disease Sequencing Project ((2018) ) Genetic variation in genes underlying diverse dementias may explain a small proportion of cases in the Alzheimer’s disease sequencing project. Dement Geriatr Cogn Disord 45: , 1–17. |
[48] | Huang X , Liu H , Li X , Guan L , Li J , Tellier LCAM , Yang H , Wang J , Zhang J ((2018) ) Revealing Alzheimer’s disease genes spectrum in the whole-genome by machine learning. BMC Neurol 18: , 5. |
[49] | Kong W , Mou X , Di B , Deng J , Zhong R , Wang S ((2017) ) Dysregulated pathway identification of Alzheimer’s disease based on internal correlation analysis of genes and pathways. Comb Chem High Throughput Screen 20: , 896–904. |
[50] | Cukier H , Kunkle B , Hamilton K , Rolati S , Kohli M , Whitehead P , Jaworski J , Vance J , Cuccaro M , Carney R ((2017) ) Exome sequencing of extended families with Alzheimer’s disease identifies novel genes implicated in cell immunity and neuronal function. J Alzheimers Dis Parkinsonism 7: , 355. |
[51] | Volmar CH , Salah-Uddin H , Janczura KJ , Halley P , Lambert G , Wodrich A , Manoah S , Patel NH , Sartor GC , Mehta N , Miles NTH , Desse S , Dorcius D , Cameron MD , Brothers SP , Wahlestedt C ((2017) ) M344 promotes nonamyloidogenic amyloid precursor protein processing while normalizing Alzheimer’s disease genes and improving memory. Proc Natl Acad Sci U S A 114: , E9135–E9144. |
[52] | Gusareva ES , Twizere JC , Sleegers K , Dourlen P , Abisambra JF , Meier S , Cloyd R , Weiss B , Dermaut B , Bessonov K , van der Lee SJ , Carrasquillo MM , Katsumata Y , Cherkaoui M , Asselbergh B , Ikram MA , Mayeux R , Farrer LA , Haines JL , Pericak-Vance MA , Schellenberg GD Genetic and Environmental Risk in Alzheimer’s Disease 1 consortium (GERAD1); Alzheimer’s Disease Genetics Consortium (ADGC); European Alzheimer Disease Initiative Investigators (EADI1 Consortium); Sims R , Williams J , Amouyel P , van Duijn CM , Ertekin-Taner N , Van Broeckhoven C , Dequiedt F , Fardo DW , Lambert JC , Van Steen K ((2018) ) Male-specific epistasis between WWC1 and TLN2 genes is associated with Alzheimer’s disease. Neurobiol Aging 72: , 188.e3–188.e12. |
[53] | Euesden J , Lewis CM , O’Reilly PF ((2015) ) PRSice: Polygenic Risk Score software. Bioinformatics 31: , 1466–1468. |
[54] | Requia WJ , Di Q , Silvern R , Kelly JT , Koutrakis P , Mickley LJ , Sulprizio MP , Amini H , Shi L , Schwartz J ((2020) ) An ensemble learning approach for estimating high spatiotemporal resolution of ground-level ozone in the contiguous United States. Environ Sci Tecnhol 54: , 11037–11047. |
[55] | Di Q , Amini H , Shi L , Kloog I , Silvern R , Kelly JT , Sabath MB , Choirat C , Koutrakis P , Lyapustin A , Wang Y , Mickley LJ , Schwartz J ((2019) ) Assessing NO2 concentration and model uncertainty with high spatiotemporal resolution across the contiguous United States. Environ Sci Technol 54: , 1372–1384. |
[56] | Shtatland ES , Kleinman K , Cain E Model building in PROC PHREG with automatic variable selection and information criteria. SAS Users Group International Paper, Philadelphia, PA, pp. 206-230. |
[57] | Diaz-Ramirez LG , Lee SJ , Smith AK , Boscardin WJ (2018) Combined Predictor Selection for Multiple Clinical Outcomes Using PHREG. Proceedings of the Western Users of SAS® Software (WUSS), Sacramento, CA: SAS Institute Inc., Cary, NC. |
[58] | Harrell FE Jr , Lee KL , Califf RM , Pryor DB , Rosati RA ((1984) ) Regression modelling strategies for improved prognostic prediction. Stat Med 3: , 143–152. |
[59] | Harrell F (1986) The PHGLM Procedure In SUGI Supplemental Library Guide, Version 5 Edition. SAS Institute Inc., Cary, NC. |
[60] | Uno H , Cai T , Pencina MJ , D’Agostino RB , Wei LJ ((2011) ) On the C-statistics for evaluating overall adequacy of risk prediction procedures with censored survival data. Stat Med 30: , 1105–1117. |
[61] | Yashin AI , Fang F , Kovtun M , Wu D , Duan M , Arbeev K , Akushevich I , Kulminski A , Culminskaya I , Zhbannikov I , Yashkin A , Stallard E , Ukraintseva S ((2018) ) Hidden heterogeneity in Alzheimer’s disease: Insights from genetic association studies and other analyses. Exp Gerontol 107: , 148–160. |
[62] | ((2023) ) 2023 Alzheimer’s disease facts and figures. Alzheimers Dement 19: , 1598–1695. |
[63] | Mues KE , Liede A , Liu J , Wetmore JB , Zaha R , Bradbury BD , Collins AJ , Gilbertson DT ((2017) ) Use of the Medicare database in epidemiologic and health services research: A valuable source of real-world evidence on the older and disabled populations in the US. Clin Epidemiol 9: , 267–277. |
[64] | Fisher GG , Ryan LH ((2018) ) Overview of the health and retirement study and introduction to the special issue. Work Aging Retire 4: , 1–9. |
[65] | Uprety A , Kang Y , Kim SY ((2021) ) Blood-brain barrier dysfunction as a potential therapeutic target for neurodegenerative disorders. Arch Pharm Res 44: , 487–498. |
[66] | Wu S , Yin Y , Du L ((2021) ) Blood–brain barrier dysfunction in the pathogenesis of major depressive disorder. Cell Mol Neurobiol 42: , 2571–2591. |
[67] | Katsi V , Marketou M , Maragkoudakis S , Didagelos M , Charalambous G , Parthenakis F , Tsioufis C , Tousoulis D ((2020) ) Blood–brain barrier dysfunction: The undervalued frontier of hypertension. J Hum Hyperten 34: , 682–691. |
[68] | Setiadi A , Korim WS , Elsaafien K , Yao ST ((2018) ) The role of the blood–brain barrier in hypertension. Exp Physiol 103: , 337–342. |
[69] | Santisteban MM , Ahn SJ , Lane D , Faraco G , Garcia-Bonilla L , Racchumi G , Poon C , Schaeffer S , Segarra SG , Körbelin J ((2020) ) Endothelium-macrophage crosstalk mediates blood-brain barrier dysfunction in hypertension. Hypertension 76: , 795–807. |
[70] | Rhea EM , Banks WA ((2021) ) Interactions of lipids, lipoproteins, and apolipoproteins with the blood-brain barrier. Pharm Res 38: , 1469–1475. |
[71] | ((2022) ) 2022 Alzheimer’s disease facts and figures. Alzheimers Dement 18: , 700–789. |
[72] | Yates P , Sirisriro R , Villemagne VL , Farquharson S , Masters CL , Rowe CC; AIBL Research Group ((2011) ) Cerebral microhemorrhage and brain β-amyloid in aging and Alzheimer disease. Neurology 77: , 48–54. |
[73] | Ghiso J , Tomidokoro Y , Revesz T , Frangione B , Rostagno A ((2010) ) Cerebral amyloid angiopathy and Alzheimer’s disease. Hirosaki Igaku 61: , S111–S124. |
[74] | Snowdon DA , Greiner LH , Mortimer JA , Riley KP , Greiner PA , Markesbery WR ((1997) ) Brain infarction and the clinical expression of Alzheimer disease: The Nun Study. JAMA 277: , 813–817. |
[75] | Beeri MS , Rapp M , Silverman JM , Schmeidler J , Grossman HT , Fallon JT , Purohit DP , Perl DP , Siddiqui A , Lesser G , Rosendorff C , Haroutunian V ((2006) ) Coronary artery disease is associated with Alzheimer disease neuropathology in APOE4 carriers. Neurology 66: , 1399–1404. |
[76] | Tublin JM , Adelstein JM , Del Monte F , Combs CK , Wold LE ((2019) ) Getting to the heart of Alzheimer disease. Circ Res 124: , 142–149. |
[77] | Sabia S , Fayosse A , Dumurgier J , Schnitzler A , Empana JP , Ebmeier KP , Dugravot A , Kivimäki M , Singh-Manoux A ((2019) ) Association of ideal cardiovascular health at age 50 with incidence of dementia: 25 year follow-up of Whitehall II cohort study. BMJ 366: , 14414. |
[78] | Sabia S , Dugravot A , Dartigues JF , Abell J , Elbaz A , Kivimäki M , Singh-Manoux A ((2017) ) Physical activity, cognitive decline, and risk of dementia: 28 year follow-up of Whitehall II cohort study. BMJ 357: , j2709. |
[79] | Bruns J Jr , Hauser WA ((2003) ) The epidemiology of traumatic brain injury: A review. Epilepsia 44: , 2–10. |
[80] | Roderburg C , Loosen SH , Kunstein A , Mohr R , Jördens MS , Luedde M , Kostev K , Luedde T ((2021) ) Cancer patients have an increased incidence of dementia: A retrospective cohort study of 185,736 outpatients in Germany. Cancers (Basel) 13: , 2027. |
[81] | Zhang Q , Guo S , Zhang X , Tang S , Shao W , Han X , Wang L , Du Y ((2015) ) Inverse relationship between cancer and Alzheimer’s disease: A systemic review meta-analysis. Neurol Sci 36: , 1987–1994. |
[82] | Bowles EJA , Walker RL , Anderson ML , Dublin S , Crane PK , Larson EB ((2017) ) Risk of Alzheimer’s disease or dementia following a cancer diagnosis. PLoS One 12: , e0179857. |
[83] | Kang J , Shin DW , Han K , Park SH , Lee WG , Yoo JE , Woo SH , Park J ((2020) ) Risk of dementia in prostate cancer survivors: A nationwide cohort study in Korea. Curr Probl Cancer 44: , 100578. |
[84] | Akushevich I , Yashkin AP , Kravchenko J , Kertai MD ((2021) ) Chemotherapy and the RISK of Alzheimer’s disease in colorectal cancer survivors: Evidence from the medicare system. JCO Oncol Pract 17: , e1649–e1659. |
[85] | Akushevich I , Yashkin AP , Kravchenko J , Kertai MD ((2022) ) Extended anesthesia exposure for abdominal and pelvic procedures in older adults with colorectal cancer: Associations with chart dementia diagnoses. Exp Gerontol 164: , 111830. |
[86] | Liberzon A , Birger C , Thorvaldsdóttir H , Ghandi M , Mesirov JP , Tamayo P ((2015) ) The molecular signatures database hallmark gene set collection. Cell Syst 1: , 417–425. |
[87] | Kunkle BW , Schmidt M , Klein HU , Naj AC , Hamilton-Nelson KL , Larson EB , Evans DA , De Jager PL , Crane PK , Buxbaum JD ((2021) ) Novel Alzheimer disease risk loci and pathways in African American individuals using the African genome resources panel: A meta-analysis. JAMA Neurol 78: , 102–113. |
[88] | Kramarow EA , Tejada-Vera B ((2019) ) Dementia mortality in the United States, 2000-2017. Natl Vital Stat Rep 68: , 1–29. |
[89] | Laws KR , Irvine K , Gale TM ((2018) ) Sex differences in Alzheimer’s disease. Curr Opin Psychiatry 31: , 133–139. |
[90] | Barnes L , Wilson R , Schneider J , Bienias J , Evans D , Bennett D ((2003) ) Gender, cognitive decline, and risk of AD in older persons. Neurology 60: , 1777–1781. |
[91] | Guo L , Zhong MB , Zhang L , Zhang B , Cai D ((2022) ) Sex differences in Alzheimer’s disease: Insights from the multiomics landscape. Biol Psychiatry 91: , 61–71. |
[92] | Ferretti MT , Iulita MF , Cavedo E , Chiesa PA , Schumacher Dimech A , Santuccione Chadha A , Baracchi F , Girouard H , Misoch S , Giacobini E ((2018) ) Sex differences in Alzheimer disease— the gateway to precision medicine. Nat Rev Neurol 14: , 457–469. |
[93] | Shi L , Wu X , Danesh Yazdi M , Braun D , Abu Awad Y , Wei Y , Liu P , Di Q , Wang Y , Schwartz J , Dominici F , Kioumourtzoglou MA , Zanobetti A ((2020) ) Long-term effects of PM2. 5 on neurological disorders in the American Medicare population: A longitudinal cohort study. Lancet Planet Health 4: , e557–e565. |
[94] | Dimakakou E , Johnston HJ , Streftaris G , Cherrie JW ((2018) ) Exposure to environmental and occupational particulate air pollution as a potential contributor to neurodegeneration and diabetes: A systematic review of epidemiological research. Int J Environ Res Public Health 15: , 1704. |
[95] | Rhew SH , Kravchenko J , Lyerly HK ((2021) ) Exposure to low-dose ambient fine particulate matter PM2. 5 and Alzheimer’s disease, non-Alzheimer’s dementia, and Parkinson’s disease in North Carolina. PLoS One 16: , e0253253. |
[96] | Wancata J , Musalek M , Alexandrowicz R , Krautgartner M ((2003) ) Number of dementia sufferers in Europe between the years 2000 and 2050. Eur Psychiatry 18: , 306–313. |
[97] | Jorm AF , Dear KB , Burgess NM ((2005) ) Projections of future numbers of dementia cases in Australia with and without prevention. Aust N Z J Psychiatry 39: , 959–963. |
[98] | Guariguata L , Whiting D , Hambleton I , Beagley J , Linnenkamp U , Shaw J ((2014) ) Global estimates of diabetes prevalence for 2013 and projections for 2035. Diabetes Res Clin Pract 103: , 137–149. |
[99] | Naccarelli GV , Varker H , Lin J , Schulman KL ((2009) ) Increasing prevalence of atrial fibrillation and flutter in the United States. Am J Cardiol 104: , 1534–1539. |
[100] | Tham YC , Li X , Wong TY , Quigley HA , Aung T , Cheng CY ((2014) ) Global prevalence of glaucoma and projections of glaucoma burden through 2040: A systematic review and meta-analysis. Ophthalmology 121: , 2081–2090. |
[101] | Hebert LE , Weuve J , Scherr PA , Evans DA ((2013) ) Alzheimer disease in the United States (2010–2050) estimated using the 2010 census. Neurology 80: , 1778–1783. |
[102] | Brookmeyer R , Abdalla N ((2019) ) Multistate models and lifetime risk estimation: Application to Alzheimer’s disease. Stat Med 38: , 1558–1565. |
[103] | Brookmeyer R , Abdalla N , Kawas CH , Corrada MM ((2018) ) Forecasting the prevalence of preclinical and clinical Alzheimer’s disease in the United States. Alzheimers Dement 14: , 121–129. |
[104] | GBD 2019 Dementia Forecasting Collaborators ((2022) ) Estimation of the global prevalence of dementia in 2019 and forecasted prevalence in 2050: An analysis for the Global Burden of Disease Study 2019. Lancet Public Health 7: , e105–e125. |
[105] | Arbeev KG , Bagley O , Yashkin AP , Duan H , Akushevich I , Ukraintseva SV , Yashin AI ((2023) ) Understanding Alzheimer’s disease in the context of aging: Findings from applications of stochastic process models to the Health and Retirement Study. Mech Ageing Dev 211: , 111791. |
[106] | Yashkin AP , Gorbunova GA , Tupler L , Yashin AI , Doraiswamy M , Akushevich I 2023 Differences in risk of Alzheimer’s disease following later-life traumatic brain injury in veteran and civilian populations. J Head Trauma Rehabil, doi: 10.1097/HTR.0000000000000865.. |
[107] | Short ME , Goetzel RZ , Pei X , Tabrizi MJ , Ozminkowski RJ , Gibson TB , DeJoy DM , Wilson MG ((2009) ) How accurate are self-reports? An analysis of self-reported healthcare utilization and absence when compared to administrative data. J Occup Environ Med 51: , 786–796. |
[108] | Dowd JB , Todd M ((2011) ) Does self-reported health bias the measurement of health inequalities in US adults? Evidence using anchoring vignettes from the Health and Retirement Study. J Gerontol B Psychol Sci Soc Sci 66: , 478–489. |
[109] | Tisnado DM , Adams JL , Liu H , Damberg CL , Hu FA , Chen WP , Carlisle DM , Mangione CM , Kahn KL ((2006) ) Does the concordance between medical records and patient self-report vary with patient characteristics? . Health Serv Outcomes Res Methodol 6: , 157–175. |
[110] | Psaty BM , Kuller LH , Bild D , Burke GL , Kittner SJ , Mittelmark M , Price TR , Rautaharju PM , Robbins J ((1995) ) Methods of assessing prevalent cardiovascular disease in the Cardiovascular Health Study. Ann Epidemiol 5: , 270–277. |
[111] | Simpson CF , Boyd CM , Carlson MC , Griswold ME , Guralnik JM , Fried LP ((2004) ) Agreement between self-report of disease diagnoses and medical record validation in disabled older women: Factors that modify agreement. J Am Geriatr Soc 52: , 123–127. |
[112] | Paganini-Hill A , Chao A ((1993) ) Accuracy of recall of hip fracture, heart attack, and cancer: A comparison of postal survey data and medical records. Am J Epidemiol 138: , 101–106 . |


