
Medial Temporal Lobe Atrophy in Predementia Alzheimer’s Disease: A Longitudinal Multi-Site Study Comparing Staging and A/T/N in a Clinical Research Cohort1
Abstract
Background:
Atrophy of the medial temporal lobe (MTL) is a biological characteristic of Alzheimer’s disease (AD) and can be measured by segmentation of magnetic resonance images (MRI).
Objective:
To assess the clinical utility of automated volumetry in a cognitively well-defined and biomarker-classified multi-center longitudinal predementia cohort.
Methods:
We used Automatic Segmentation of Hippocampal Subfields (ASHS) to determine MTL morphometry from MRI. We harmonized scanner effects using the recently developed longitudinal ComBat. Subjects were classified according to the A/T/N system, and as normal controls (NC), subjective cognitive decline (SCD), or mild cognitive impairment (MCI). Positive or negative values of A, T, and N were determined by cerebrospinal fluid measurements of the Aβ42/40 ratio, phosphorylated and total tau. From 406 included subjects, longitudinal data was available for 206 subjects by stage, and 212 subjects by A/T/N.
Results:
Compared to A–/T–/N– at baseline, the entorhinal cortex, anterior and posterior hippocampus were smaller in A+/T+orN+. Compared to NC A– at baseline, these subregions were also smaller in MCI A+. Longitudinally, SCD A+ and MCI A+, and A+/T–/N– and A+/T+orN+, had significantly greater atrophy compared to controls in both anterior and posterior hippocampus. In the entorhinal and parahippocampal cortices, longitudinal atrophy was observed only in MCI A+ compared to NC A–, and in A+/T–/N– and A+/T+orN+ compared to A–/T–/N–.
Conclusion:
We found MTL neurodegeneration largely consistent with existing models, suggesting that harmonized MRI volumetry may be used under conditions that are common in clinical multi-center cohorts.
INTRODUCTION
Prominent atrophy of the medial temporal lobe (MTL) is a core feature of amnestic Alzheimer’s disease (AD), the most prevalent pre-dementia AD subtype [1]. Neurofibrillary tangles (NFT) appear in the MTL in very early stage AD, initially in the transentorhinal cortex (TEC) and entorhinal cortex (ERC), followed by sequential involvement of hippocampal subfields, progressing to isocortical areas in late stage AD [2]. Hyperphosphorylation of intraneuronal tau results in the formation of NFTs, leading to microtubule disruption, axonal degeneration and synaptic loss, making atrophy in AD congruent with the distribution of NFTs [3–5]. Amyloid is widely believed to be the key driver behind AD pathology, with downstream increase in NFT load and neurodegeneration [6–9]. In contrast to NFTs, the typical appearance of amyloid pathology is in basal temporal isocortical areas in absence of NFT pathology, followed by appearance in periallocortical areas (ERC and TEC), CA1 and presubiculum, with increasing involvement of the hippocampal formation (allocortex) [10].
Magnetic resonance imaging (MRI) volumetry has been used widely to investigate patterns of atrophy in AD. Improved accuracy and longitudinal study design have moved the threshold of discernible neurodegeneration towards preclinical stages of AD, but the clinical utility of these methods is still uncertain. Automated segmentation methods perform close to manual methods, is time saving and reproducible, and may be useful for analyzing imaging data in large datasets [11–13]. Longitudinal studies utilizing both imaging and non-imaging AD biomarkers are particularly important to untangle causal relationships and the sequence of pathological events leading to neurodegeneration, but the number of studies are still limited. Distinct patterns of MTL atrophy have already been described across the predementia disease spectrum of AD, including prodromal [14–19], and preclinical stages of AD [20–24]. Early MTL cortical atrophy have been found in ERC [20] and TEC [22, 23], and early hippocampal atrophy in the subfields CA1 [24] and subiculum [21]. Summarized evidence from manually and automated hippocampal segmentation methods within the AD disease spectrum, also point to CA1 as a predilection site for early stage atrophy in AD, although some inconsistencies are seen [25]. Atrophy has been suggested to start in the ERC prior to the hippocampus [26, 27], but in addition to transentorhinal atrophy, there have also been reports of posterior hippocampal atrophy in preclinical AD [22]. The literature on MTL atrophy in AD suffers from inconsistent terminology and segmentation protocols as well as AD diagnosis and staging. Delineation of substructures and algorithms for segmentation differ between studies, and studies examining the sequence of atrophy in AD are often from small cohorts or face limitations due to multicenter study design or inconsistencies in biological and cognitive staging. Subregional atrophy could serve as an important outcome measure in clinical trials but must be examined properly in longitudinal studies with well-characterized cases, and possible sources of error must be identified and considered.
Diagnostic criteria, biomarkers, and assessment of imaging data are continuously improving. Standards of AD diagnosis are now established by international workgroups, with diagnostic frameworks based on cognitive staging and biomarkers [28–30]. In addition, the A/T/N system for unbiased biomarker classification of AD has been established, where subjects are described based on normal (–) or abnormal (+) biomarkers of amyloid-β pathology (A– and A+, respectively), tau pathology (T–/T+), and neuronal degeneration (N–/N+) [31]. A multisite approach is usually necessary to achieve sufficient statistical power in longitudinal studies, but scanner effects can mask significant MTL neurodegeneration. Multi-site MRI in clinical practice from leading centers usually involves MRI with image resolution at approximately 1 mm3, and FreeSurfer is one of the most common methods for automated hippocampal segmentation that could be applied to MRI data at this resolution [32]. A recent study questions the reliability of automated methods for hippocampal segmentation at this resolution, which is an additional challenge to achieve valid results using automated volumetry under these circumstances [33]. An alternative to FreeSurfer is ASHS (Automated Segmentation of Hippocampal Subfields) which offers a rough, but probably more reliable segmentation into anterior and posterior hippocampus, and also improved segmentation of cortical subregions of the MTL in T1-weighted images (ASHS-T1) [34].
We used ASHS to segment MTL subregions, to examine baseline and longitudinal MTL morphometry in a longitudinal Norwegian predementia multi-center study, using a novel method for harmonization of longitudinal multi-center neuroimaging data, and state-of-the-art biomarker and staging classification of AD.
We assessed the following research questions:
1. Is the longitudinal pattern of MTL subregional atrophy consistent with results in the existing literature, when comparing controls and predementia cases characterized with updated clinical criteria and biomarker classification of AD?
2. Are the updated criteria and biomarker definition of AD good predictors of future volume loss in MTL, and clinically useful to determine subjects at risk of disease progression?
3. Does longitudinal ComBat harmonization provide reliable estimates of MTL subregions across sites, so that specific region(s) of interest (ROIs) within the MTL can be utilized as a biomarker of AD disease progression?
MATERIAL AND METHODS
Study cohort
All subjects gave their written consent, and the study has been approved by the regional ethics committee. The subjects in this study were cases and controls from the DDI (Dementia Disease initiation) multicenter study in Norway, included between December 2013 and March 2020 [35]. Cases were mainly recruited from memory clinics (30%) or advertisements (58%), and controls were mainly recruited from advertisements (73%) or case spouses (9%). In advertisements, participants with a first degree relative with dementia were especially encouraged to participate. The study protocol is described in detail elsewhere [35]. In summary, all study candidates were aged 40– 80 at baseline and followed until reaching dementia [30]. The study protocol included clinical examination, cognitive screening tests, neuropsychological assessment, lumbar puncture, and cerebral MRI. A subgroup of the participants underwent amyloid PET. Assessments were repeated every second year. At each time-point, all examinations were performed within a time span of 3 months. Staging was performed for all participants, based on cognitive tests recommended by the National Institute on Aging – Alzheimer’s Association (NIA-AA) working group, classifying the candidates as normal controls, subjective cognitive decline (SCD) [28] or mild cognitive impairment (MCI) [29]. Subjects with amyloid pathology were defined as early (SCD) or late (MCI) AD predementia.
The subjects were classified according to the A/T/N system which is an unbiased description based on core biomarkers of AD, defined by presence (+) or absence of (–) amyloid pathology (A), tangle pathology (T), or neurodegeneration (N) [31], here determined based on cerebrospinal fluid (CSF) biomarkers as described by Jack [31]. We dichotomized the CSF measurements of amyloid-β (Aβ)42/40 ratio, phosphorylated tau (p-tau), and total tau (t-tau) to determine A, T, and N status as positive or negative. Values of CSF total-tau were used instead of MRI atrophy to determine neuronal injury (N) in A/T/N classified subjects, because prediction of future volume loss based on CSF biomarkers of AD were one of the main research questions, and atrophy was therefore not an eligible criterion to determine (N). One of the subjects had amyloid-PET but not CSF results and could therefore not be A/T/N classified.
Cerebrospinal fluid assessments
Lumbar puncture and CSF assessments have been described previously [35]. All samples were collected in sterile polypropylene tubes (thermo nunc) before noon, and all CSF analyses were performed at the Department of Interdisciplinary Laboratory Medicine and Medical Biochemistry at Akershus University Hospital. Commercial enzyme-linked immunosorbent assays (Innotest, Fujirebio, Ghent, Belgium) based on monoclonal antibodies were used to measure CSF concentrations of total tau (t-tau) using hTau Ag kits, and phosphorylated tau (p-tau) using 181P kits. The QuickPlex SQ 120 system from Meso Scale Discovery (MSD, MD, USA) was used to measure Aβ1 - 42 and Aβ1 - 40 in a multiplex setup using V-plex Ab Peptide Panel 1 (6E10) kit (K15200E-1). The analyses were carried out according to the manufacturers’ procedures.
We stratified subjects as A+ if CSF Aβ42/40 ratio ≤0.077, or A– if CSF Aβ42/40 ratio >0.077 ng/L, based on an amyloid-PET 18F-flutemetamol verified cut-off [36]. Compared to CSF Aβ42 alone, Aβ42/40 ratio is probably more reliable in diagnosing AD [37]. In subjects without CSF, amyloid-PET 18F-flutemetamol results were alone used to determine Aβ status. A subset of cases that were missing lumbar puncture or amyloid-PET 18F-flutemetamol at baseline were classified as Aβ+ if a lumbar puncture or amyloid-PET from a former assessment confirmed positive Aβ pathology, or Aβ– if more recent CSF or PET excluded Aβ pathology. The same approach was used to determine total or phosphorylated tau when CSF total or phosphorylated tau were missing at baseline.
Amyloid PET 18F-flutemetamol
A subset of 47 participants (11.1%) underwent amyloid-PET 18F-flutemetamol, qualitatively read according to manufacturer’s standards.
Subject classification
To explore the impact of cognitive staging and biomarker classifications on future MTL atrophy, subjects were grouped according to two different classification algorithms: by cognitive staging and amyloid status; and by classification according to the A/T/N system. In contrast to A/T/N classification, clinical staging of subjects with biomarker-verified AD could be influenced by other non-AD related factors affecting cognitive reserve, such as pre-morbid function level, comorbidity, and education [38]. Biomarker verified AD biomarkers could also be pathologic several years before onset of clinical symptoms, and classification by the A/T/N system could also add information that otherwise would not be included in groups based on cognitive staging these subjects would then fall outside AD classification based on clinical symptoms.
The groups based on cognitive staging and amyloid status were classified into the following categories: Normal amyloid negative controls (NC A–), amyloid negative or positive subjective cognitive decline (SCD A– and SCD A+) or mild cognitive impairment (MCI A– and MCI A+). Due to power restrictions, we did not include amyloid positive cognitively normal controls (NC A+) or cognitively abnormal amyloid negative or positive controls (AC A+ and AC A–). Here, NC A– were defined as controls, and SCD A–, SCD A+, MCI A–, and MCI A+ as cases. A/T/N staging was performed as follows: A–/T–/N– (biomarker negative controls), A–/T+orN+, A+/T–/N–, and A+/T+orN+. According to A/T/N– classification, A–/T–/N– was defined as controls, and A–/T+orN+, A+/T–/N–, and A+/T+orN+ were defined as cases.
To increase statistical power and reduce the number of comparisons, we chose to combine T+ and N+ subjects in the categories A–/T+orN+ and A+/T+orN+. Also, it is clinically relevant to distinguish between subjects with biomarker evidence of cerebral amyloidosis, and normal levels of both CSF tau- and p-tau, or at least one of them present (T+ or N+, or both), as these groups are assumed to be further downstream in the AD disease trajectory. It should also be noted, that CSF p-tau does not always correlate with NFTs verified with tau-PET or autopsy [39, 40], which supports our decision to merge T+/– and N+/– into one group (A+/T+orN+).
Our main aim was to investigate the relationship between amyloid positive subjects and controls, and not to investigate suspected non-Alzheimer disease pathologies (SNAP), which was also the rationale for not contrasting T+/– and N+/– in amyloid negative subjects in the A–/T+orN+ category [41].
MRI acquisition
MRI data from six sites, acquired across seven 1.5 Tesla and four 3.0 TeslaMRI systems, were included in the study. Scanners with a total number of scans less than 10 were excluded to avoid introducing too much noise caused by technical variability. All MRI analyses were based on volumetric T1-weighted scans, with scan-parameters detailed in Table 1.
Table 1
Scanner overview
| Scanner details (Site) | Stage by amyloid status | A/T/N– classification |
| Philips Achieva (3.0T) (Oslo) | 36 | 31 |
| Turbo field echo: TR/TE/TI = 6.7/3.1/853; FA = 8°; matrix = 256×256; 170 slices, thickness = 1.2 mm, in-plane resolution 1 mm2 | ||
| Philips Ingenia (3.0T) (Oslo) | 111 | 98 |
| Turbo field echo: TR/TE/TI = 4.7/2.3/853 ms; FA = 8°; matrix = 256×256, 184 slices, thickness = 1 mm, in-plane resolution 1 mm2 | ||
| Siemens Prisma (3.0T) (Oslo) | 41 | 40 |
| Magnetization-prepared rapid gradient– echo: TR/TE/TI = 2200/1.47/900 ms; FA = 8°; matrix = 256×256; 320 slices, thickness = 1 mm, in-plane resolution 1 mm2 | ||
| Siemens Avanto (1.5T) (Oslo) | 32 | 32 |
| Turbo field echo: TR/TE/TI = 1800/3.92/905 ms; FA = 8°; matrix = 256×256, 160 slices, thickness = 1 mm, in-plane resolution 1 mm2 | ||
| Philips Ingenia (1.5T) (Stavanger) | 110 | 123 |
| Turbo field echo: TR/TE/TI = 7.55/3.43/930 ms; FA = 8°, matrix = 256×256, 157 slices, thickness = 1 mm, in-plane resolution 1 mm2 | ||
| Siemens Avanto (1.5T) (Haugesund) | 21 | 21 |
| Magnetization-prepared rapid gradient– echo: TR/TE/TI = 1700/2.42/1000 ms; FA = 15°; matrix = 256×233; 144 slices, thickness = 1.2 mm, in-plane resolution 1.1 mm2 | ||
| Siemens Avanto (1.5T) (Stord) | 16 | 22 |
| Turbo field echo: TR/TE/TI = 1700/2.42/1000 ms; FA = 15°; matrix = 256×256, 144 slices, thickness = 1 mm, in-plane resolution 1 mm2 | ||
| GE Optima (1.5T) (Bergen) | 135 | 151 |
| Fast spoiled gradient– echo: TR/TE/TI = 11.3/5.04/500 ms; FA = 10°; matrix = 256×256; 156 slices, thickness = 1.2 mm, in-plane resolution 1 mm2 | ||
| Siemens Avanto 1 (1.5T) (Trondheim) | 14 | 14 |
| Turbo field echo: TR/TE/TI = 1190/3.1/750 ms; FA = 15°; matrix = 246×256, 144 slices, thickness = 1 mm, in-plane resolution 1 mm2 | ||
| Siemens Avanto 2 (1.5T) (Trondheim) | 20 | 21 |
| Turbo field echo: TR/TE/TI = 1190/3.1/750 ms; FA = 15°; matrix = 256×256, 144 slices, thickness = 1 mm, in-plane resolution 1 mm2 | ||
| Siemens Skyra (3.0T) (Tromso) | 84 | 92 |
| Magnetization-prepared rapid gradient– echo: TR/TE/TI = 2300/2.98/900 ms; FA = 9°; matrix = 256×256; 176 slices, thickness = 1.2 mm, in-plane resolution 1 mm2 | ||
| Total number of scans | 620 | 645 |
Scanner overview of total number of scans, by clinical group. All assessments are included. Scanners with less than 10 scans in total were excluded to reduce scanner noise before adjusting for scanner effects by longitudinal ComBat.
Image postprocessing
We used the following method of automated segmentation: Automatic Segmentation of Hippocampal Subfields (ASHS) for total MTL volumes. This method provides fully automated segmentation, and the software is free, open-source and available online (https://www.nitrc.org/projects/ashs/. To reduce the number of comparisons, all volumes were averaged across the hemispheres. All images were manually inspected by trained physicians (J. Jarholm, P. Selnes) for quality and correct segmentation after postprocessing.
The technical details of the ASHS segmentation protocol have been described earlier by Yushkevich et al. [34], and the segmentation algorithm intended for T1-weighted (T1w) MR images (ASHS-T1) was used to label and measure volumes of ERC, BA 35 and 36, parahippocampal cortex (PHC), and the anterior and posterior hippocampus [42]. The reference cohort for the ASHS-PMC-T1 atlas includes subjects from the age of 54 to 88 [43]. At baseline, we had 63 of 368 (17.1%) subjects with clinical staging and 61 of 385 (15.8%) with A/T/N classification below the age of 54.
APOE genotyping
EDTA blood samples were analyzed to determine APOE genotype at Akershus University Hospital (Gene technology division, Department of interdisciplinary Laboratory Medicine and Medical biochemistry) by use of a real-time PCR in combination with a TaqMan assay (Applied biosystems, Thermo Fisher Scientific, Waltham, USA).
Statistical analyses
Statistical analyses were performed in R version 4.0.5 [44]. To deal with variability in image quality and contrast due to different scanners, we used longitudinal ComBat, a recently published harmonization method originally developed for genomics, using an empirical Bayesian approach intended for longitudinal neuroimaging data [45]. Longitudinal ComBat imaging data was determined based on cognitive staging by amyloid status, or by A/T/N classification; and scanner, age at baseline, gender, and APOE ɛ4 carrier status were included in the model. According to Voevodskaya et al. [46], we also chose to include ICV (obtained from each scan) as a covariate. After combat harmonization, scanner was not a significant covariate in the linear mixed model, and was therefore not included. We used linear mixed effects models to evaluate group differences at baseline in cortical or hippocampal regional volumes. We accounted for repeated measures by adding subject as a random effect. The groups were categorized either based on cognitive staging by amyloid status or A/T/N classification.
Baseline differences in cortical or hippocampal volumes are referred to as “volume differences”. In addition, we added a group-by-time interaction to assess longitudinal differences between groups. A significant negative time interaction was considered as a longitudinal negative change in volume compared to the reference group, also referred to as “atrophy”. The models were adjusted for age, gender, APOE ɛ4 carrier status, and ICV as fixed effects, and subjects as random effect. For the analyses of regional differences according to staging and amyloid-status or by A/T/N-classification, we used Holm-Bonferroni to adjust the p-value for multiple comparisons. The baseline results from the linear mixed effects model were used for supplementary receiver operating characteristic (ROC) analysis. To assess the performance of medial temporal volumes for classification between healthy controls and predementia AD, we plotted a ROC curve using baseline ERC and posterior hippocampus volumes (corrected for age and ICV using linear regression) as predictor variables against: 1) baseline NC A– versus MCI A+, and 2) baseline CSF biomarker negative (A–/T–/N–) versus A+/T+orN+ (in two separate models).
RESULTS
Subject characteristics
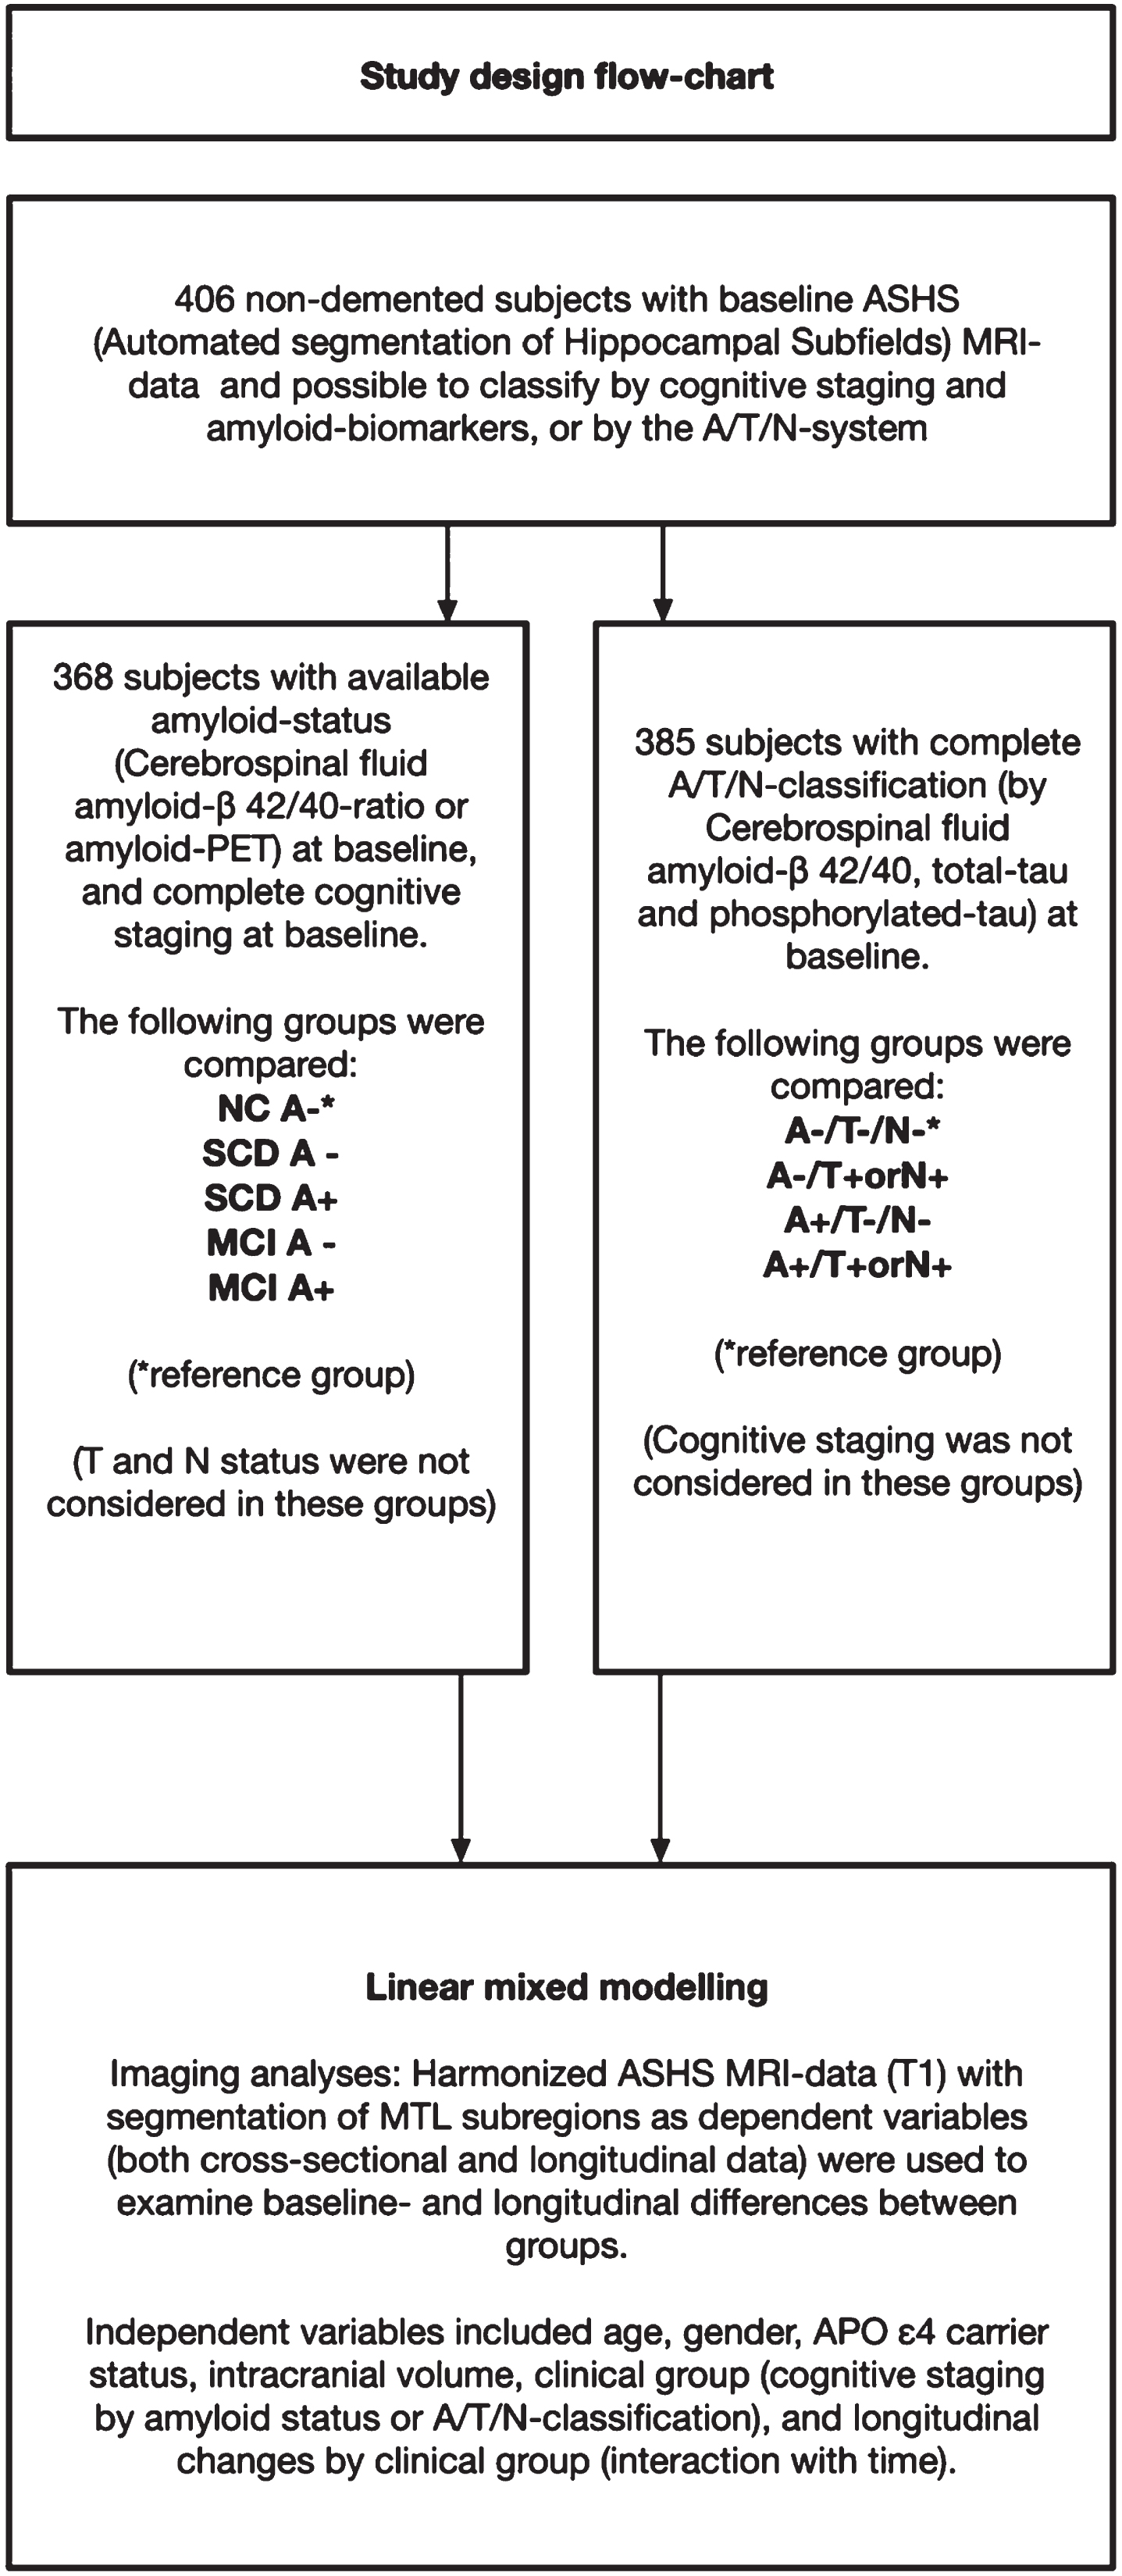
Of the 700 subjects fulfilling the DDI inclusion criteria and included between December 2013 and March 2020, 512 had MRI volumetry-data available from ASHS. 406 of these had available cognitive and amyloid data and could be staged based on cognitive data and amyloid status or classified according to the A/T/N-system. Due to missing CSF, one subject could not be classified according to A/T/N, but amyloid status was available from amyloid-PET 18F-flutemetamol. Further details on patient selection including subjects with available follow-up data are described in Fig. 1 (flowchart). The mean age (years) was higher in SCD A+ (69.0) and MCI A+ (67.6) compared to NC– (60.4), and higher in A+/T–/N– (68.0) and A+/T+or N+(67.3) compared to A–/T–/N– (61.1). APOE ɛ4 carrier status was higher in MCI A+ compared to NC–, and higher in both A+/T–/N– and A+/T+ or N+ compared to A–/T–/N–. Detailed demographic data and group differences are presented in Table 2, and baseline and follow-up diagnoses are presented in Table 3A and 3B.
Fig. 1
Flow-chart of participant selection from the DDI-cohort. A cohort of 406 subjects had baseline MRI data with ASHS (Automated segmentation of Hippocampal Subfields). Subjects included in the left arm had available A/T/N-classification at baseline, and subjects included in the right arm had available cognitive staging and amyloid status.
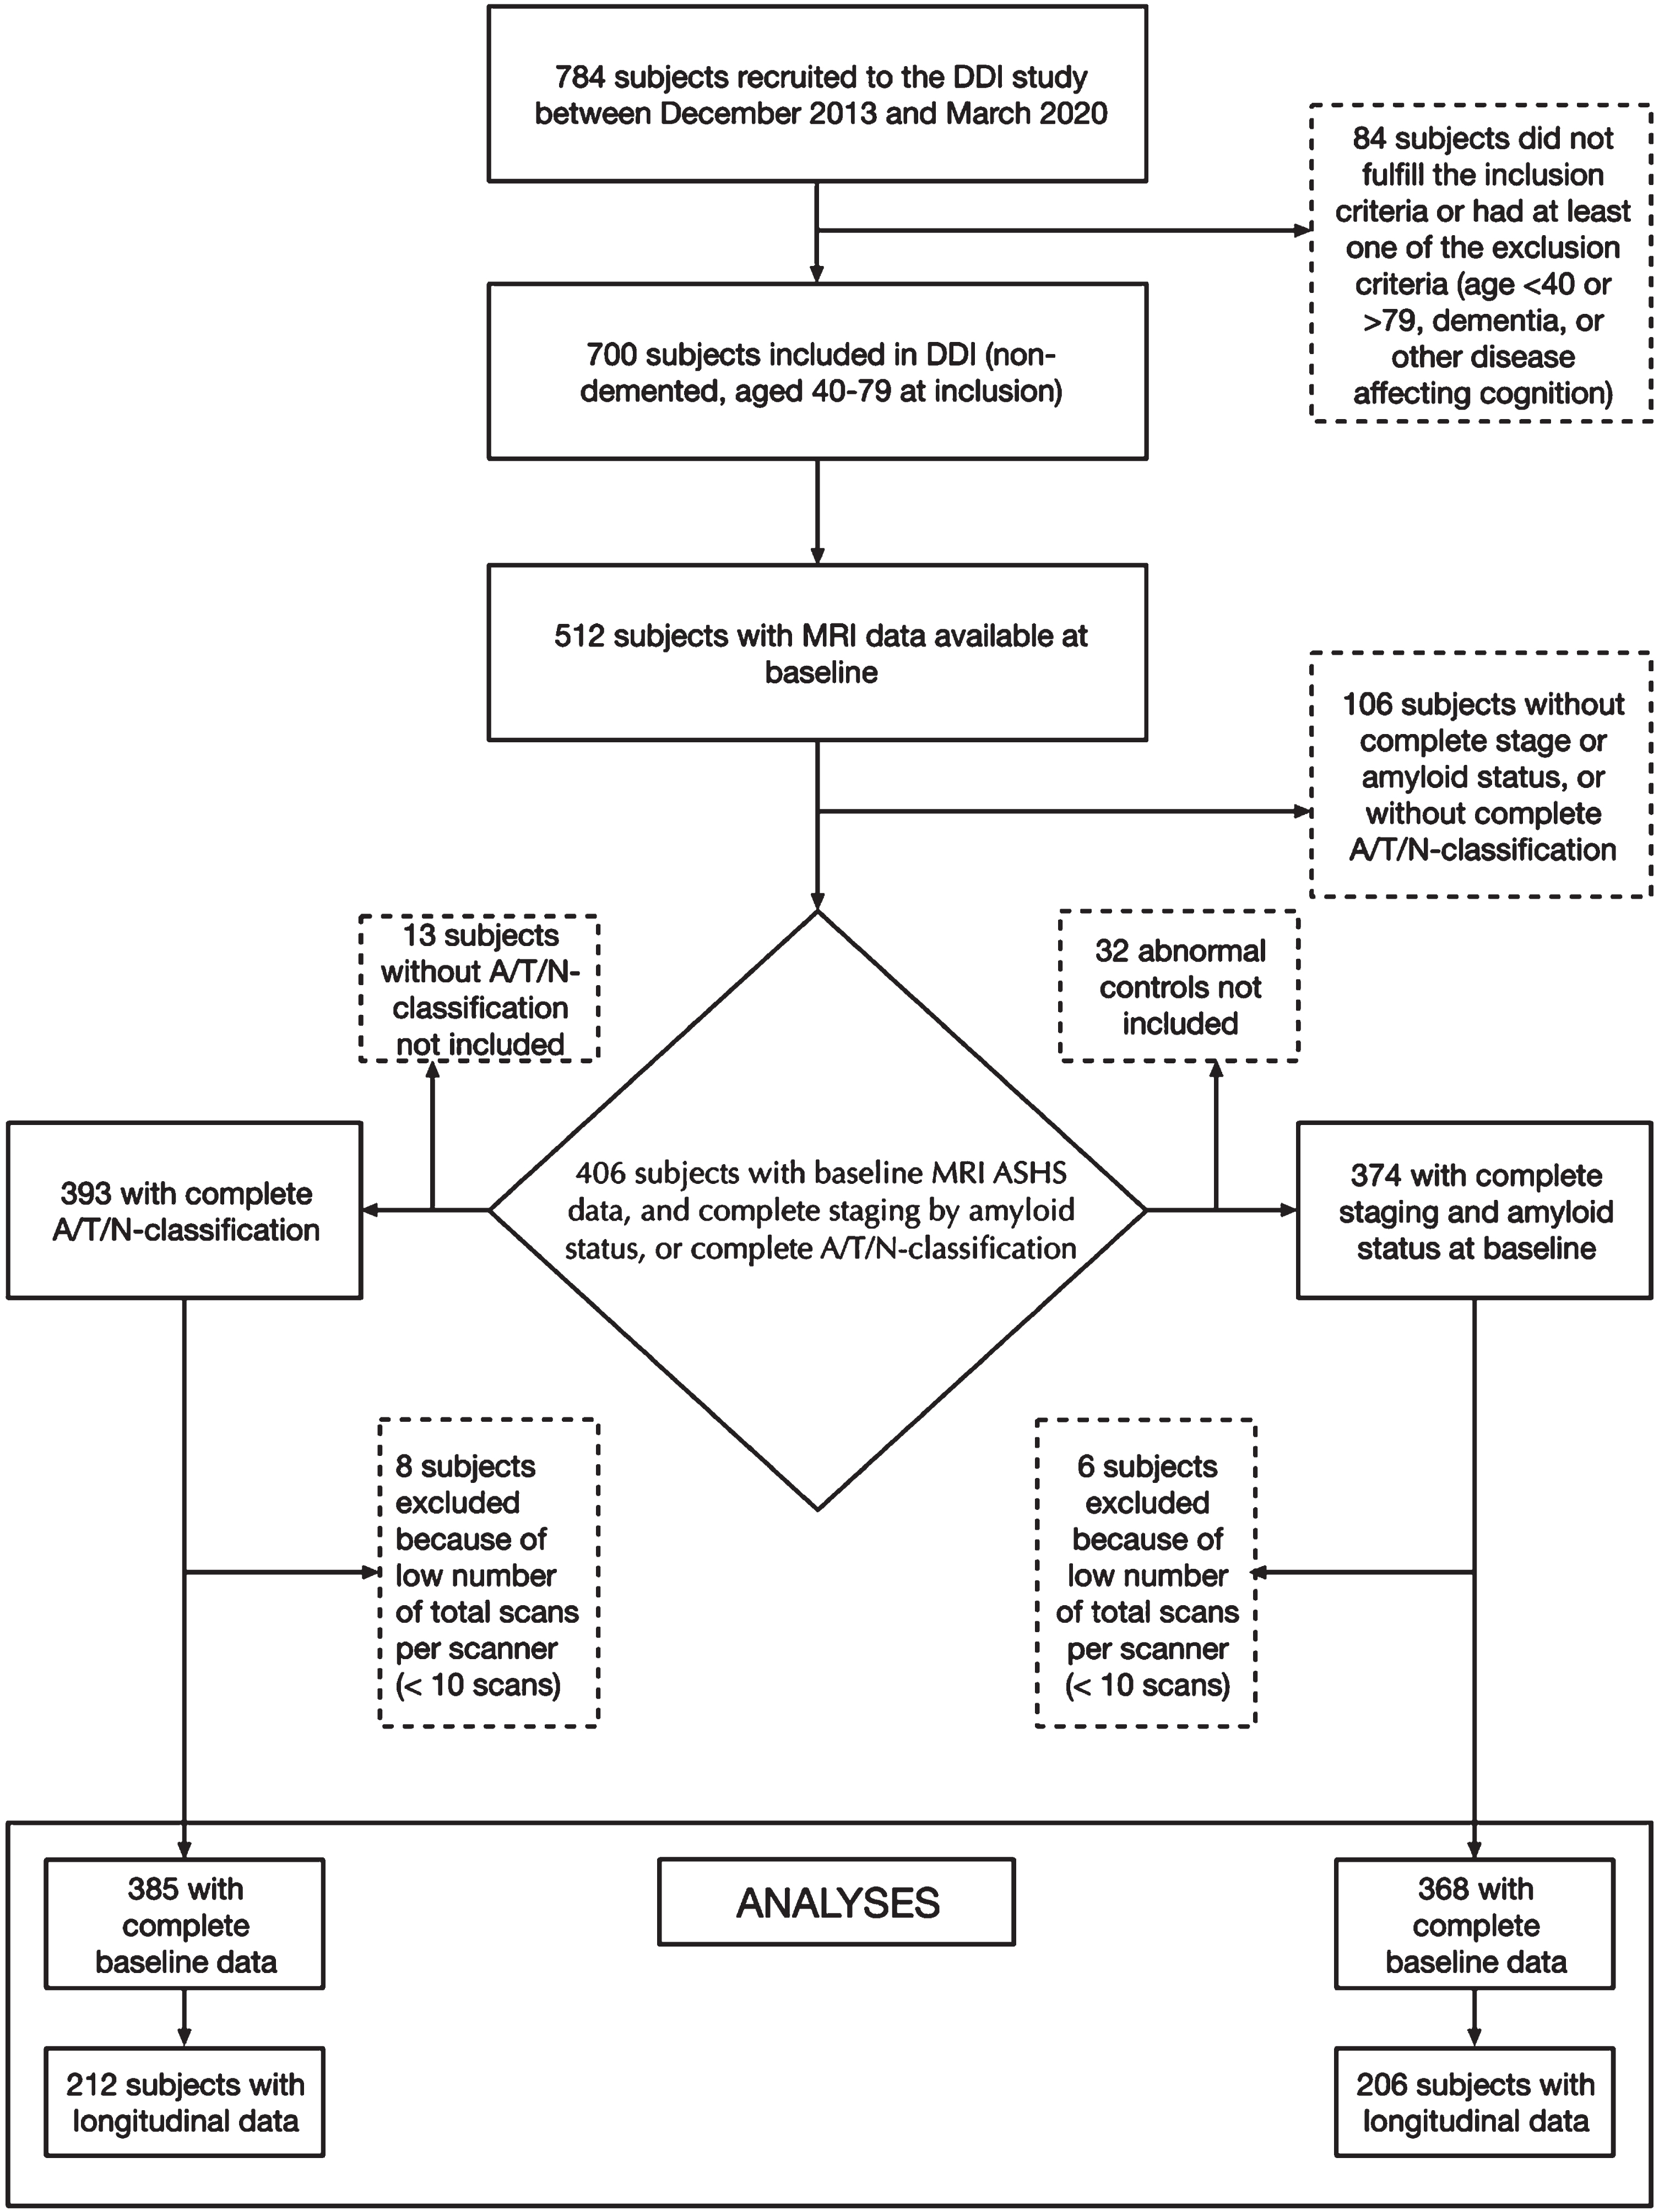
Table 2
Baseline cohort demographics stratified by stage and amyloid status, and by A/T/N– classification
| Total | NC A– | SCD A– | SCD A+ | MCI A– | MCI A+ | A–/T–/N– | A–/T+ or N+ | A+/T–/N– | A+/T+ or N+ | |
| (N = 406) | (N = 58) | (N = 114) | (N = 44) | (N = 74) | (N = 78) | (N = 222) | (N = 22) | (N = 65) | N = 76 | |
| Age Mean (SD) | 63.7 (9.22) | 60.4 (9.03) | 61.0 (8.47) | 69.0 (6.78)*** | 61.1 (9.61) | 67.6 (7.67)*** | 61.1 (8.67) | 61.9 (10.7) | 68.0 (6.71)*** | 67.3 (8.32)*** |
| Female/Total | 222/406 | 33/58 | 60/114 | 24/44 | 47/74 | 39/78 | 123/222 | 10/22 | 38/65 | 34/76 |
| Female% | (54.7%) | (56.9%) | (52.6%) | (54.5%) | (63.5%) | (50.0%) | (55.4%) | (45.5%) | (58.5%) | (44.7%) |
| APOE ɛ4 carrier/Total | 203/406 | 27/58 | 34/114*** | 29/44 | 30/74* | 61/78*** | 77/222 | 9/22 | 45/65 | 60/76 |
| (APOE ɛ4 carrier %) | 50.0%) | (46.6%) | (29.8) | (65.9%) | (40.5%) | (78.2%) | (34.7%) | (40.9%)*** | (69.2%)*** | (78.9%)*** |
| MMS-SE total score | 29 (2.0) | 30 (1.75) | 30 (1.0) | 29 (2.0)* | 29 (3.0)*** | 27 (3.0)*** | 29 (2.0) | 29.5 (1.0) | 28 (3.0)*** | 27 (3.0)*** |
| Median (IQR) | (N = 403) | (N = 58) | (N = 114) | (N = 44) | (N = 73) | (N = 77) | (N = 220) | (N = 22) | (N = 65) | (N = 76) |
| Geriatric Depression Scale | 1 (2.0) | 0 (1.0) | 2 (3.0)*** | 2 (2.5)*** | 2.50 (4.0)*** | 2 (2.0)*** | 1 (2.0) | 1 (1.0) | 2 (2.0) | 1 (3.0) |
| Median (IQR) | (N = 388) | (N = 64) | (N = 108) | (N = 44) | (N = 78) | (N = 75) | (N = 211) | (N = 21) | (N = 64) | (N = 71) |
| CERAD delayed recall | 6 (4.0) | 8(2.0) | 8 (3.0) | 7 (3.0)** | 5 (3.0)*** | 3 (4.0)*** | 7 (3.5) | 7.5 (2.0) | 5.5 (4.0)*** | 3 (5.0)*** |
| Median (IQR) | (N = 402) | (N = 58) | (N = 113) | (N = 43) | (N = 73) | (N = 79) | (N = 219) | (N = 22) | (N = 63) | (N = 76) |
| Education years | 13 (4.0) | 14 (4.0) | 14 (4.0) | 13 (5.0) | 13 (4.25) | 13 (4.0) | 14 (4.0) | 12.5 (4.0) | 15 (5.0) | 13 (4.0) |
| Median (IQR) | (N = 400) | (N = 58) | (N = 113) | (N = 44) | (N = 72) | (N = 76) | (N = 221) | (N = 22) | (N = 64) | (N = 75) |
| Longitudinal cases/Total | 229/406 | 35/58 | 73/114 | 27/44 | 39/74 | 32/78** | 132/222 | 13/22 | 36/65 | 31/76** |
| (%) | (56.4%) | (60.3%) | (64.0%) | (61.4%) | (52.7%) | (41.0%) | (59.5%) | (59.1%) | (55.4%) | (40.8%) |
| Total years of follow-up | 2.18 (1.80) | 2.17 (0.72) | 2.17 (0.75) | 2.34 (2.01) | 2.64 (1.93) | 2.06 (1.72)* | 2.17 (1.78) | 2.26 (1.35) | 2.18 (2.07) | 2.15 (1.77)** |
| (longitudinal cases) | (N = 229) | (N = 35) | (N = 73) | (N = 27) | (N = 39) | (N = 32) | (N = 132) | (N = 13) | (N = 36) | (N = 31) |
| Median (IQR) | ||||||||||
| Cerebrospinal fluid Aβ42/40 | 0.094 (0.017) | 0.100 (0.016) | 0.106 (0.012)* | 0.054 (0.015)*** | 0.100 (0.017) | 0.051 (0.011)*** | 0.103 (0.014) | 0.108 (0.020) | 0.057 (0.013)*** | 0.049 (0.011)*** |
| ratio | (N = 384) | (N = 53) | (N = 105) | (N = 43) | (N = 70) | (N = 76) | ||||
| Median (IQR) | ||||||||||
| Cerebrospinal fluid total-tau | 330.0 (229.5) | 270.0 (147.0) | 280.0 (130) | 425.0 (264)*** | 267.5 (171) | 586.0 (533.8)*** | 260 (123.0) | 476 (134.5)*** | 352.5 (104.8)*** | 777 (421.5)*** |
| Median (IQR) | (N = 391) | (N = 55) | (N = 108) | (N = 43) | (N = 72) | (N = 76) | ||||
| Cerebrospinal fluid | 54.0 (28.5) | 48.0 (15.0) | 48.5 (17.3) | 67.0 (30.5)*** | 47.4 (18.5) | 81.5 (58.8)*** | 46 (16.0) | 79 (13.5)*** | 57 (13.5)*** | 97.5 (48.0)*** |
| phosphorylated-tau | (N = 391) | (N = 55) | (N = 108) | (N = 43) | (N = 72) | (N = 76) | ||||
| Median (IQR) |
Mean and standard deviation (SD) are shown for continuous data with normal distribution, group differences were assessed by independent samples t-tests. Median and interquartile range are shown for continuous data with non-normal distribution, group differences were evaluated by Mann-Whitney U tests. Frequencies and percentages are shown for categorical variables, group differences evaluated by chi-square tests. In all the statistical tests, SCD–, SCD+, MCI–, and MCI+ were compared to NC–, and A–/T+ or N+, A+/T–/N–, and A+/T+ or N+ were compared to A–/T–/N–. The column named Total included all subjects with ASHS (Automated segmentation of hippocampal subfields) -data that were possible to classify according to staging and amyloid-status, or according to the A/T/N-system. Test results with p < 0.05 (*), p < 0.01 (**), and p < 0.001 (***) indicated significant results. Adjustments for multiple comparisons were not performed for these data.
Table 3
Overview of baseline diagnosis (stage by amyloid or A/T/N-classification), and diagnosis at last follow-up
| A) Stage by amyloid | ||||||||||||
| Stage by amyloid status at last follow-up | No stage at last follow-up | Total | ||||||||||
| Stage by amyloid at baseline | NC A– | NC A+ | AC A– | AC A+ | SCD A– | SCD A+ | MCI A– | MCI A+ | Dem A– | Dem A+ | ||
| NC A– | 22 | 1 | 2 | 0 | 1 | 1 | 0 | 0 | 0 | 0 | 8 | 35 |
| SCD A– | 0 | 0 | 0 | 0 | 53 | 0 | 6 | 1 | 0 | 0 | 13 | 73 |
| SCD A+ | 0 | 0 | 0 | 0 | 1 | 18 | 0 | 5 | 0 | 2 | 1 | 27 |
| MCI A– | 0 | 0 | 0 | 0 | 9 | 2 | 18 | 2 | 0 | 0 | 8 | 39 |
| MCI A+ | 0 | 0 | 0 | 0 | 0 | 3 | 0 | 19 | 0 | 10 | 0 | 32 |
| Total | 22 | 1 | 2 | 0 | 64 | 24 | 24 | 27 | 0 | 12 | 30 | 206 |
| Stage by amyloid status at baseline (only subjects with at least one follow-up), and diagnosis at last follow-up. NC, normal controls; AC, abnormal controls; SCD, subjective cognitive decline; MCI, mild cognitive impairment; A–, amyloid negative, A+, amyloid positive). | ||||||||||||
| B) A/T/N– classification | ||||||
| A/T/N– classification at last follow-up | No ATN-status at last follow-up | Total | ||||
| A/T/N– classification at baseline | A–/T–/N– | A–/T+ or N+ | A+/T–/N– | A+/T+ or N+ | ||
| A–/T–/N– | 88 | 4 | 1 | 0 | 31 | 132 |
| A–/T+ or N+ | 5 | 6 | 0 | 0 | 2 | 13 |
| A+/T–/N– | 6 | 0 | 19 | 1 | 8 | 36 |
| A+/T+ or N+ | 2 | 1 | 8 | 30 | 0 | 31 |
| Total | 101 | 11 | 28 | 31 | 41 | 212 |
Stage by A/T/N-classification at baseline (only subjects with at least one follow-up), and classification at last follow-up.
Group differences by staging and amyloid status
Baseline subregional volumes, and baseline- and longitudinal differences according to cognitive staging by amyloid status are described in Table 4A, detailed results from linear mixed regression models are described in Table 5A, and graphical presentation of longitudinal subregional volume change is presented in Fig. 2A.
Fig. 2
Graphics: MTL subregional longitudinal volume loss. Longitudinal plots of ERC and Posterior hippocampus volume loss according to A) Clinical staging and amyloid status and B) A/T/N classification.
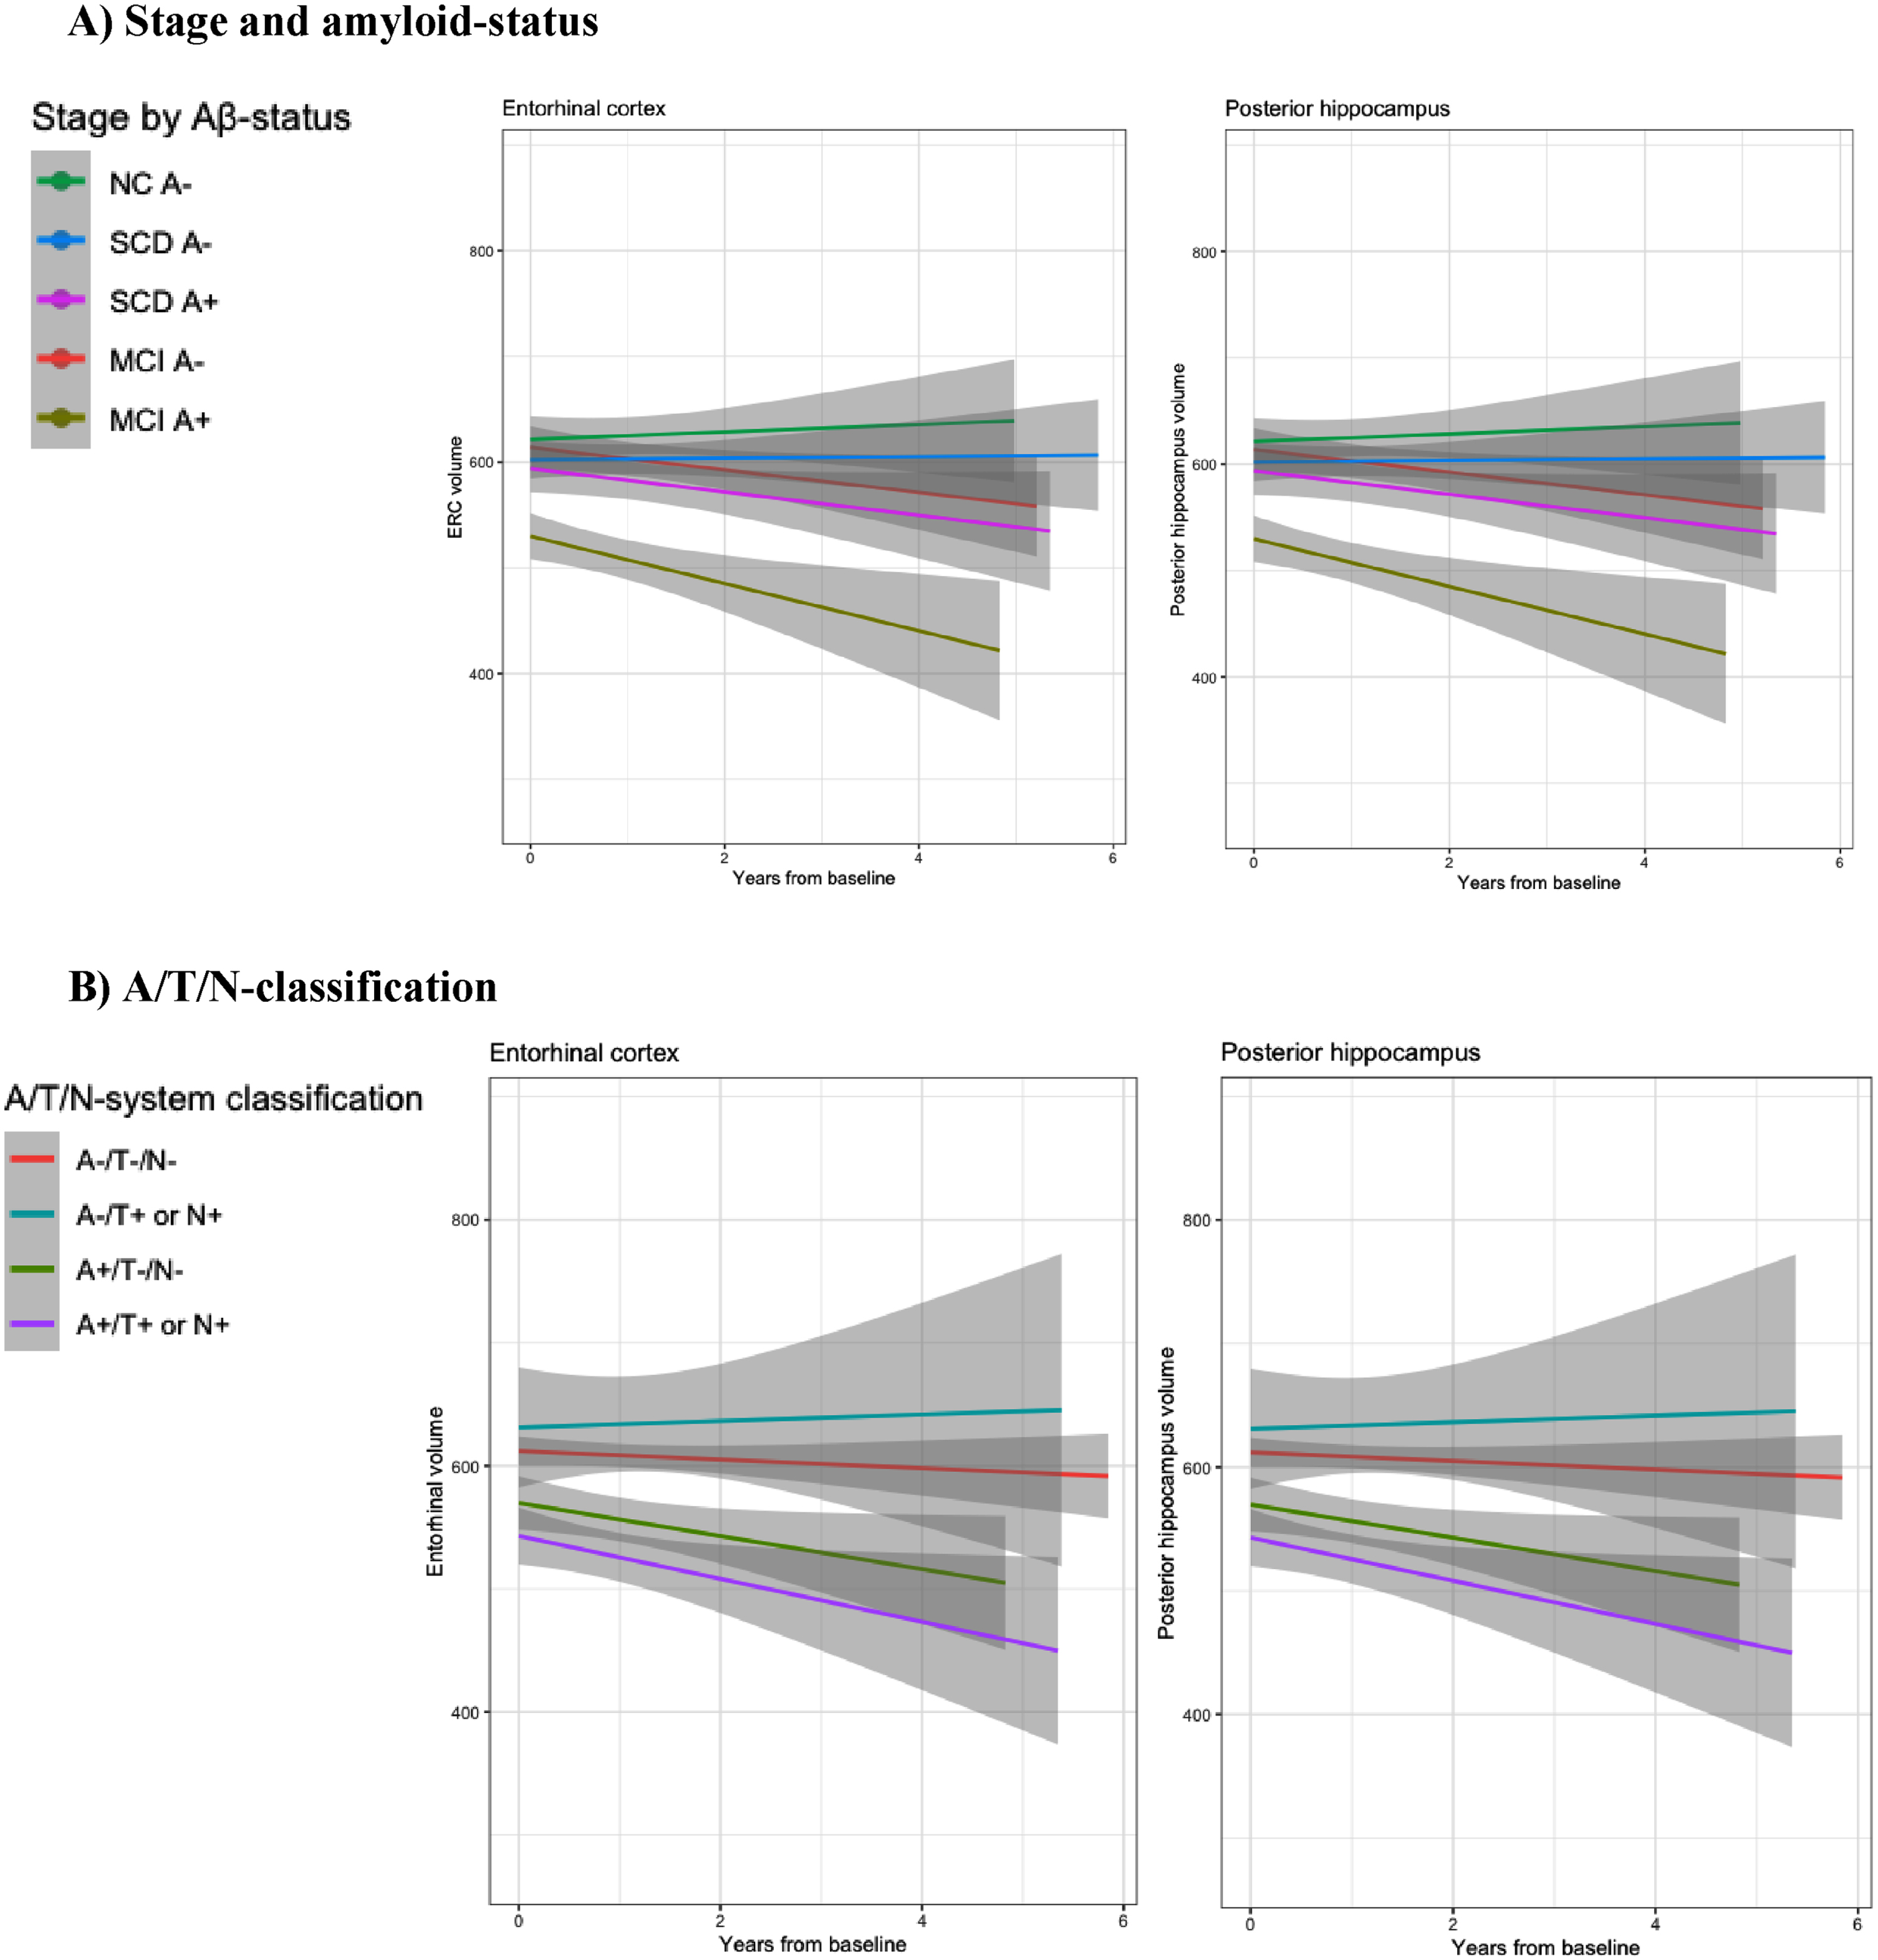
Table 4
Mean (SD) of baseline MTL (medial temporal lobe) subregional volumes (raw volumes, not corrected for intracranial volume, given in mm3) by stage and amyloid status (A), and ATN-classification (B). ASHS (Automated Segmentation of Hippocampal Subfields) were used to determine volumes of extrahippocampal subregions, anterior and posterior hippocampus. Group differences were assessed by linear mixed models. SCD A–, SCD A+, MCI A– and MCI A+ were compared to NC A–, and A–/T+ or N+, A+/T–/N–, and A+/T+ or N+ were compared to A–/T–/N–. We used Holm-Bonferroni to adjust for multiple comparisons, and adjusted values of p < 0.05 (*), p < 0.01 (**), and p < 0.001 (***) indicated significant results. Significant results at baseline were given on the left side of the «/», and significant results longitudinally were given on the right side of the «/» (i.e., A+/T–/N– compared to A–/T–/N–, Entorhinal cortical volume was not significantly different at baseline, but had significant volume-loss longitudinally, expressed as ⪡n.s./***⪢ in the table
| A) MTL by stage and amyloid status | ||||||
| MTL subregion | Total | NC A– | SCD A– | SCD A+ | MCI A– | MCI A+ |
| Longitudinal cases/Total | 206/368 | 35/58 | 73/114 | 27/44 | 39/74 | 32/78 |
| (% longitudinal cases) | (56.0%) | (60.3%) | (64.0%) | (61.4%) | (52.7%) | (41.0%) |
| Entorhinal cortex | ||||||
| Mean in mm3 (SD) | 591 (97.7) | 620 (82.1) | 603 (104.0) | 591 (79.9) | 614 (85.4) | 532 (95.6) |
| Baseline/longitudinal results | ***/*** | |||||
| BA 35 | 591 (100) | 605 (85.5) | 608 (94.9) | 610 (96.0) | 604 (93.7) | 533 (107) |
| Mean in mm3 (SD) | ||||||
| Baseline/longitudinal results | ||||||
| BA 36 | 1910 (335) | 1980 (320.0) | 2000 (346) | 1890 (314) | 1870 (335) | 1790 (298) |
| Mean in mm3 (SD) | ||||||
| Baseline/longitudinal results | ||||||
| PHC | 996 (145) | 988 (126) | 1050 (137) | 991 (153) | 998 (139) | 924 (143) |
| Mean in mm3 (SD) | n.s./*** | |||||
| Baseline/longitudinal results | ||||||
| Anterior hippocampus | 1720 (289) | 1750 (217) | 1740 (288) | 1810 (258) | 1770 (283) | 1560 (303)*/*** |
| Mean in mm3 (SD) | n.s./*** | |||||
| Baseline/longitudinal results | ||||||
| Posterior hippocampus | 1630 (199) | 1660 (166) | 1680 (174) | 1660 (208) | 1680 (187) | 1490 (198)***/*** |
| Mean in mm3 (SD) | n.s./*** | |||||
| Baseline/longitudinal results | ||||||
| B) MTL by A/T/N– classification | |||||
| MTL subregion | Total | A–/T–/N– | A–/T+ or N+ | A+/T–/N– | A+/T+ or N+ |
| (N = 385) | (N = 222) | (N = 22) | (N = 65) | (N = 76) | |
| Longitudinal cases/Total | 212/385 | 132/222 | 13/22 | 36/65 | 31/76 |
| (% longitudinal cases) | (55.1%) | (59.5%) | (59.1%) | (55.4%) | (40.8%) |
| Entorhinal cortex | |||||
| Mean in mm3 (SD) | 592 (99.2) | 613 (92.4) | 624 (121.0) | 572 (94.5) | 541 (95.8) |
| Baseline/longitudinal results | n.s./*** | ***/*** | |||
| BA 35 | |||||
| Mean in mm3 (SD) | 589 (101.0) | 605 (93.3) | 594 (96.4) | 566 (99.9) | 563 (118) |
| Baseline/longitudinal results | n.s./*** | n.s./* | |||
| BA 36 | |||||
| Mean in mm3 (SD) | 1910 (333.0) | 1960 (337.0) | 1940 (383.0) | 1830 (286.0) | 1830 (320) |
| Baseline/longitudinal results | |||||
| PHC | |||||
| Mean in mm3 (SD) | 994 (148.0) | 1020 (138.0) | 1030 (161) | 929 (130.0) | 956 (163.0) |
| Baseline/longitudinal results | n.s./** | n.s./*** | |||
| Anterior hippocampus | |||||
| Mean in mm3 (SD) | 1720 (294.0) | 1760 (272.0) | 1750 (308) | 1700 (301.0) | 1590 (317.0) |
| Baseline/longitudinal results | n.s./*** | n.s./*** | |||
| Posterior hippocampus | |||||
| Mean in mm3 (SD) | 1630 (207) | 1690 (180.0) | 1660 (182.0) | 1590 (182) | 1500 (245.0) |
| Baseline/longitudinal results | n.s./*** | ***/*** | |||
Table 5
Results from linear mixed regression models of medial temporal lobe volumes. Baseline group differences by stage and amyloid status, or by A/T/N-classification, were calculated by using subregional volume as dependent variable, gender, age and stage as fixed effects, and subject as random effects. Additionally, time interaction with stage or by A/T/N were added as a fixed effect to model longitudinal changes in subregional volumes
| A) Subjects grouped by stage and amyloid status | |||||||||||||
| Model | Entorhinal cortex ∼ stage by amyloid | BA 35 ∼ stage by amyloid | BA 36 ∼ stage by amyloid | PHC ∼ stage by amyloid | Anterior hippocampus ∼ stage by amyloid | Posterior hippocampus ∼ stage by amyloid | |||||||
| Parameter | df | Coef. (std.) | p | Coef. (std.) | p | Coef. (std.) | p | Coef. (std.) | p | Coef. (std.) | p | Coef. (std.) | p |
| [95% CI] | [95% CI] | [95% CI] | [95% CI] | [95% CI] | [95% CI] | ||||||||
| Intercept | 604 | 0.21 | <0.001 | 0.10 | <0.001 | 0.08 | <0.001 | – 0.09 | <0.001 | 0.10 | <0.001 | 0.28 | <0.001 |
| [– 0.03, 0.45] | [– 0.15, 0.35] | [– 0.14, 0.31] | [– 0.35, 0.18] | [– 0.14, 0.35] | [0.03, 0.52] | ||||||||
| Age | 604 | – 0.14 | 0.004 | – 0.27 | <0.001 | – 0.25 | <0.001 | – 0.25 | <0.001 | – 0.19 | <0.001 | – 0.08 | 0.083 |
| [– 0.23, – 0.04] | [– 0.37, – 0.17] | [– 0.34, – 0.17] | [– 0.36, – 0.15] | [– 0.28, – 0.09] | [– 0.18, 0.01] | ||||||||
| Gender | 604 | 0.20 | 0.057 | – 0.07 | 0.531 | 0.29 | 0.002 | – 0.03 | 0.797 | 0.11 | 0.274 | 0.01 | 0.912 |
| [– 0.01, 0.40] | [– 0.27, 0.14] | [0.11, 0.48] | [– 0.24, 0.19] | [– 0.09, 0.31] | [– 0.19, 0.22] | ||||||||
| APOE ɛ4 | 604 | – 0.05 | 0.595 | 0.01 | 0.912 | – 0.07 | 0.387 | – 6.56e-03 | 0.949 | – 0.09 | 0.366 | – 0.22 | 0.020 |
| [– 0.23, 0.13] | [– 0.18, 0.20] | [– 0.24, 0.09] | [– 0.21, 0.19] | [– 0.27, 0.10] | [– 0.40, – 0.03] | ||||||||
| ICV | 604 | 0.31 | <0.001 | 0.34 | <0.001 | 0.43 | <0.001 | 0.21 | <0.001 | 0.34 | <0.001 | 0.39 | <0.001 |
| [0.21, 0.40] | [0.24, 0.43] | [0.35, 0.51] | [0.11, 0.30] | [0.25, 0.42] | [– 1.19, – 0.59] | ||||||||
| SCD A– | 604 | – 0.22 | 1.00 | 0.01 | 0.948 / 1.00 | – 0.03 | 1.00 | 0.39 | 0.151 | – 0.09 | 1.00 | – 0.04 | 1.00 |
| [– 0.48, 0.04] | [– 0.25, 0.27] | [– 0.26, 0.21] | [0.11, 0.67] | [– 0.35, 0.17] | [– 0.31, 0.22] | ||||||||
| SCD A+ | 604 | – 0.24 | 1.00 | 0.18 | 0.120/ 1.00 | – 0.08 | 1.00 | 0.16 | 1.00 | 0.26 | 0.591 | – 0.05 | 1.00 |
| [– 0.57, 0.10] | [– 0.16, 0.52] | [– 0.38, 0.23] | [– 0.20, 0.53] | [– 0.08, 0.60] | [– 0.39, 0.29] | ||||||||
| MCI A– | 604 | – 0.09 | 1.00 | 4.24e-04 | 0.976/ 1.00 | – 0.34 | 0.538 | 0.04 | 1.00 | 0.02 | 1.00 | – 7.99e-03 | 1.00 |
| [– 0.37, 0.19] | [– 0.29, 0.29] | [– 0.59, – 0.08] | [– 0.27, 0.35] | [– 0.26, 0.31] | [– 0.28, 0.29] | ||||||||
| MCI A+ | 604 | – 0.92 | <0.001 | – 0.57 | 0.056 | – 0.41 | 0.276 | – 0.37 | 1.00 | – 0.59 | 0.032 | – 0.89 | <0.001 |
| [– 1.22, – 0.62] | [– 0.87, – 0.27] | [– 0.68, – 0.14] | [– 0.69, – 0.05] | [– 0.89, – 0.29] | [– 1.19, – 0.59] | ||||||||
| Time | 604 | 0.01 | 0.773 | 0.01 | 0.779 | 0.05 | 0.092 | 0.03 | 1.00 | 0.06 | 0.018 | 0.05 | 0.077 |
| [– 0.07, 0.09] | [– 0.06, 0.08] | [– 0.01, 0.10] | [– 0.03, 0.08] | [0.01, 0.10] | [– 0.01, 0.11] | ||||||||
| SCD A– atrophy | 604 | 0.02 | 1.00 | 0.03 | 1.00 | – 3.75e-03 | 1.00 | – 1.91e-03 | 1.00 | – 0.01 | 1.00 | – 0.02 | 1.00 |
| [– 0.08, 0.11] | [– 0.06, 0.11] | [– 0.07, 0.06] | [– 0.06, 0.06] | [– 0.07, 0.04] | [– 0.09, 0.05] | ||||||||
| SCD A+ atrophy | 604 | – 0.14 | 0.187 | – 0.13 | 0.164 | – 0.05 | 0.231 | – 0.10 | 0.164 | – 0.14 | <0.001 | – 0.20 | <0.001 |
| [– 0.25, – 0.03] | [– 0.23, – 0.03] | [– 0.12, 0.03] | [– 0.17, – 0.02] | [– 0.20, – 0.08] | [– 0.28, – 0.12] | ||||||||
| MCI A– atrophy | 604 | – 0.07 | 1.00 | 6.54e-03 | 0.885 | – 0.07 | 0.490 | – 0.05 | 1.00 | – 0.06 | 0.587 | – 0.07 | 0.595 |
| [– 0.17, 0.03] | [– 0.08, 0.10] | [– 0.14, 0.00] | [– 0.12, 0.01] | [– 0.11, 0.00] | [– 0.15, 0.00] | ||||||||
| MCI A+ atrophy | 604 | – 0.25 | <0.001 | – 0.14 | 0.137 | – 0.10 | 0.137 | – 0.19 | <0.001 | – 0.16 | <0.001 | – 0.23 | <0.001 |
| [– 0.37, – 0.14] | [– 0.24, – 0.04] | [– 0.18, – 0.03] | [– 0.27, – 0.12] | [– 0.23, – 0.10] | [– 0.31, – 0.15] | ||||||||
| B) Subjects grouped by A/T/N– classification. | |||||||||||||
| Model | Entorhinal cortex ∼ A/T/N– classification | BA 35 ∼ A/T/N– classification | BA 36 ∼ A/T/N– classification | PHC ∼ A/T/N– classification | Anterior hippocampus ∼ A/T/N– classification | Posterior hippocampus ∼ A/T/N– classification | |||||||
| Parameter | df | Coef. (std.) | p | Coef. (std.) | p | Coef. (std.) | p | Coef. (std.) | p | Coef. (std.) | p | Coef. (std.) | p |
| [95% CI] | [95% CI] | [95% CI] | [95% CI] | [95% CI] | [95% CI] | ||||||||
| Intercept | 631 | 0.10 | <0.001 | 0.13 | <0.001 | – 0.03 | <0.001 | 0.17 | <0.001 | 0.08 | <0.001 | 0.32 | <0.001 |
| [– 0.06, 0.25] | [– 0.03, 0.29] | [– 0.17, 0.11] | [0.01, 0.34] | [– 0.08, 0.23] | [0.16, 0.47] | ||||||||
| Age | 631 | – 0.14 | 0.003 | – 0.26 | <0.001 | – 0.27 | <0.001 | – 0.26 | <0.001 | – 0.20 | <0.001 | – 0.09 | 0.050 |
| [– 0.23, – 0.05] | [– 0.35, – 0.16] | [– 0.35, – 0.18] | [– 0.36, – 0.16] | [– 0.29, – 0.11] | [– 0.18, 0.00] | ||||||||
| Gender | 631 | 0.15 | 0.135 | – 0.08 | 0.454 | 0.29 | 0.002 | – 0.06 | 0.608 | 0.12 | 0.250 | – 0.05 | 0.647 |
| [– 0.05, 0.36] | [– 0.29, 0.13] | [0.11, 0.48] | [– 0.27, 0.16] | [– 0.08, 0.32] | [– 0.25, 0.15] | ||||||||
| APOE ɛ4 | 631 | – 0.05 | 0.627 | – 0.05 | 0.607 | – 0.10 | 0.227 | – 0.09 | 0.354 | – 0.10 | 0.279 | – 0.21 | 0.025 |
| [– 0.23, 0.14] | [– 0.24, 0.14] | [– 0.27, 0.06] | [– 0.29, 0.10] | [– 0.29, 0.08] | [– 0.39, – 0.03] | ||||||||
| ICV | 631 | 0.34 | <0.001 | 0.35 | <0.001 | 0.42 | <0.001 | 0.25 | <0.001 | 0.34 | <0.001 | 0.43 | <0.001 |
| [0.24, 0.43] | [0.25, 0.45] | [0.34, 0.51] | [0.15, 0.34] | [0.26, 0.43] | [0.34, 0.52] | ||||||||
| A–/T+ or N+ | 631 | 0.14 | 1.00 | – 0.05 | 1.00 | 0.03 | 1.00 | 0.10 | 1.00 | 0.04 | 1.00 | – 0.03 | 1.00 |
| [– 0.22, 0.51] | [– 0.43, 0.33] | [– 0.30, 0.37] | [– 0.29, 0.49] | [– 0.33, 0.41] | [– 0.40, 0.33] | ||||||||
| A+/T–/N– | 631 | – 0.34 | 1.00 | – 0.23 | 1.00 | – 0.09 | 1.00 | – 0.44 | 0.127 | – 0.04 | 1.00 | – 0.39 | 0.571 |
| [– 0.59, – 0.09] | [– 0.50, 0.03] | [– 0.32, 0.14] | [– 0.70, – 0.17] | [– 0.29, 0.22] | [– 0.64, – 0.14] | ||||||||
| A+/T+or N+ | 631 | – 0.69 | <0.001 | – 0.25 | 1.00 | – 0.17 | 1.00 | – 0.28 | 1.00 | – 0.44 | 0.115 | – 0.79 | <0.001 |
| [– 0.94, – 0.45] | [– 0.50, 0.01] | [– 0.39, 0.05] | [– 0.55, – 0.02] | [– 0.68, – 0.19] | [– 1.04, – 0.55] | ||||||||
| Time | 631 | 1.28e-03 | 0.949 | 0.03 | 0.152 | 0.01 | 0.303 | 9.14e-03 | 0.538 | 0.03 | 0.011 | 0.02 | 0.139 |
| [– 0.04, 0.04] | [– 0.01, 0.06] | [– 0.01, 0.04] | [– 0.02, 0.04] | [0.01, 0.06] | [– 0.01, 0.05] | ||||||||
| A–/T+or N+ atrophy | 631 | – 0.02 | 1.00 | – 6.68e-03 | 1.00 | 0.07 | 0.607 | – 0.01 | 1.00 | 0.01 | 1.00 | 7.41e-03 | 1.00 |
| [– 0.14, 0.10] | [– 0.12, 0.10] | [– 0.01, 0.16] | [– 0.09, 0.07] | [– 0.06, 0.08] | [– 0.08, 0.09] | ||||||||
| A+/T–/N– atrophy | 631 | – 0.18 | <0.001 | – 0.16 | <0.001 | – 0.03 | 1.00 | – 0.10 | 0.005 | – 0.11 | <0.001 | – 0.17 | <0.001 |
| [– 0.26, – 0.10] | [– 0.24, – 0.09] | [– 0.09, 0.02] | [– 0.15, – 0.04] | [– 0.16, – 0.07] | [– 0.23, – 0.11] | ||||||||
| A+/T+ or N+ atrophy | 631 | – 0.21 | <0.001 | – 0.13 | 0.019 | – 0.05 | 0.921 | – 0.13 | <0.001 | – 0.13 | <0.001 | – 0.17 | <0.001 |
| [– 0.30, – 0.12] | [– 0.20, – 0.05] | [– 0.11, 0.01] | [– 0.18, – 0.07] | [– 0.18, – 0.08] | [– 0.23, – 0.10] | ||||||||
p < 0.05 indicated significant results. Negative coefficient, and p < 0.05 were considered significantly lower baseline volumes, and future atrophy when time-interaction were added. Holm-Bonferroni adjusted p-values are given for the results according to stage by amyloid status or by A/T/N classification.
In amyloid positive MCI compared to amyloid negative controls, there were significantly smaller volumes in ERC, anterior and posterior hippocampus (all p < 0.01), while BA35 were borderline significant smaller (p = 0.056).
Compared to amyloid negative normal controls, there were no significant baseline volume differences in neither amyloid negative nor positive SCD. Between baseline and last follow-up, there was no significant volume loss in normal controls (A–).
Compared to controls, significantly more atrophy (p < 0.001) was found in amyloid positive SCD in both anterior and posterior hippocampus (i.e., significantly more volume loss between baseline and follow-up in amyloid positive SCD than controls). MCI A+ had significant atrophy in ERC, PHC, anterior and posterior hippocampus (p < 0.001).
Group differences by A/T/N classification
Baseline subregional volumes, and baseline and longitudinal differences according to A/T/N classification are described in Table 4B, detailed results from linear mixed regression models are described in Table 5B, and a graphical presentation of longitudinal subregional volume change is presented in Fig. 2B.
Compared to A–/T–/N–, A+/T+orN+ had smaller ERC and posterior hippocampus, while the remaining MTL subregions were not significantly different. There were no baseline differences in the examined MTL subregions in A+/T–/N– compared to A–/T–/N–.
Between baseline and last follow-up, there was no significant volume loss in A–/T–/N–.
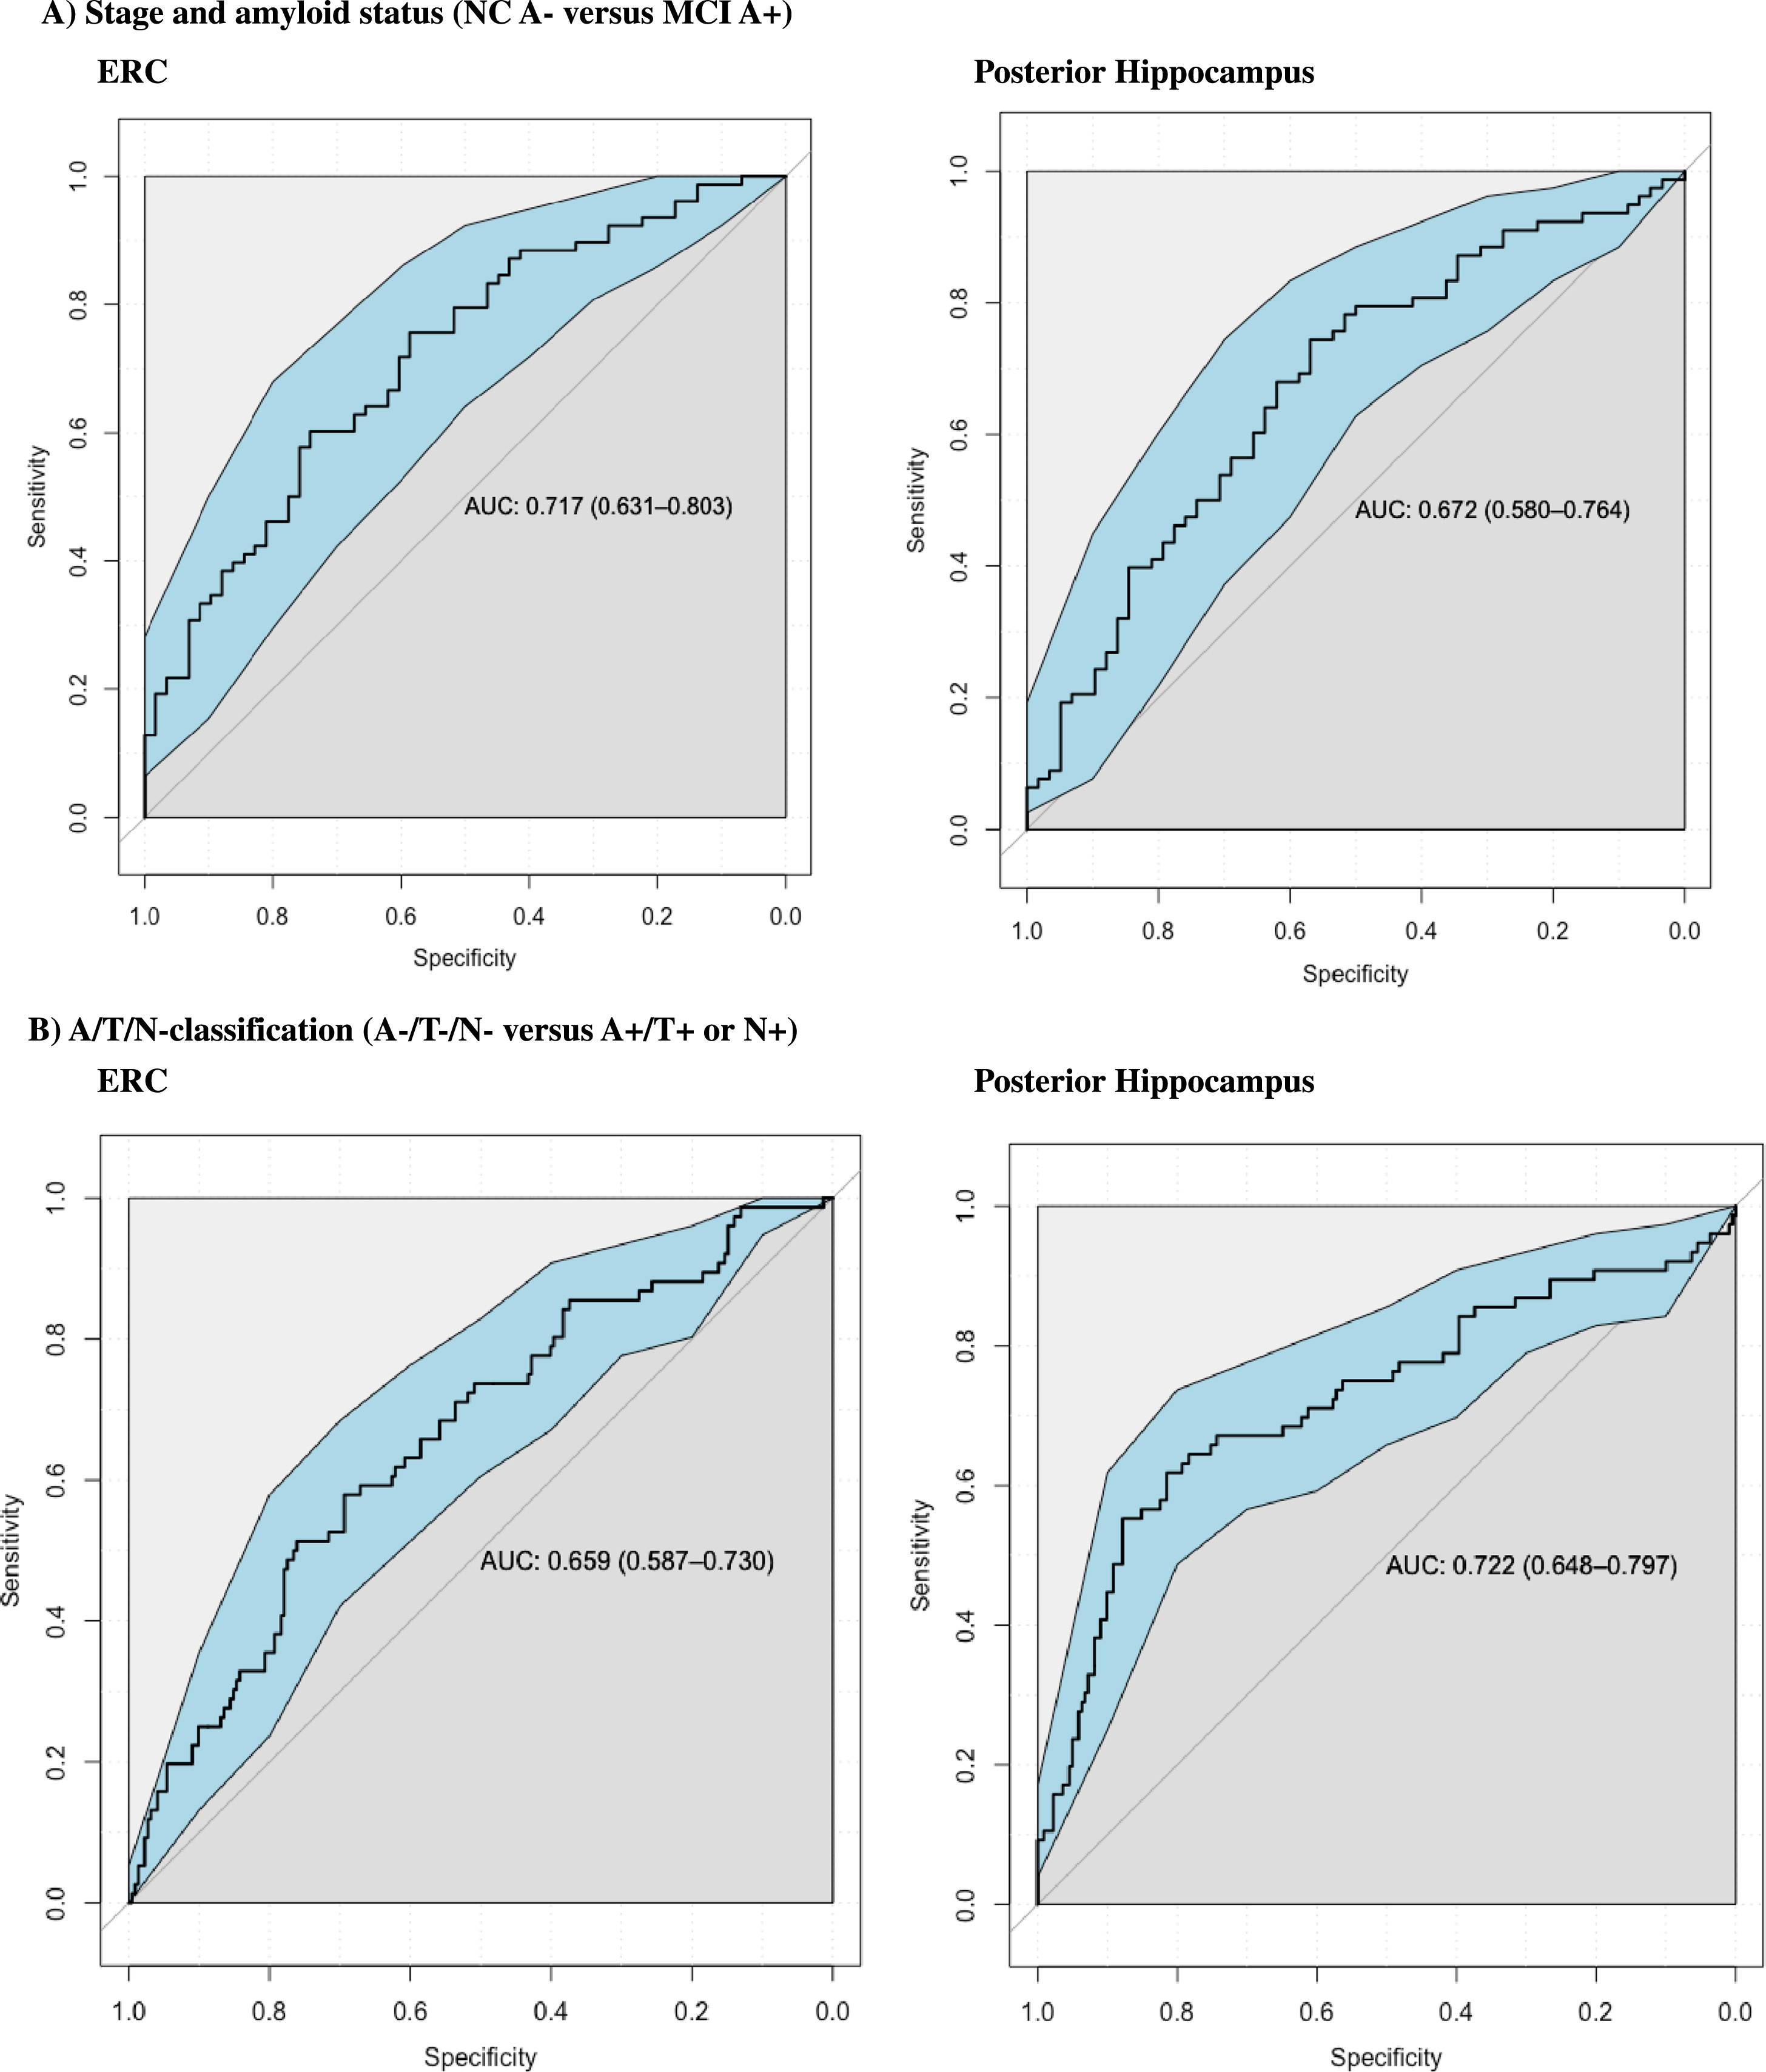
Fig. 3
Graphics: ROC curves. Additional ROC analysis were performed to examine the performance in classifying MCI A+ from NC A– controls at baseline. ERC and Posterior hippocampus had similar performance (ERC had Area under the curve (AUC) of 0,717 and Posterior Hippocampus had AUC of 0.672). ROC analyses were also performed to examine the performance in classifying A+/T+orN+ from biomarker negative controls (A–/T–/N–) at baseline, where both ERC and Posterior hippocampus also had similar performance (ERC had AUC of 0.659 and posterior hippocampus had AUC of 0.722).
Except for BA 36, there was significantly more atrophy (longitudinal volume loss) in all examined subregional volumes in both A+/T–/N– and A+/T+ or N+, compared to A–/T–/N– (p < 0.01 for all results).
ROC analysis
We found consistent baseline differences between amyloid positive MCI and amyloid negative controls, and between A+/T+ or N+ and biomarker negative controls. ERC and posterior hippocampus were the only subregions with highly significant (p < 0.001) lower baseline volumes in both MCI A+ compared to NC A–, and in A+/T+orN+ compared to A–/T–/N–. A supplementary ROC-analysis was therefore carried out to assess the clinical utility of these baseline subregional volumes to classify between these groups. We examined the performance in discriminating AD and controls based on clinical staging or A/T/N– classification. For subjects stratified according to stage and amyloid status, the ERC and the posterior hippocampus showed similar performance when classifying between normal amyloid negative controls (NC A–) and amyloid positive mild cognitive impairment (MCI A+) (posterior hippocampus had an Area Under the Curve (AUC) of 0.672 and ERC had AUC of 0.717). ERC and posterior hippocampus also had similar performance in classifying between biomarker negative controls (A–/T–/N–) and A+/T+ or N+ (ERC had AUC of 0.659, and posterior hippocampus had AUC of 0.722).
DISCUSSION
In this study, we investigated patterns of MTL atrophy in a well-defined multi-center clinical predementia cohort. Cross-sectionally, SCD A+ and A+/T–/N– compared to their respective controls, had no MTL subregions with lower baseline volumes, while more MTL subregions had lower baseline volumes in MCI A+ and in A+/T+ or N+ compared to their respective controls. Longitudinally, we found significantly more atrophy in several MTL subregions in both SCD A+ and MCI A+ compared to NC A–, as well as in A+/T–/N– and A+/T+ or N+ compared to A–/T–/N–.
Although we did not find cross-sectional group differences in several of the AD predilection regions, we did find longitudinal volume loss in the same areas, pointing towards these regions still being relevant as AD predilection sites also in this multi-site cohort. Also, we found that cerebral amyloid pathology combined with presence of objective cognitive decline, or CSF biomarker evidence of NFTs or neurodegeneration (pathological t-tau or p-tau), predicted more widespread and accelerated longitudinal volume loss in MTL.
Fig. 4
Overview of subregional segmentation by ASHS-T1 (including the hippocampal formation and MTL cortex).
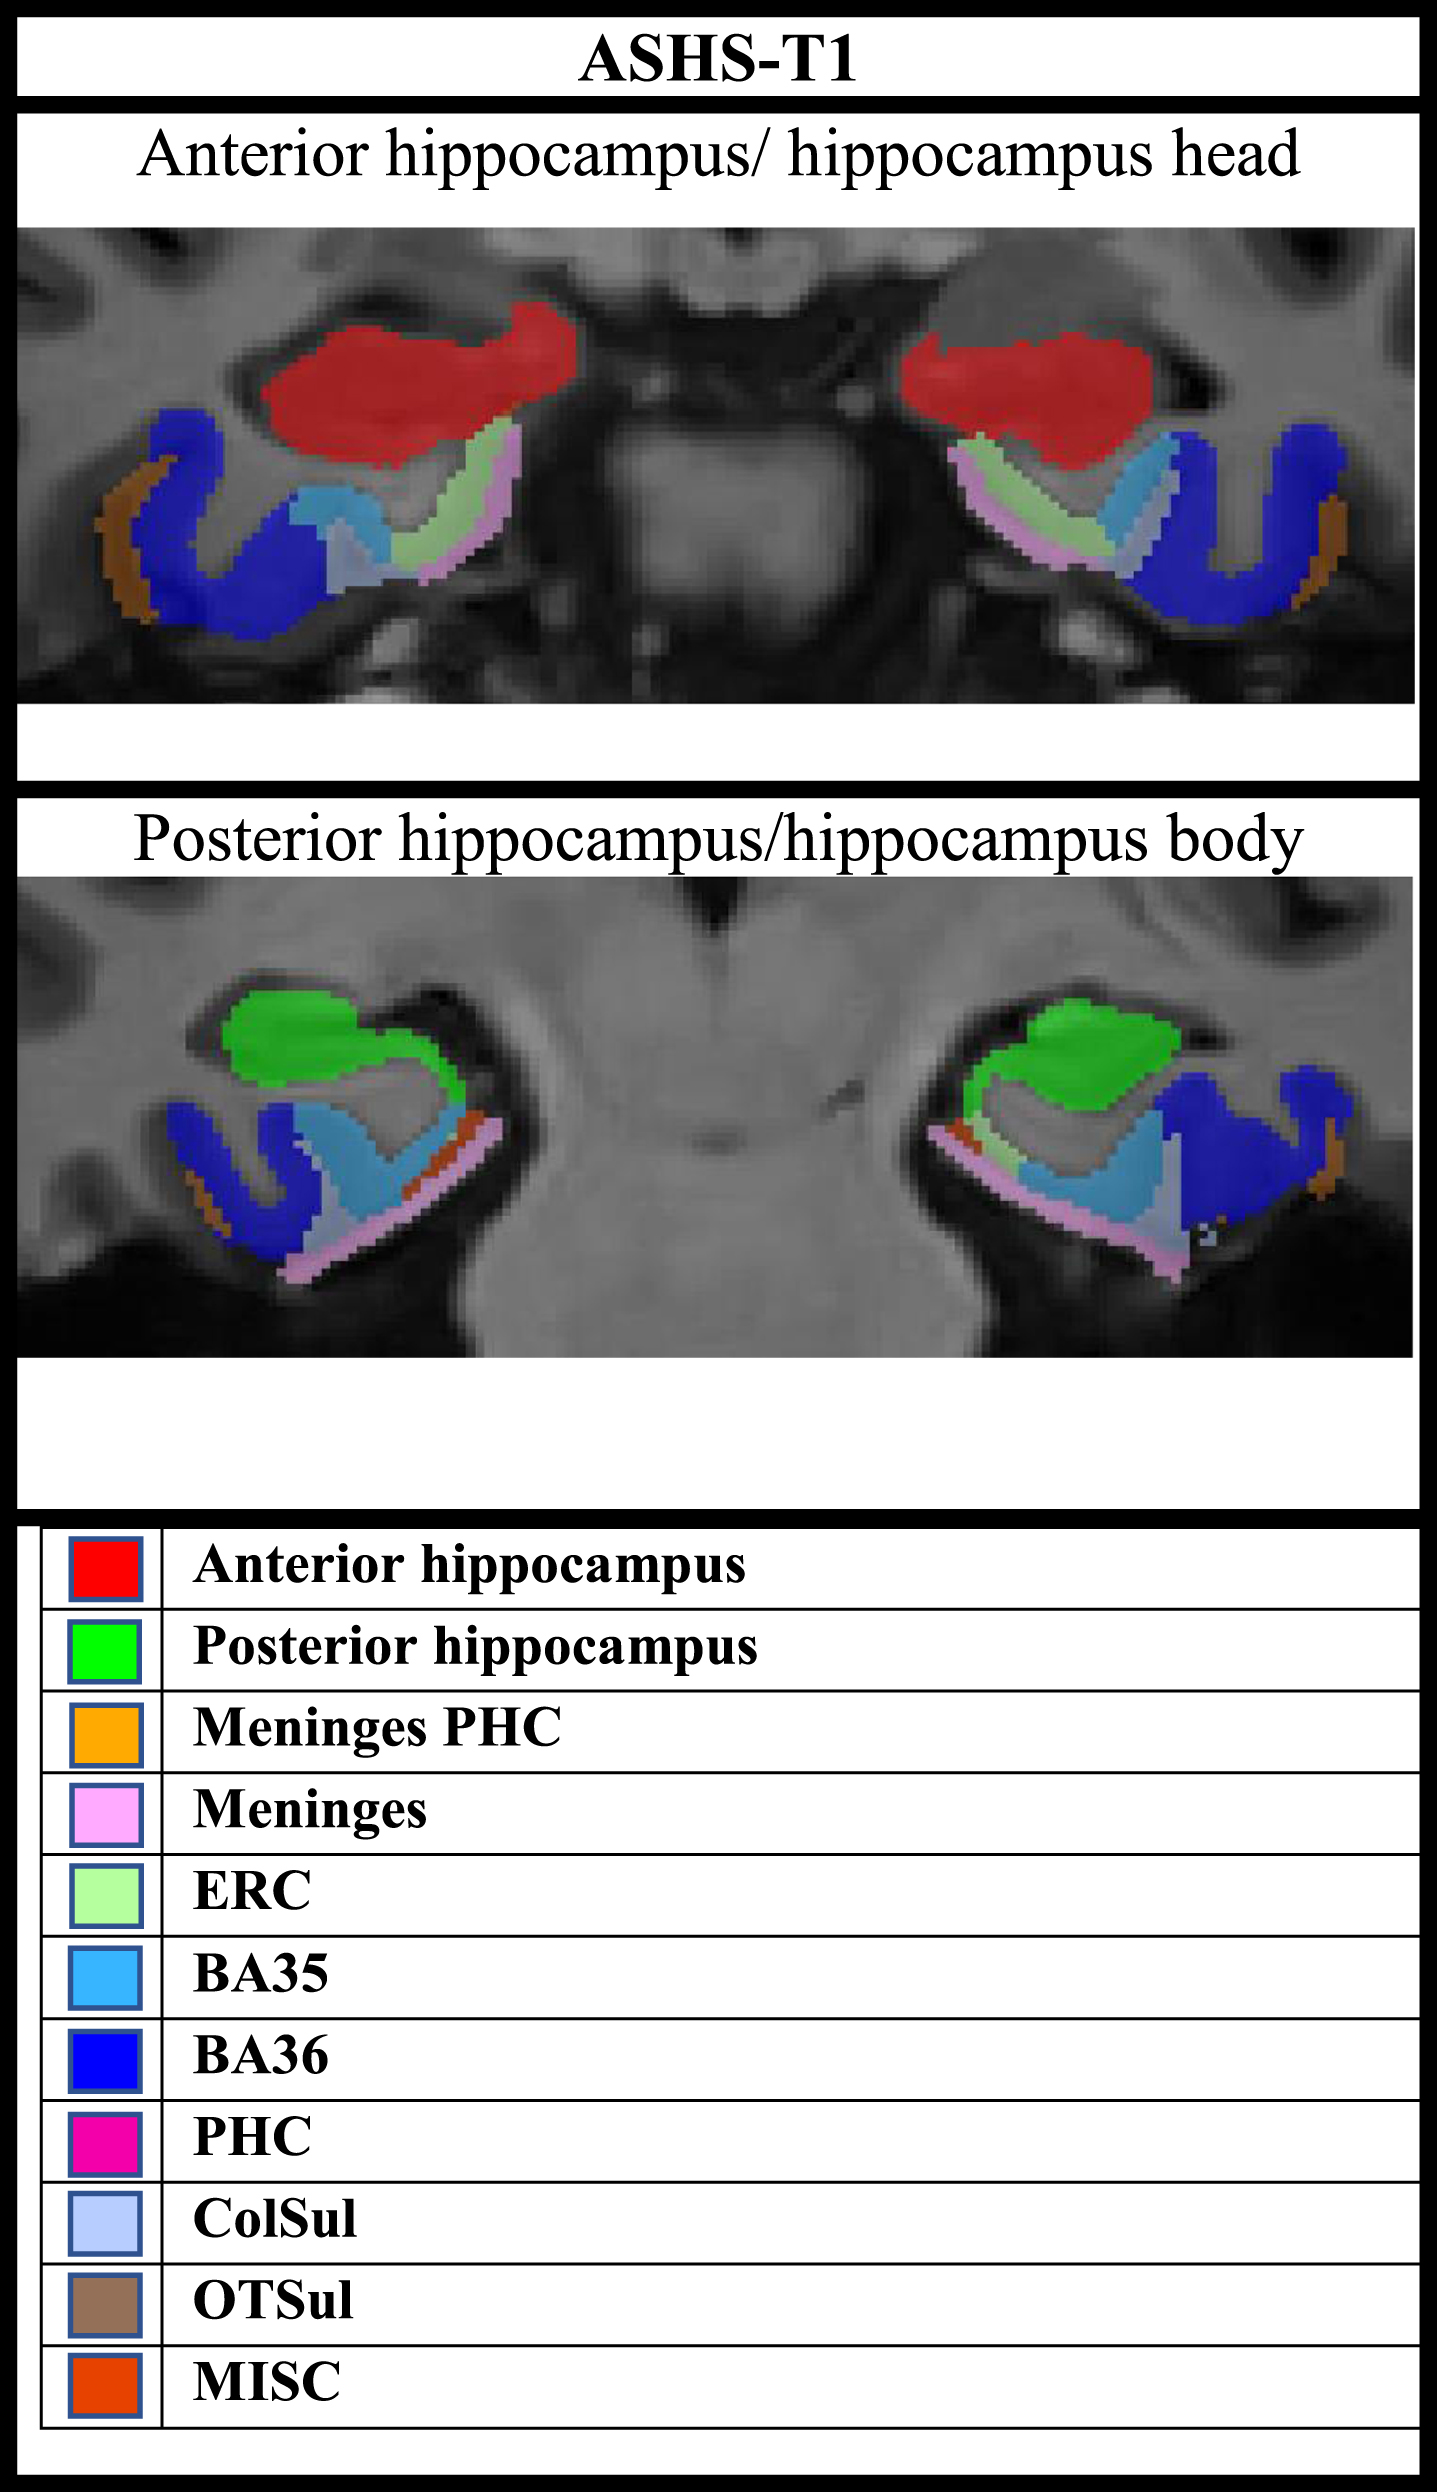
Fig. 5
Detailed overview of study design.
Our results are mainly in line with the distribution of neurodegenerative pathology according to the Braak NFT staging, where NFT pathology initially appears in the TEC (Braak stage 1) and ERC (Braak stage 1-2), but also relatively early in hippocampus (CA1 in Braak stage 2) [2]. It is widely accepted that NFT distribution and subregional atrophy in AD approximately share the same distribution pattern in AD, and the link between NFT and neuronal loss have been demonstrated experimentally [3]. In MRI studies, early AD related atrophy has been demonstrated in subregions affected in the first Braak stages, like ERC [26, 47–49] and TEC [19, 22, 23]. Although more studies have pointed to early atrophy in CA1, results from previous hippocampal volumetry studies are conflicting for many subfields [24, 25]. Variability in these results could possibly be related to the use of different protocols for delineation of these structures, but it may also be explained the fact that many of these studies were performed on T1-images with approximately 1 mm3 resolution, were the reliability of these subfields estimates may be questionable [33].
There are several possible explanations for the difference between our results and the studies reporting greater atrophy in TEC compared to ERC. In contrast to Xie et al., where ASHS-T1 thickness-based estimates of MTL cortex were used in a preclinical AD cohort [22], we used the same software to generate volume estimates, possibly explaining the different findings. The depth of the collateral sulcus greatly affects the location of BA35 in relation to ERC [50]. Even if both manual and automated delineation of these subregions accounts for the depth of the collateral sulcus, we cannot exclude deviations from the true borders based on cytoarchitectonic criteria, and this may possibly cause variability across study samples. Because volumes are also highly correlated to head-size and thus more challenging to interpret statistically, measures of thickness has usually been favored as a measure of cortical atrophy [51]. However, it was only possible to extract MTL cortex volume estimates from ASHS with the MRI sequences available in our study. Additionally, differences in clinical definition of predementia stages of AD, and differences in biomarker cut-offs may explain discrepancies.
The ASHS-T1 pipeline provides anterior-posterior segmentation of the hippocampus, but not detailed hippocampal subfield segmentation. For the ASHS-T1 pipeline, the anterior hippocampus includes the hippocampal head, and the last portion of the uncus defines the border between the anterior and posterior hippocampus, whilst the posterior hippocampus includes the body and tail [42, 52]. Our results suggest early volume-loss in both anterior and posterior hippocampus, where the posterior hippocampus seems to undergo atrophy at an earlier stage than the anterior, and possibly at a similar timepoint as ERC. Baseline volumes of the posterior hippocampus (but not anterior) were lower in A+/T+ or N+ compared to A–/T–/N–, and both the anterior and posterior hippocampus were smaller in amyloid positive MCI compared to amyloid negative normal controls (but more significant in posterior compared to anterior). Both the anterior and posterior hippocampus had significantly more longitudinal volume loss in both amyloid positive SCD and MCI compared to amyloid negative controls, while there was not significantly more ERC volume loss in amyloid positive SCD compared to controls.
The differences in atrophy across the anterior-posterior axis is not fully in line with the pattern described Braak and Braak [2]. This raises the question whether other mechanisms than NFT pathology could explain the relatively early occurring neuronal loss of the hippocampus, and in the posterior subregion in particular.
Diaschisis could be a possible mechanism responsible for atrophy in these subregions, where impaired neuronal function occur in areas that are neuronally connected but distant from the origin of neuropathology [53]. The perforant pathway connects the ERC to several hippocampal subfields [54], and early AD related atrophy in the hippocampus may be related to disconnection of hippocampal structures from ERC [55, 56].
An increasing body of evidence indicates that the anterior and posterior hippocampus may be functionally distinct units. The anterior hippocampus is mainly connected to limbic structures and involved in the dorsal attention network, while the posterior hippocampus is mainly connected to the parahippocampal cortex and involved in the default mode network. In contrast, the intrinsic connections between the anterior and posterior hippocampus seem to be sparse [57]. AD clinical symptoms may be caused by impaired connections between the default mode network and posterior hippocampus [58]. Loss of these connections with subsequent diaschisis may possibly explain why neuronal loss seems to occur earlier in the posterior hippocampus compared with the anterior hippocampus.
Our findings are also in line with early predominant atrophy in areas where amyloid pathology occur early. According to Thal et al, amyloid deposition occurs without coexistence of NFTs initially in the basal temporal isocortex (Thal phase 1), while in stage 2, amyloid appears in ERC and TEC, but also in the hippocampal subfields CA1 and presubiculum, before more widespread involvement of the hippocampal formation in stage 3 and 4 [10]. The link between amyloid deposition and increase in NFTs and atrophy downstream in the AD trajectory is not fully understood, especially because initial deposition of amyloid and NFTs are not similarly distributed. An increasing body of evidence points to synergistic effects between amyloid and tau-pathology, where also vascular and inflammatory pathology have been proposed as putative links [59]. Additionally, soluble amyloid species alone may have neurotoxic and possibly neurodegenerative effects, especially oligomers [60].
Another type of pathology that also may be involved in medial temporal atrophy with a clinical appearance similar to AD, is pathology related to Transactive response DNA binding protein of 43 kDa (TDP-43). TDP-43 pathology is common in subjects older than 80 years [61], and we cannot exclude the possibility of coexisting TDP-43 related pathology.
Cases with objective cognitive decline had significantly lower baseline volumes, in contrast to amyloid positive cases with subjective cognitive decline, when compared to cognitively normal amyloid negative subjects. Objective cognitive decline thus predicted significant neuronal loss at baseline in these subjects. Cognitive impairment, increased NFT-load and atrophy of the MTL are all closely connected in AD [62, 63]. A recent study suggests that cognitive impairment in AD MCI is more connected to tau-related MTL atrophy, while tau-related impairment of functional connectivity better explains cognitive symptoms in preclinical AD [64], which further supports that MTL atrophy is more pronounced and more accelerated in AD MCI compared to AD SCD. These results are also in line with the hypothetical model of AD biomarkers, where atrophy starts to accelerate when objective cognitive decline is present [9].
Most AD cases with normal levels of total- and phosphorylated tau (A+/T–/N–) had unchanged A/T/N classification at last follow-up (Table 3B), i.e., both CSF p-tau and t-tau levels remained normal during the observation period, despite significant atrophy. A possible interpretation is that early MTL atrophy is related to other mechanisms than NFTs, as atrophy also occurred in T– subjects. However, it is also well known that there is discordance between p-tau and cerebral accumulation of NFTs verified by tau-PET or autopsy [39, 40]. However, both p-tau and t-tau were significantly higher in A+/T–/N– compared to A–/T–/N–, and it is thus more likely that levels were sub-pathologic but below cut-off. We therefore find it more reasonable to not contrast normal and abnormal CSF p-tau and t-tau separately in the A/T/N– classification presented herein.
Our results are in line with amyloid pathology as a key initiator of MTL atrophy, where objective cognitive decline, or where at least one CSF-biomarker mirroring NFTs or neuronal loss, is associated with accelerated volume-loss in AD. Our findings point to early AD-related longitudinal volume reduction in several key areas of the MTL, mostly corresponding to Braak staging of NFT pathology, but where other mechanisms also may be considered. However, these results do not exclude a possible interaction between NFTs and alternative contributors of atrophy.
Our study has several strengths. The study is performed in a well-described cohort with full cognitive assessment and biomarkers of AD. CSF-biomarkers were available for most subjects, and we used the CSF Aβ42/40-ratio (more reliable compared to CSF-Aβ42 [37]) to stratify AD from non-AD. Subjects without CSF had available amyloid-PET. The cohort included longitudinal data, and subregional changes over time could therefore be reported in relation to the CSF biomarkers. One of the main objectives of this study was to assess the applicability of these data after across-site harmonization. Scanner and other site-specific effects that may influence neuroimaging results are common in multi-site studies, and finding appropriate methods that works well under such conditions is therefore important. We consider the use of a novel harmonization method that makes it possible to exploit data from several sites as a strength, although we cannot be certain that all variability was removed. However, longitudinal ComBat has been tested for multiple scanners and requires at least 2 scans per scanner to estimate scanner effects [45]. We chose a stricter approach, where we included data from scanners with at least 10 scans to balance between reduction of possible remaining scanner and maintenance of adequate statistical power. Scanner was not a significant covariate in the model after harmonization, and the results were in line with the literature. This indicates that the model is useful and improves the results.
Our study also has several limitations. As discussed in the previous paragraph, we cannot exclude the possibility of remaining scanner effects after harmonization. In this setting, 3D T1w-images were generally more available than 3D T2-weighted images, and therefore included in the analyses. The ASHS-T2 protocol would generally be preferable as more detailed information on the hippocampal subfields can be obtained from T2-weighted images, but the present data was not suitable for ASHS-T2. Another possible solution is using FreeSurfer version 6.0, which both offers segmentation of MTL cortex as well as the hippocampus from T1w-images. However, ASHS-T1 was considered a better option for several reasons. As mentioned earlier, anterior-posterior segmentation by ASHS-T1 is considered more reliable than hippocampal subfield segmentation in T1-images with approximately 1 mm3 resolution [33]. ASHS-T1 is also considered to produce more reliable volume estimates of MTL cortex compared to FreeSurfer version 6.0, where the proximity to the dura mater may cause mislabeling of these subregions, especially the ERC [42].
Another limitation is the use of MTL neocortical volumes instead of cortical thickness. With the ASHS-PMC-T1 atlas it is possible to determine volumes but not cortical thickness. Cortical thickness estimates are more robust in relation to anatomical variability and less correlated with intracranial volume. We assessed a relatively high number of MTL subregions which were compared across several groups (staging by amyloid status, and A/T/N– classification), possibly increasing the risk of Type 1 errors. To reduce this risk, the number of comparisons were reduced by averaging the hemispheres, and we performed Holm-Bonferroni correction to adjust p-values. It should, however, be noted that some extent of correlation between the different MTL subregional volumes by group would be expected. The correction made by Holm-Bonferroni may thus be too strict, with possible increased risk of type 2 errors. Also, a few of the participants in our study were younger than what was recommended for the ASHS-PMC-T1 atlas. However, all segmentations were visually assessed, and we thus consider the ASHS-volumes from these subjects to be reliable.
In conclusion, we report longitudinal MTL volume loss in AD across clinical staging and A/T/N classification. We used a novel method for harmonization of longitudinal neuroimaging data. We here demonstrate a possible approach under conditions that are common in clinical intervention studies, but which is yet relatively little explored longitudinally with automated volumetry methods. The results were generally in line with the existing literature, but also questions whether other mechanisms than NFT pathology are involved in AD related neuronal loss. Both clinical staging as well as A/T/N-classification were considered useful to predict AD-disease progression. We thus conclude that using ASHS-T1 under these circumstances is clinically useful, but the different strengths and weaknesses must be considered.
ACKNOWLEDGMENTS
The authors thank Dr. Joanne C Beer (Perelman School of Medicine, University of Pennsylvania, United States) for valuable input and advice regarding the implementation of longitudinal ComBat to our dataset.
FUNDING
This study has been funded by the regional health authority (Helse Sør-Øst) and JPND (EU Joint Program - Neurodegenerative Diseases research).
CONFLICT OF INTEREST
T. Fladby has served on a Novo Nordisk and Biogen advisory boards.
All other authors have no conflict of interest to report.
DATA AVAILABILITY
Data from the DDI cohort are stored at Services for sensitive data (TSD) at the University of Oslo (UiO) and is publicly unavailable. However, anonymized data used in this study may be made available from the corresponding author upon reasonable request.
REFERENCES
[1] | Lam B , Masellis M , Freedman M , Stuss DT , Black SE ((2013) ) Clinical, imaging, and pathological heterogeneity of the Alzheimer’s disease syndrome. Alzheimers Res Ther 5: , 1. |
[2] | Braak H , Braak E ((1991) ) Neuropathological stageing of Alzheimer-related changes. Acta Neuropathol (Berl) 82: , 239–259. |
[3] | Iqbal K , Liu F , Gong C-X , Alonso A del C , Grundke-Iqbal I ((2009) ) Mechanisms of tau-induced neurodegeneration. Acta Neuropathol (Berl) 118: , 53–69. |
[4] | Fukutani Y , Cairns NJ , Shiozawa M , Sasaki K , Sudo S , Isaki K , Lantos PL ((2000) ) Neuronal loss and neurofibrillary degeneration in the hippocampal cortex in late-onset sporadic Alzheimer’s disease. Psychiatry Clin Neurosci 54: , 523–529. |
[5] | Bobinski M , Wegiel J , Tarnawski M , Bobinski M , Reisberg B , de Leon MJ , Miller DC , Wisniewski HM ((1997) ) Relationships between regional neuronal loss and neurofibrillary changes in the hippocampal formation and duration and severity of Alzheimer disease. J Neuropathol Exp Neurol 56: , 414–420. |
[6] | Selkoe DJ , Hardy J ((2016) ) The amyloid hypothesis of Alzheimer’s disease at 25 years. EMBO Mol Med 8: , 595–608. |
[7] | Price JL , Morris JC ((1999) ) Tangles and plaques in nondemented aging and “preclinical” Alzheimer’s disease. Ann Neurol 45: , 358–368. |
[8] | Bloom GS ((2014) ) Amyloid-β and tau: The trigger and bullet in Alzheimer disease pathogenesis. JAMA Neurol 71: , 505–508. |
[9] | Jack CR , Knopman DS , Jagust WJ , Petersen RC , Weiner MW , Aisen PS , Shaw LM , Vemuri P , Wiste HJ , Weigand SD , Lesnick TG , Pankratz VS , Donohue MC , Trojanowski JQ ((2013) ) Tracking pathophysiological processes in Alzheimer’s disease: An updated hypothetical model of dynamic biomarkers. Lancet 12: , 207–216. |
[10] | Thal DR , Rüb U , Schultz C , Sassin I , Ghebremedhin E , Del Tredici K , Braak E , Braak H ((2000) ) Sequence of Aβ-protein deposition in the human medial temporal lobe. J Neuropathol Exp Neurol 59: , 733–748. |
[11] | Schmidt MF , Storrs JM , Freeman KB , Jack CR , Turner ST , Griswold ME , Mosley TH ((2018) ) A comparison of manual tracing and FreeSurfer for estimating hippocampal volume over the adult lifespan. HumBrain Mapp 39: , 2500–2513. |
[12] | Cover KS , van Schijndel RA , Bosco P , Damangir S , Redolfi A , Alzheimer’s Disease Neuroimaging Initiative ((2018) ) Can measuring hippocampal atrophy with a fully automatic method be substantially less noisy than manual segmentation over both 1 and 3 years? Psychiatry Res Neuroimaging 280: , 39–47. |
[13] | Quek Y-E , Fung YL , Cheung MW-L , Vogrin SJ , Collins SJ , Bowden SC ((2022) ) Agreement between automated and manual MRI volumetry in Alzheimer’s disease: A systematic review and meta-analysis. J Magn Reson Imaging 56: , 490–507. |
[14] | Fjell AM , Walhovd KB , Amlien I , Bjørnerud A , Reinvang I , Gjerstad L , Cappelen T , Willoch F , Due-Tønnessen P , Grambaite R , Skinningsrud A , Stenset V , Fladby T ((2008) ) Morphometric changes in the episodic memory network and tau pathologic features correlate with memory performance in patients with mild cognitive impairment. AJNR Am J Neuroradiol 29: , 1183–1189. |
[15] | Walhovd KB , Fjell AM , Amlien I , Grambaite R , Stenset V , Bjørnerud A , Reinvang I , Gjerstad L , Cappelen T , Due-Tønnessen P , Fladby T ((2009) ) Multimodal imaging in mild cognitive impairment: Metabolism, morphometry and diffusion of the temporal-parietal memory network. Neuroimage 45: , 215–223. |
[16] | Desikan RS , Fischl B , Cabral HJ , Kemper TL , Guttmann CRG , Blacker D , Hyman BT , Albert MS , Killiany RJ ((2008) ) MRI measures of temporoparietal regions show differential rates of atrophy during prodromal AD. Neurology 71: , 819–825. |
[17] | Mueller SG , Schuff N , Yaffe K , Madison C , Miller B , Weiner MW ((2010) ) Hippocampal atrophy patterns in mild cognitive impairment and Alzheimer’s disease. Hum Brain Mapp 31: , 1339–1347. |
[18] | Devanand DP , Bansal R , Liu J , Hao X , Pradhaban G , Peterson BS ((2012) ) MRI hippocampal and entorhinal cortex mapping in predicting conversion to Alzheimer’s disease. Neuroimage 60: , 1622–1629. |
[19] | Tward DJ , Sicat CS , Brown T , Bakker A , Gallagher M , Albert M , Miller M ((2017) ) Entorhinal and transentorhinal atrophy in mild cognitive impairment using longitudinal diffeomorphometry. Alzheimers Dement (Amst) 9: , 41–50. |
[20] | Miller MI , Younes L , Ratnanather JT , Brown T , Trinh H , Postell E , Lee DS , Wang M-C , Mori S , O’Brien R , Albert M , BIOCARD Research Team ((2013) ) The diffeomorphometry of temporal lobe structures in preclinical Alzheimer’s disease. Neuroimage Clin 3: , 352–360. |
[21] | Lindberg O , Mårtensson G , Stomrud E , Palmqvist S , Wahlund L-O , Westman E , Hansson O ((2017) ) Atrophy of the posterior subiculum is associated with memory impairment, tau- and Aβ pathology in non-demented individuals. Front Aging Neurosci 9: , 306. |
[22] | Xie L , Wisse LEM , Das SR , Vergnet N , Dong M , Ittyerah R , de Flores R , Yushkevich PA , Wolk DA , Alzheimer’s Disease Neuroimaging Initiative ((2020) ) Longitudinal atrophy in early Braak regions in preclinical Alzheimer’s disease. Hum Brain Mapp 41: , 4704–4717. |
[23] | Kulason S , Xu E , Tward DJ , Bakker A , Albert M , Younes L , Miller MI ((2020) ) Entorhinal and transentorhinal atrophy in preclinical Alzheimer’s disease. Front Neurosci 14: , 804. |
[24] | Zhang L , Mak E , Reilhac A , Shim HY , Ng KK , Ong MQW , Ji F , Chong EJY , Xu X , Wong ZX , Stephenson MC , Venketasubramanian N , Tan BY , O’Brien JT , Zhou JH , Chen CLH , Alzheimer’s Disease Neuroimaging Initiative ((2020) ) Longitudinal trajectory of Amyloid-related hippocampal subfield atrophy in nondemented elderly. Hum Brain Mapp 41: , 2037–2047. |
[25] | de Flores R , La Joie R , Chételat G ((2015) ) Structural imaging of hippocampal subfields in healthy aging and Alzheimer’s disease. Neuroscience 309: , 29–50. |
[26] | Du AT , Schuff N , Kramer JH , Ganzer S , Zhu XP , Jagust WJ , Miller BL , Reed BR , Mungas D , Yaffe K , Chui HC , Weiner MW ((2004) ) Higher atrophy rate of entorhinal cortex than hippocampus in AD. Neurology 62: , 422–427. |
[27] | Younes L , Albert M , Miller MI , BIOCARD Research Team ((2014) ) Inferring changepoint times of medial temporal lobe morphometric change in preclinical Alzheimer’s disease. Neuroimage Clin 5: , 178–187. |
[28] | Jessen F , Amariglio RE , van Boxtel M , Breteler M , Ceccaldi M , Chételat G , Dubois B , Dufouil C , Ellis KA , van der Flier WM , Glodzik L , van Harten AC , de Leon MJ , McHugh P , Mielke MM , Molinuevo JL , Mosconi L , Osorio RS , Perrotin A , Petersen RC , Rabin LA , Rami L , Reisberg B , Rentz DM , Sachdev PS , de la Sayette V , Saykin AJ , Scheltens P , Shulman MB , Slavin MJ , Sperling RA , Stewart R , Uspenskaya O , Vellas B , Visser PJ , Wagner M ((2014) ) A conceptualframework for research on subjective cognitive decline inpreclinical Alzheimer’s disease. Alzheimers Dement 10: , 844–852. |
[29] | Albert MS , DeKosky ST , Dickson D , Dubois B , Feldman HH , Fox NC , Gamst A , Holtzman DM , Jagust WJ , Petersen RC , Snyder PJ , Carrillo MC , Thies B , Phelps CH ((2011) ) The diagnosis of mild cognitive impairment due to Alzheimer’s disease: Recommendations from the National Institute on Aging-Alzheimer’s Association workgroups on diagnostic guidelines for Alzheimer’s disease. Alzheimers Dement 7: , 270–279. |
[30] | McKhann GM , Knopman DS , Chertkow H , Hyman BT , Jack CR , Kawas CH , Klunk WE , Koroshetz WJ , Manly JJ , Mayeux R , Mohs RC , Morris JC , Rossor MN , Scheltens P , Carrillo MC , Thies B , Weintraub S , Phelps CH ((2011) ) The diagnosis of dementia due to Alzheimer’s disease: Recommendations from the National Institute on Aging-Alzheimer’s Association workgroups on diagnostic guidelines for Alzheimer’s disease. Alzheimers Dement 7: , 263–269. |
[31] | Jack CR , Bennett DA , Blennow K , Carrillo MC , Feldman HH , Frisoni GB , Hampel H , Jagust WJ , Johnson KA , Knopman DS , Petersen RC , Scheltens P , Sperling RA , Dubois B ((2016) ) A/T/N: An unbiased descriptive classification scheme for Alzheimer disease biomarkers. Neurology 87: , 539–547. |
[32] | Iglesias JE , Augustinack JC , Nguyen K , Player CM , Player A , Wright M , Roy N , Frosch MP , McKee AC , Wald LL , Fischl B , Van Leemput K ((2015) ) A computational atlas of the hippocampal formation using ex vivo, ultra-high resolution MRI: Application to adaptive segmentation of in vivo MRI. Neuroimage 115: , 117–137. |
[33] | Wisse LEM , Chételat G , Daugherty AM , de Flores R , la Joie R , Mueller SG , Stark CEL , Wang L , Yushkevich PA , Berron D , Raz N , Bakker A , Olsen RK , Carr VA ((2021) ) Hippocampal subfield volumetryfrom structural isotropic 1 mm3 MRI scans: A note of caution. Hum Brain Mapp 42: , 539–550. |
[34] | Yushkevich PA , Pluta JB , Wang H , Xie L , Ding S-L , Gertje EC , Mancuso L , Kliot D , Das SR , Wolk DA ((2015) ) Automated volumetry and regional thickness analysis of hippocampal subfields and medial temporal cortical structures in mild cognitive impairment. Hum Brain Mapp 36: , 258–287. |
[35] | Fladby T , Pålhaugen L , Selnes P , Waterloo K , Bråthen G , Hessen E , Almdahl IS , Arntzen KA , Auning E , Eliassen CF , Espenes R , Grambaite R , Grøntvedt GR , Johansen KK , Johnsen SH , Kalheim LF , Kirsebom BE , Müller KI , Nakling AE , Rongve A , Sando SB , Siafarikas N , Stav AL , Tecelao S , Timon S , Bekkelund SI , Aarsland D ((2017) ) Detecting at-risk Alzheimer’s disease cases. J Alzheimers Dis 60: , 97–105. |
[36] | Siafarikas N , Kirsebom B-E , Srivastava DP , Eriksson CM , Auning E , Hessen E , Selbaek G , Blennow K , Aarsland D , Fladby T ((2021) ) Cerebrospinal fluid markers for synaptic function and Alzheimer type changes in late life depression. Sci Rep 11: , 20375. |
[37] | Hansson O , Lehmann S , Otto M , Zetterberg H , Lewczuk P ((2019) ) Advantages and disadvantages of the use of the CSF amyloid β (Aβ) 42/40 ratio in the diagnosis of Alzheimer’s disease. Alzheimers Res Ther 11: , 34. |
[38] | Stern Y , Arenaza-Urquijo EM , Bartrés-Faz D , Belleville S , Cantilon M , Chetelat G , Ewers M , Franzmeier N , Kempermann G , Kremen WS , Okonkwo O , Scarmeas N , Soldan A , Udeh-Momoh C , Valenzuela M , Vemuri P , Vuoksimaa E , the Reserve , Resilience and Protective Factors PIA Empirical Definitions and Conceptual Frameworks Workgroup ((2020) ) Whitepaper: Defining and investigating cognitivereserve, brain reserve, and brain maintenance. AlzheimersDement 16: , 1305–1311. |
[39] | Engelborghs S , Sleegers K , Cras P , Brouwers N , Serneels S , De Leenheir E , Martin J-J , Vanmechelen E , Van Broeckhoven C , De Deyn PP ((2007) ) No association of CSF biomarkers with APOEɛ4, plaque and tangle burden in definite Alzheimer’s disease. Brain 130: , 2320–2326. |
[40] | Therriault J , Vermeiren M , Servaes S , Tissot C , Ashton NJ , Benedet AL , Karikari TK , Lantero-Rodriguez J , Brum WS , Lussier FZ , Bezgin G , Stevenson J , Rahmouni N , Kunach P , Wang Y-T , Fernandez-Arias J , Socualaya KQ , Macedo AC , Ferrari-Souza JP , Ferreira PCL , Bellaver B , Leffa DT , Zimmer ER , Vitali P , Soucy J-P , Triana-Baltzer G , Kolb HC , Pascoal TA , Saha-Chaudhuri P , Gauthier S , Zetterberg H , Blennow K , Rosa-Neto P ((2023) ) Association of phosphorylated tau biomarkers with amyloid positron emission tomography vs tau positron emission tomography. JAMA Neurol 80: , 188–199. |
[41] | Jack CR , Knopman DS , Chételat G , Dickson D , Fagan AM , Frisoni GB , Jagust W , Mormino EC , Petersen RC , Sperling RA , van der Flier WM , Villemagne VL , Visser PJ , Vos SJB ((2016) ) Suspected non-Alzheimer disease pathophysiology—concept and controversy. Nat Rev Neurol 12: , 117–124. |
[42] | Xie L , Wisse LEM , Pluta J , de Flores R , Piskin V , Manjón JV , Wang H , Das SR , Ding S , Wolk DA , Yushkevich PA ((2019) ) Automated segmentation of medial temporal lobe subregions on in vivo T1-weighted MRI in early stages of Alzheimer’s disease. Hum Brain Mapp 40: , 3431–3451. |
[43] | Xie L , Wisse LEM , Das SR , Wang H , Wolk DA , Manjón JV , Yushkevich PA ((2016) ) Accounting for the confound of meninges in segment ingentorhinal and perirhinal cortices in T1-weighted MRI. In Medical Image Computing and Computer-Assisted Intervention – MICCAI 2016, Ourselin S, Joskowicz L, Sabuncu MR,Unal G, Wells W, eds. Springer International Publishing, Cham, pp. 564–571. |
[44] | R Core Team ((2021) ) R: A language and environment for statistical computing. |
[45] | Beer JC , Tustison NJ , Cook PA , Davatzikos C , Sheline YI , Shinohara RT , Linn KA , Alzheimer’s Disease Neuroimaging Initiative ((2020) ) Longitudinal ComBat: A method for harmonizing longitudinal multi-scanner imaging data. Neuroimage 220: , 117129. |
[46] | Voevodskaya O , Simmons A , Nordenskjöld R , Kullberg J , Ahlström H , Lind L , Wahlund L-O , Larsson E-M , Westman E ((2014) ) The effects of intracranial volume adjustment approaches on multiple regional MRI volumes in healthy aging and Alzheimer’s disease. Front Aging Neurosci 6: , 264. |
[47] | Stoub TR , Rogalski EJ , Leurgans S , Bennett DA , de Toledo-Morrell L ((2010) ) Rate of entorhinal and hippocampal atrophy in incipient and mild AD: Relation to memory function. Neurobiol Aging 31: , 1089–1098. |
[48] | Devanand DP , Pradhaban G , Liu X , Khandji A , De Santi S , Segal S , Rusinek H , Pelton GH , Honig LS , Mayeux R , Stern Y , Tabert MH , de Leon MJ ((2007) ) Hippocampal and entorhinal atrophy in mild cognitive impairment: Prediction of Alzheimer disease. Neurology 68: , 828–836. |
[49] | Holbrook AJ , Tustison NJ , Marquez F , Roberts J , Yassa MA , Gillen DL , Alzheimer’s Disease Neuroimaging Initiative ((2020) ) Anterolateral entorhinal cortex thickness as a new biomarker for early detection of Alzheimer’s disease. Alzheimers Dement (Amst) 12: , e12068. |
[50] | Pruessner JC , Köhler S , Crane J , Pruessner M , Lord C , Byrne A , Kabani N , Collins DL , Evans AC ((2002) ) Volumetry of temporopolar, perirhinal, entorhinal and parahippocampal cortex from high-resolution MR images: Considering the variability of the collateral sulcus. Cereb Cortex 12: , 1342–1353. |
[51] | Schwarz CG , Gunter JL , Wiste HJ , Przybelski SA , Weigand SD , Ward CP , Senjem ML , Vemuri P , Murray ME , Dickson DW , Parisi JE , Kantarci K , Weiner MW , Petersen RC , Jack CR ((2016) ) A large-scale comparison of cortical thickness and volume methods for measuring Alzheimer’s disease severity. Neuroimage Clin 11: , 802–812. |
[52] | Malykhin NV , Bouchard TP , Ogilvie CJ , Coupland NJ , Seres P , Camicioli R ((2007) ) Three-dimensional volumetric analysis and reconstruction of amygdala and hippocampal head, body and tail. Psychiatry Res Neuroimaging 155: , 155–165. |
[53] | Carrera E , Tononi G ((2014) ) Diaschisis: Past, present, future. Brain 137: , 2408–2422. |
[54] | Augustinack JC , Helmer K , Huber KE , Kakunoori S , Zöllei L , Fischl B ((2010) ) Direct visualization of the perforant pathway in the human brain with ex vivo diffusion tensor imaging. Front Hum Neurosci 4: , 42. |
[55] | Salat DH , Tuch DS , van der Kouwe AJW , Greve DN , Pappu V , Lee SY , Hevelone ND , Zaleta AK , Growdon JH , Corkin S , Fischl B , Rosas HD ((2010) ) White matter pathology isolates the hippocampal formation in Alzheimer’s disease. Neurobiol Aging 31: , 244–256. |
[56] | Delbeuck X , Van der Linden M , Collette F ((2003) ) Alzheimer’s disease as a disconnection syndrome? Neuropsychol Rev 13: , 79–92. |
[57] | Kim H ((2015) ) Encoding and retrieval along the long axis of the hippocampus and their relationships with dorsal attention and default mode networks: The HERNET model. Hippocampus 25: , 500–510. |
[58] | Buckner RL , Andrews-Hanna JR , Schacter DL ((2008) ) The brain’s default network. Ann N Y Acad Sci 1124: , 1–38. |
[59] | Busche MA , Hyman BT ((2020) ) Synergy between amyloid-β and tau in Alzheimer’s disease. Nat Neurosci 23: , 1183–1193. |
[60] | Huang Y-R , Liu R-T ((2020) ) The toxicity and polymorphism of β-amyloid oligomers. Int J Mol Sci 21: , 4477. |
[61] | Nelson PT , Dickson DW , Trojanowski JQ , Jack CR , Boyle PA , Arfanakis K , Rademakers R , Alafuzoff I , Attems J , Brayne C , Coyle-Gilchrist ITS , Chui HC , Fardo DW , Flanagan ME , Halliday G , Hokkanen SRK , Hunter S , Jicha GA , Katsumata Y , Kawas CH , Keene CD , Kovacs GG , Kukull WA , Levey AI , Makkinejad N , Montine TJ , Murayama S , Murray ME , Nag S , Rissman RA , Seeley WW , Sperling RA , White CL , Yu L , Schneider JA ((2019) ) Limbic-predominant age-related TDP-43 encephalopathy (LATE): Consensus working group report. Brain 142: , 1503–1527. |
[62] | Lagarde J , Olivieri P , Tonietto M , Tissot C , Rivals I , Gervais P , Caillé F , Moussion M , Bottlaender M , Sarazin M ((2022) ) Tau-PETimaging predicts cognitive decline and brain atrophy progression inearly Alzheimer’s disease. J Neurol Neurosurg Psychiatry 93: , 459–467. |
[63] | Maass A , Lockhart SN , Harrison TM , Bell RK , Mellinger T , Swinnerton K , Baker SL , Rabinovici GD , Jagust WJ ((2018) ) Entorhinal tau pathology, episodic memory decline, and neurodegeneration in aging. J Neurosci 38: , 530–543. |
[64] | Berron D , Vogel JW , Insel PS , Pereira JB , Xie L , Wisse LEM , Yushkevich PA , Palmqvist S , Mattsson-Carlgren N , Stomrud E , Smith R , Strandberg O , Hansson O ((2021) ) Early stages of tau pathology and its associations with functional connectivity, atrophy and memory. Brain 144: , 2771–2783. |


