
Patterns of Aging Changes in Bodyweight May Predict Alzheimer’s Disease
Abstract
Relationships between patterns of aging-changes in bodyweight and AD are not fully understood. We compared mean age-trajectories of weight between those who did and did not develop late-onset-AD, and evaluated impact of age at maximum weight (AgeMax), and slope of decline in weight, on AD risk. Women with late-onset-AD had lower weight three or more decades before AD onset, and ∼10 years younger AgeMax, compared to AD-free women. APOE4 carriers had younger AgeMax and steeper slope. Older AgeMax and flatter slope predicted lower AD risk. Premature decline in weight could be a sign of accelerated physical aging contributing to AD.
INTRODUCTION
Lower bodyweight has been associated with Alzheimer’s disease (AD) and other dementias [1–5]. However, mechanisms behind such association remain poorly understood. The lower weight could be a consequence of already developing AD pathology in the body and a symptom of preclinical AD. Alternatively, it may be a risk factor for AD and a potential target for AD prevention. Despite a substantial amount of research connecting changes in weight at certain age intervals with risks of AD and other dementia’s [4–9], this direction remains underexplored. The age-trajectories of weight evaluated over longer periods of life may provide better insights into the cause-and-effect relationship between patterns of aging-related changes in weight and AD. The ɛ4 allele of APOE gene (a.k.a. APOE4), a major genetic risk factor for late-onset-AD, was also linked to lower weight/body mass index (BMI) in some studies [3, 10–13]; however, it is unclear how APOE4 influences long-term changes in weight over the life course and whether this influence plays a significant role in AD.
In this study, we explored the relationships between late-onset-AD and patterns of aging-related changes in bodyweight, as well as the impact of APOE4 on these patterns. We examined how long before AD onset individuals start to decline in weight compared to those who remain AD-free. We also investigated key characteristics of the non-monotonic trajectories of weight changes during aging, such as the age at reaching maximum and the rate of subsequent decline, and evaluated their associations with AD risk.
Table 1
Impact of carrying APOE ɛ4 allele on phenotypes characterizing age-trajectories of weight in HRS and FHS. White females (F) and males (M)
| Phenotypes | Sex | OR (CI) | p | N(1) | N(0) |
| HRS | |||||
| Age at maximum weight | F | 0.73 (0.64, 0.84) | 7.60E-06 | 1542 | 2563 |
| (≥70 versus <70 years) | |||||
| Slope of the weight | F | 0.67 (0.58, 0.78) | 2.72E-07 | 1471 | 1456 |
| (above versus below median) | |||||
| Slope of the weight | M | 0.73 (0.61, 0.87) | 4.29E-04 | 1121 | 1127 |
| (above versus below median) | FHS | ||||
| Slope of the weight | F | 0.62 (0.42, 0.91) | 0.015 | 335 | 221 |
| (above versus below median) |
LS, Life Span; N(1), number of people in group (1); N(0), number of people in group (0). Age at maximum weight (AgeMax), binary phenotype: (1) AgeMax ≥70 years versus (0) AgeMax <70 years; LS >70. Slope of the weight (Slope), binary phenotype: (1) Slope above median versus (0) Slope below median; LS >75. Slope was calculated as relative change in weight between ages 65–85: [Mean weight at ages 75–85 - Mean weight at ages 65–75]/Mean weight at ages 65–75 years. OR, Odds Ratio, refers to chances for APOE ɛ4 carriers to be in Group (1).
MATERIALS AND METHODS
Data
The Framingham Heart Study (FHS) original cohort, and the Health and Retirement Study (HRS) data were used in this analysis. The FHS is a prospective, community-based, longitudinal cohort study, initiated in 1948 and continued since under direction of the National Heart, Lung and Blood Institute. The original cohort includes residents of Framingham, Massachusetts, predominantly White, who had extensive examinations, including detailed health history confirmed by a physician, a physical examination, laboratory testing, and genetic information, approximately every two years. The FHS v31 data distributed through the Database of Genotypes and Phenotypes (dbGaP; phs000007), containing information on 32 waves of examinations of 5180 individuals from the original cohort, were used in this study. The HRS is a longitudinal survey supported by the National Institute on Aging and the Social Security Administration that extensively surveys a representative sample of approximately 20,000 US residents for health, well-being, and retirement information. We used HRS RAND longitudinal file 2016 v1 including information on 13 waves (1992–2016), and seven entry cohorts distributed by the University of Michigan (https://hrs.isr.umich.edu/data-products), and HRS v2 genetic information distributed by dbGaP (phs000428). Numbers of individuals included in particular analysis are shown in Table 1 and Figs. 1 and 2.
Phenotypes
Alzheimer’s disease (AD). In FHS, a dementia review panel, which included a neurologist and a neuropsychologist, reviewed every case of cognitive decline and dementia. The diagnosis of AD was based on criteria for possible, probable, or definite AD from the Alzheimer’s Disease and Related Disorders Association and the National Institute of Neurological and Communicative Disorders and Stroke (ADRDA– NINCDS) [14, 15]. In HRS, AD onset was assessed using the survey data, based on HRS questionnaires. In Waves 4–9, questions about memory-related diseases were asked, and since Wave 10, the respondents were asked if they have been told by the doctor that they have AD.
Binary phenotypes characterizing patterns of aging changes in weight. Behavior of non-monotonic mean age-trajectories of weight may be described by such characteristics as age at reaching maximum weight (AgeMax), and rate of change in weight (Slope). We created respective binary phenotypes (1 versus 0) categorizing such behavior. For AgeMax, group (0) included individuals with younger AgeMax (<70 years), and group (1) included individuals with older AgeMax (≥70 years), with condition of survival to age older than 70 in both groups. Slope was calculated as relative change in weight between ages 65 and 85. Group (0) included individuals with Slope below median (steeper decline in weight), and group (1) included individuals with Slope above median (flatter decline or non-declining pattern), with condition of survival to age older than 75 in both groups. For both AgeMax and Slope phenotypes, our working hypothesis was that being in group (1) could be more beneficial for older people than being in group (0), assuming that the ability to postpone/decelerate the decline in weight at older ages may reflect a slower physical aging with later onset of frailty [16].
Fig. 1
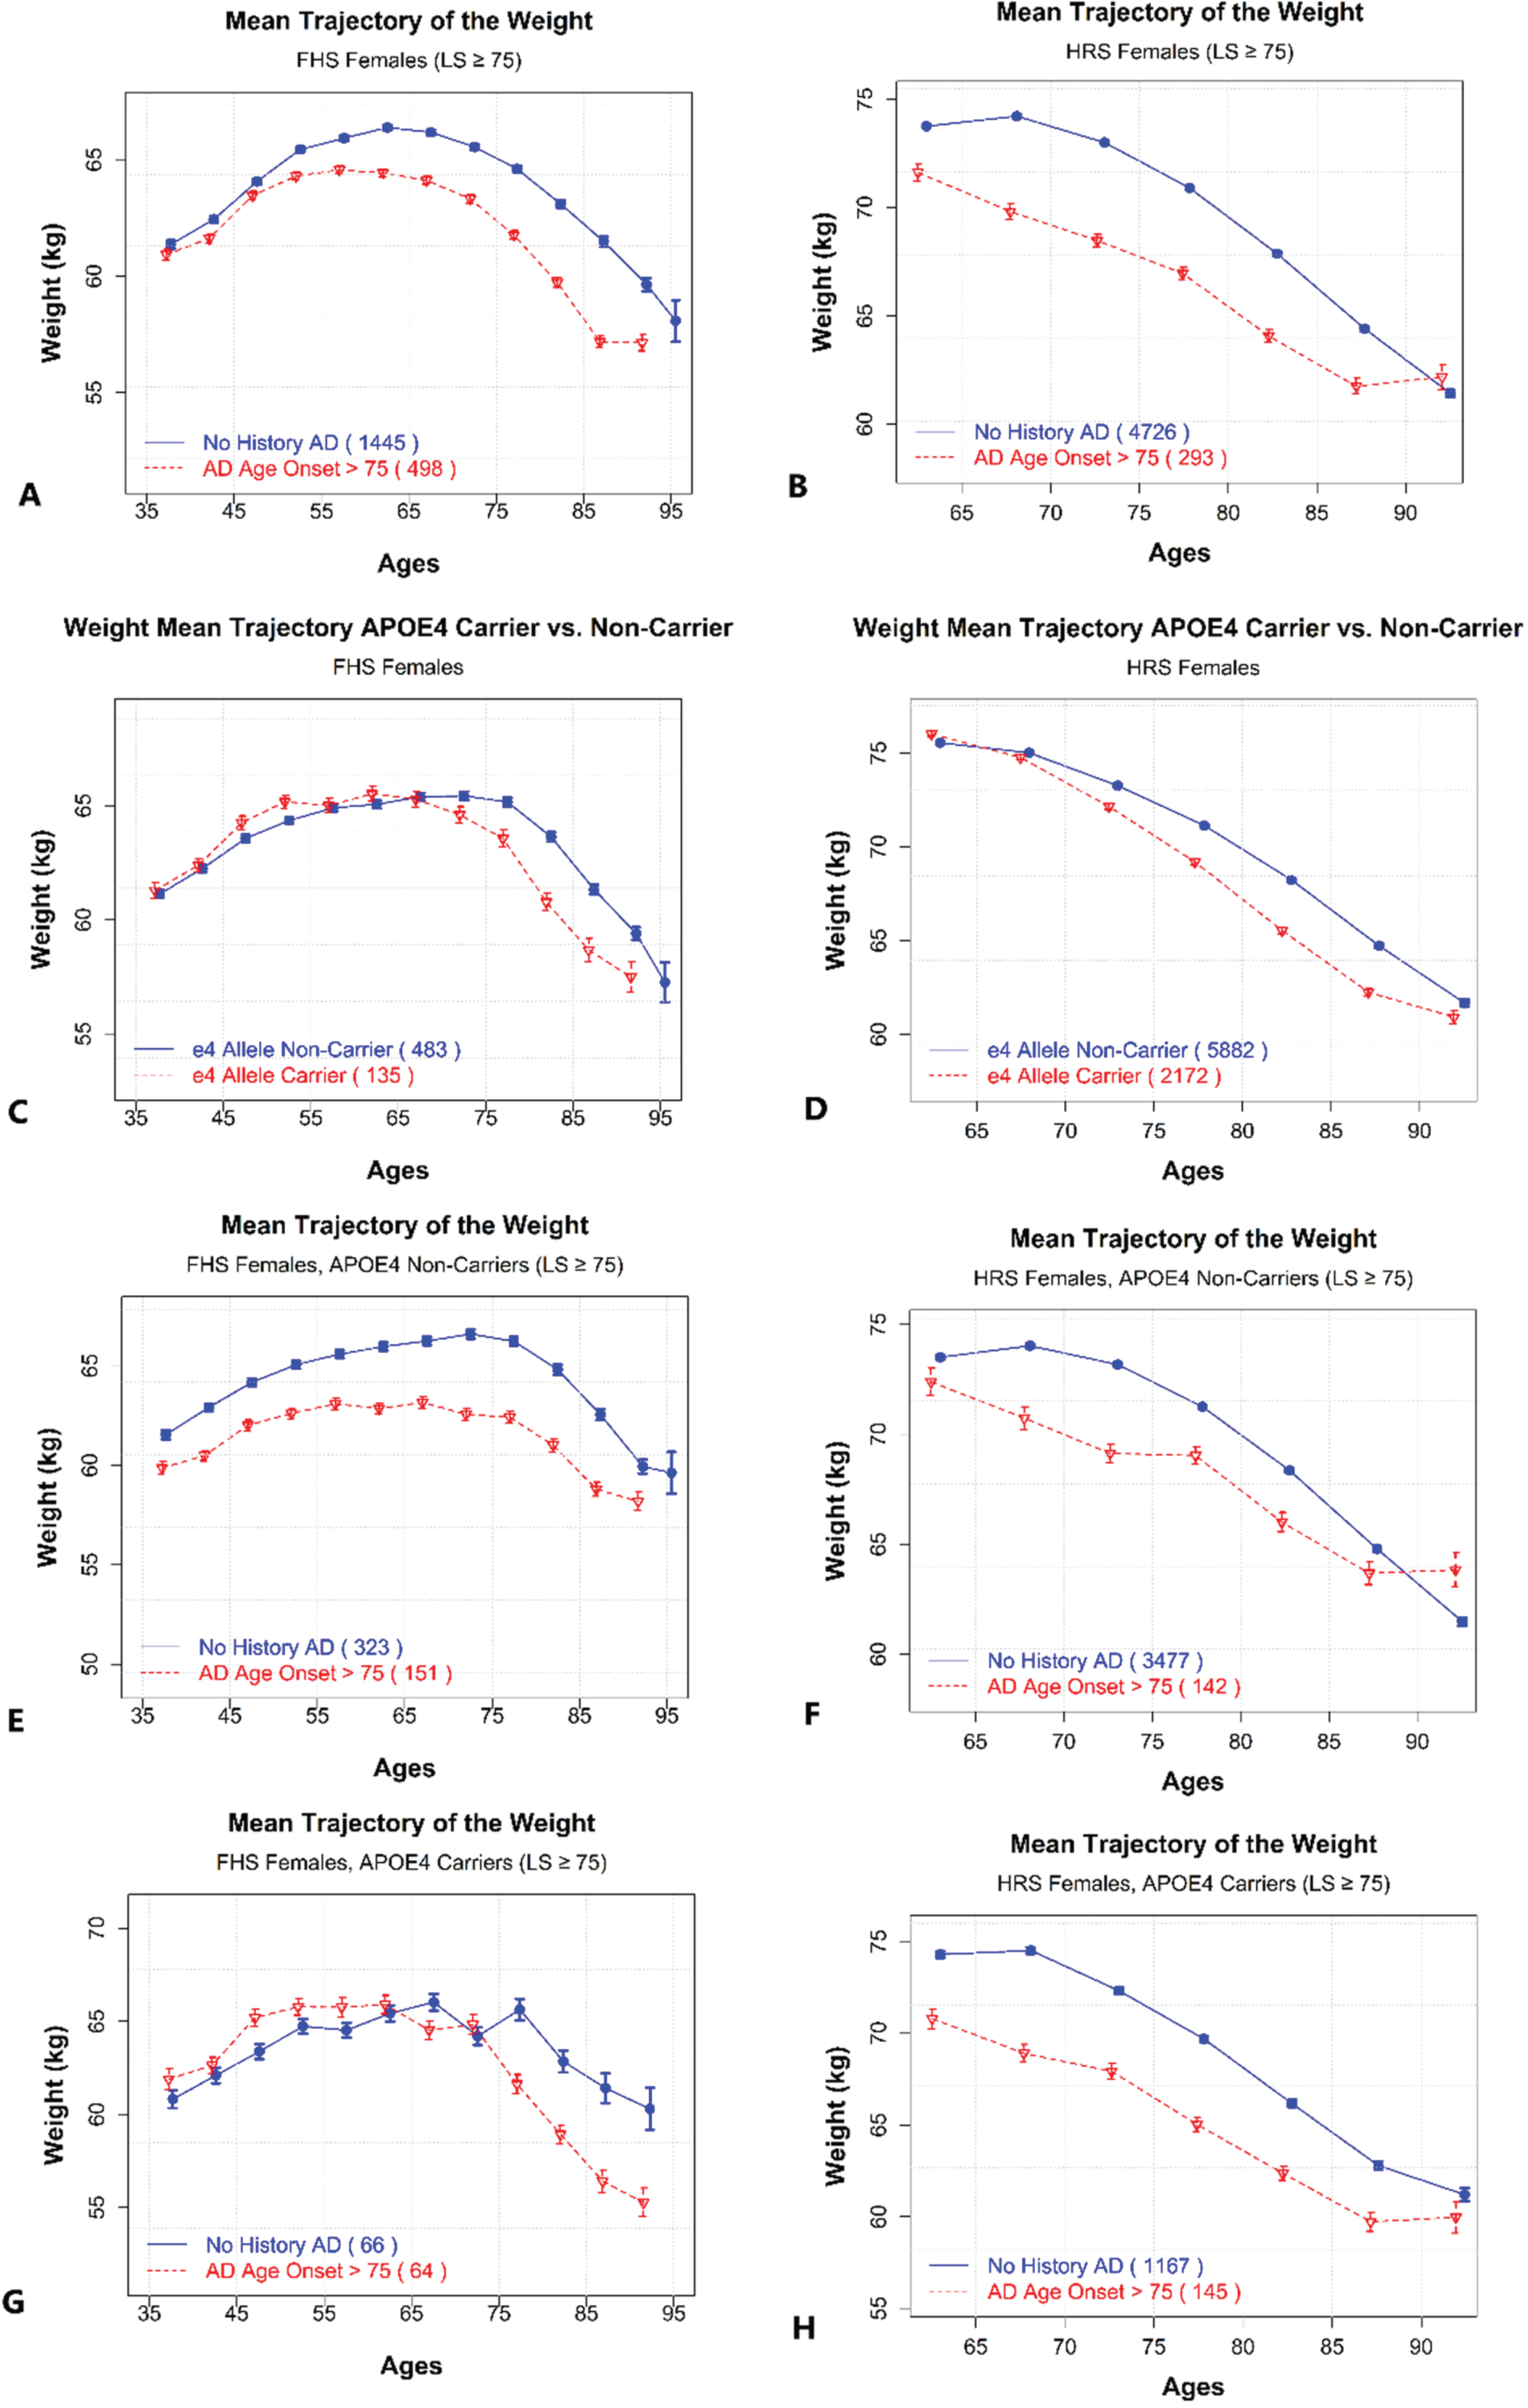
Mean age-trajectories of weight for women with and without history of AD, and by APOE4 carrier status. A) Age-patterns of weight for females with and without AD history. Dashed line – females with AD onset at ages 75+. Solid line - females without AD and with lifespan (LS) 75 years or older. FHS. B) Age-patterns of weight for females with and without AD history. Dashed line – females with AD onset at ages 75+. Solid line - females without AD and with lifespan (LS) 75 years or older. HRS. C) Age-patterns of weight for females with and without APOE ɛ4 allele. Dashed line – females, who are ɛ4 allele carriers. Solid line - females, who are ɛ4 allele non-carriers. FHS. D) Age-patterns of weight for females with and without APOE ɛ4 allele. Dashed line – females, who are ɛ4 allele carriers. Solid line - females, who are ɛ4 allele non-carriers. HRS. E) Age-patterns of weight for females without APOE ɛ4 allele, by AD history. Dashed line – females with AD onset at ages 75+. Solid line - females without AD and with lifespan (LS) 75 years or older. FHS. F) Age-patterns of weight for females without APOE ɛ4 allele, by AD history. Dashed line – females with AD onset at ages 75+. Solid line - females without AD and with lifespan (LS) 75 years or older. HRS. G) Age-patterns of weight for female APOE ɛ4 allele carriers, by AD history. Dashed line – females with AD onset at ages 75+. Solid line - females without AD and with lifespan (LS) 75 years or older. FHS. H) Age-patterns of weight for female APOE ɛ4 allele carriers, by AD history. Dashed line – females with AD onset at ages 75+. Solid line - females without AD and with lifespan (LS) 75 years or older. HRS.
Analysis
Age-trajectories of weight and probability of staying AD-free. Using information about longitudinal changes in weight in FHS and HRS, we evaluated and compared mean trajectories of weight between ages 35 and 75, and up to age 95, in FHS participants who did and did not develop AD at ages 75+. Similarly, weight trajectories were evaluated and compared in HRS, though starting age was older (60 years) there due to low availability of younger ages in HRS data.
We also estimated impact of a younger versus older AgeMax on AD risk. Specifically, we compared trajectories of the probability of staying AD-free at ages 80+ for those who were alive at age 80 and reached maximum weight before age 75 vs. those who reached such maximum at or after age 75, in FHS and HRS, using the Cox proportional hazards model. Similarly, we estimated impact of Slope of the weight (steeper versus flatter) on trajectories of the probability of staying free of AD at ages 80+, in FHS and HRS.
We used the time-scale of chronological age with left truncation for age at entry. Follow-up was up to 25.75 years (median: 19.29, mean: 18.00, SD: 6.59). The proportionality of hazards assumption of the Cox model was tested using R-package survival. All tests were insignificant (p-value >0.05) and, therefore, supported this assumption.
APOE ɛ4 associations with phenotypes characterizing age-trajectories of weight. We estimated associations between APOE4 carrier status and main characteristics of mean age-trajectories of weight, such as AgeMax and Slope. In FHS, information about APOE genotypes was retrieved from dbGaP legacy data, without imputation. In HRS, genetic imputation data from dbGaP was used. The number of APOE ɛ4 alleles carried by an individual was coded as 2 (ɛ4/ɛ4), 1 (ɛ2/ɛ4, ɛ3/ɛ4), and 0 (other). This was then used to estimate associations between the number of ɛ4 alleles and binary phenotypes characterizing age-trajectories of weight (Table 1, Annotation). Logistic regression models were used to test these associations in HRS and FHS. The covariates included birth year, education (0 – below high school, 1 – high school, 2 – above high school), and smoking (0 – nonsmoker, 1 - smoker). SAS 9.4 software was used for statistical analysis. Both the case and control groups were restricted to have at least 50 participants. Males and females were analyzed separately. Analyses were stratified by race in HRS. The FHS includes mostly White participants, therefore, no stratification by race was done there.
RESULTS
We compared the patterns of aging-related changes in weight between individuals who developed late-onset-AD and those who did not, taking into account the APOE4 carrier status. We also evaluated the impact of age at reaching maximum weight, and the slope of weight decline, on the risk of AD. Results of our analyses are shown in Figs. 1 and 2, and Table 1. We found that women who developed AD at ages 75+ had, on average, lower body weight, starting as early as in their 40s, and a younger AgeMax, compared to women who did not have AD history (Fig. 1). No significant differences were found for males (trajectories not shown).
Fig. 2
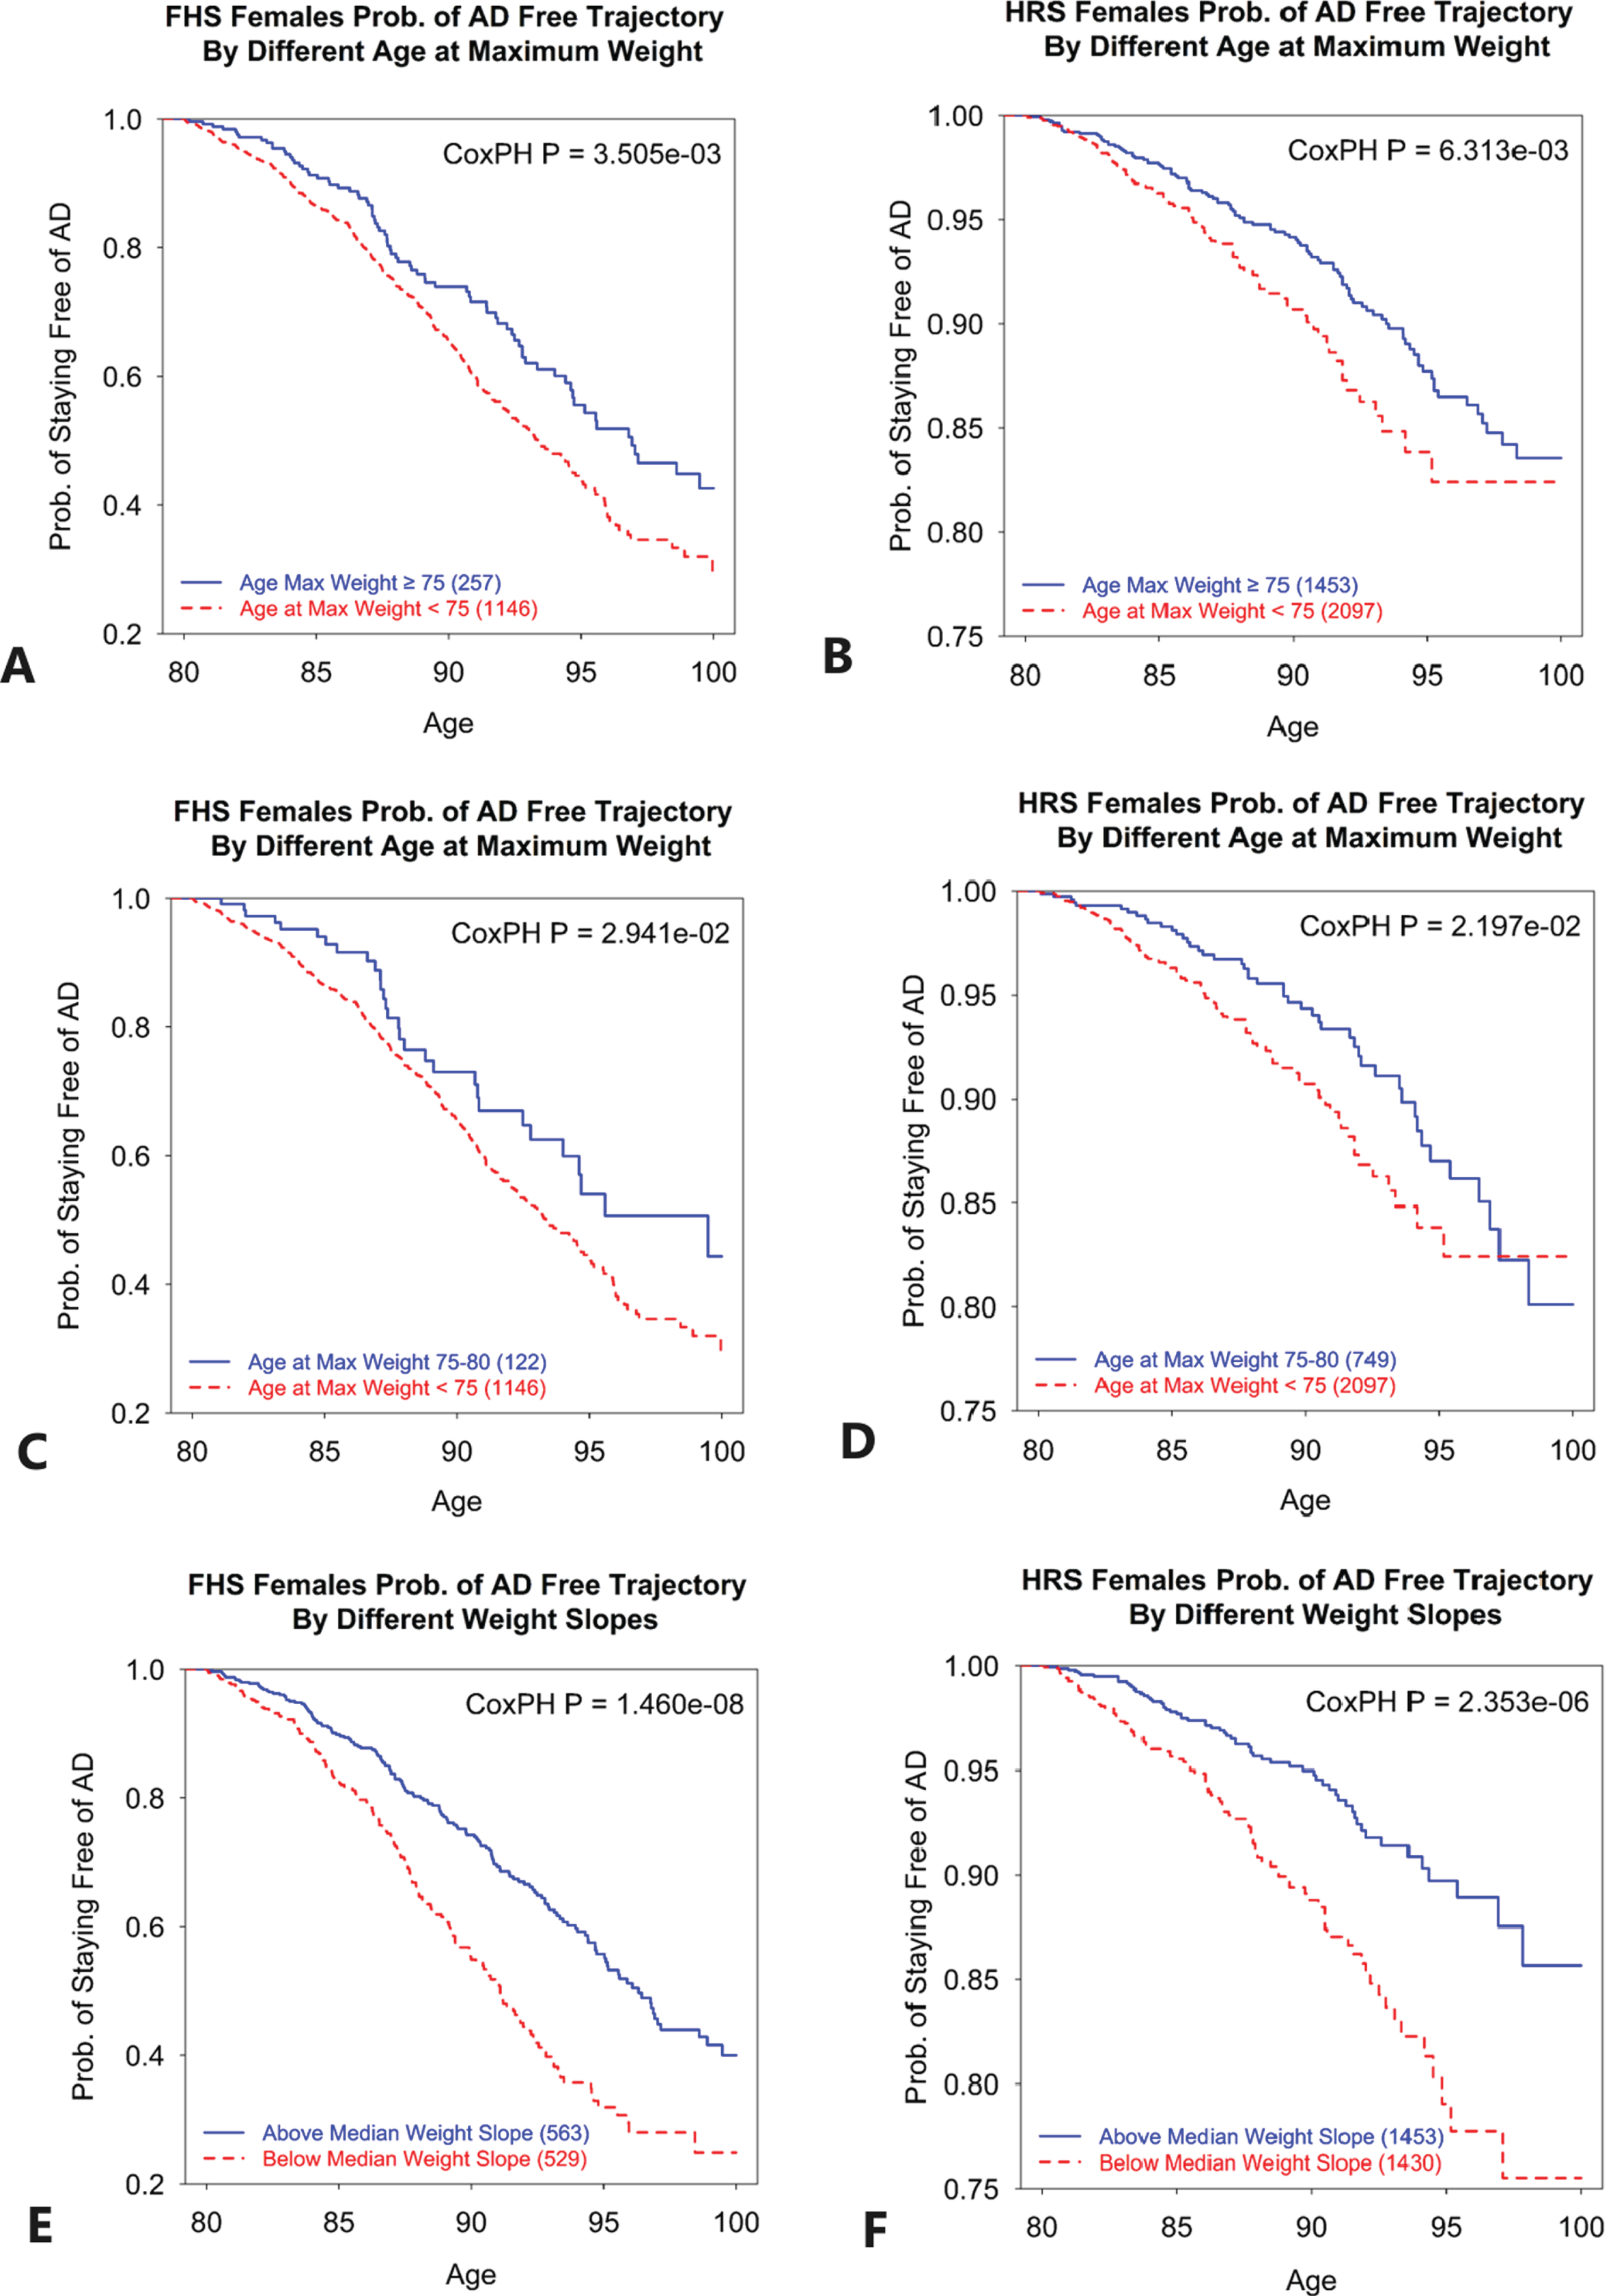
Trajectories of probability of staying AD-free for women with different ages at maximum weight, and different slopes of weight. A) Probability of staying free of AD at ages 80+ for women who reached maximum weight at ages 75 or older (solid line), compared to those who reached maximum weight at ages younger than 75 (dashed line). FHS. B) Probability of staying free of AD at ages 80+ for women who reached maximum weight at ages 75 or older (solid line), compared to those who reached maximum weight at ages younger than 75 (dashed line). HRS. C) Probability of staying free of AD at ages 80+ for women who reached maximum weight at ages 75–80 (solid line), compared to those who reached maximum weight at ages younger than 75 (dashed line). FHS. D) Probability of staying free of AD at ages 80+ for women who reached maximum weight at ages 75–80 (solid line), compared to those who reached maximum weight at ages younger than 75 (dashed line). HRS. E) Probability of staying free of AD at ages 80+ for women with slope of weight change above median (solid line), meaning slower or no decline in weight, compared to women with slope of weight change below median (dashed line), meaning faster decline in weight. FHS. F) Probability of staying free of AD at ages 80+ for women with slope of weight change above median (solid line), meaning slower or no decline in weight, compared to women with slope of weight change below median (dashed line), meaning faster decline in weight. HRS. The CoxPH P is p-value for testing the null hypothesis that the regression coefficient for respective variable is zero.
Similar relationships between AD and patterns of aging changes in weight were seen in carriers and non-carriers of APOE4, with older AgeMax seen in women without AD history (Fig. 1). Notably, in FHS with its longer follow up, a lower weight was observed in APOE4 non-carriers with AD up to four decades before AD onset (Fig. 1). The same was not evident for APOE4 carriers, though this might be because the latter group was relatively small in FHS.
Regardless of AD, APOE4 carriers compared to non-carriers had lower weight starting around age 65 (Fig. 1). Analysis of associations between APOE4 and binary phenotypes characterizing age-trajectories of weight, using logistic regression, found that carrying ɛ4 alleles was associated with younger AgeMax in HRS, and with steeper slopes of the weight decline in both HRS and FHS, particularly in females (Table 1). For males, results were not significant in FHS. They were also not significant in Black HRS participants (not shown).
The analysis of the probability of staying free of AD, stratified by AgeMax (<75 versus ≥75), as well as by Slope (above versus below median), revealed that AgeMax ≥75 and flatter Slope were both significant predictors of a lower risk of AD after age 80 in women, in both FHS and HRS data (Fig. 2).
DISCUSSION
Our study found that women who developed AD after age 75 had on average lower weight than AD-free women, seen as early as in their forties (Fig. 1). They also reached maximum values of weight about ten years earlier than AD-free women. This indicates that AD-relevant changes in the female body may start twenty, thirty or more years before clinical manifestation of AD. The weight loss could be an indicator of an underlying detrimental process (e.g., accelerated physical aging) which may contribute to AD risk. The early weight loss could also be a sign of already existing, hidden, AD. In the latter case, this would imply that the latent period between AD initiation and AD clinical manifestation could be very long, and that “late-onset” AD is actually disease that begins in early adulthood. The latter is not impossible and deserves further investigation. The lack of similar associations in men may point to female-specific hormonal changes during aging, such as menopause-related metabolic transitions, including decline in estrogen levels, among others, which might contribute to the higher female vulnerability to neurological diseases, including AD [17]. This possibility also deserves further investigation.
This study revealed that older AgeMax and flatter Slope are both significant predictors of lower risk of AD in women (Fig. 2). Respectively, younger age at reaching maximum weight, and faster decline in weight towards older ages were associated with higher AD risk. This points to a major role of accelerated physical aging in AD, which was also suggested by others [18]. A more detailed analysis of the interaction between AgeMax and weight groups (that is, whether the association between AgeMax and AD risk varies in normal weight and overweight/obese groups) would also be helpful in future studies.
The number of APOE ɛ4 alleles carried by an individual was associated with younger AgeMax and steeper Slope in our analysis (Table 1). This may point to a role of APOE4 in accelerated aging too, though the mechanism needs clarification. It might involve, e.g., impaired physical resilience of APOE4 carriers [19], among other factors. One should note, however, that female non-carriers of APOE4, who developed AD at ages 75+, had significantly lower weight and reached peak values of the weight at younger ages compared to non-carriers without AD history (Fig. 1). This means that the relationship between AD and lower weight, as well as aging changes in the weight, observed in this study, cannot be explained by the effects of APOE4. It remains to be determined whether or not APOE4 influences AD risk through the biological effects of Apolipoprotein E on age-trajectories of weight. This could be addressed by further exploration of these relationships using causal inference approaches.
Our findings are also broadly in line with recent research that explored connections between temporal changes in BMI and dementia. A study of FHS offspring cohort with 76 cases of various dementias found BMI trends with first increasing and then declining mid-life pattern being associated with higher risk of dementia in later life [20]. Also, a British cohort study of the changes in BMI during 28 years before dementia diagnosis, found that BMI in dementia cases became lower starting 8 years before the diagnosis [9]. That study, however, used a mixture of dementia diagnoses, while our study is focused on AD.
In conclusion, women with AD onset after age 75 had lower bodyweight (as compared to AD-free women) long before AD diagnosis, as early as in their forties. They also reached peak values of weight about ten years earlier than AD-free women. The observation that weight loss may precede clinical manifestation of AD by three or more decades is compatible with the idea that “late-onset” AD could be silently developing in the body since young adulthood and involve accelerated physical aging. In line, a higher age at maximum weight and a slower decline in weight were both significant predictors of lower risk of AD onset after age 80 in women. APOE4 is unlikely to be the main factor responsible for the association between lower weight and AD risk, as APOE4 non-carriers who developed AD had even lower weight than APOE4 carriers with AD (prior to AD onset). Using causal inference approaches may further clarify the relationships between APOE4, weight loss, and AD.
ACKNOWLEDGMENTS
The FHS is conducted and supported by the National Heart, Lung and Blood Institute (NHLBI) in collaboration with Boston University (N01 HC25195). The FHS data used for the analyses were obtained through the database of Genotypes and Phenotypes (dbGaP). The authors acknowledge investigators that contributed the phenotype and genotype data for this study. This manuscript was not prepared in collaboration with investigators of the FHS and does not necessarily reflect the opinions or views of the FHS, Boston University or the NHLBI. The HRS is sponsored by the National Institute on Aging (grant number U01AG009740) and is conducted by the University of Michigan. The HRS genetic data is sponsored by the National Institute on Aging (grant numbers U01AG009740, RC2AG036495, and RC4AG039029) and were obtained through dbGaP and the University of Michigan.
FUNDING
This research was supported by the National Institutes of Health’s National Institute on Aging (NIA/NIH), grants R01AG062623, RF1AG046860, R01AG070487, P30AG072958, and R01AG063971. This content is solely the responsibility of the authors and does not necessarily represent the official views of the NIA/NIH.
CONFLICT OF INTEREST
Dr. Akushevich is an Editorial Board Member of this journal but was not involved in the peer-review process nor had access to any information regarding its peer-review.
All other authors have no conflict of interest to report.
DATA AVAILABILITY
The authors cannot make FHS and HRS data freely available to other investigators due to dbGaP and the University of Michigan Data Use Certification Agreements restrictions; however, interested parties may contact these data providers to request access to the data through applicable data access request process.
REFERENCES
[1] | Besser LM , Gill DP , Monsell SE , Brenowitz W , Meranus DH , Kukull W , Gustafson DR ((2014) ) Body mass index, weight change, and clinical progression in mild cognitive impairment and Alzheimer disease. Alzheimer Dis Assoc Disord 28: , 36–43. |
[2] | Alosco ML , Duskin J , Besser LM , Martin B , Chaisson CE , Gunstad J , Kowall NW , McKee AC , Strern RA , Tripodis Y ((2017) ) Modeling the relationships among late-life body mass index, cerebrovascular disease, and Alzheimer’s disease neuropathology in an autopsy sample of 1,421 subjects from the National Alzheimer’s Coordinating Center Data Set. J Alzheimers Dis 57: , 953–968. |
[3] | Bell SP , Liu D , Samuels LR , Shah AS , Gifford KA , Hohman TJ , Jefferson AL ((2017) ) Late-life body mass index, rapid weight loss, Apolipoprotein E ɛ4 and the risk of cognitive decline and incident dementia. J Nutr Health Aging 21: , 1259–1267. |
[4] | Wang C , Fu W , Cao S , Jiang H , Guo Y , Xv H , Liu J , Gan Y , Lu Z ((2021) ) Weight loss and the risk of dementia: A meta-analysis of cohort studies. Curr Alzheimer Res 18: , 125–135. |
[5] | Astell-Burt T , Navakatikyan MA , Feng X ((2021) ) Behavioural change, weight loss and risk of dementia: A longitudinal study. Prev Med 145: , 106386. |
[6] | Kang SY , Kim Y-J , Jang W , Son KY , Park HS , Kim YS ((2021) ) Body mass index trajectories and the risk for Alzheimer’s disease among older adults. Sci Rep 11: , 3087. |
[7] | Kivimäki M , Luukkonen R , Batty GD , Ferrie JE , Pentti J , Nyberg ST , Shipley MJ , Alfredsson L , Fransson EI , Goldberg M , Knutsson A , Koskenvuo M , Kuosma E , Nordin M , Suominen SB , Theorell T , Vuoksimaa E , Westerholm P , Westerlund H , Zins M , Kivipelto M , Vahtera J , Kaprio J , Singh-Manoux A , Jokela M ((2018) ) Body mass index and risk of dementia: Analysis of individual-level data from 1.3 million individuals. Alzheimers Dement 14: , 601–609. |
[8] | Lee CM , Woodward M , Batty GD , Beiser AS , Bell S , Berr C , Bjertness E , Chalmers J , Clarke R , Dartigues J-F , Davis-Plourde K , Debette S , Angelantonio ED , Feart C , Frikke-Schmidt R , Gregson J , Haan MN , Hassing LB , Hayden KM , Hoevenaar-Blom MP , Kaprio J , Kivimaki M , Lappas G , Larson EB , LeBlanc ES , Lee A , Lui L-Y , van Charante EPM , Ninomiya T , Nordestgaard LT , Ohara T , Ohkuma T , Palviainen T , Peres K , Peters R , Qizilbash N , Richard E , Rosengren A , Seshadri S , Shipley MJ , Singh-Manoux A , Strand BH , van Gool WA , Vuoksimaa E , Yaffe K , Huxley RR ((2020) ) Association of anthropometry and weight change with risk of dementia and its major subtypes: A meta-analysis consisting 2.8 million adults with 57 294 cases of dementia. Obes Rev 21: , 12989. |
[9] | Singh-Manoux A , Dugravot A , Shipley MJ , Brunner EJ , Elbaz A , Sabia S , Kivimaki M ((2018) ) Obesity trajectories and risk of dementia: 28 years of follow-up in the Whitehall II Study. Alzheimers Dement 14: , 178–186. |
[10] | Kulminski AM , Loika Y , Culminskaya I , Huang J , Arbeev KG , Bagley O , Feitosa MF , Zmuda JM , Christensen K , Yashin AI , Long Life Family Study Research Group ((2019) ) Independent associations of TOMM40 and APOE variants with body mass index. Aging Cell 18: , 12869. |
[11] | Blautzik J , Kotz S , Brendel M , Sauerbeck J , Vettermann F , Winter Y , Bartenstein P , Ishii K , Rominger A , Alzheimer’s Disease Neuroimaging Initiative ((2018) ) Relationship between body mass index, ApoE4 status, and PET-based amyloid and neurodegeneration markers in amyloid-positive subjects with normal cognition or mild cognitive impairment. J Alzheimers Dis 65: , 781–791. |
[12] | Bäckman K , Joas E , Waern M , Östling S , Guo X , Blennow K , Skoog I , Gustafson DR ((2015) ) 37 years of body mass index and dementia: Effect modification by the APOE genotype: Observations from the Prospective Population Study of Women in Gothenburg, Sweden. J Alzheimers Dis 48: , 1119–1127. |
[13] | Rajan KB , Skarupski KA , Rasmussen HE , Evans DA ((2014) ) Gene-environment interaction of body mass index and apolipoprotein E ɛ4 allele on cognitive decline. Alzheimer Dis Assoc Disord 28: , 134–140. |
[14] | Seshadri S , Beiser A , Au R , Wolf PA , Evans DA , Wilson RS , Petersen RC , Knopman DS , Rocca WA , Kawas CH , Corrada MM , Plassman BL , Langa KM , Chui HC ((2011) ) Operationalizing diagnostic criteria for Alzheimer’s disease and other age-related cognitive impairment-Part 2. Alzheimers Dement 7: , 35–52. |
[15] | Bachman DL , Wolf PA , Linn R , Knoefel JE , Cobb J , Belanger A , D’Agostino RB , White LR ((1992) ) Prevalence of dementia and probable senile dementia of the Alzheimer type in the Framingham Study. Neurology 42: , 115–119. |
[16] | Crow RS , Petersen CL , Cook SB , Stevens CJ , Titus AJ , Mackenzie TA , Batsis JA ((2020) ) Reported weight change in older adults and presence of frailty. J Frailty Aging 9: , 74–81. |
[17] | Brinton RD , Yao J , Yin F , Mack WJ , Cadenas E ((2015) ) Perimenopause as a neurological transition state. Nat Rev Endocrinol 11: , 393–405. |
[18] | Leparulo A , Bisio M , Redolfi N , Pozzan T , Vassanelli S , Fasolato C ((2022) ) Accelerated aging characterizes the early stage of Alzheimer’s disease. Cells 11: , 238. |
[19] | Ukraintseva S , Arbeev K , Duan M , Akushevich I , Kulminski A , Stallard E , Yashin A ((2021) ) Decline in biological resilience as key manifestation of aging: Potential mechanisms and role in health and longevity. Mech Ageing Dev 194: , 111418. |
[20] | Li J , Liu C , Ang TFA , Au R ((2023) ) BMI decline patterns and relation to dementia risk across four decades of follow-up in the Framingham Study. Alzheimers Dement 19: , 2520–2527. |


