
Accumulation of pTau231 at the Postsynaptic Density in Early Alzheimer’s Disease
Abstract
Background:
Phosphorylated cytoplasmic tau inclusions correlate with and precede cognitive deficits in Alzheimer’s disease (AD). However, pathological tau accumulation and relationships to synaptic changes remain unclear.
Objective:
To address this, we examined postmortem brain from 50 individuals with the full spectrum of AD (clinically and neuropathologically). Total tau, pTau231, and AMPA GluR1 were compared across two brain regions (entorhinal and middle frontal cortices), as well as clinically stratified groups (control, amnestic mild cognitive impairment, AD dementia), NIA-AA Alzheimer’s Disease Neuropathologic Change designations (Not, Low, Intermediate, High), and Braak tangle stages (1–6). Significant co-existing pathology was excluded to isolate changes attributed to pathologic AD.
Methods:
Synaptosomal fractionation and staining were performed to measure changes in total Tau, pTau231, and AMPA GluR1. Total Tau and pTau231 were quantified in synaptosomal fractions using Quanterix Simoa HD-X.
Results:
Increasing pTau231 in frontal postsynaptic fractions correlated positively with increasing clinical and neuropathological AD severity. Frontal cortex is representative of early AD, as it does not become involved by tau tangles until late in AD. Entorhinal total tau was significantly higher in the amnestic mild cognitive impairment group when compared to AD, but only after accounting for AD associated synaptic changes. Alterations in AMPA GluR1 observed in the entorhinal cortex, but not middle frontal cortex, suggest that pTau231 mislocalization and aggregation in postsynaptic structures may impair glutamatergic signaling by promoting AMPA receptor dephosphorylation and internalization.
Conclusion:
Results highlight the potential effectiveness of early pharmacological interventions targeting pTau231 accumulation at the postsynaptic density.
INTRODUCTION
Alzheimer’s disease (AD) is the most common cause of dementia in the elderly population. Progressive neurodegenerative changes in the brain lead to irreversible short-term memory loss and cognitive impairment [1]. AD is characterized by co-existing neuropathologic lesions that include diffuse plaques, neuritic plaques, and neurofibrillary tangles. Extracellular diffuse amyloid-β (Aβ) plaques are focal lesions that are comprised of extracellular Aβ. Neuritic plaques are focal extracellular lesions that are comprised of both Aβ and tau immunoreactive dystrophic neurites. Neurofibrillary tangles are intraneuronal cytoplasmic inclusions, that are comprised of phosphorylated tau [2, 3]. The protein tau is also known as microtubule-associated protein and is encoded by the MAPT gene on chromosome 17q21. Tau’s microtubule-binding domain is where filaments specifically form through microtubule polymerization to create the scaffold for axonal transport [4]. Extensive post-translational modifications such as phosphorylation, acetylation, and proteolytic cleavage, may lead to post-synaptic tau mislocalization and accumulation in AD [5, 6]. Tau has long been recognized as an axonal microtubule-associated protein. However, both soluble (hyperphosphorylated, misfolded, and mislocalized) and fibrillar tau contribute to neuronal and synaptic malfunction, the main contributing pathophysiological changes in AD. Hyperphosphorylated tau accumulates in the soma, neurites, and dendrites, rendering it inaccessible to microtubules and disrupting axonal transport [7]. Soluble oligomeric tau species have been proposed to precede neurofibrillary tangle formation in addition to negatively impacting synapses [8].
Synaptic plasticity and the formation of dendritic spines are the structural correlates of learning and memory [9]. Thus, synaptic dysfunction, or “synaptopathy” [10], plays an important role in memory impairment [11]. Dendritic spines are small protrusions of neuronal dendrites that receive axonal input at the synapse through different receptors. N-methyl-D-aspartate receptors (NMDARs) are ligand-gated non-selective ionotropic glutamate receptors (iGluRs). NMDARs along with other iGluRs, such as α-amino-3-hydroxy-5-methylisoxazole-4-isoxazopropionic acid receptors (AMPARs), play an important role in the rapid regulation of synaptic plasticity. Specifically, activity-dependent long-term depression weakens synaptic activity by increasing the internalization of surface AMPARs at the post-synaptic density [12]. Notably, both phosphorylation and dephosphorylation of AMPARs can decrease their density at the postsynaptic membrane [13]. AMPAR internalization and impaired glutamatergic signaling have been attributed to tau mislocalizing and accumulating in the postsynaptic dendritic spines [5]. In the very early stages of AD, post-translationally modified tau mislocalizes to the dendrites and soma. This ultimately results in dendritic spine loss, synaptic dysfunction, cytotoxicity, and cell death. The exact cellular mechanisms by which hyperphosphorylated tau causes early synaptic dysfunction remain unclear. However, tau mislocalization without post-translational modification (e.g., phosphorylation) is not enough on its own to result in synaptic dysfunction [14, 15]. Phosphorylation in tau’s proline-rich region, which includes T231, is thought to activate a signaling cascade where calcineurin dephosphorylates the subunit GluA1 of the AMPAR. This dephosphorylation leads to AMPAR internalization and synaptic dysfunction [16]. Furthermore, it has been shown that region-specific phosphorylation in the Proline rich region is sufficient to induce the formation of tau with SDS-resistant functional domains suppressing tau’s interactions [17]. Results to date indicate that modifications in the Proline rich region of tau are sufficient to induce the tau abnormalities that have been observed in AD. This has also been supported by previous studies of postsynaptic tau in animal and cellular neurodegenerative disease models [15]. Positron emission tomography radiotracers have additionally shown that pathologic tau is associated with increased cognitive impairment in vivo [18, 19]. Mouse models mirroring early tau phosphorylation and aggregation support the hypothesis that early changes in tau play a key role in the development of neurophysiological and cognitive deficits [20]. These concordant mouse model findings suggest a role for phosphorylation-dependent tau mislocalization and aggregation at the postsynaptic density, resulting in synaptic dysfunction and memory impairment very early in AD. Furthermore, research has described that hWT-Tau Drosophila larvae have increased pTau231 levels in the nerve cell bodies when compared to P301 L larvae [21]. Taken together, these prior studies all support that tau T231 phosphorylation may be one of the earliest changes in AD pathogenesis.
However, soluble forms of postsynaptic tau have not yet been comprehensively quantified in clinically and neuropathologically characterized postmortem human brain samples across the AD spectrum. Pathological tau accumulation begins in the brainstem and entorhinal cortices and subsequently involves the hippocampi and temporal cortices [22]. Over time in later stages of the disease, the accumulation of pathological tau extends to involve the entire cerebrum [22]. Leveraging the well-established tau tangle spreading sequence as originally described by Braak et al. [22] enables the direct comparison of a brain region that is known to be involved by tau tangles early in AD (entorhinal cortex) with a brain region that is known to be involved much later by tau tangles in AD (frontal cortex). This targeted approach enables the examination of the chronological sequence of events relevant to AD pathogenesis involving pathological tau accumulation.
The primary aim of this study is to quantitatively assess total tau and pTau231 across the entire clinical and neuropathological spectrums of AD in enriched postsynaptic density fractions. We used a validated mouse brain synaptosomal preparation protocol on human brain tissue samples [16, 23]. To examine tau phosphorylation and mislocalization within neurons, we selected tau phosphorylated at Threonine 231 (pTau231) and total tau as our two tau species of interest. Phosphorylation at T231 has been shown to contribute to tau dissociation from microtubules by 26% [24]. For this reason, we specifically chose to focus on pTau231 for our study. PSD-95, a post-synaptic density protein, has been described by others to be both increased [25] or decreased [26] in advancing AD. Specifically, an increase in PSD-95 expression may suggest a change in NMDA receptor trafficking and this perhaps may represent a marker of functional significance for AD pathogenesis [25]. However, as there have been only limited studies investigating the association between Tau, PSD-95, and glutamatergic receptors in the human AD brain, we aimed to address this issue in our current study as a secondary aim. Here, we specifically examined the relationships between pTau231, PSD-95, and total AMPA receptors in the development of AD dementia. To better explore the pattern of neurobiological marker changes over the course of clinical dementia progression, brains from individuals who were cognitively intact, brains from individuals with amnestic mild cognitive impairment (aMCI), and brains from individuals with AD dementia were assessed.
MATERIALS AND METHODS
Participants, eligibility criteria
Middle frontal cortex and entorhinal cortex postmortem human brain samples that were thawed from being frozen at –80°C, in addition to formalin-fixed paraffin-embedded (FFPE) tissue sections from entorhinal cortex and frontal cortex regions were obtained from the Alzheimer’s Disease Research Centers at the Mayo Clinic and Northwestern University, in addition to the community-based Mayo Clinic Study of Aging (MCSA) in Olmstead County, Minnesota [27]. Appropriate approval was obtained from the Mayo Clinic, Olmsted Medical Center, and Northwestern Institutional Review Boards. All participants underwent a review of past medical history, mental status examinations, neurological examinations, and neuropsychological assessments. This information was used to determine clinical diagnoses of aMCI and AD dementia via expert review using established criteria [28, 29]. Cognitively unimpaired individuals were those who did not meet the criteria for either aMCI or AD dementia. Using established criteria, all postmortem autopsy brains were comprehensively assessed by board-certified neuropathologists (MEF, QM, DWD, RR) [30, 31]. Neuropathologic inclusion criteria for this study required a full spectrum of National Institute on Aging and Alzheimer’s Association (NIA-AA) Alzheimer’s disease Neuropathologic Change (Not, Low, Intermediate, and High) [30, 31], while excluding other clinically relevant co-existing lesions (e.g., Lewy body disease, pathological TDP43, or greater than one vascular brain lesion). The median ages for the control, aMCI, and AD dementia groups were 85.5, 91.5, and 87.5 years respectively. The median postmortem interval time was 16 h and did not differ by clinical diagnosis. The median amount of time between the last clinical assessment and death was 10.9 months. The entire study cohort is shown in Table 1. The NanoString Supplemental Cases used for this work were from the Nun Study which was reviewed and approved by institutional review boards (IRBs) at University of Kentucky, University of Minnesota, and Northwestern University. Supplemental Nun Study samples were specifically approved for use in this study by the Nun Study approval committee per approved Nun Study IRB protocol at Northwestern University. Participating School Sisters of Notre Dame had agreed to autopsy prior to death, with final authorizations provided by the Provincial Leader. Nun Study cases were age and sex matched and selected to compare Braak neurofibrillary tangle stage 0 versus 2, while excluding all other co-existing lesions (e.g., Lewy body disease, Aβ plaques).
Table 1
Study Cohort by NIA-AA Alzheimer’s Disease Neuropathologic Change Designations
| NIA-AA Alzheimer’s Disease Neuropathologic Change Designations | |||||
| Not | Low | Intermediate | High | p | |
| (N = 4) | (N = 16) | (N = 15) | (N = 15) | ||
| Age at time of death | 0.36211 | ||||
| N | 4 | 16 | 15 | 15 | |
| Mean (SD) | 83 (7.874) | 89 (5.852) | 89.8 (7.377) | 85.5 (8.016) | |
| Median | 82.0 | 88.0 | 87.0 | 87.0 | |
| Range | 73.0, 95.0 | 81.0, 99.0 | 75.0, 102.0 | 59.0, 94.0 | |
| Sex, n (%) | 0.34642 | ||||
| F | 1 (25.0%) | 11 (68.8%) | 7 (46.7%) | 7 (46.7%) | |
| M | 3 (75.0%) | 5 (31.3%) | 8 (53.3%) | 8 (53.3%) | |
| APOE, n (%) | 0.16572 | ||||
| 2/3 | 0 (0.0%) | 1 (6.25%) | 3 (20.0%) | 0 (0.0%) | |
| 2/4 | 0 (0.0%) | 1 (6.25%) | 0 (0.0%) | 1 (6.7%) | |
| 3/3 | 4 (100.0%) | 12 (75.0%) | 5 (33.3%) | 7 (46.7%) | |
| 3/4 | 0 (0.0%) | 2 (12.5%) | 6 (40.0%) | 7 (46.7%) | |
| 4/4 | 0 (0.0%) | 0 (0.0%) | 1 (6.5%) | 0 (0.0%) | |
| DIAG group, n (%) | <0.00012 | ||||
| AD dementia | 0 (0.0%) | 0 (0.0%) | 4 (26.7%) | 14 (93.3%) | |
| Normal controls | 3 (75.0%) | 13 (81.3%) | 0 (0.0%) | 0 (0.0%) | |
| aMCI | 1 (25.0%) | 3 (23.1%) | 11 (73.3%) | 1 (6.7%) | |
Cases are stratified by NIA-AA Alzheimer’s disease neuropathologic change designations: Not, Low, Intermediate, and High. F, female; M, male; APOE, Apolipoprotein E allele; AD, Alzheimer’s disease dementia; aMCI, amnestic mild cognitive impairment. 1Kruskal-Wallis p-value; 2Chi-Square p-value.
Synaptosomal preparation
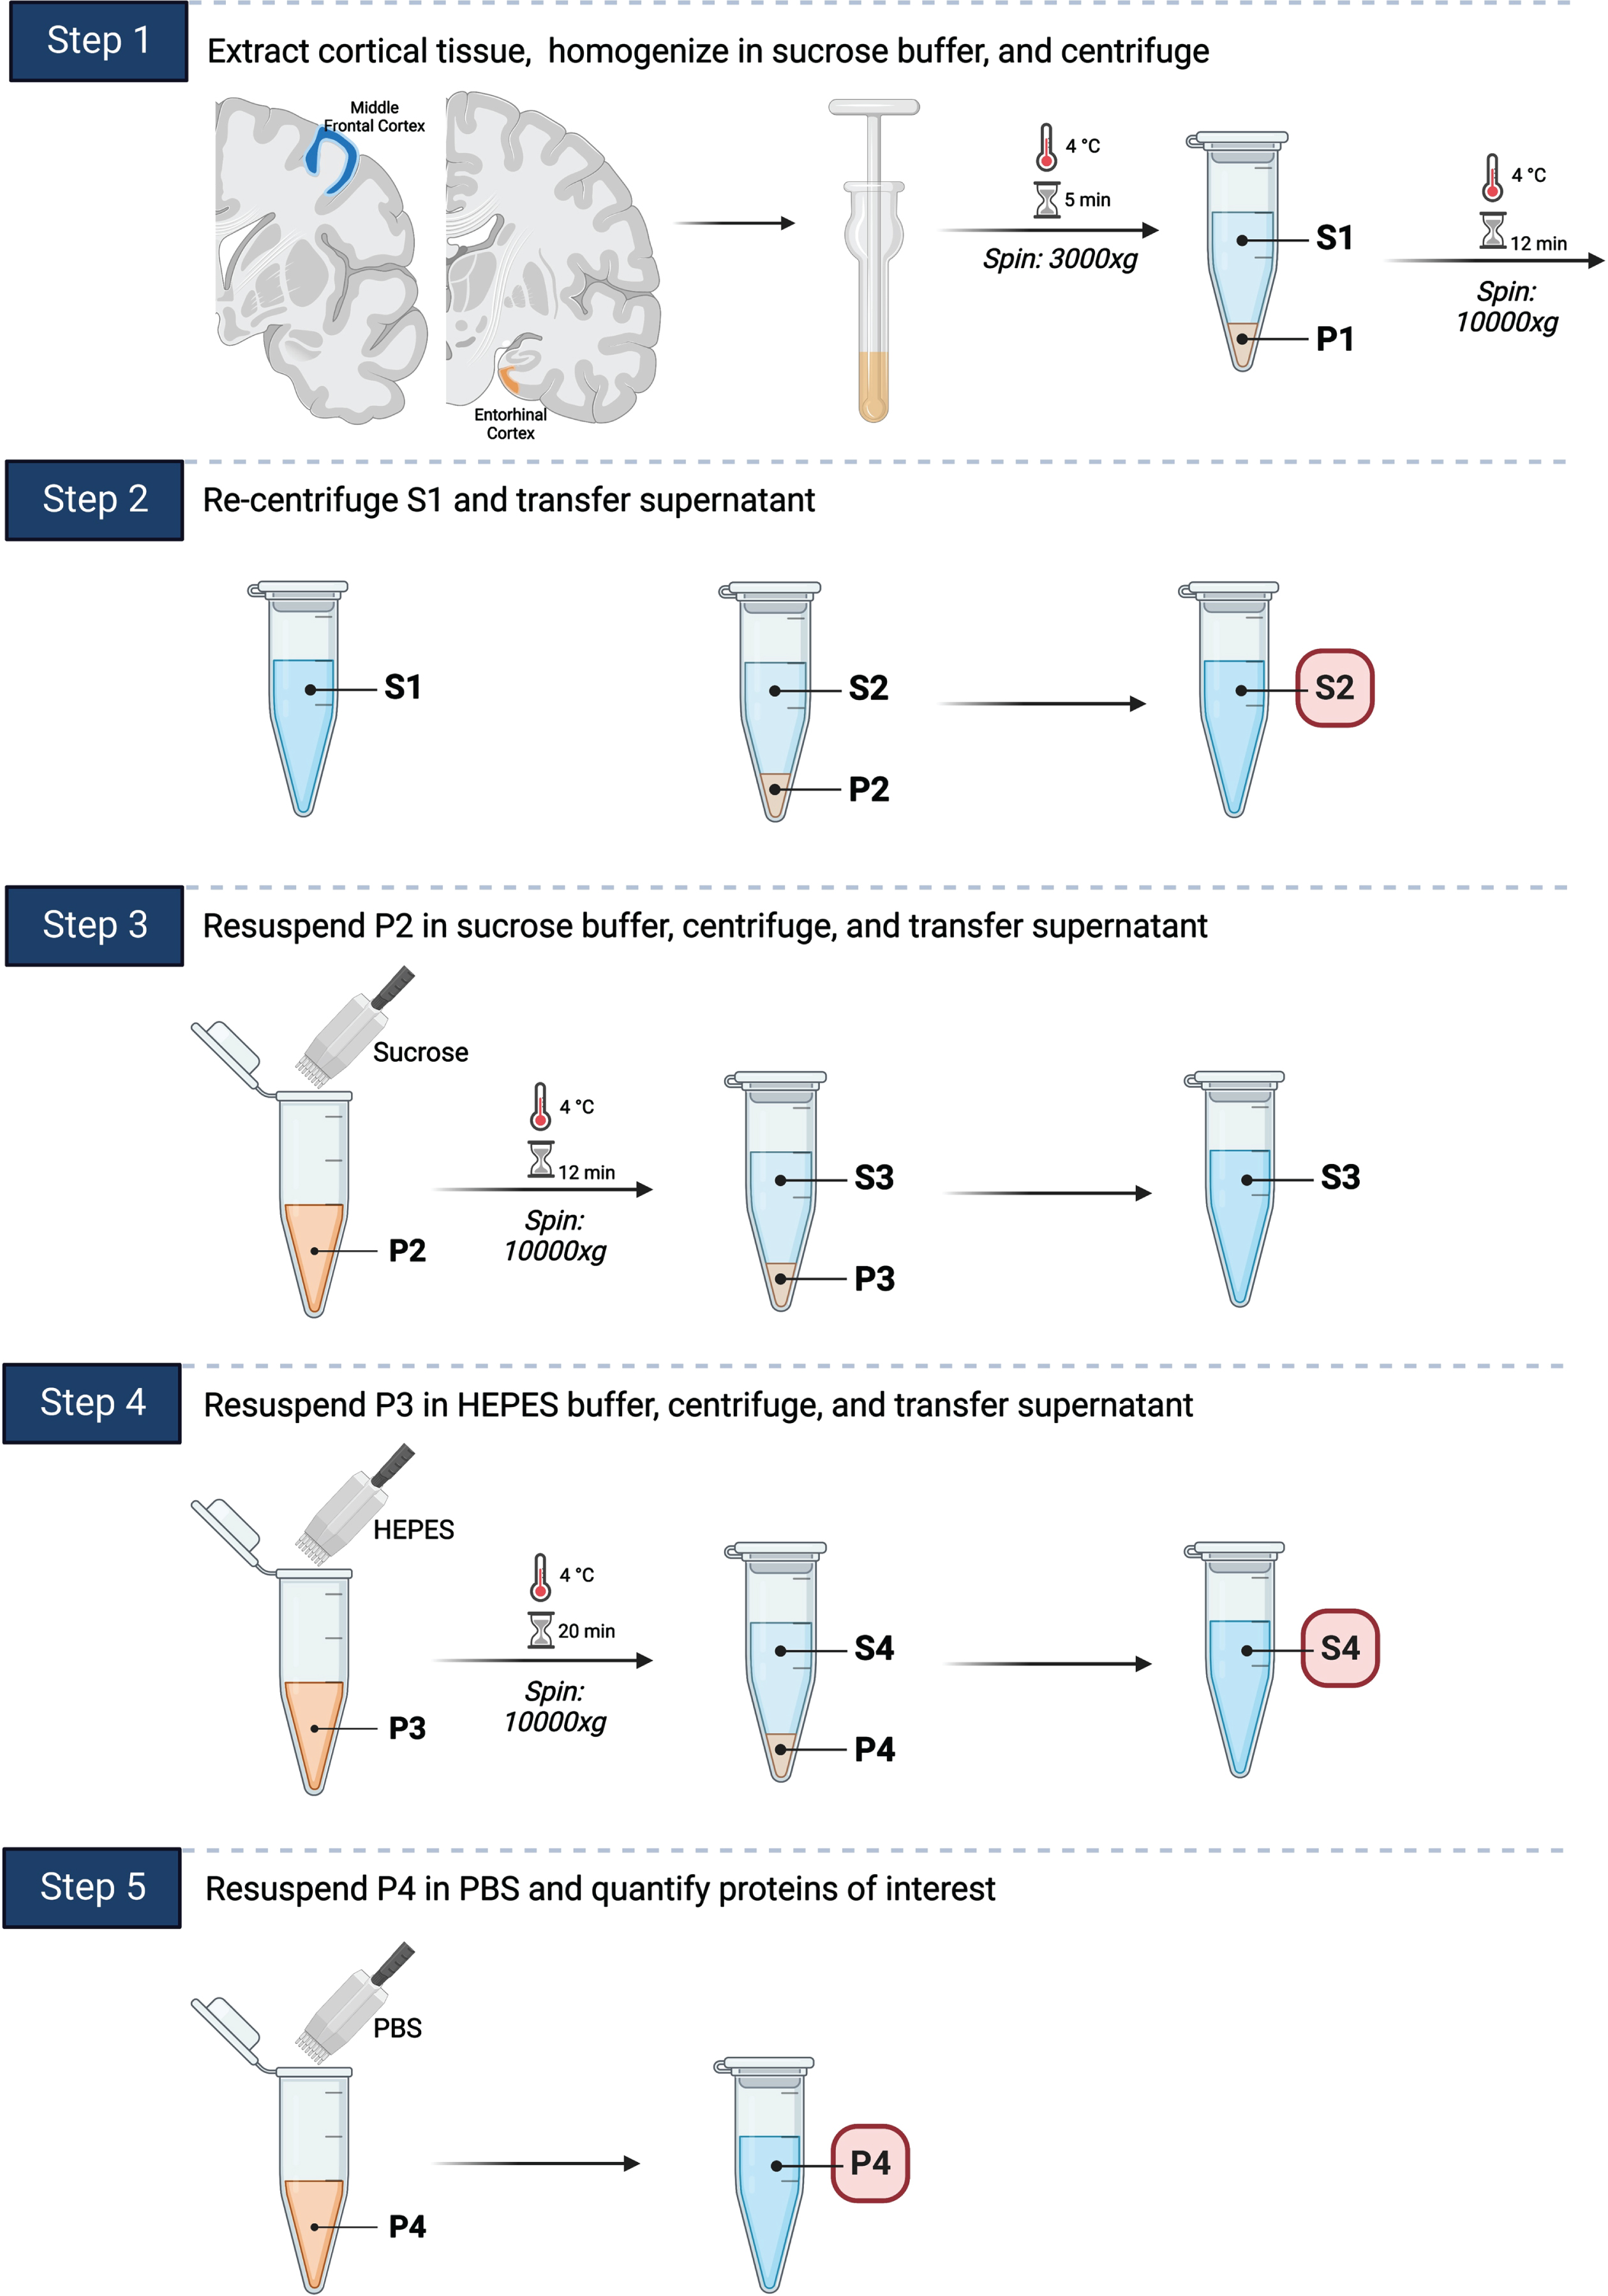
We applied a well-established mouse postsynaptic density fractionation protocol in order to isolate postsynaptic fractions in human brain tissues (Fig. 1) [16, 23]. Frozen human brain tissue was thawed and subsequently homogenized in sucrose buffer. The lysates were then centrifuged through multiple steps to separate postsynaptic (P4) fractions. Cortical tissue from the middle frontal cortex and entorhinal cortex was extracted as previously described and stored at –80°C until used for experiments [32]. Tissue was homogenized in sucrose buffer (0.32 mM Sucrose, 25 mM HEPES, protease inhibitor, a phosphatase inhibitor, phenanthroline monohydrate, PMSF) on ice. Lysates were centrifuged at 3000xg (g Force or relative centrifugal force) for 5 min at 4°C, and the resulting supernatant (S1) was transferred to another tube (P4). P4 was then centrifuged again (10,000xg for 12 min at 4°C), and the resulting supernatant was transferred to another tube (S2). P4 pellet was resuspended in sucrose buffer, vortexed, and centrifuged (10,000xg for 12 min at 4°C). The resulting supernatant was then transferred to another tube (S3). P4 pellet was resuspended again in HEPES buffered saline (25 mM HEPES, 150 mM NaCl, 2% Triton), incubated on ice for 30 min, and centrifuged (10,000xg for 20 min at 4°C). The resulting supernatant was transferred to a new tube (S4). P4 pellet was resuspended for a final time in PBS. Protein concentrations in S2, S4, and P4 (PSD-95 enriched postsynaptic fraction) were determined via BCA protein assay (Abcam). Additional synaptosomal preparation protocol details are included in Supplementary Tables 1 and 2. Individuals performing the synaptosomal preparation experiments were blinded to the research participants’ demographic, clinical, and neuropathologic characteristics.
Fig. 1
Synaptosomal preparation. A fractionation protocol previously used for mouse model brains was adapted for use on human brain tissue samples. 1) Cortical tissue from the middle frontal gyrus and entorhinal cortex was extracted, homogenized in sucrose buffer, and centrifuged. 2) The resulting supernatant was transferred to a new tube and re-centrifuged. The resulting supernatant (S2) was transferred to a new tube for storage. 3) The pellet was resuspended in sucrose buffer, centrifuged, and the resulting supernatant transferred to a new tube. 4) The pellet was resuspended again in HEPES buffer, centrifuged, and the resulting supernatant (S4) transferred to a new tube for storage. 5) The pellet (P4) was resuspended for a final time in PBS and stored at –80°C. Total Tau and pTau231 were quantified using ELISA based Simoa Quanterix HDX in P4, S4, and S2. PSD-95 was additionally quantified using western blot for P4 fraction and these results were used for taking AD associated synaptic changes into consideration.
Human brain lysates and immunoblotting
Equal volumes of protein extracts were loaded in each well of a 4–20% Mini-PROTEAN TGX Stain-Free Protein Gel (BioRad), separated by electrophoresis, and transferred onto an FL-PVDF membrane (Millipore). Nonspecific binding sites were blocked in Intercept Blocking Buffer (LI-COR) for 1 h. Blots were probed overnight at 4°C. Bands were visualized by two-channel multiplex fluorescence (LI-COR Odyssey Fc). Quantification of western blots was performed using LI-COR Empiria Studio software. Samples were normalized using Revert Total Protein Stain (LI-COR). Antibodies used in this study were anti-PSD-95 (Antibodies Inc.), anti-synaptophysin (Abcam), anti-GAPDH (LI-COR), and anti-beta-actin (LI-COR) (Supplementary Table 3). Individuals performing the immunoblotting experiments were blinded to the research participants’ demographic, clinical, and neuropathologic characteristics.
Synaptosomal tau measurements using Single-Molecule Array (Simoa)
Total Tau was quantified using the Quanterix Simoa HD-X Platform. Quanterix Tau 2.0 and pTau231 kits (Quanterix, Billerica, MA, USA) were used according to kit protocols with minor modifications. Briefly, the Simoa enzyme-linked immunoassay method uses a combination of a capture antibody which recognizes amino acid 16–24 and a detector antibody recognizing amino acids 218–222, with a digital array technology that allows the measurement of total tau. Serially diluted recombinant full-length human tau (ON4 R splicing isoform) protein was used to generate the calibration curve. Soluble total tau and pTau231 quantifications were performed within the linear range of the calibration curve for all samples analyzed. The lower limit of detection (LLOD) and lower limit of quantitation (LLOQ) for total tau are reported at 0.019 and 0.061 pg/mL, respectively. The pTau231 kits (Quanterix, Billerica, MA, USA) were run according to kit protocol with minor modifications. For the pTau231 Simoa assay, N-terminal to mid-domain forms of tau phosphorylated at Threonine-231 was measured and non-phosphorylated forms of tau were not recognized. The LLOD and LLOQ for pTau231 were reported at 0.621 and 1.83 pg/mL, respectively. Samples were tested in duplicate and calibrated. Extracts of synaptosomal fraction tissue homogenate were serially diluted in PBS twice at 200x for a total dilution factor of 40,000x. The total tau samples were run in “neat” mode on the instrument, meaning no further dilution was performed during the run, whereas the pTau231 samples were run with 4x online dilution on the instrument, per the manufacturer’s recommendation. Any samples that fell outside of the calibration curve were retested at higher or lower dilution factors (as appropriate) until they could be accurately quantified. Reported values were adjusted for any online or offline dilutions. Individuals performing the Simoa Quanterix total Tau and pTau231 assays were blinded to the research participants’ demographic, clinical, and neuropathologic characteristics. All Simoa Quanterix experiments quantifying the levels of total Tau and pTau231 were performed in duplicate.
Quantitative Brightfield neuropathologic evaluations
These evaluations were performed on the cases included in Table 1. Paraffin-embedded tissue sections from the entorhinal cortex and frontal gyrus were cut to a thickness of 5μm for immunohistochemical staining. First, sections were placed in 3% H2O2 in methanol for 10 min, then washed in distilled water. Next antigen retrieval was performed in the Decloaking Chamber (Biocare Medical, Pacheco, CA) for 20 min using a citrate buffer, pH 6.0. Following washes in distilled water, sections were blocked in 3% bovine serum albumin at room temperature for 1 h. Sections were then incubated in primary antibody anti-glutamate receptor 1 AMPA subtype (rabbit monoclonal, 1:200, Abcam EPR19522, Boston, MA) overnight at 4°C. Biotinylated secondary antibodies (goat-anti-rabbit, Biocare. Pacheco, CA) were amplified using avidin-biotin substrate (ABC ELITE solution, Vector Laboratories), followed by color development with DAB chromogen (K4007, DAKO) and counterstained with hematoxylin QS (Vector Laboratories). The stained tissue sections were digitized using an Olympus VS 200 Slide Scanner microscope system at 20x magnification. Boundaries of the hippocampus, entorhinal cortex, and middle frontal gyrus grey matter were annotated following the anatomical protocol by Ding and Van Hoesen [33]. Quantification of the total anti-glutamate receptor 1 AMPA subtype via immunohistochemistry in the annotated tissue sections was performed using the percent area quantification module, HALO software version 3.2 (Indica Labs). Values obtained via the HALO area quantification module are based on dividing the measured anti-glutamate receptor 1 AMPA immunohistochemical staining of by the total annotated tissue area for each region of interest. The software automatically excluded tissue gaps from the analysis, and settings were optimized to recognize total positive staining area in addition to annotated levels of weak, intermediate, and strong staining intensity. Data were expressed as percent area positivity based on staining intensity. Figure 2 shows the digital pathology analysis overlay that was used for the quantitative total AMPAR GluR1 data extraction.
Fig. 2
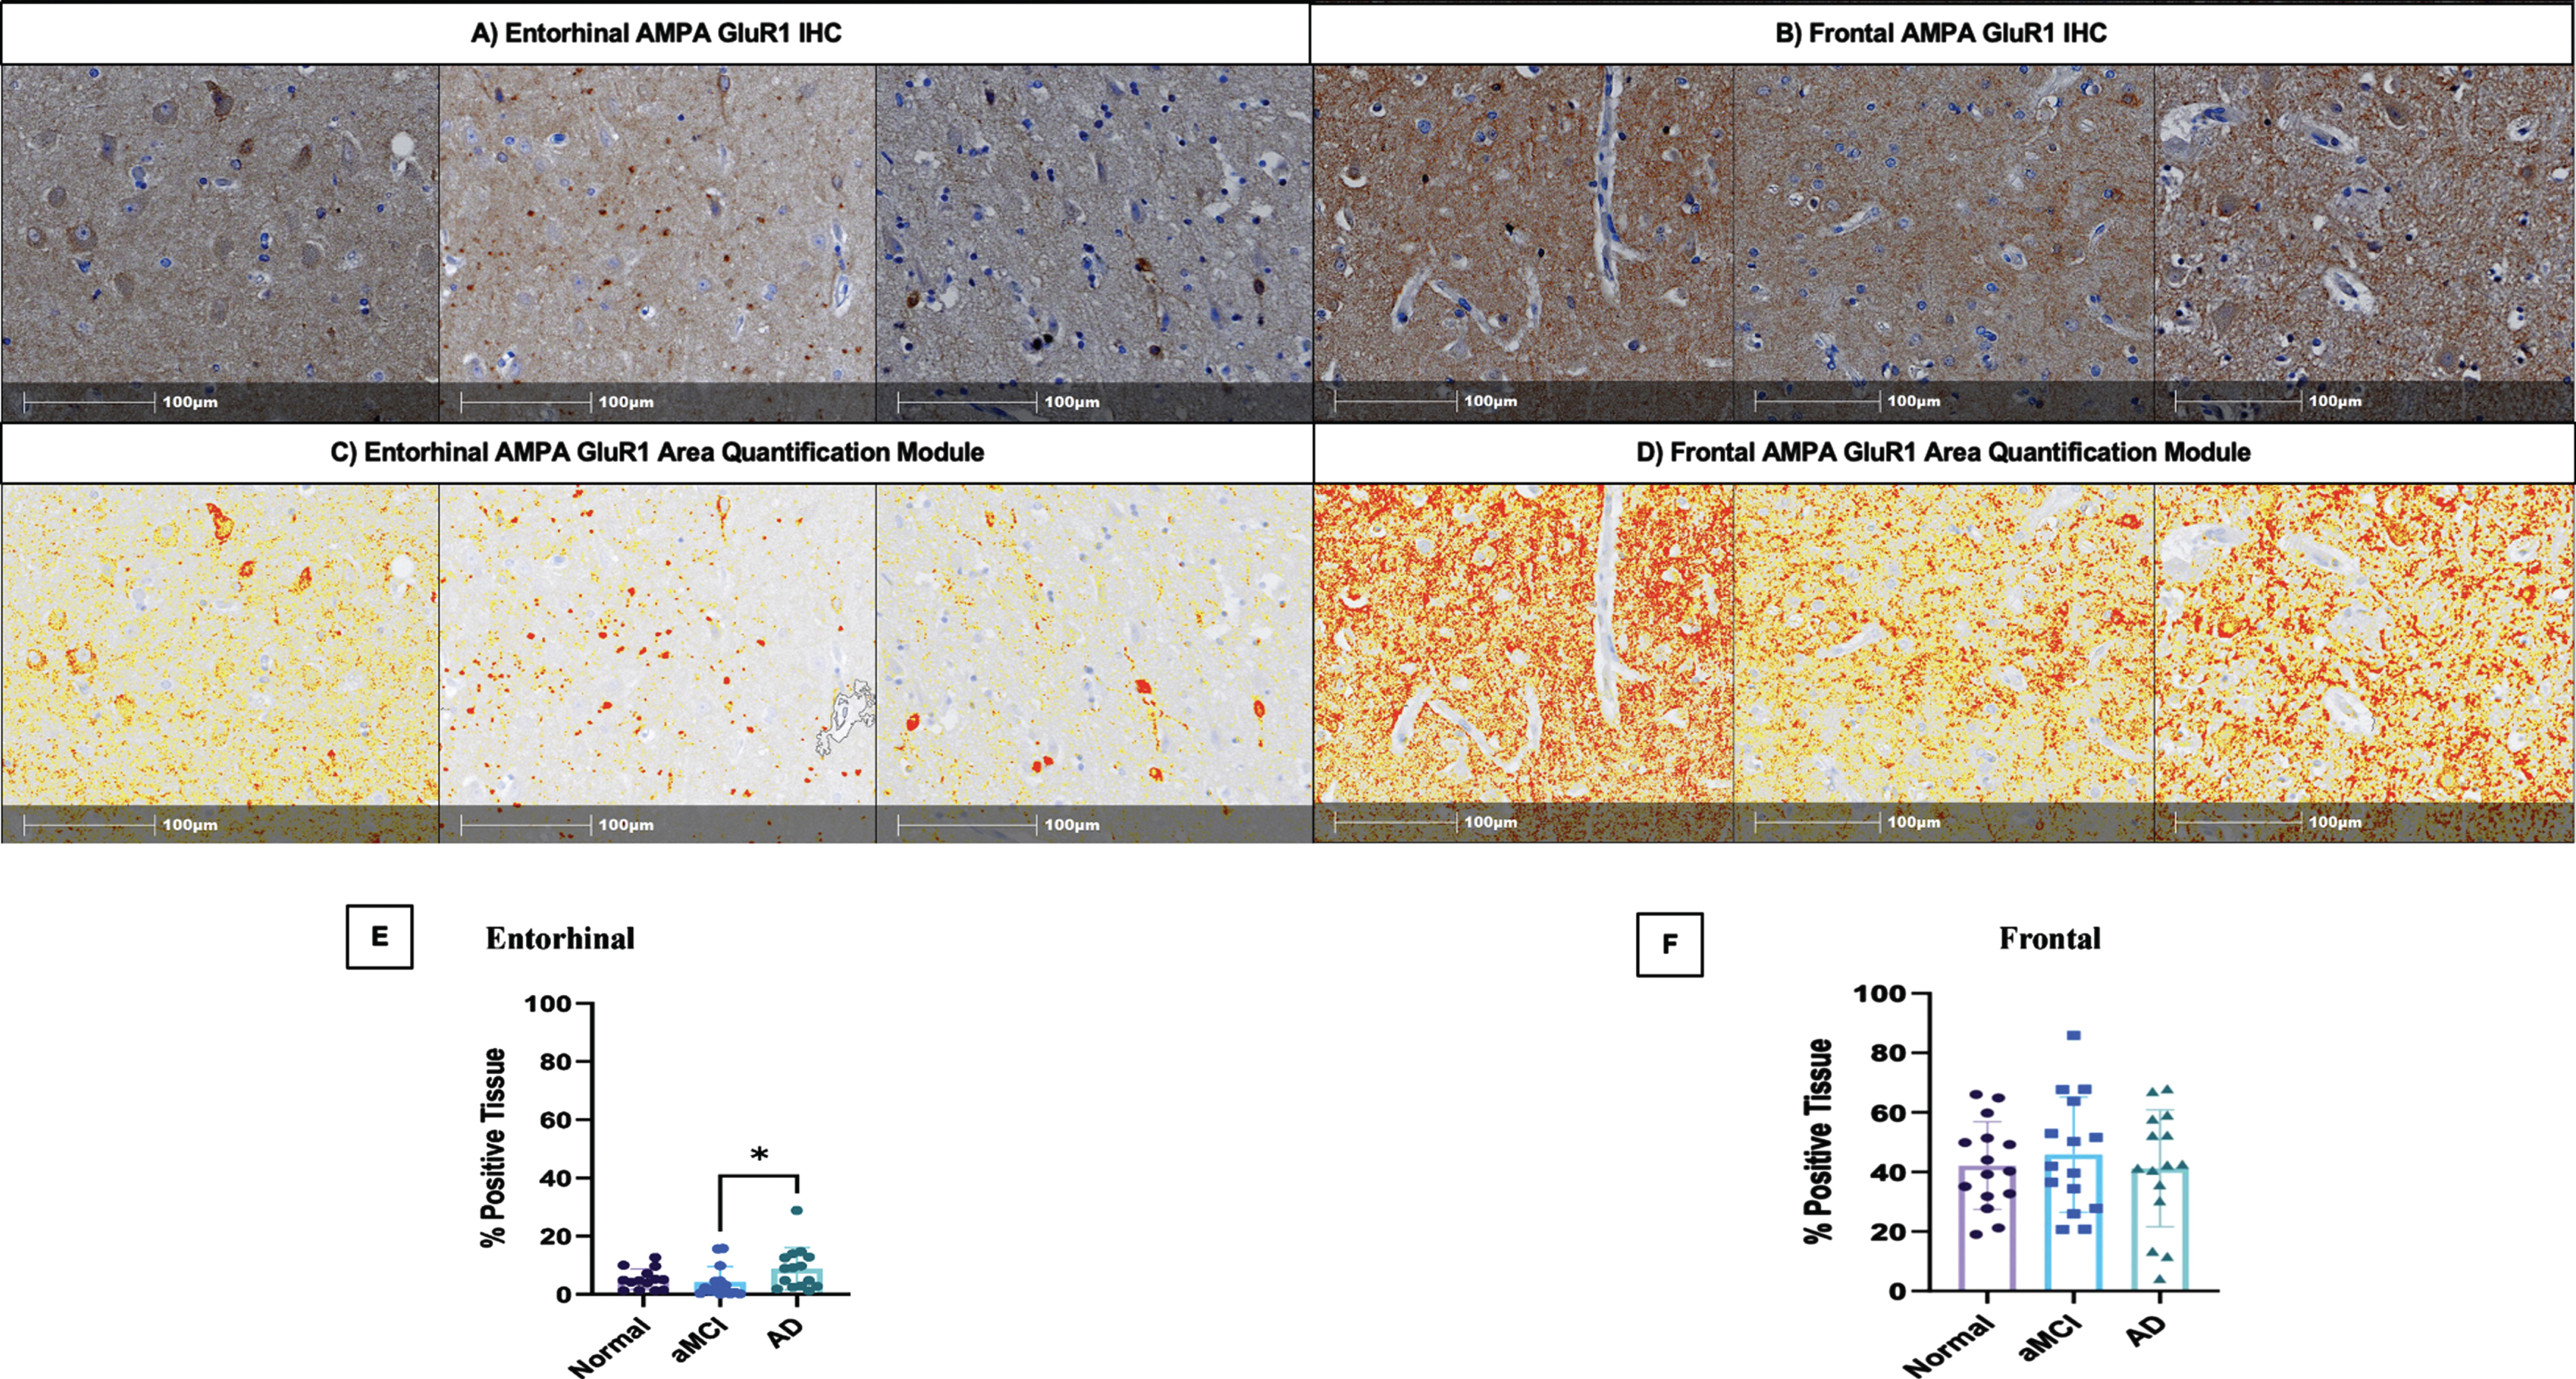
Area Quantification analysis of AMPA GluR1 receptor expression in the entorhinal cortex, and middle frontal cortex. A) AMPA GluR1 immunohistochemical staining in the entorhinal cortex of normal control, aMCI, and AD dementia cases, respectively. B) AMPA GluR1 immunohistochemical staining in the frontal cortex of normal control, aMCI, and AD dementia cases, respectively. C) Indica Labs Halo Area Quantification analysis of AMPA GluR1 immunohistochemical staining in the entorhinal cortex of normal control, aMCI, and AD dementia cases, respectively. D) Indica Labs Halo Area Quantification analysis of AMPA GluR1 immunohistochemical staining in the frontal cortex of normal control, aMCI, and AD dementia cases, respectively. E) % Positive area of AMPA GluR1 staining in entorhinal cortex stratified by clinical group designations (normal, aMCI, AD). p = 0.03. F) % Positive area of AMPA GluR1 staining in the frontal cortex stratified by clinical group designations (normal, aMCI, AD). aMCI, amnestic mild cognitive impairment; AD, Alzheimer’s disease dementia.
NanoString GeoMx™ digital spatial profiling
FFPE hippocampal sections from two age and sex matched Nun Study cases were used to assess different pTau species using digital spatial profiling. We compared Braak neurofibrillary tangle stage 0 versus Braak neurofibrillary tangle stage 2 to specifically isolate and investigate the impact of pathologic tau in the early stages of AD. The sections were deparaffinized and incubated with a cocktail containing phosphorylated and total tau antibodies of interest and each antibody was conjugated to a unique UV-photocleavable oligonucleotide tag. Cells within the selected regions of interest (ROIs) were marked by specific fluorescently labeled antibodies (morphology markers) [34], according to the manufacturer’s instructions using a kit and protocols developed exclusively for digital spatial profiling assays (https://www.nanostring.com/products/geomx-digital-spatial-profiler/geomx-protein-assays/). Neurons, our cell type of interest, were identified by fluorescently labeled antibodies against NeuN. We collected data from each ROI in triplicate to ensure that data was collected on a high enough number of “masked” NeuN immunoreactive cells to obtain statistical significance. We assessed different pTau species of interest (S404, S214, S396, T231, S199), MAP2, and total tau in entorhinal cortex, CA1, and dentate gyrus on FFPE sections. Nuclei were identified by staining with Syto13 (ThermoFisher Scientific), a nucleic acid-binding blue, fluorescent dye. All ROIs were analyzed using NanoString’s GeoMx™ Digital Spatial Profiler (DSP) system (NanoString Technologies, Seattle, WA, USA) [35]. The selected ROIs were illuminated using UV light on the GeoMx™ DSP, photocleaving the oligonucleotides from the antibodies. The oligonucleotides were collected on a 96-well microwell plate. Individual microwells contain the collected photocleaved oligonucleotides from each spatially resolved ROI. These oligonucleotides were then hybridized to four-color, six-spot optical barcodes. Digital quantification was performed by assessing the distinct spatially mapped counts for each antibody on the nCounter® platform. We performed normalization on the digital spatial protein data by using the signal to noise ratios, specifically. When performing this “signal to noise ratio” normalization, two isotype antibodies (IgG2a and rabbit IgG) are included within the protein panel of interest to control for the region of interest background. This signal to noise normalization approach has been previously described and specifically suggested by others as being the most appropriate way to normalize NanoString digital spatial protein data, as it will discard any non-biologically based variance [36].
Quantitative immunofluorescence neuropathologic evaluations
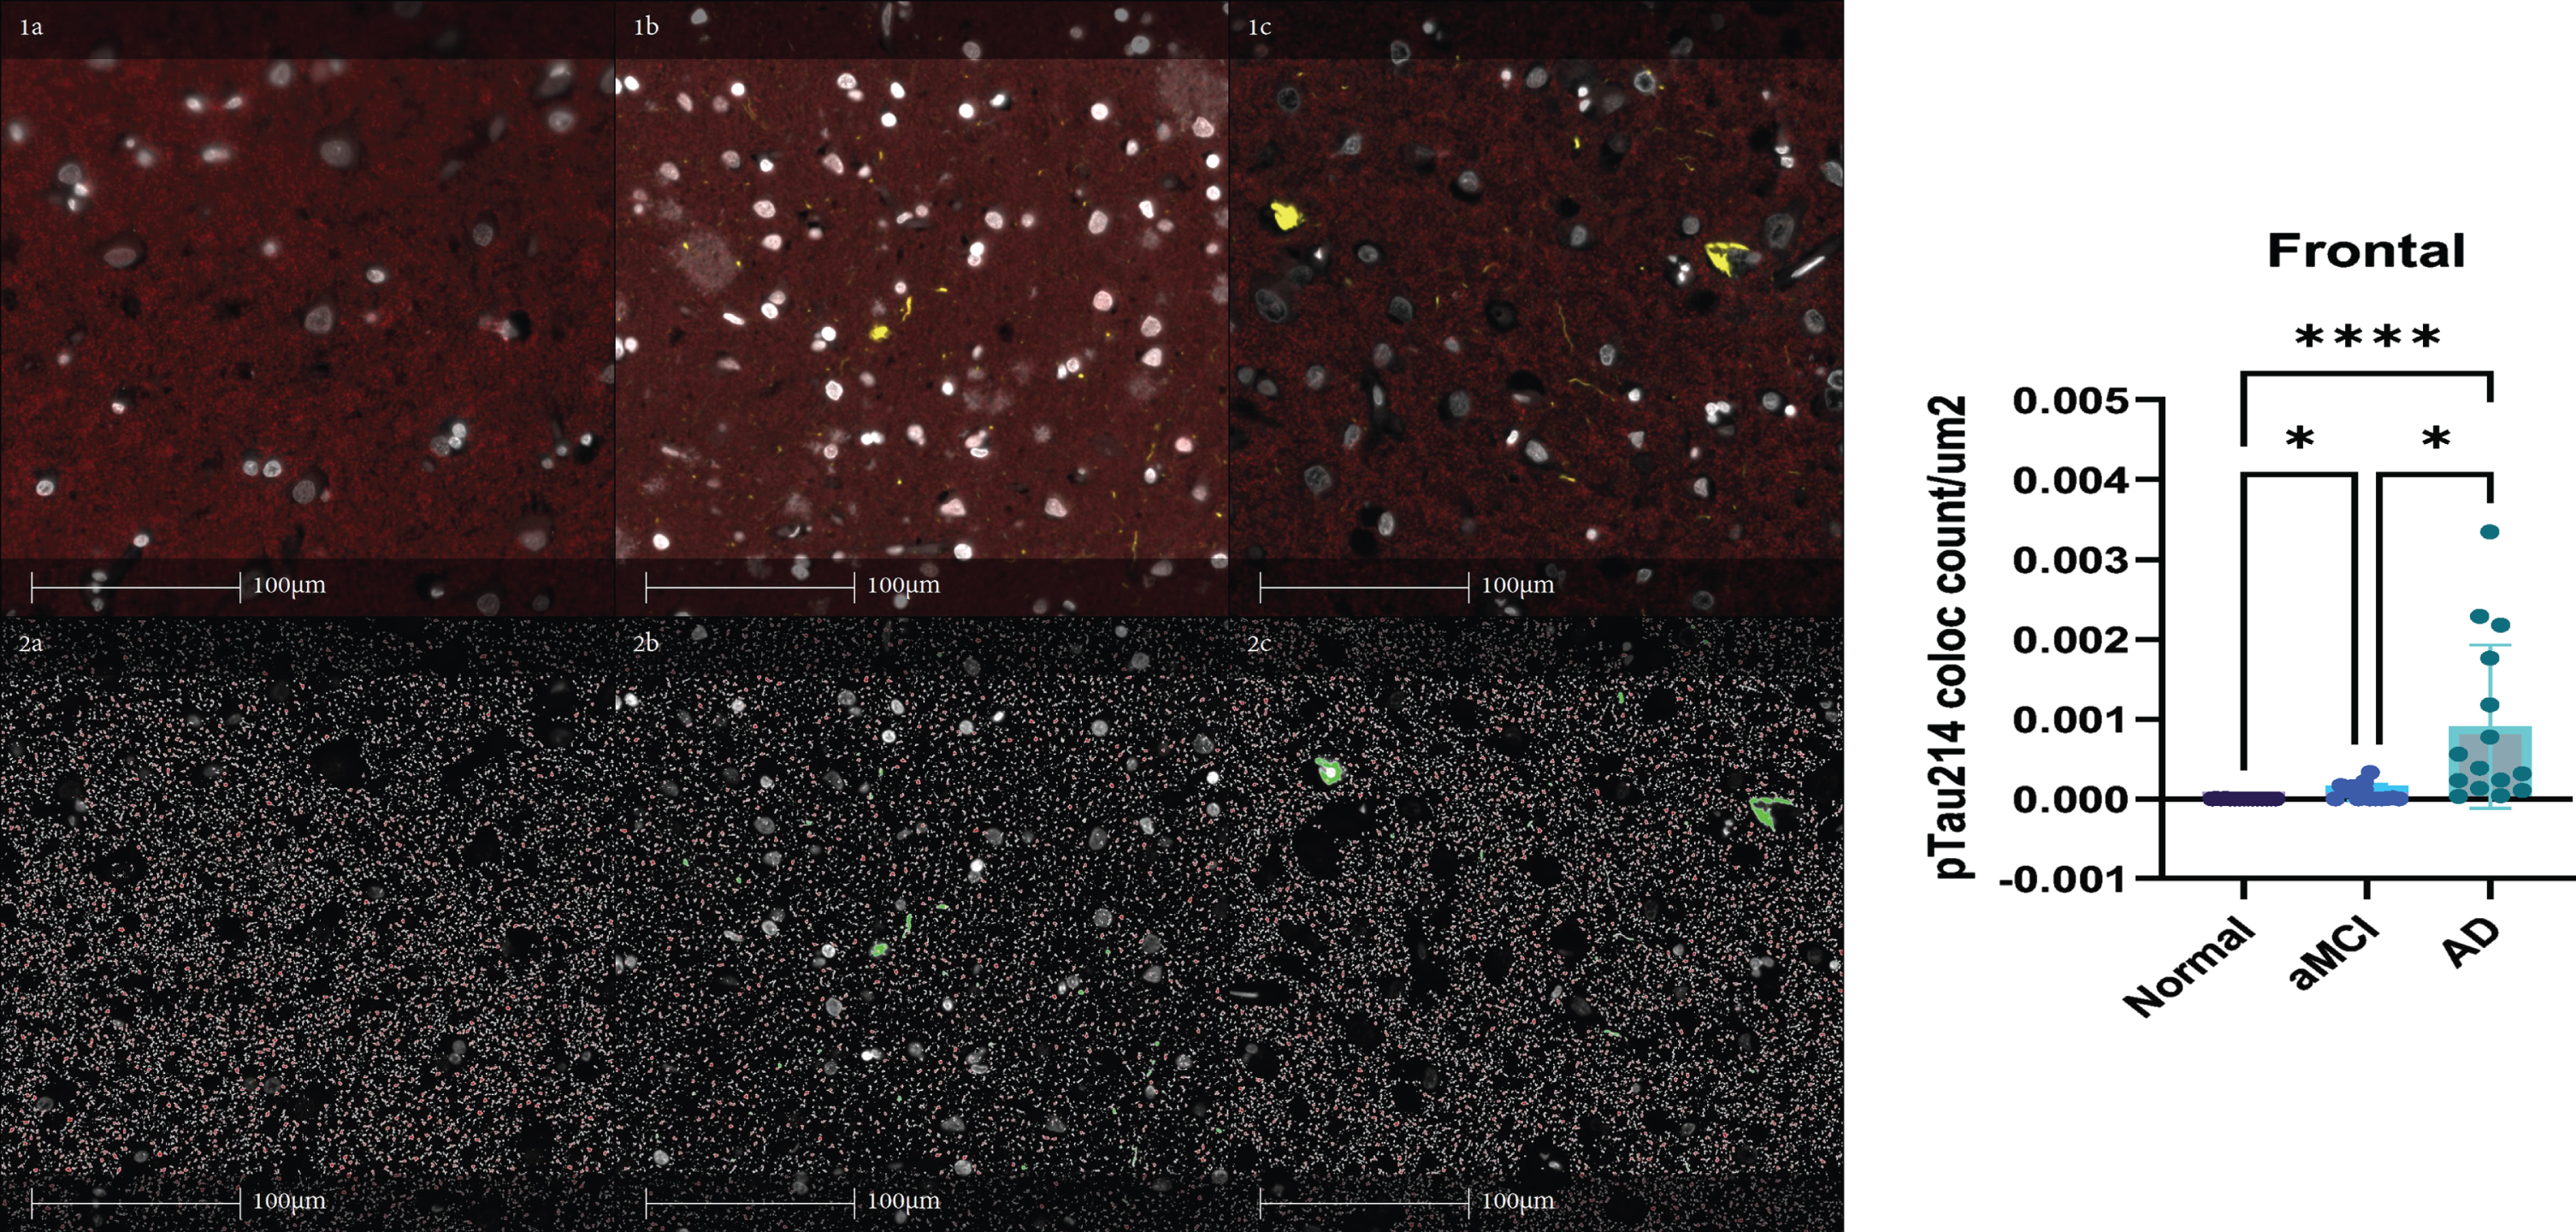
Multiplexed immunofluorescent staining for pTau214 and PSD-95 were performed and quantified on all 45 Mayo clinical brain autopsy cases in the frontal cortex. For immunofluorescence staining, tissue sections containing frontal cortex were incubated with antibodies against phosphorylated S214 Tau (pTau214, rabbit monoclonal, 1:1000, Abcam EPR1884, Boston, MA) and PSD-95 (Antibodies Inc.) overnight at 4°C. Goat anti Rabbit IgG H&L (Alexa Fluor®568) and Goat anti Mouse IgG H&L (Alexa Fluor®594) were added for 1 h followed by 1-min incubation with TrueBlack (Biotium #23007). Slides were then cover slipped with mounting media containing DAPI (ProLong™ Diamond Antifade Mountant with DAPI, P36971 Invitrogen). Tissues sections were then scanned to generate whole slide images using the Olympus VS 200 Slide Scanner microscope system at 20x magnification. Object colocalization module, HALO software version 3.2 (Indica Labs) was then used to detect and quantify object colocalization for pTau214 and PSD-95 (Fig. 3). Figure 3 demonstrates the red staining pattern for PSD-95 in panel 1a. Figure 3 demonstrates pTau214 staining in yellow in panel 1b. Figure 3 demonstrates both PSD-95 and pTau214 together in panel 1c. Figure 3 demonstrates HALO Digital Pathology software’s detection of PSD-95 staining in panel 2a. Figure 3 demonstrates HALO Digital pathology software’s detection of pTau214 staining in panel 2b. Figure 3 demonstrates the object colocalization application from HALO that was applied to detect and quantify object colocalization for pTau214 and PSD-95 in panel 2c. The results shown on the right-hand side of Fig. 3 show PSD-95 and pTau214 colocalization object counts per μm2 of tissue increase during AD progression across clinically stratified groups (normal, aMCI, AD dementia) in frontal cortex.
Fig. 3
PSD-95 and pTau214 multiplexed immunofluorescent staining quantification in the frontal cortex. Panel 1a demonstrates the red staining pattern for PSD-95. Panel 1b demonstrates pTau214 staining in yellow. Panel 1c demonstrates both PSD-95 and pTau214 together. Panel 2a demonstrates HALO Digital Pathology software’s detection of PSD-95 staining. Panel 2b demonstrates HALO Digital pathology software’s detection of pTau214 staining. Panel 2c demonstrates the object colocalization application from HALO that was applied to detect and quantify object colocalization for pTau214 and PSD-95. The results shown on the right show PSD-95 and pTau214 colocalization object count per μm2 of tissue increase during AD progression across clinically stratified groups (normal, aMCI, AD) in frontal cortex. Kruskal-Wallis was performed with Dunn’s multiple comparisons test applied to correct for multiple comparisons. (*p < 0.05, ****p < 0.0001) aMCI, amnestic mild cognitive impairment; AD, Alzheimer’s disease dementia.
Statistical analyses
The demographic and neuropathological characteristics were compared using the Cochran-Armitage trend test and McNemar’s chi-square test with exact p-values for binary variables. When continuous variables were compared, Wilcoxon matched-pairs signed-ranks test and Kruskal-Wallis were used. When overall differences were detected between groups, Post hoc analyses comparing pairs of groups were also performed to confirm differences between clinically stratified groups. The P4 fraction tau levels were used to generate a “fractional percentage” of pTau231 and total tau for the P4 fraction. The fractional percentage of pTau231 is defined as the amount of pTau231 measured in the P4 synaptosomal fraction divided by the sum of pTau231 across all fractions (P4/(S2 + S4 + P4)). Total tau and pTau231 were compared across clinical diagnostic group designations (control, aMCI, AD dementia), NIA-AA ADNC designations (Not, Low, Intermediate, High), and Braak neurofibrillary tangle stages (1–6). Comparisons were also made for synaptosomal ratios (e.g., P4/S4 + P4). P4 pTau231 in the entorhinal cortex and middle frontal cortex regions after adjusting to the PSD-95 in the P4 fraction to account for any potential AD associated synaptic changes. Further comparisons were made with the PSD-95 adjusted values across clinically stratified groups (control, aMCI, AD dementia), NIA-AA ADNC stratified groups (Not, Low, Intermediate, High), and Braak neurofibrillary tangle stage (1–6) for all cases (n = 50). Comparisons were also made after the exclusion of the five cases with a single co-existing infarct (n = 45) (Fig. 4). Spearman’s Rank-Order Correlation was used with correlation coefficients ranging from –1 to 1, indicating negative and positive relationships, respectively. Welch’s T-test and Wilcox rank-sum tests were used to assess changes between two diagnostic groups. p < 0.05 was considered statistically significant unless the Benjamini-Hochberg procedure was applied. For the generation of the piecewise linear regression model shown in Fig. 4C, P4 tau was modeled using linear regression with a diagnosis of aMCI (versus normal control) and diagnosis of AD dementia (versus normal control) as covariates. The result is a model where the predicted value is the mean of the dependent variable for each group. Robust standard errors [37, 38] were used because residuals for these models were heteroskedastic. Pairwise comparisons of all diagnostic categories were performed. Simple logarithmic regression was also performed to model the changes in pTau231 and total tau with progressing disease. As a sensitivity analysis, models were also estimated excluding the five cases with a single co-existing infarct. For the NanoString DSP analyses, the raw data included expression levels of different proteins of interest and 3 IgG controls in multiple ROIs from each of the two Nun Study brain autopsy cases: 1) Braak neurofibrillary tangle stage 0 only and cognitively intact versus Braak neurofibrillary tangle stage 2 only and cognitive intact. To identify the differentially expressed proteins in each comparison for Nanostring proteins of interest, within the Braak neurofibrillary tangle only stage 0 case by itself for confirmation of our pTau214 results, Kruskal-Wallis was used to compare NeuN “masked” cells in CA1, dentate gyrus, and entorhinal cortex regions. For comparing protein differences in NeuN masked cells in hippocampal sections between study groups, Mann Whitney U was used. Additionally, Benjamini–Hochberg was used to adjust for multiple analyses to confirm results. The heatmap was generated using ComplexHeatmap (Version 2.8.0). For multiplex immunofluorescence comparisons of PSD-95 and pTau214 in the frontal cortex sections, Kruskal-Wallis was performed with Dunn’s multiple comparisons test applied to correct for multiple comparisons.
Fig. 4
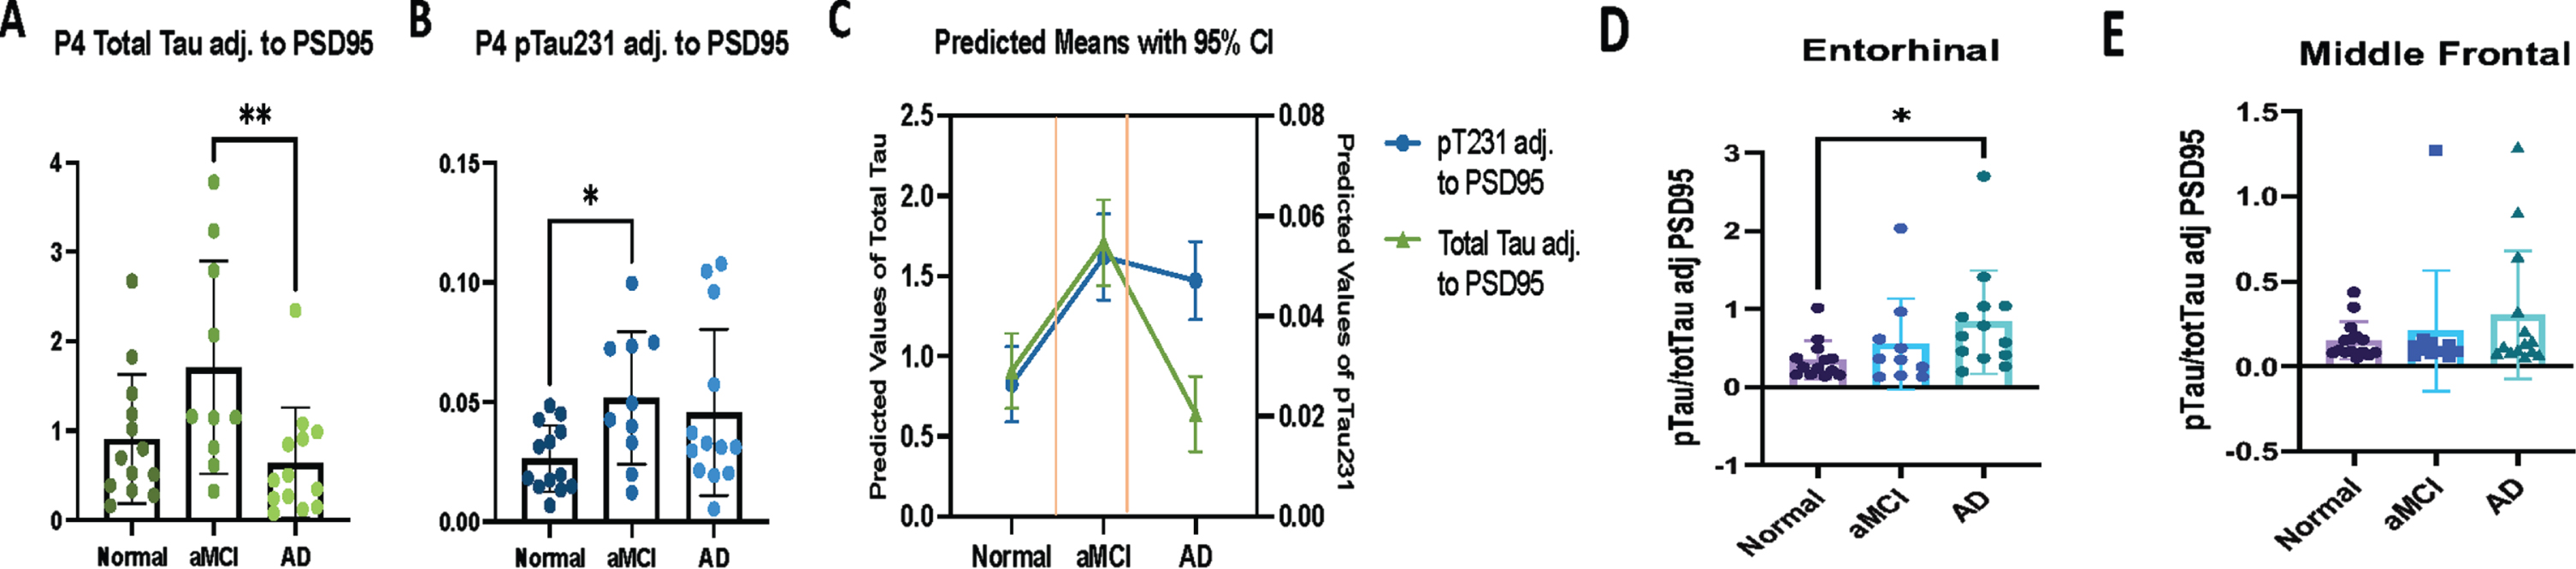
Pathological tau accumulation in the postsynaptic (P4) fraction quantified using Simoa Quanterix in clinical AD progression adjusted to P4 PSD-95 quantified using western blot. A-E) Postsynaptic pTau231 and total tau accumulation in clinical AD. C) Based on our entorhinal cortex PSD-95 adjusted Simoa Quanterix total Tau and pTau231 postsynaptic (P4) fraction results (A, B). Panel C shows a piecewise linear regression model comparing pTau231 and total tau in the postsynaptic (P4) fractions across clinical diagnostic groups. P4 tau was modeled using linear regression with a diagnosis of aMCI (versus normal control) and diagnosis of AD dementia (versus normal control) as covariates. The result is a model where the predicted value is the mean of the dependent variable for each group. Robust standard errors were used because residuals for these models were heteroskedastic. Pairwise comparisons of all diagnostic categories were performed. Simple logarithmic regression was also performed to model the changes in pTau231 and total tau with progressing disease. As a sensitivity analysis, models were estimated with all cases and models were also estimated excluding the five cases with a single co-existing microinfarct. Postsynaptic pTau231 substantially increases very early in AD pathogenesis and accumulation is thought to result in the development of aMCI. Postsynaptic total tau also substantially increases with the transition from normal control to aMCI, and subsequently decreases with the transition from aMCI to AD dementia. Panel D shows similar findings in the entorhinal cortex when P4 pTau231 is normalized to P4 total tau and adjusted to P4 PSD-95 (p = 0.02 normal versus AD). Panel E shows P4 normalized to total tau and adjusted to P4 PSD-95 in middle frontal cortex. Kruskal-Wallis was performed with Dunn’s multiple comparisons test applied to correct for multiple comparisons. aMCI, amnestic mild cognitive impairment; AD, Alzheimer’s disease dementia. *p < 0.05, **p < 0.01. Box plots indicated median and interquartile range (IQR) of the percent in each fraction.
RESULTS
Confirmation of fractionation protocol and regional tau comparisons
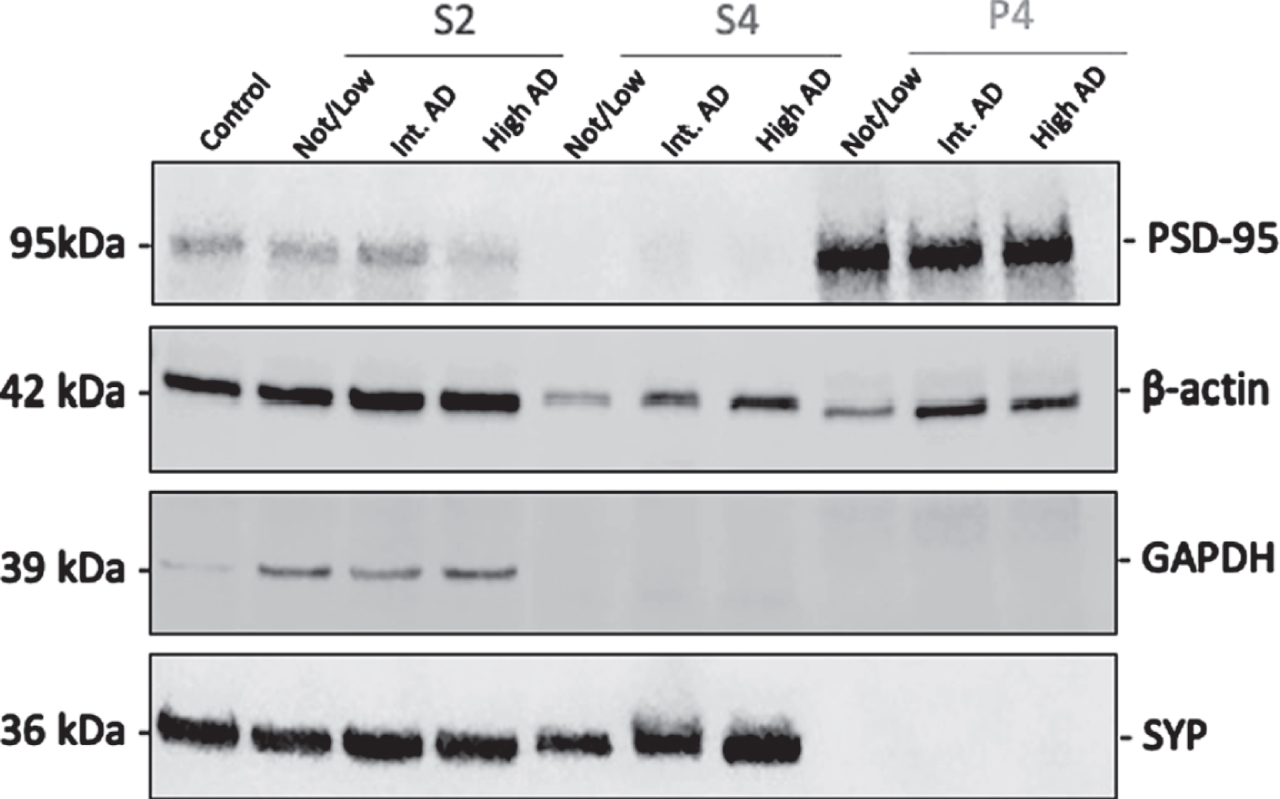
After completing the synaptosomal fractionation protocol, each fraction was tested by western blot to confirm appropriate enrichment of each fraction, as demonstrated in Fig. 5. Notably, PSD-95 is enriched in P4 fractions but is almost absent in S4 fractions. Normalization was performed using Revert Total Protein Stain (LI-COR). GAPDH was used for S2 enrichment assessment, synaptophysin (SYP) for S4 enrichment assessment, and postsynaptic density protein 95 (PSD-95) for postsynaptic enrichment assessment. After confirming our synaptosomal fractionation protocol efficacy, we compared total Tau and pTau231 levels in the entorhinal and middle frontal cortices.
Fig. 5
Synaptosomal fraction richness for validation of fractionation protocol. The representative immunoblots of S2, S4, and P4 fractions from human brains with Not/Low Alzheimer’s Disease Neuropathologic Change (ADNC), Intermediate ADNC, and High ADNC show PSD-95 protein richness in postsynaptic density enriched P4 fractions. S2 contains substantial beta actin, GAPDH, and a lesser amount of PSD-95. S4 is enriched for synaptophysin and contains beta actin. Protein normalization was performed using Revert Total Protein Stain (LI-COR).
Comparison of demographic and neuropathologic characteristics across study groups
Frozen postmortem brain samples from individuals with AD dementia, aMCI, and cognitively normal controls were assessed. Samples were further stratified and compared by the severity of NIA-AA AD neuropathologic change (Not, Low, Intermediate, High). First, demographic and neuropathologic features of individuals were stratified clinically as AD dementia, aMCI, and cognitively normal, and comparisons were made across groups. There were no significant differences in age at the time of death, sex, APOE genotype, postmortem interval time, or time between the last clinical visit and death between the clinically stratified groups (Table 1). There were no significant differences in these variables between groups when stratified neuropathologically by NIA-AA AD neuropathologic change designations of Not, Low, Intermediate, and High designations, nor by binary neuropathologic stratification of groups combining NIA-AA AD neuropathologic change designations of Not and Low, and Intermediate and High.
Tau mislocalization and accumulation by clinical group designation, neuropathologic change group designation, and Braak neurofibrillary tangle distribution stage.
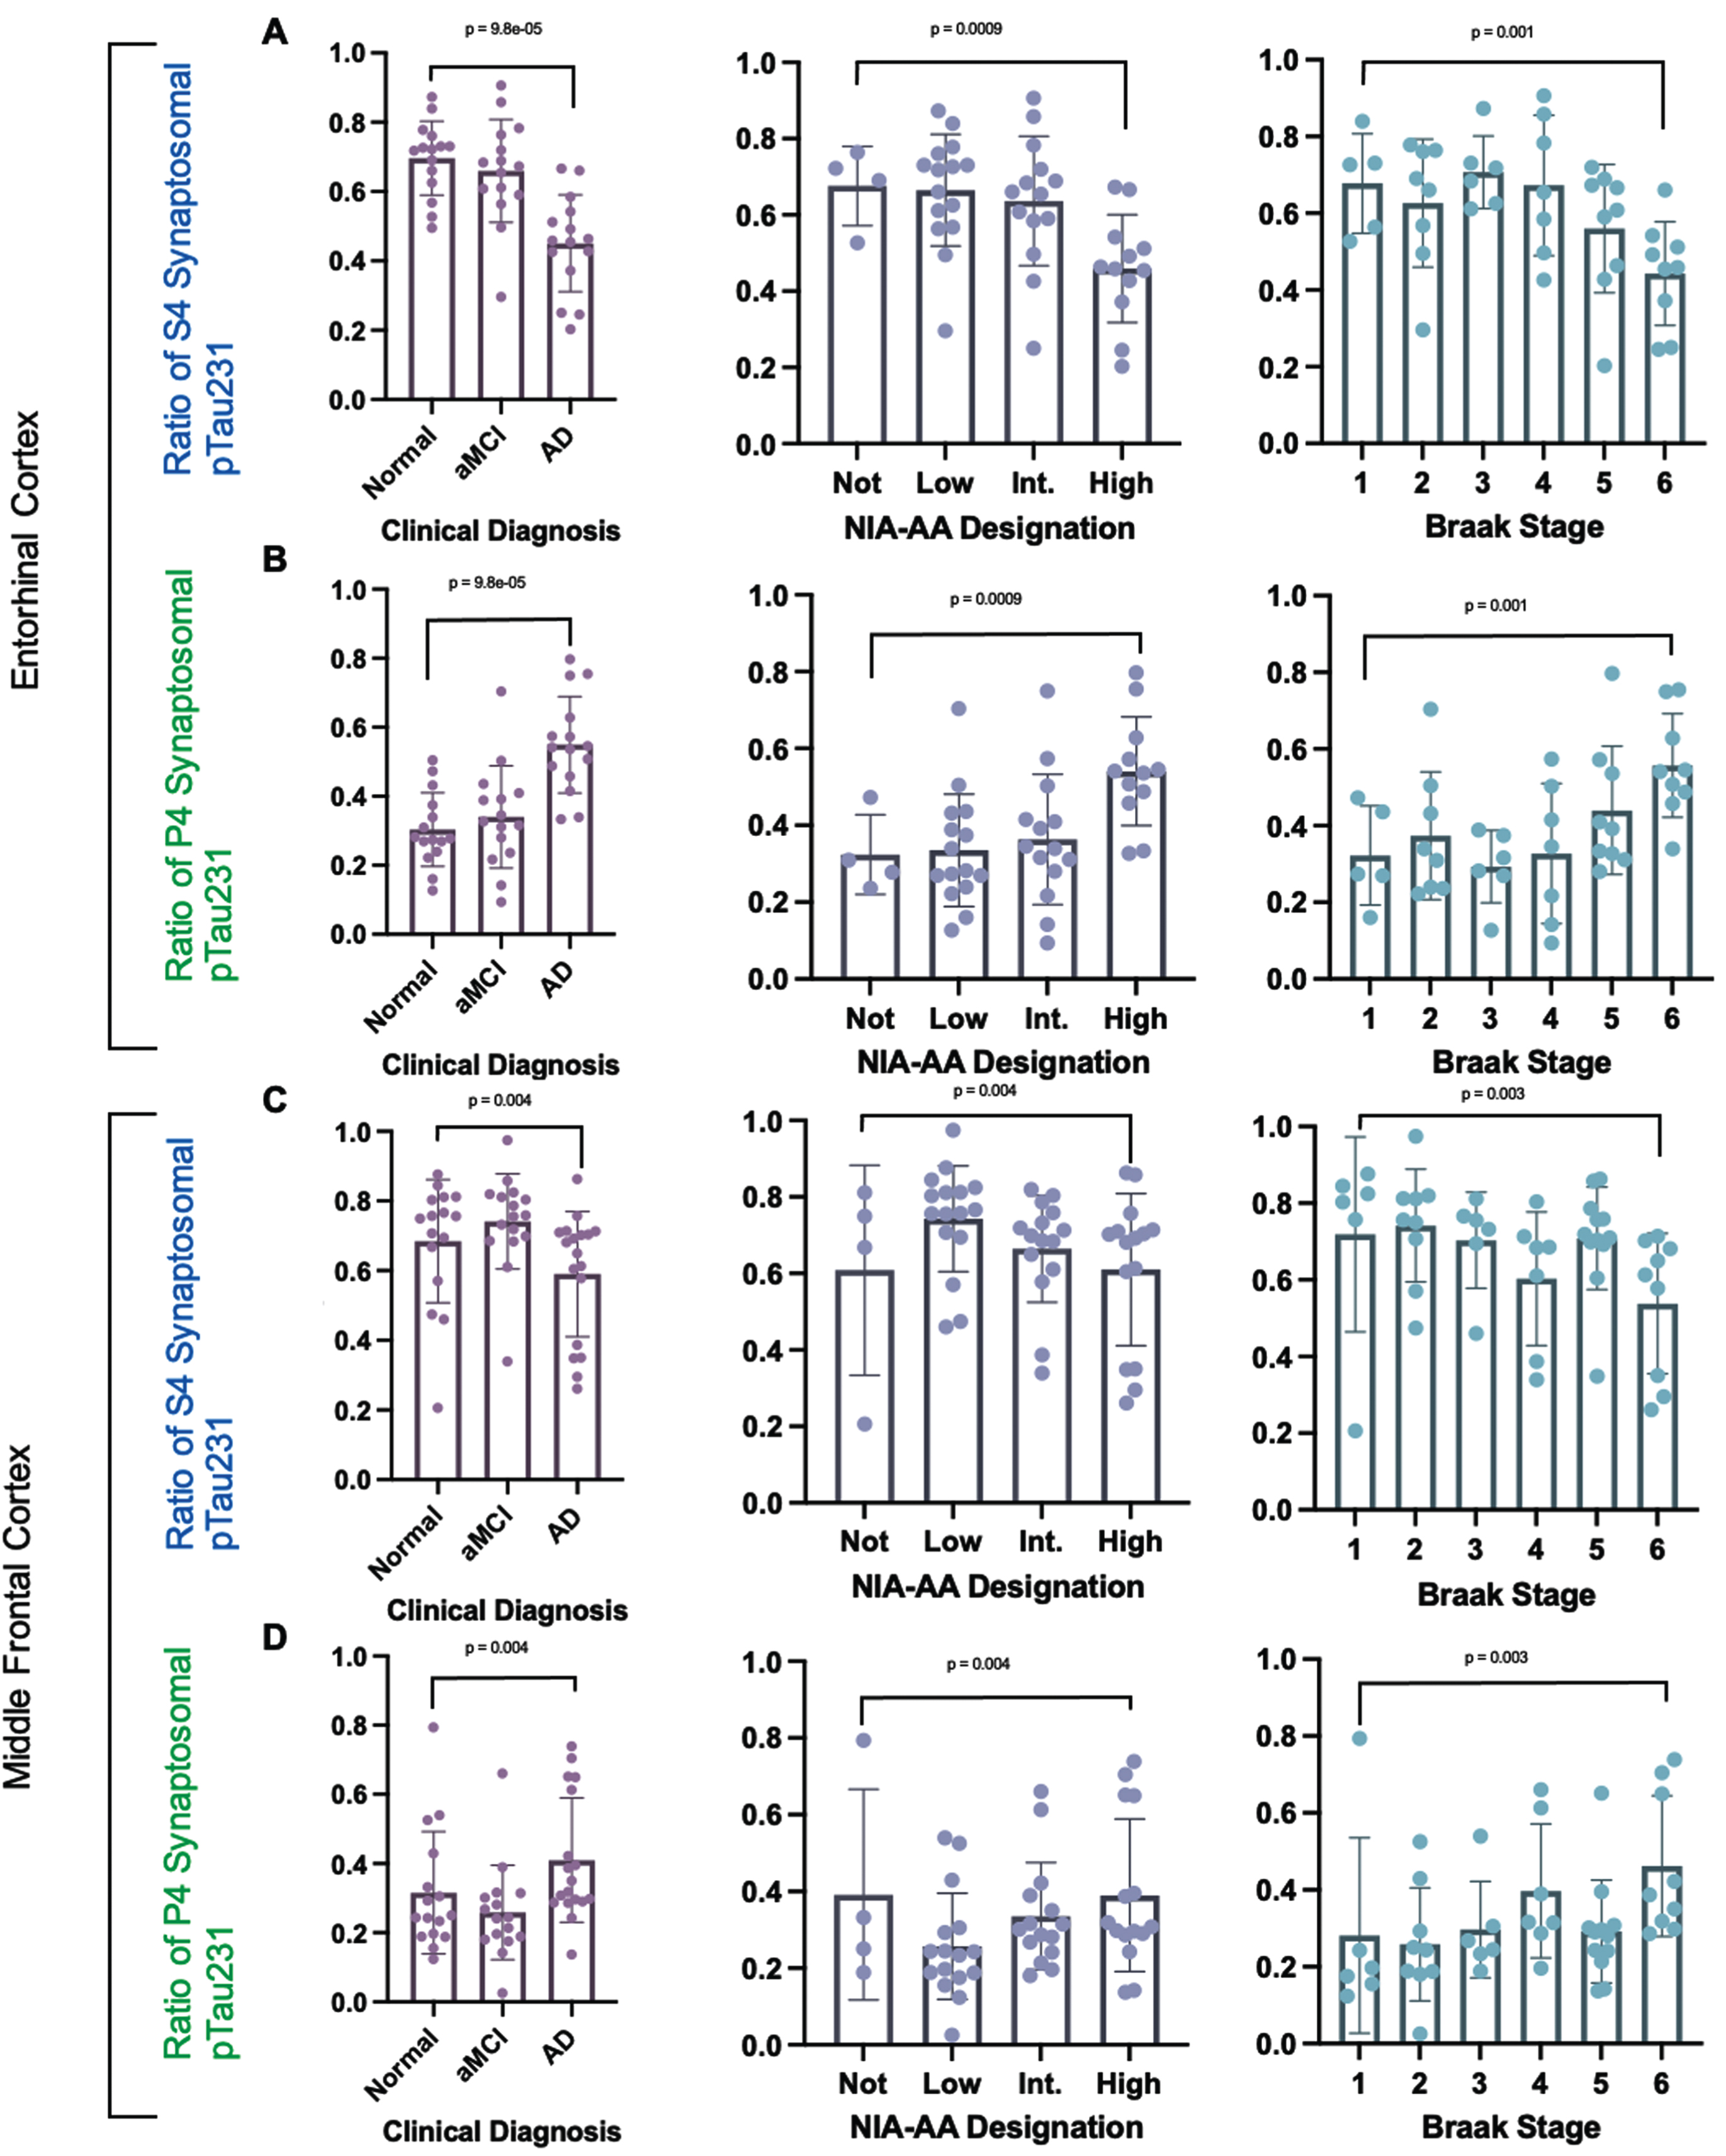
The S4 fraction is the synaptophysin enriched presynaptic fraction and the P4 fraction is the PSD-95 enriched postsynaptic fraction. The ratios of each synaptosomal fraction pTau231 to the total synaptosomal pTau231 level via Simoa Quanterix ELISA based quantification were compared across clinically and neuropathologically stratified study groups. The ratio of synaptosomal pTau231 in synaptophysin enriched presynaptic (S4) fraction to total synaptosomal pTau231 (S4 fraction + P4 fraction) was decreased with increasing AD by clinical study group stratification, increasing NIA-AA neuropathologic change group stratification, and increasing neuropathologic Braak tangle stage stratification as shown in Fig. 6. The ratio of synaptosomal pTau231 in the postsynaptic PSD-95 enriched P4 fraction to total synaptosomal pTau231 (S4 fraction + P4 fraction) was also increased with increasing AD by clinical group stratification, increasing NIA-AA AD neuropathologic change group stratification, and increasing neuropathologic Braak tangle stage stratification as shown in Fig. 6. The ratios of each synaptosomal fraction total Tau to the total synaptosomal total Tau level via Simoa Quanterix ELISA based quantification were compared across clinically and neuropathologically stratified study groups (NIA-AA AD neuropathologic change group stratification and Braak tangle stage) and no significant differences were identified between groups as shown in Supplementary Figure 1. In summary, the ratio of pTau231 in the synaptophysin enriched presynaptic (S4) fraction to the total synaptosomal pTau231 (S4+P4) decreases with clinical and neuropathologic Alzheimer’s disease progression. The ratio of pTau231 in the PSD-95 enriched postsynaptic (P4) fraction to total synaptosomal fraction pTau231 increases with clinical and neuropathologic Alzheimer’s disease progression. The fractional percentages of pTau231 and total Tau in the PSD-95 enriched postsynaptic (P4) fraction were additionally compared across clinically stratified groups (control, amnestic mild cognitive impairment, and AD dementia) and NIA-AA AD neuropathologic change group designations (Not, Low, Intermediate, High), as shown in Supplemental Figure 2. The fractional percentage of pTau231 was defined as the amount of pTau231 measured in a specific synaptosomal fraction divided by the sum of pTau231 in all fractions. For example, the fractional percentage of postsynaptic P4 pTau231 is the amount of pTau231 measured in the PSD-95 enriched postsynaptic (P4) fraction divided by the total sum of pTau231 in the P4, S4, and S2 fractions. No significant differences in the fractional percentages of total Tau were identified in postsynaptic (P4) fractions from the entorhinal and middle frontal cortices across clinically stratified group designations, NIA-AA AD neuropathologic change group designations, or Braak tangle stages. No significant differences in fractional percentages of pTau231 were identified in the PSD-95 enriched postsynaptic (P4) fractions from the entorhinal cortex across clinical group designations, NIA-AA AD neuropathologic change group designations, or Braak tangle stages. By contrast, the middle frontal cortex PSD-95 enriched postsynaptic (P4) fraction demonstrated an increase in the fractional percentage of pTau231 with increasing clinical disease (P = 0.01) and increasing NIA-AA AD neuropathologic change designation (Supplementary Figure 2). In addition, the middle frontal cortex postsynaptic (P4) fraction showed an increase in the percentage of pTau231 that correlated with increasing Braak neurofibrillary tangle stage (P = 0.02), as shown in (Supplementary Figure 2).
Fig. 6
Ratios of each synaptosomal fraction pTau231 tau level to total synaptosomal pTau231 level quantified using Simoa Quanterix across clinical and neuropathologic AD designations. Comparison of the ratio of pTau231 in each synaptosomal fraction across clinical, NIA-AA AD Neuropathologic Change, and Braak neurofibrillary tangle stage designations. aMCI, amnestic mild cognitive impairment; AD, Alzheimer’s disease dementia. A) Ratio of synaptosomal pTau231 in entorhinal cortex synaptophysin enriched presynaptic (S4) fraction to total synaptosomal (S4 + P4) pTau231. B) Ratio of synaptosomal pTau231 in entorhinal cortex postsynaptic PSD-95 enriched (P4) fraction to total synaptosomal (S4 + P4) pTau231. C) Ratio of synaptosomal pTau231 in middle frontal synaptophysin enriched presynaptic (S4) fraction to total synaptosomal (S4 + P4) pTau231. D) Ratio of synaptosomal pTau231 in middle frontal postsynaptic PSD-95 enriched (P4) fraction to total synaptosomal (S4 + P4) pTau231. Median pTau231 ratios were calculated with 95% confidence intervals and Spearman’s Rank correlation was performed by each designation.
Accounting for potential AD-associated synaptic alterations in entorhinal cortex
As synaptic changes are expected in the setting of increasing AD progression, PSD-95 (postsynaptic protein) was quantified in the P4 fractions via western blot as outlined in the Methods section in each brain region (entorhinal and middle frontal cortices). As human autopsy brain samples show tau at a set time point (i.e., time of death), the postsynaptic (P4) fraction pTau231 and total tau levels were further adjusted to the corresponding postsynaptic (P4) fraction PSD-95 level to account for potential disease-associated synaptic alterations. The entorhinal cortex is involved very early by phosphorylated tau tangles in AD pathogenesis and may become involved by tangles in preclinical disease states [39]. Therefore, the entorhinal cortex samples represent late-stage AD pathogenesis in our study as this region has a higher neurofibrillary tau tangle burden across all samples. This is likely accompanied by increased disease associated synaptic changes. When comparing the P4 PSD-95 adjusted values, total tau in the postsynaptic (P4) fraction was increased in the aMCI group when compared to the AD dementia group (p = 0.007), when excluding cases with a single co-existing infarct (Fig. 4A). Interestingly, in the same postsynaptic (P4) fraction, pTau231 adjusted to PSD-95 was increased in the aMCI group when compared to the cognitively normal group (p = 0.03) (Fig. 4B, D). The hypothetical model of AD progression is shown in Fig. 4C. As anticipated, no significant differences were revealed after adjusting P4 pTau231 to P4 PSD-95 in middle frontal cortex (Fig. 4E). Increasing pTau231 in the entorhinal postsynaptic (P4) fraction was additionally seen with increasing clinical AD when pTau231 was normalized to total Tau and subsequently adjusted to P4 PSD-95 as shown in Supplementary Figure 3 with total PSD-95 levels additionally highlighted in Supplementary Figure 4.
AMPA receptor GluR1 quantification
To explore the changes in AMPARs in the development of cognitive impairment, the current study also compared quantitative AMRAR GluR1 subunit immunohistochemical staining results across clinical and neuropathologic group stratifications in the entorhinal cortex and frontal cortex. Figure 2A and 2B demonstrate AMPAR GluR1 staining in the entorhinal and frontal cortices across clinically stratified groups. Percent area quantification of AMPA GluR1 immunohistochemical (IHC) staining (Fig. 2C, D) revealed increased staining in the entorhinal cortex in the AD dementia group when compared to the aMCI group (p = 0.03) (Fig. 2E). Percent area quantification of AMPA receptors in the middle frontal cortex interestingly revealed no significant changes when comparing the clinically stratified groups (Fig. 2F). Taken together, our tau findings combined with our AMPA GluR1 staining results suggest that first pTau231 accumulation occurs at the post-synaptic density before the development of alterations in AMPARs occurs in AD pathogenesis.
Comparing earliest phosphorylated tau species in Braak 0 versus Braak 2 using NanoString digital spatial profiling
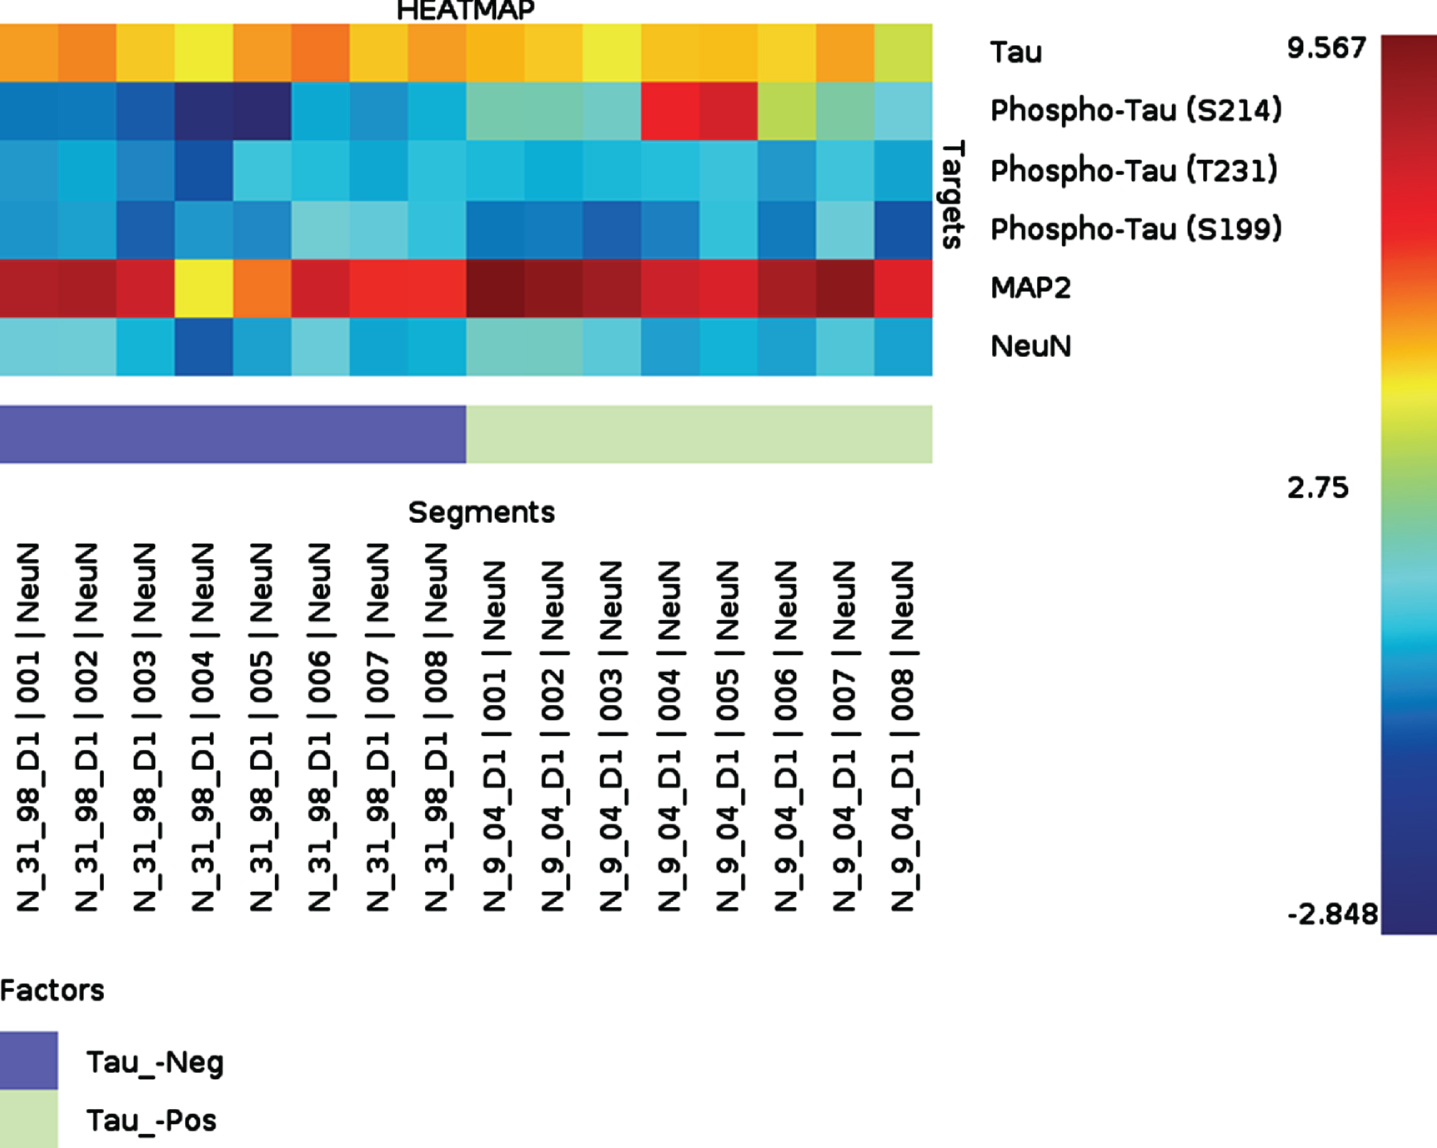
We designed our complementary NanoString study to assess the earliest pathologic tau changes in FFPE hippocampal sections from cognitively unimpaired individuals. We took this approach to screen for other neuronal tau species in the Proline rich region of tau that may accumulate within neurons even earlier than pTau231 in the development of memory impairment. We compared samples from cognitively unimpaired individuals without any Tau tangles (Braak Stage 0) versus cognitively unimpaired individuals with only limited tau tangles (Braak Stage 2). First, the neuronal cell population was selected by immunofluorescent staining using a NeuN antibody. When NeuN positive neurons in the entorhinal cortex, CA1, and dentate gryus were compared between the phospho-tau negative sample (Braak Stage 0, Thal Phase 0, cognitively intact) versus the phospho-tau positive sample (Braak Stage 2, Thal Phase 0, cognitively intact), there was increased pTau214 identified in the phospho-tau positive sample (p = 0.004) in NeuN positive neurons. Heat map results are shown for tau species in Fig. 7. Additionally, when comparing pTau species in NeuN positive neurons between entorhinal cortex, CA1, and dentate gyrus regions within the phospho-tau positive (Braak Stage 2, Thal Phase 0, cognitively intact) sample replicates alone, pTau214 was also found to differ by region (p = 0.04). Interestingly, pTau214 has a phosphorylation site that is in the same proline rich region of tau as pTau231. These results further support that the phosphorylation of tau in the Proline rich region specifically occurs very early in AD pathogenesis.
Fig. 7
Heatmap showing quantitative NanoString protein Digital Spatial Profiling results in hippocampus with Braak Stage 0 (blue) versus Braak Stage 2 (green) without co-existing brain lesions. Both samples are from individuals who were confirmed to be cognitively intact within three years of death. Different pTau species of interest (S214, T231, S199), MAP2, and total tau in entorhinal cortex, CA1, and dentate gyrus on formalin-fixed paraffin-embedded sections. We specifically analyzed NeuN immunoreactive cells in the hippocampal sections Although pTau231 did not significantly differ between Braak 0 and Braak 2, this is expected as both individuals were confirmed to be cognitively normal during life and our Simoa data suggests that postsynaptic pTau231 increases with the onset on clinical memory impairment.
DISCUSSION
Utilizing highly sensitive total tau and pTau231 ELISA assays in combination with quantitative traditional and multiplexed staining, and complementary experiments with NanoString Digital Spatial Profiling for further tau biomarker discovery, we attempted to answer the following critical question—when does the phosphorylation of tau in the Proline rich region result in abnormal tau accumulation at the postsynaptic density in AD pathogenesis? Taken together, the ratio of pTau231 in the synaptophysin enriched presynaptic (S4) fraction to the total synaptosomal pTau231 decreases with clinical and neuropathologic AD progression in the entorhinal cortex but increases with clinical and neuropathologic AD progression in the middle frontal cortex (Fig. 6). The ratio of pTau231 in the PSD-95 enriched postsynaptic (P4) fraction to the total synaptosomal fraction pTau231 also decreases with clinical and neuropathologic AD progression in the entorhinal cortex but increases with clinical and neuropathologic AD progression in the middle frontal cortex (Fig. 6). Our results suggest that tau phosphorylated in the Proline rich region accumulates at the postsynaptic density in parallel with the onset of clinical memory impairment in AD pathogenesis and raise the possibility that this may specifically occur before alterations in AMPARs occur. Our comprehensive clinicopathologic approach enabled us to examine the chronological sequence of events involving pTau231 in the postsynaptic compartment in human AD progression. As we used human autopsy brain samples, we measured changes in tau and synapses at a set postmortem time point. The entorhinal cortex is involved very early by phosphorylated tau tangles in AD pathogenesis, and often contains tau neurofibrillary tangles in preclinical AD [39]. Therefore, the entorhinal cortex samples represent late Alzheimer’s disease pathogenesis in our study as this region has a higher neurofibrillary tau tangle burden across all samples. The presence of increased neurofibrillary tau tangles in this region is likely accompanied by increased disease associated synaptic changes. By contrast, the middle frontal cortex region does not develop pathologic tau tangles until much later in AD pathogenesis in humans (e.g., Braak neurofibrillary tangle distribution stage 5). Therefore, the middle frontal cortex region samples represent early AD pathogenesis in our study.
Previous studies on neurons cultured from P301 L tau transgenic mice [40, 41], and directly in P301 L tau mouse brain [42] also support our findings. Phosphorylation mimicking tau mutants expressed in cultured neurons have additionally been specifically shown to reduce the number of AMPARs at synapses [14]. However, it is important to remember that the p.P301 L MAPT mutation used to create AD models is known to cause non-AD tauopathies in humans (e.g., progressive supranuclear palsy, globular glial tauopathy) which instead typically present with frontotemporal dementia clinically [43]. In humans, such non-AD tauopathies do develop granular appearing phosphorylated tau accumulations within neurons that are commonly 4 R tau isoform predominant. These 4 R isoform predominant neuronal tau inclusions differ from the mixed 3 R and 4 R isoforms of tau that form the characteristic fibrillary phosphorylated neuronal tau inclusions that develop in the setting of AD neuropathologic change. Additionally, in a cohort of 8 patients confirmed to have a MAPT P301 L mutation, the highest reported Braak tangle stage was 3 with the majority (5 of 8 patients) having a Braak tangle stage of 0 [43]. For these reasons, potential limitations must be taken into consideration whenever interpreting findings involving the tau protein in MAPT mutation-based model systems when studying human AD. Alternatively, this proposed sequence of tau phosphorylation may not be specific to AD pathobiology. Thus, future work using clinically, and neuropathologically characterized human brain samples should encompass other less common tauopathies, such as progressive supranuclear palsy and corticobasal degeneration, for further clarification of potential tau differences in disease progression in the setting of non-AD tauopathies.
It should also be noted that although the fractionation protocol utilized in this study is efficient for specifically isolating a P4 synaptosomal fraction that is enriched for postsynaptic elements, it does have limitations to consider. For example, the S2 fraction contains both cytosol and light membranes and therefore cannot be considered a purely cytosolic fraction; this unfortunately limited our S2 fraction analyses. Additionally, although the S4 fraction is enriched for synaptophysin, it should also not be considered as a purely presynaptic fraction. However, this fractionation protocol is robust, and the enrichment of PSD-95 in the postsynaptic (P4) fraction, and lack of synaptophysin, confirm a more successful separation of the postsynaptic (P4) fraction when compared to the other fractions. Therefore, it is necessary for future studies to further investigate pathologic tau changes in presynaptic and cytosolic fractions derived from human brain tissue samples using more rigorous fractionation protocols that are optimized for the refined separation of the presynaptic and cytosolic fractions, specifically. Our study was further limited by the scarcity of frozen postmortem human brain samples with a Braak Stage 0 neurofibrillary tangle stage, making our comprehensive assessment of tau mislocalization and phosphorylation changes in preclinical AD particularly challenging. However, we addressed this issue by assessing synaptic tau changes in the middle frontal cortex. The middle frontal cortex is known to become involved by pathologic tau tangles later in AD, making it an ideal region for studying the earliest pathologic tau changes in AD pathogenesis. Our study groups were stringently selected based on clinical and neuropathologic criteria, resulting in a relatively low number of cases for each study group. As multiple co-existing neuropathologic lesions are the norm and not the exception in human disease [44–46], autopsy brains with so-called “pure AD” (i.e., only plaques and tangles without other co-existing pathologic lesions) were scarce. This contributed to the low number of cases in our study. As this study included such a rare composition of cases, future studies must extend our approaches to larger longitudinal cohorts to comprehensively assess underlying tau disease progression in the setting of mixed lesion late-life dementia.
Phosphorylated tau S214 was shown to be one of the earliest significantly increased forms of neuronal phospho-tau in our NanoString results when comparing Braak neurofibrillary tangle stage 0 versus Braak neurofibrillary tangle stage 2 in cognitively unimpaired individuals. Of note, pTau214 has a phosphorylation site (Ser214) that is within the same Proline rich region of tau as pTau231. This finding further supports that phosphorylation of tau in the Proline rich region specifically occurs very early in AD pathogenesis. Staining results for pTau214 and PSD-95 co-localization in the frontal cortex on a larger number of clinically stratified cases highlight the presence of increased co-localized pTau214 and PSD-95 with increasing clinical disease severity (Fig. 3).
In the middle frontal cortex, the average pTau231 P4 postsynaptic fractional percentage was 12.37% for all Braak Stage 1 cases versus 21.43% for all Braak stage 6 cases. By contrast, the average pTau231 P4 postsynaptic fractional percentage for all Braak Stage 5-6 cases in the entorhinal cortex region was 15.54% and the average pTau231 P4 postsynaptic fractional percentage for all Braak stage 0–2 cases in the entorhinal cortex region was 13.98%. Therefore, we propose that the accumulation of tau phosphorylated in the Proline rich region that was observed in the middle frontal cortex (representing earlier tau pathogenesis) had not yet accumulated enough postsynaptically to initiate the upregulation of calcineurin in this later involved brain region (Fig. 2). Notably, the accumulation of tau phosphorylated within the Proline rich region is thought to initiate the dephosphorylation of AMPA receptors via the upregulation of calcineurin which dephosphorylates and internalizes the functional AMPA receptors at the postsynaptic density. After the postsynaptic tau mislocalizes and accumulates at the postsynaptic density initiating the internalization of AMPA receptors, it is thought that a subsequent increase in cytosolic pTau231 occurs (i.e., pre-tangle formation), and that pTau231 also decreases at presynaptic terminal. Our results support the notion that pTau231 mislocalization and accumulation at the postsynaptic density is followed by a subsequent increase in cytosolic pTau231 (i.e., pre-tangle formation), and decreased pTau231 at presynaptic terminal. However, whether pTau231 accumulation at the postsynaptic density occurs before pre-tangle formation in human AD pathogenesis remains unclear and should be explored further in future comprehensive studies. Plasma pTau231 levels have additionally been shown to successfully differentiate individuals across all Braak neurofibrillary tangle stages, including the earliest stages (0–2) [47]. Levels of pTau231 have also been found to be increased in the cerebrospinal fluid of cognitively normal individuals with negative Aβ positron emission tomography scans [48]. This all points to an early role for pTau231 in AD pathogenesis and highlights its potential as a peripheral biomarker [48].
Of note, plasma total tau levels were previously measured from a subset of Mayo Clinic Study of Aging (MCSA) research participants [49]. However, plasma pTau231 data was not collected on these samples [49]. It is important to note that the subset of MCSA participants included in the 2017 Mielke et al. publication differs from the cohort that was used for our brain autopsy study [49] as subset of MCSA participant plasma samples were used that were specifically collected from research participants within recent years (versus plasma samples that were collected from the same individuals included in our current brain autopsy study) [49]. Moving forward, we plan to prospectively perform a comprehensive study that will enable us to directly compare synaptosomal and cytosolic pTau231 and pTau214 levels in the brain versus plasma at different time points during disease progression during life while also making simultaneous comparisons with other brain autopsy end points (e.g., Braak tangle stage, Thal Aβ distribution phase).
Our results raise the possibility that pTau231 initially becomes mislocalized and accumulates at the postsynaptic density at the onset of memory impairment, and that neuronal pTau214 may be an even earlier from of pathologic tau phosphorylated in the Proline rich region that accumulates prior to memory impairment. Memory impairment appears to initially develop when pTau231 mislocalizes to accumulate at the postsynaptic density (Fig. 4). Interestingly, increased AMPA GluR1 was also observed in the entorhinal cortex in the AD dementia group when compared to the aMCI group. However, no significant differences in AMPA GluR1 were identified across clinically stratified groups in the frontal cortex. AMPAR trafficking from the plasma membrane at the synapse to the intracellular compartments mainly occurs via clathrin-mediated endocytosis [50, 51]. After a AMPAR is internalized from the plasma membrane, it is trafficked to early endosomes and may 1) be recycled back to the plasma membrane [52]; 2) matured into late endosomes that become lysosomes to subsequently degrade the AMPARs [53]; 3) undergo further posttranslational modifications [54]. Interestingly, in 12-month-old APP/PS1 mice, a significant reduction in AMPAR density at synapses has been previously described in both pyramidal neurons and interneurons when compared to wild-type mice of the same age [54]. Like the increase in total AMPARs that was observed in the AD dementia group in our study shown in Fig. 5, the reduction of AMPARs observed in dendritic spines in APP/PS1 mice was also reportedly accompanied by a significant increase in AMPAR subunit proteins within intracellular compartments [54]. Therefore, our findings of increased total AMPA GluR1 staining in the entorhinal cortex may potentially be explained by similar changes occurring in the human brain in AD pathogenesis. However, future studies are necessary for mechanistic clarity.
Taken together, our results support the hypothesis that pathologic accumulation of pTau231 at the postsynaptic density occurs early in AD pathogenesis as clinical impairment develops. Our results also raise the possibility of synaptic dysfunction resulting from the increased internalization of dysfunctional AMPA GluR1 receptors via de-phosphorylation. However, this is just one of many mechanistic considerations. Our results further raise the possibility of a compensatory increase in AMPA GluR1 receptors occurring in AD pathogenesis, and this may explain why we observed increased AMPA GluR1 staining in the entorhinal cortex. It is important to note that our AMPA receptor studies were performed using immunohistochemical staining on the same brain regions and same brain autopsy cases that were used for our Simoa Quanterix tau assessments. Unfortunately, as frozen tissue was exhausted from a large subset of the cases, we instead performed quantitative immunohistochemical staining to assess AMPA receptors as an alternate approach. Regardless, our findings support the potential effectiveness of pharmacological interventions that target increased phosphorylated tau at the postsynaptic density early in AD pathogenesis. For example, it has been shown in a tau mouse model that the activation of the pituitary adenylate cyclase-activating polypeptide (PACAP) type 1 receptor enhances synaptic proteasome activity and reduces tau in postsynaptic compartments [55]. Our results also raise the possibility of calcineurin inhibition (e.g., Tacrolimus) serving as either a separate or complementary effective therapeutic target in AD as calcineurin inhibition may prevent AMPAR alterations in the human brain. However, additional studies are necessary to further clarify calcineurin’s specific role (s) in AD pathogenesis.
Multiple prior studies in humans have reported that the phosphorylation of pTau231 and pS396/pS404 precedes the detection of conformationally modified MC1 tau [56–58]. Intriguingly, this has not been the case in certain transgenic mouse studies in which the MC1 conformational modification precedes tau phosphorylation in the neuropil. One possible explanation for this is that the specific sequence of tau events may differ among specific mouse models and neuronal populations, which is an additional important consideration.
ACKNOWLEDGMENTS
We dedicate this work to the family of Dr. Alexander Z. Feldman (Mr. Derrick Lepard, Dr. Dale Feldman, and Mrs. Sally Feldman). We would also like to thank our research participants at Northwestern University and Mayo Clinic Alzheimer’s Disease Research Centers for their contributions in addition to the School Sisters of Notre Dame for their contributions (supplementary NanoString samples used for this work were from the Nun Study). We also thank Bob Vassar PhD, Matthew McCord MD, Daniel J. Brat MD, PhD, Brian Popko, PhD, Jeffrey Savas PhD, and Jane Wu MD, PhD at Northwestern University, and Dezhi Liao, PhD at the University of Minnesota for their advice and feedback. Lastly, we would like to thank Andrew Clarke, Ph.D. at Ada Innovations for statistical tutoring and consultation services.
FUNDING
This study was supported by grants from the National Institute on Aging (P30 AG013854, P30 AG62677) K08AG065463 (M.E.F), RF1 AG072080 (M.E.F.), U01 AG06786)), a UMN–Mayo partnership grant (M.M.M; D.L.).
CONFLICT OF INTEREST
The authors have no conflict of interest to report.
DATA AVAILABILITY
Data supporting the findings of this study are openly available in the Zenodo data repository [59]. This includes western blot data, Simoa Quanterix pTau231 and Total Tau synaptosomal fraction data, NanoString proteins of interest in NeuN “masked” cells, and quantitative digital pathology data.
SUPPLEMENTARY MATERIAL
[1] The supplementary material is available in the electronic version of this article: https://dx.doi.org/10.3233/JAD-220848.
REFERENCES
[1] | Cummings BJ , Pike CJ , Shankle R , Cotman CW ((1996) ) B-amyloid deposition and other measures of neuropathology predict cognitive status in Alzheimer’s disease. Neurobiol Aging 17: , 921–933. |
[2] | Glenner GG , Wong CW ((1984) ) Alzheimer’s disease and Down’s syndrome: Sharing of a unique cerebrovascular amyloid fibril protein. Biochem Biophys Res Commun 122: , 1131–1135. |
[3] | Grundke-Iqbal I , Iqbal K , Quinlan M , Tung YC , Zaidi MS , Wisniewski HM ((1986) ) Microtubule-associated protein tau. A component of Alzheimer paired helical filaments. J Biol Chem 261: , 6084–6089. |
[4] | Kadavath H , Hofele RV , Biernat J , Kumar S , Tepper K , Urlaub H , Mandelkow E , Zweckstetter M ((2015) ) Tau stabilizes microtubules by binding at the interface between tubulin heterodimers. Proc Natl Acad Sci U S A 112: , 7501–7506. |
[5] | Shin MK , Vázquez-Rosa E , Koh Y , Dhar M , Chaubey K , Cintrón-Pérez CJ , Barker S , Miller E , Franke K , Noterman MF , Seth D , Allen RS , Motz CT , Rao SR , Skelton LA , Pardue MT , Fliesler SJ , Wang C , Tracy TE , Gan L , Liebl DJ , Savarraj JPJ , Torres GL , Ahnstedt H , McCullough LD , Kitagawa RS , Choi HA , Zhang P , Hou Y , Chiang CW , Li L , Ortiz F , Kilgore JA , Williams NS , Whitehair VC , Gefen T , Flanagan ME , Stamler JS , Jain MK , Kraus A , Cheng F , Reynolds JD , Pieper AA ((2021) ) Reducing acetylated tau is neuroprotective in brain injury. Cell 184: , 2715–2732.e23. |
[6] | Wesseling H , Mair W , Kumar M , Schlaffner CN , Tang S , Beerepoot P , Fatou B , Guise AJ , Cheng L , Takeda S , Muntel J , Rotunno MS , Dujardin S , Davies P , Kosik KS , Miller BL , Berretta S , Hedreen JC , Grinberg LT , Seeley WW , Hyman BT , Steen H , Steen JA ((2020) ) Tau PTM profiles identify patient heterogeneity and stages of Alzheimer’s disease. Cell 183: , 1699–1713.e13. |
[7] | Ittner LM , Fath T , Ke YD , Bi M , van Eersel J , Li KM , Gunning P , Götz J ((2008) ) Parkinsonism and impaired axonal transport in a mouse model of frontotemporal dementia. Proc Natl Acad Sci U S A 105: , 15997–16002. |
[8] | Lasagna-Reeves CA , Castillo-Carranza DL , Sengupta U , Clos AL , Jackson GR , Kayed R ((2011) ) Tau oligomers impair memory and induce synaptic and mitochondrial dysfunction in wild-type mice. Mol Neurodegener 6: , 39. |
[9] | Yang G , Pan F , Gan WB ((2009) ) Stably maintained dendritic spines are associated with lifelong memories. Nature 462: , 920–924. |
[10] | Li JY , Plomann M , Brundin P ((2003) ) Huntington’s disease: A synaptopathy? Trends Mol Med 9: , 414–420. |
[11] | Lepeta K , Lourenco MV , Schweitzer BC , Martino Adami PV , Banerjee P , Catuara-Solarz S , de La Fuente Revenga M , Guillem AM , Haidar M , Ijomone OM , Nadorp B , Qi L , Perera ND , Refsgaard LK , Reid KM , Sabbar M , Sahoo A , Schaefer N , Sheean RK , Suska A , Verma R , Vicidomini C , Wright D , Zhang XD , Seidenbecher C ((2016) ) Synaptopathies: Synaptic dysfunction in neurological disorders - a review from students to students. J Neurochem 138: , 785–805. |
[12] | Luscher C , Malenka RC ((2012) ) NMDA receptor-dependent long-term potentiation and long-term depression (LTP/LTD). Cold Spring Harb Perspect Biol 4: , a005710. |
[13] | Chater TE , Goda Y ((2014) ) The role of AMPA receptors in postsynaptic mechanisms of synaptic plasticity. Front Cell Neurosci 8: , 401. |
[14] | Teravskis PJ , Oxnard BR , Miller EC , Kemper L , Ashe KH , Liao D ((2021) ) Phosphorylation in two discrete tau domains regulates a stepwise process leading to postsynaptic dysfunction. J Physiol 599: , 2483–2498. |
[15] | Teravskis PJ , Ashe KH , Liao D ((2020) ) The accumulation of tau in postsynaptic structures: A common feature in multiple neurodegenerative diseases? Neuroscientist 26: , 503–520. |
[16] | Wang X , Zhao Y , Zhang X , Badie H , Zhou Y , Mu Y , Loo LS , Cai L , Thompson RC , Yang B , Chen Y , Johnson PF , Wu C , Bu G , Mobley WC , Zhang D , Gage FH , Ranscht B , Zhang YW , Lipton SA , Hong W , Xu H ((2013) ) Loss of sorting nexin 27 contributes to excitatory synaptic dysfunction by modulating glutamate receptor recycling in Down’s syndrome. Nat Med 19: , 473–480. |
[17] | Eidenmüller J , Fath T , Maas T , Pool M , Sontag E , Brandt R ((2001) ) Phosphorylation-mimicking glutamate clusters in the proline-rich region are sufficient to simulate the functional deficiencies of hyperphosphorylated tau protein. Biochem J 357: , 759–767. |
[18] | Cho H , Choi JY , Hwang MS , Kim YJ , Lee HM , Lee HS , Lee JH , Ryu YH , Lee MS , Lyoo CH ((2016) ) In vivo cortical spreading pattern of tau and amyloid in the Alzheimer disease spectrum. Ann Neurol 80: , 247–258. |
[19] | Schöll M , Lockhart SN , Schonhaut DR , O’Neil JP , Janabi M , Ossenkoppele R , Baker SL , Vogel JW , Faria J , Schwimmer HD , Rabinovici GD , Jagust WJ ((2016) ) PET imaging of tau deposition in the aging human brain. Neuron 89: , 971–982. |
[20] | Polydoro M , Acker CM , Duff K , Castillo PE , Davies P ((2009) ) Age-dependent impairment of cognitive and synaptic function in the HTAU mouse model of tau pathology. J Neurosci 29: , 10741–10749. |
[21] | Aragão Gomes L , Uytterhoeven V , Lopez-Sanmartin D , Tomé SO , Tousseyn T , Vandenberghe R , Vandenbulcke M , von Arnim CA , Verstreken P , Thal DR ((2021) ) Maturation of neuronal ad-tau pathology involves site-specific phosphorylation of cytoplasmic and synaptic tau preceding conformational change and Fibril Formation. Acta Neuropathol 141: , 173–192. |
[22] | Braak H , Braak E ((1991) ) Neuropathological stageing of Alzheimer-related changes. Acta Neuropathol 82: , 239–259. |
[23] | Zhao X , Kotilinek LA , Smith B , Hlynialuk C , Zahs K , Ramsden M , Cleary J , Ashe KH ((2016) ) Caspase-2 cleavage of tau reversibly impairs memory. Nat Med 22: , 1268–1276. |
[24] | Sengupta A , Kabat J , Novak M , Wu Q , Grundke-Iqbal I , Iqbal K ((1998) ) Phosphorylation of tau at both Thr 231 and Ser 262 is required for maximal inhibition of its binding to microtubules. Arch Biochem Biophys 357: , 299–309. |
[25] | Leuba G , Savioz A , Vernay A , Carnal B , Kraftsik R , Tardif E , Riederer I , Riederer BM ((2008) ) Differential changes in synaptic proteins in the Alzheimer frontal cortex with marked increase in PSD-95 postsynaptic protein. J Alzheimers Dis 15: , 139–151. |
[26] | Gylys KH , Fein JA , Yang F , Wiley DJ , Miller CA , Cole GM ((2004) ) Synaptic changes in Alzheimer’s disease: Increased amyloid-beta and gliosis in surviving terminals is accompanied by decreased PSD-95 fluorescence. Am J Pathol 165: , 1809–1817. |
[27] | Roberts RO , Geda YE , Knopman DS , Cha RH , Pankratz VS , Boeve BF , Ivnik RJ , Tangalos EG , Petersen RC , Rocca WA ((2008) ) The Mayo Clinic Study of aging: Design and sampling, participation, baseline measures and sample characteristics. Neuroepidemiology 30: , 58–69. |
[28] | Petersen RC ((2004) ) Mild cognitive impairment as a diagnostic entity. J Intern Med 256: , 183–194. |
[29] | McKhann GM , Knopman DS , Chertkow H , Hyman BT , Jack CR , Kawas CH , Klunk WE , Koroshetz WJ , Manly JJ , Mayeux R , Mohs RC , Morris JC , Rossor MN , Scheltens P , Carrillo MC , Thies B , Weintraub S , Phelps CH ((2011) ) The diagnosis of dementia due to Alzheimer’s disease: Recommendations from the National Institute on aging-Alzheimer’s association workgroups on diagnostic guidelines for Alzheimer’s disease. Alzheimers Dement 7: , 263–269. |
[30] | Hyman BT , Phelps CH , Beach TG , Bigio EH , Cairns NJ , Carrillo MC , Dickson DW , Duyckaerts C , Frosch MP , Masliah E , Mirra SS , Nelson PT , Schneider JA , Thal DR , Thies B , Trojanowski JQ , Vinters HV , Montine TJ ((2012) ) National Institute on Aging–Alzheimer’s Association guidelines for the neuropathologic assessment of Alzheimer’s disease. Alzheimers Dement 8: , 1–13. |
[31] | Montine TJ , Phelps CH , Beach TG , Bigio EH , Cairns NJ , Dickson DW , Duyckaerts C , Frosch MP , Masliah E , Mirra SS , Nelson PT , Schneider JA , Thal DR , Trojanowski JQ , Vinters HV , Hyman BT ; National Institute on Aging; Alzheimer’s Association ((2012) ) National Institute on Aging–Alzheimer’s Association guidelines for the neuropathologic assessment of Alzheimer’s disease: A practical approach. Acta Neuropathol 123: , 1–11. |
[32] | Sherman MA , Lesné SE ((2011) ) Detecting AB*56 oligomers in brain tissues. Methods Mol Biol 670: , 45–56. |
[33] | Ding SL , Van Hoesen GW ((2015) ) Organization and detailed parcellation of human hippocampal head and body regions based on a combined analysis of cyto- and chemoarchitecture. J Comp Neurol 523: , 2233–2253. |
[34] | Walker JM , Kazempour Dehkordi S , Fracassi A , Vanschoiack A , Pavenko A , Taglialatela G , Woltjer R , Richardson TE , Zare H , Orr ME ((2022) ) Differential protein expression in the hippocampi of resilient individuals identified by digital spatial profiling. Acta Neuropathol Commun 10: , 23. |
[35] | Merritt CR , Ong GT , Church SE , Barker K , Danaher P , Geiss G , Hoang M , Jung J , Liang Y , McKay-Fleisch J , Nguyen K , Norgaard Z , Sorg K , Sprague I , Warren C , Warren S , Webster PJ , Zhou Z , Zollinger DR , Dunaway DL , Mills GB , Beechem JM ((2020) ) Multiplex digital spatial profiling of proteins and RNA in fixed tissue. Nat Biotechnol 38: , 586–599. |
[36] | Decalf J , Albert ML , Ziai J ((2019) ) New tools for pathology: A User’s review of a highly multiplexed method for in situ analysis of protein and RNA expression in tissue. J Pathol 247: , 650–661. |
[37] | White H ((1982) ) Maximum likelihood estimation of misspecified models. Econometrica 50: , 1. |
[38] | Huber PJ , Le Cam LM , Neyman J ((1965) ) Fifth Berkeley Symposium on statistics and probability. Science 150: , 1638–1638. |
[39] | van Hoesen GW , Hyman BT , Damasio AR ((1991) ) Entorhinal cortex pathology in Alzheimer’s disease. Hippocampus 1: , 1–8. |
[40] | Pickett EK , Henstridge CM , Allison E , Pitstick R , Pooler A , Wegmann S , Carlson G , Hyman BT , Spires-Jones TL ((2017) ) Spread of tau down neural circuits precedes synapse and neuronal loss in the rTgTauEC mouse model of early Alzheimer’s disease. Synapse 71: , e21965. |
[41] | Miller EC , Teravskis PJ , Dummer BW , Zhao X , Huganir RL , Liao D ((2014) ) Tau phosphorylation and tau mislocalization mediate soluble Aβ oligomer-induced AMPA glutamate receptor signaling deficits. Eur J Neurosci 39: , 1214–1224. |
[42] | Kopeikina KJ , Polydoro M , Tai HC , Yaeger E , Carlson GA , Pitstick R , Hyman BT , Spires-Jones TL ((2013) ) Synaptic alterations in the rTg4510 mouse model of tauopathy. J Comp Neurol 521: , 1334–1353. |
[43] | Tacik P , Sanchez-Contreras M , DeTure M , Murray ME , Rademakers R , Ross OA , Wszolek ZK , Parisi JE , Knopman DS , Petersen RC , Dickson DW ((2017) ) Clinicopathologic heterogeneity in frontotemporal dementia and parkinsonism linked to chromosome 17 (FTDP-17) due to microtubule-associated protein tau (MAPT) P.P301L mutation, including a patient with globular glial tauopathy. Neuropathol Appl Neurobiol 43: , 200–214. |
[44] | Schneider JA , Arvanitakis Z , Bang W , Bennett DA ((2007) ) Mixed brain pathologies account for most dementia cases in community-dwelling older persons. Neurology 69: , 2197–2204. |
[45] | James BD , Wilson RS , Boyle PA , Trojanowski JQ , Bennett DA , Schneider JA ((2016) ) TDP-43 stage, mixed pathologies, and clinical Alzheimer’s-type dementia. Brain 139: , 2983–2993. |
[46] | Latimer CS , Keene CD , Flanagan ME , Hemmy LS , Lim KO , White LR , Montine KS , Montine TJ ((2017) ) Resistance to Alzheimer disease neuropathologic changes and apparent cognitive resilience in the nun and honolulu-asia aging studies. J Neuropathol Exp Neurol 76: , 458–466. |
[47] | Ashton NJ , Pascoal TA , Karikari TK , Benedet AL , Lantero-Rodriguez J , Brinkmalm G , Snellman A , Schöll M , Troakes C , Hye A , Gauthier S , Vanmechelen E , Zetterberg H , Rosa-Neto P , Blennow K ((2021) ) Plasma P-TAU231: A new biomarker for Incipient Alzheimer’s disease pathology. Acta Neuropathol 141: , 709–724. |
[48] | Suárez-Calvet M , Karikari TK , Ashton NJ , Lantero Rodríguez J , Milà-Alomà M , Gispert JD , Salvadó G , Minguillon C , Fauria K , Shekari M , Grau-Rivera O , Arenaza-Urquijo EM , Sala-Vila A , Sánchez-Benavides G , González-de-Echávarri JM , Kollmorgen G , Stoops E , Vanmechelen E , Zetterberg H , Blennow K , Molinuevo JL , Beteta A , Cacciaglia R , Cañas A , Deulofeu C , Cumplido I , Dominguez R , Emilio M , Falcon C , Fuentes S , Hernandez L , Huesa G , Huguet J , Marne P , Menchón T , Operto G , Polo A , Pradas S , Soteras A , Vilanova M , Vilor-Tejedor N ((2020) ) Novel taubiomarkers phosphorylated at T181, T217 or T231 rise in the initialstages of the preclinical Alzheimer’s continuum when only subtlechanges in AB pathology are detected. EMBO Mol Med 12: , e12921. |
[49] | Mielke MM , Hagen CE , Wennberg AM , Airey DC , Savica R , Knopman DS , Machulda MM , Roberts RO , Jack CR , Petersen RC , Dage JL ((2017) ) Association of plasma total tau level with cognitive decline and risk of mild cognitive impairment or dementia in the Mayo Clinic Study on Aging. JAMA Neurol 74: , 1073–1080. |
[50] | Man HY , Lin JW , Ju WH , Ahmadian G , Liu L , Becker LE , Sheng M , Wang YT ((2000) ) Regulation of AMPA receptor–mediated synaptic transmission by clathrin-dependent receptor internalization. Neuron 25: , 649–662. |
[51] | Cosker KE , Segal RA ((2014) ) Neuronal signaling through endocytosis. Cold Spring Harb Perspect Biol 6: , a020669. |
[52] | van der Sluijs P , Hoogenraad CC ((2011) ) New insights in endosomal dynamics and AMPA receptor trafficking. Semin Cell Dev Biol 22: , 499–505. |
[53] | Hu YB , Dammer EB , Ren RJ , Wang G ((2015) ) The endosomal-lysosomal system: From acidification and cargo sorting to neurodegeneration. Transl Neurodegener 4: , 18. |
[54] | Martín-Belmonte A , Aguado C , Alfaro-Ruíz R , Itakura M , Moreno-Martínez AE , de la Ossa L , Molnár E , Fukazawa Y , Luján R ((2020) ) Age-dependent shift of AMPAreceptors from synapses to intracellular compartments in Alzheimer’s disease: Immunocytochemical analysis ofthe CA1 hippocampal region in App/PS1 transgenic mouse model. Front Aging Neurosci 12: , 577996. |
[55] | Schaler AW , Runyan AM , Clelland CL , Sydney EJ , Fowler SL , Figueroa HY , Shioda S , Santa-Maria I , Duff KE , Myeku N ((2021) ) PAC1 receptor–mediated clearance of tau in postsynaptic compartments attenuates tau pathology in mouse brain. Sci Transl Med 13: , eaba7394. |
[56] | Luna-Muñoz J , García-Sierra F , Falcón V , Menéndez I , Chávez-Macías L , Mena R ((2005) ) Regional conformationalchange involving phosphorylation of tau protein at the THR231,precedes the structural change detected by alz-50 antibody inAlzheimer’s disease. J Alzheimers Dis 8: , 29–41. |
[57] | Weaver C ((2000) ) Conformational change as one of the earliest alterations of tau in Alzheimer’s disease. Neurobiol Aging 21: , 719–727. |
[58] | Jicha GA , Lane E , Vincent I , Otvos L , Hoffmann R , Davies P ((1997) ) A conformation- and phosphorylation-dependent antibody recognizing the paired helical filaments of Alzheimer’s disease. J Neurochem 69: , 2087–2095. |
[59] | Lilek J , Feldman AZ , Krishnamachari S , Ghourchian S , Gefen T , Spencer CL , Kawles A , Mao Q , Tranovich JF , Jack CR Jr , Mesulam MM , Reichard RR , Zhang H , Murray ME , Knopman D , Dickson DW , Petersen RC , Smith B , Ashe KH , Mielke MM , Nelson KM , Flanagan ME (2023) Final dataset 1. Zenodo data Repository at https://zenodo.org/record/7516449#.Y7w6vezMLzc |


