
Air Pollution and the Risk of Dementia: The Rotterdam Study
Abstract
Background:
Exposure to air pollution has been suggested to increase the risk of dementia, but studies on this link often lack a detailed screening for dementia and data on important confounders.
Objective:
To determine the association of exposure to air pollution with the risk of dementia and cognitive decline in the population-based Rotterdam Study.
Methods:
Between 2009 and 2010, we determined air pollutant concentrations at participants residential addresses using land use regression models. Determined air pollutants include particulate matter <10μm (PM10) and <2.5μm (PM2.5), a proxy of elemental carbon (PM2.5 absorbance), nitrogen oxide (NOx), and nitrogen dioxide (NO2). As the individual air pollutant levels were highly correlated (r = 0.71–0.98), we computed a general marker covering all air pollutants based on a principal component analysis. We followed participants up for dementia until 2018 and determined cognitive performance during two subsequent examination rounds. Using Cox and linear mixed models, we related air pollution to dementia and cognitive decline.
Results:
Of the 7,511 non-demented participants at baseline, 545 developed dementia during a median follow-up of 7 years. The general marker of all air pollutants was not associated with the risk of dementia (hazard ratio [95% confidence interval]: 1.04 [0.95–1.15]), neither were the individual air pollutants. Also, the general marker of all air pollutants or the individual air pollutant levels were not associated with cognitive decline.
Conclusion:
In this study, we found no clear evidence for an association between exposure to air pollution and the risk of dementia or cognitive decline.
INTRODUCTION
Dementia is a multifactorial disease that currently affects over 55 million people worldwide, and this number is expected to triple by 2050 due to an aging population [1]. Consequently, the enormous burden on societies will increase further, which emphasizes the urgent need to identify modifiable risk factors to prevent dementia.
In this regard, air pollution could be of interest, as various studies have shown that individuals residing in highly air polluted areas are at an increased risk of dementia [2, 3]. Air pollution is a mixture of gases and particles that can enter the body after inhalation through the lungs and the smallest particles may reach the brain directly through the olfactory system [4]. This could affect the brain by triggering inflammation, oxidative stress, and cerebrovascular damage [5–7].
Nevertheless, a recent meta-analysis [8] and systematic review [2] on the link between air pollution and the risk of dementia highlighted that most previous studies obtained incident dementia cases from healthcare administrative databases, such as insurance claims and medical records. A strength of these studies includes the large sample size that adequately represent the target population, but the documentation of dementia diagnosis is insufficient and data on important confounders are lacking [9, 10]. This may have led to an underestimation of the true association, for instance because individuals with a lower socioeconomic status are more often underdiagnosed for dementia [10, 11], while they also reside more often in higher polluted areas than those with a higher socioeconomic status [12]. The scarcity of population-based cohort studies on the association between air pollution and the risk of dementia that used a valid approach to diagnose dementia and had extensive data on confounding factors, encouraged the authors of the meta-analysis to conclude that replication is warranted [8].
We therefore studied the association of exposure to air pollution with the risk of dementia and cognitive decline in a large population-based cohort study in the Netherlands.
METHODS
Study setting and population
This study was embedded within the Rotterdam Study, a prospective population-based cohort among inhabitants of Ommoord, a small, densely populated and well-defined suburb of approximately 4.5 km2 in Rotterdam, the Netherlands [13]. The original cohort (RS-I) started in 1990. All inhabitants of Ommoord who were 55 years and older were invited to participate and 7,983 agreed (response rate 78%). The study was enlarged with a second cohort (RS-II) in 2000 including 3,011 additional participants (response rate 67%) who had turned 55 years or moved into the study area, followed by a third cohort (RS-III) in 2006 with 3,932 additional participants (response rate 65%) aged 45 years and older. Every 3–5 years, participants are invited for a follow-up examination.
The Rotterdam Study has been approved by the Medical Ethics Committee of the Erasmus MC (registration number MEC 02.1015) and by the Dutch Ministry of Health, Welfare and Sport (Population Screening Act WBO, license number 1071272-159521-PG). The Rotterdam Study has been entered into the Netherlands National Trial Register (NTR; www.trialregister.nl) and into the WHO International Clinical Trials Registry Platform (ICTRP; www.who.int/ictrp/network/primary/en/) under shared catalogue number NTR6831. All participants provided written informed consent to participate in the study and to have their information obtained from treating physicians.
Between February 17, 2009 and February 19, 2010, annual mean air pollutant levels were determined in Ommoord. February 19, 2010 was therefore considered as baseline in the current study. Of the 9,241 participants who were still alive and participating in the study at baseline, 8,053 were still living in Ommoord and had reported their residential address. We excluded 275 participants with prevalent dementia, 227 participants who were insufficiently screened for dementia, and 40 participants who did not sign informed consent for follow-up data monitoring, resulting in a study population of 7,511 participants to assess the association between exposure to air pollution and the risk of dementia. Moreover, on average 1.8 years after baseline of the current study, 5,969 participants from all three cohorts of the Rotterdam Study visited the research center to undergo cognitive performance assessment and on average 4.7 years later 2,268 participants of the first and second cohort (RS-I and RS-II) visited the research center again to undergo a cognitive reexamination. Cognitive reexaminations for participants of the third cohort (RS-III) are currently taking place. Reexamination data from participants of RS-III, who are relatively younger than participants of RS-I and RS-II, could thus not been taken into account.
Air pollution
Annual air pollutant concentrations, including particulate matter of less than 10μm (PM10) and 2.5μm (PM2.5) in diameter, a proxy of elemental carbon (PM2.5 absorbance), nitrogen oxide (NOx), and nitrogen dioxide (NO2), were calculated at participants geocoded residential address using land use regression (LUR) models. Geocoding was performed using the Google Maps geocoder in OGIS. LUR models were developed within the European Study of Cohorts for Air Pollution Effects (ESCAPE) project, as described in detail elsewhere [14, 15]. In brief, particulate matter was measured at 40 locations and nitrogen oxides at 80 locations in The Netherlands and Belgium (including one in Rotterdam) between February 17, 2009 and February 19, 2010. This was done in a cold, intermediate, and warm temperature season, each for 14 days. Obtained concentrations of the individual air pollutants were averaged, adjusted for temporal variation as derived from a centrally located background reference site, and considered as the annual averages. LUR models were developed using linear regression with the annual average air pollutant concentrations as outcome variable. Potential predictor variables considered included traffic, land use, population density and altitude data. Derived from European-wide geographic information system (GIS) databases, traffic was calculated for circular buffers with radii of 25, 50, 100, 300, 500, and 1000 m and land use on buffers of 100, 300, 500, 1000, and 5000 m [14, 15]. In addition, local GIS databases were used to obtain population density and altitude data on a special resolution of at least 100 m. A stepwise selection procedure was used to obtain a model including a selection of predictor variables that minimized the model explained variance (R2). The final LUR models are provided in Supplementary Table 1 and had a R2 of 68% for PM10, 67% for PM2.5, 92% for PM2.5 absorbance, 86% for NO2, and 87% for NOx.
Variation in air pollutant concentrations in the current study was substantial, but the individual air pollutants were strongly correlated with each other (Spearman’s correlation coefficients varying between 0.71 and 0.98, Supplementary Figure 1). We therefore computed a general marker covering all air pollutants based on the first unrotated component of a principal component analysis, explaining 82.7% of the variance. Factor loadings of the individual air pollutants were all positive and ranged from 0.83 to 0.97 (Supplementary Table 2), indicating that the correlation between the individual air pollutants and the general marker was strong. Nevertheless, as the strength of the factor loadings varies between air pollutants, we also report results from the individual air pollutants.
The modeled air pollutant concentrations can be considered as long-term average values as the district of Ommoord is fairly stable with little environmental changes taking place in the last two decades (i.e., no major construction, no new highways etc.).
Dementia
Participants were screened for dementia at Rotterdam Study baseline and every 3–5 years during follow-up examinations using the Mini-Mental State Examination (MMSE) and the Geriatric Mental Schedule (GMS) organic level [16]. Those with an MMSE score less than 26 or a GMS organic level score more than 0 were further screened using the Cambridge Examination for Mental Disorders in the Elderly diagnostic interview. Participants were also monitored for dementia on a continuous basis through an electronic link between the study database and medical records from general practitioners and the Regional Institute of Outpatients Mental health Care. The final diagnosis was established by a consensus panel led by a neurologist, according to standard criteria for dementia (DSM-III-R), and for sub-diagnosis of Alzheimer’s disease (NINCDS-ADRDA). Follow-up for dementia was conducted until January 1, 2018 and was completed for 96% of the potential person-years.
Cognition
Cognitive function was assessed using a neuropsychological test battery, consisting of the MMSE, letter-digit substitution test, word fluency test, Stroop test, 15-word learning test, and the Purdue Pegboard test. Detailed information on the individual tests can be found elsewhere [17]. To enable comparisons between the different tests, we inverted the three Stroop subtask scores so that higher scores for each cognitive test indicate better performance. We calculated the G-factor as measure of general cognitive function based on the first unrotated component of a principal component analysis including a subset of the cognitive tests, namely the letter-digit substitution test, the word fluency test, inference subtask of the Stroop test, delayed recall subtask of the 15-word learning test, and the sum-score of the Purdue Pegboard test. This analysis was performed on test scores from both the first and second examination round together and explained 48% of the variance among the included test scores.
Covariates
Based on home interviews, we collected data on level of education (classified as primary, lower, intermediate, higher), smoking status (classified as current, former, never), monthly household income in euros per month (classified as ≤050, 1050–1500, 1500–2100, 2100–2900,>2900), alcohol intake in grams per day, and working hours per day. Physical activity was measured using the validated LASA Physical Activity Questionnaire and obtained data was recalculated into Metabolic Equivalent of Task (MET)-hours per week. Hours from home per day, as measure of mobility, was calculated by summing working hours and hours of outdoor physical activity per day. Body mass index (BMI) was computed from measurements of height and weight (kg/m2). Depressive symptoms were evaluated with the validated Center for Epidemiology Depression Scale (CES-D), which was converted to a sum-score. APOE genotype was obtained using polymerase chain reaction of coded DNA samples for sub-cohort RS-I and with bi-allelic TaqMan assay for sub-cohort RS-II and RS-III.
Statistical analysis
We determined the association between the general marker of all air pollutants and the incidence of dementia, using Cox proportional hazard models. The general marker was analyzed continuously per standard deviation increase and per quartile. We repeated the analyses for each individual air pollutant. Based on plots of Schoenfeld residuals, we confirmed that the proportional hazard assumptions were not violated. Age in years was used as time scale and participants were censored when they were diagnosed with dementia, died, were lost to follow-up or at the end of the follow-up (January 1, 2018), whichever came first. All models were adjusted for age at baseline, sex, and level of education (model I). We further adjusted in an additional model for smoking status, monthly household income, alcohol intake, physical activity, hours from home, BMI, and depressive symptoms (model II). We stratified for APOE genotype (ɛ4 carrier versus no ɛ4 carrier) and for age below and above 70 years at baseline to assess effect modification. To minimize the risk of exposure misclassification, we excluded all participants who changed residential address during follow-up. Also, we subsequently excluded participants who were Ommoord resident for less than 10 and 25 years before baseline. To create insights in the potential role of competing risk by mortality, we visualized Kaplan-Meier survival curves with advancing age per quartile of the general marker of all air pollutants and per quartile of the individual air pollutants.
We further assessed the association of the general marker of all air pollutants with performance on the cognitive test scores and change in the cognitive test scores during follow-up, using linear mixed models with a random intercept and slope. For certain cognitive test scores, models did not convert with a random slope. In these cases, the random slope was removed from the model (i.e., for the reading and interference subtasks of the Stroop test, and the delayed recall and recognition subtasks of the word learning test). We again repeated the analysis for each individual air pollutant. The time interval between the first and second cognitive performance assessments was added as variable to the model and an interaction term between time and air pollutant levels was added, reflecting whether change in cognitive test scores differ among air pollution levels. We additionally added all covariates of model II as described above to the models. We also added a non-linear term for age (i.e., cubic splines including three knots) as this significantly (p < 0.05) improved the fit of the model according to the likelihood ratio test with the models fitted under the maximum likelihood procedure. We performed natural log transformation on cognitive test scores with a skewed distribution (i.e., MMSE, all Stroop tests, and Word Learning Test: Recognition), but given that this did not affect our results, we reported results based on non-transformed cognitive scores. To evaluate whether potential effects of air pollution differ by age, we repeated the analyses after replacing the time variable by age at cognitive assessment, while adjusting for date of birth.
Missing data on covariates (23.7% for physical activity, 10.5% for monthly household income, 9.9% for working hours, 5.4% for BMI <2% for all other covariates) were imputed using the mean of five-fold multiple imputation. All statistical analysis were conducted using R Statistical Software version 4.0.3.
RESULTS
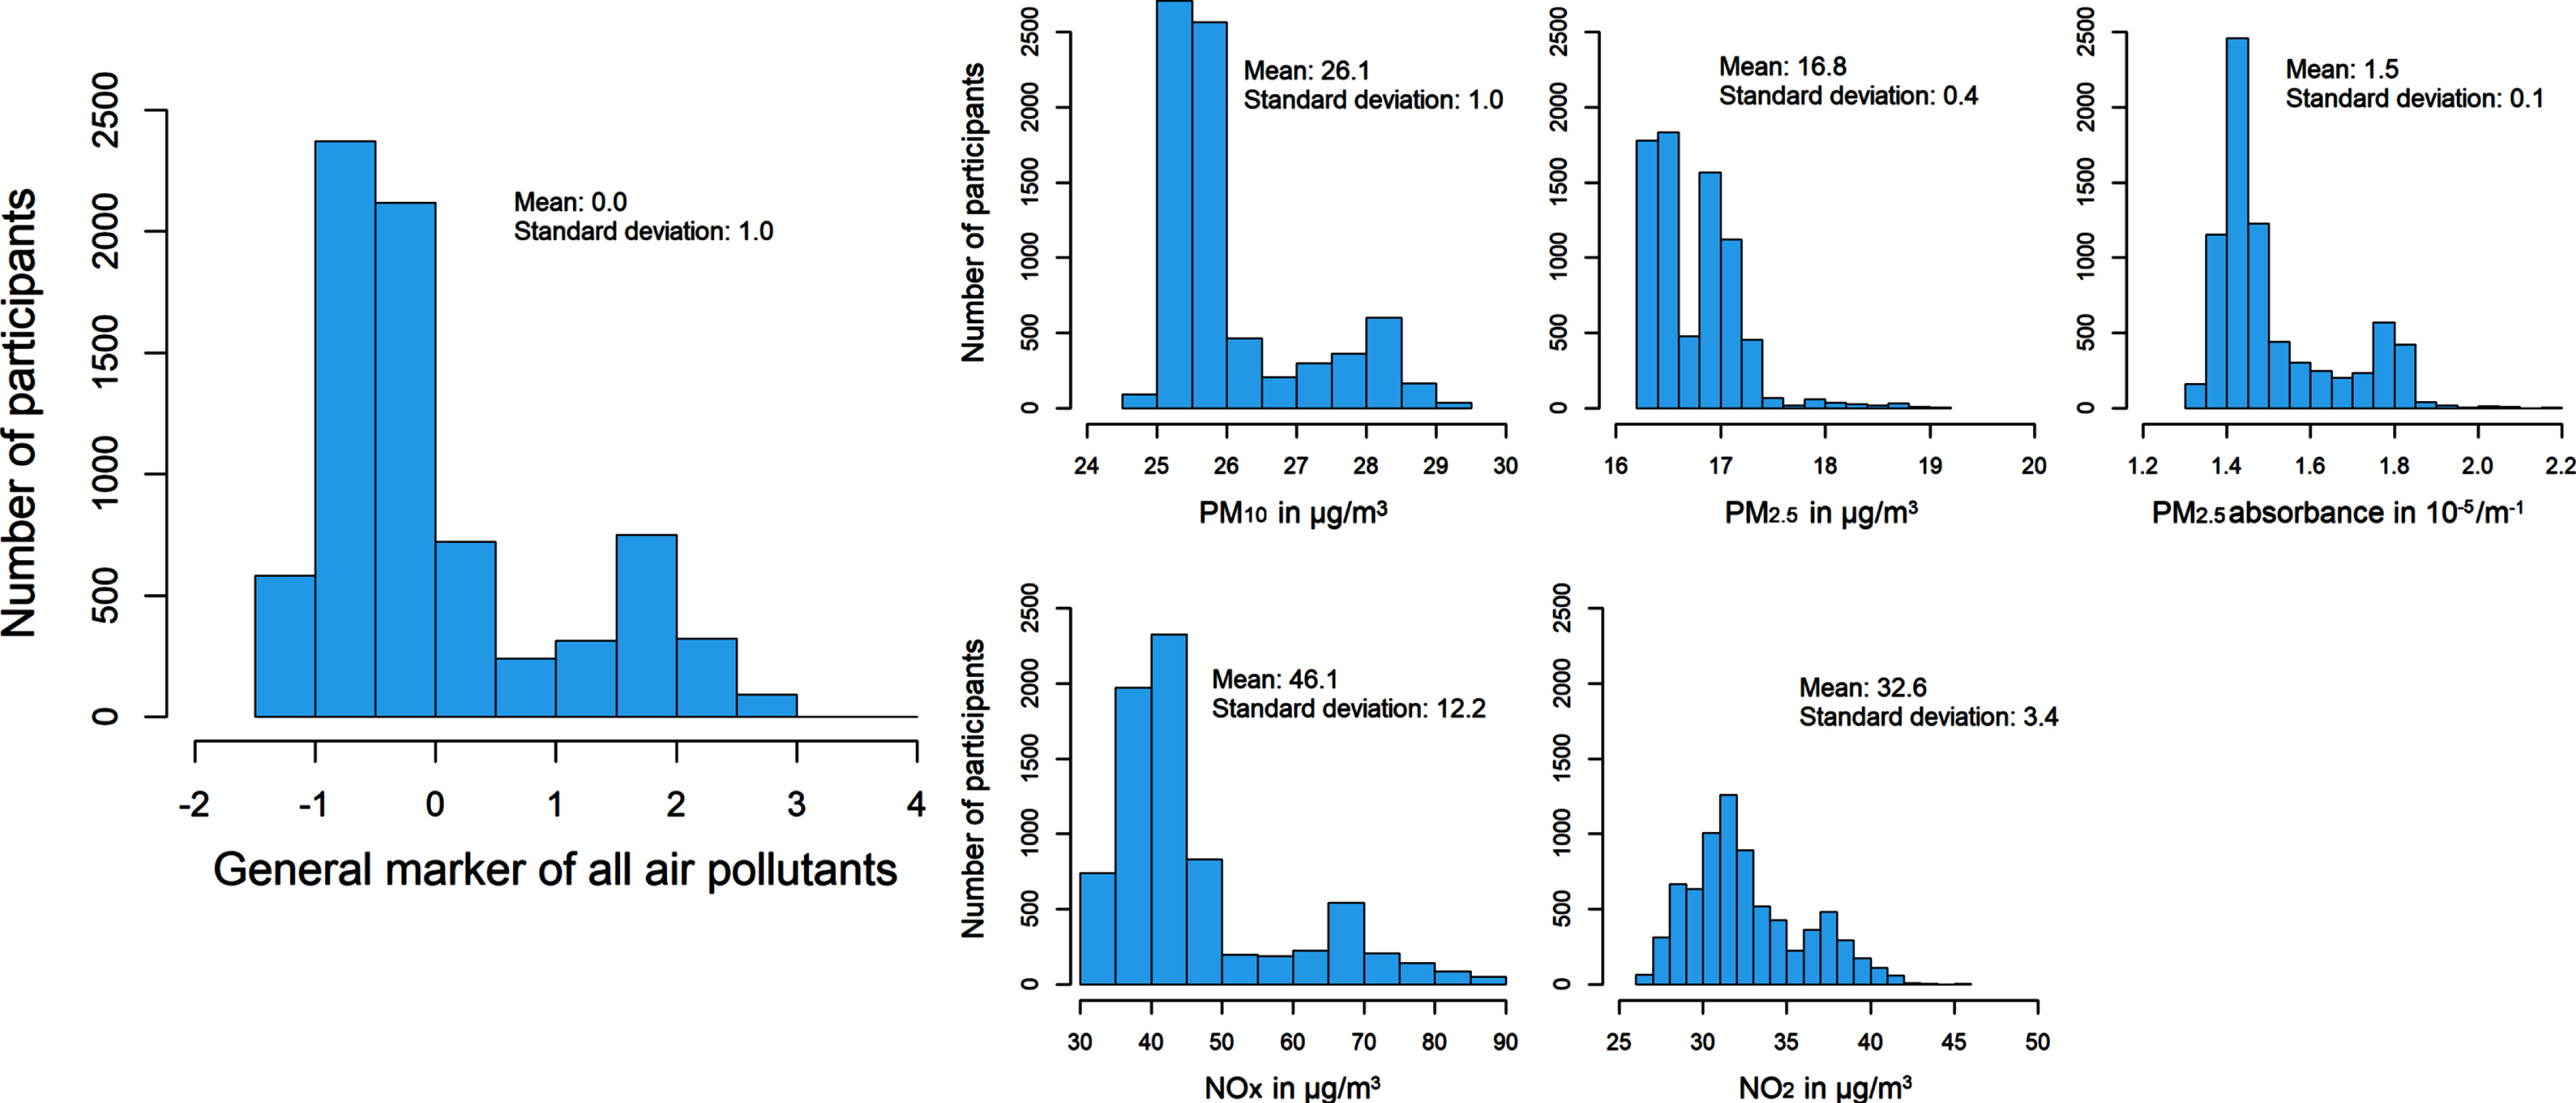
Characteristics of the participants per quartile of the general marker of all air pollutants are presented in Table 1. Characteristics were not uniformly distributed, but there was also no clear distributing trend across the different quartiles. Figure 1 represents descriptive statistics of all modeled ambient air pollutants and the general marker of all air pollutants at participants’ residential addresses.
Table 1
Characteristics of the study population per quartile of a general marker of all air pollutants
| General marker of all air pollutants | ||||
| Quartile 1 | Quartile 2 | Quartile 3 | Quartile 4 | |
| (n = 1,879) | (n = 1,879) | (n = 1,875) | (n = 1,878) | |
| Age, years | 66.4 (10.3) | 70.8 (10.9) | 71.2 (11.3) | 66.2 (10.2) |
| Female sex | 1,026 (54.6) | 1,190 (63.3) | 1,177 (62.8) | 1,008 (53.7) |
| Level of education | ||||
| Primary | 122 (6.6) | 265 (14.2) | 229 (12.3) | 129 (6.9) |
| Lower | 676 (36.4) | 856 (45.9) | 803 (43.3) | 672 (36.1) |
| Intermediate | 544 (29.3) | 520 (27.9) | 540 (29.1) | 572 (30.8) |
| Higher | 517 (27.8) | 223 (12.0) | 284 (15.3) | 486 (26.1) |
| Smoking status | ||||
| Never | 613 (32.8) | 555 (29.6) | 638 (34.1) | 584 (31.2) |
| Former | 942 (50.4) | 923 (49.3) | 879 (47.0) | 895 (47.8) |
| Current | 315 (16.8) | 395 (21.1) | 355 (19.0) | 394 (21.0) |
| Household income, euros/month | ||||
| ≤1050 | 64 (3.8) | 224 (13.1) | 150 (8.9) | 68 (4.1) |
| 1050–150 | 147 (8.7) | 345 (20.2) | 267 (15.9) | 122 (7.3) |
| 1500–210 | 310 (18.4) | 504 (29.6) | 441 (26.3) | 298 (17.9) |
| 2100–2900 | 439 (26.1) | 375 (22.0) | 462 (27.6) | 562 (33.8) |
| >2900 | 721 (42.9) | 256 (15.0) | 356 (21.2) | 612 (36.8) |
| Alcohol intake, g/day | 8.8 (9.3) | 7.2 (9.2) | 7.3 (9.1) | 7.9 (9.2) |
| Physical activity, MET h/week | 61.7 (58.2) | 54.6 (57.1) | 50.1 (52.4) | 55.6 (57.1) |
| Hours from home per week | 18.0 (32.7) | 12.4 (13.9) | 13.8 (32.2) | 16.7 (17.1) |
| Body mass index, kg/m2 | 27.3 (4.2) | 28.0 (4.7) | 27.9 (4.5) | 27.5 (4.2) |
| CES-D, score | 5.6 (7.1) | 7.2 (7.7) | 7.3 (7.8) | 6.1 (7.1) |
| APOE ɛ4 carrier | 512 (33.8) | 465 (27.2) | 425 (24.7) | 510 (29.9) |
Data are shown for non-imputed data and are either presented as frequency (%) or mean (standard deviation). APOE, Apolipoprotein; CES-D, Center for Epidemiologic Studies Depression Scale; MET h, Metabolic Equivalent of Task hours; PM, particulate matter; NO, nitrogen oxide; n, number of participants.
Fig. 1
Descriptive and distributional information of residential air pollutant levels. NO, nitrogen oxide; PM, particulate matter.
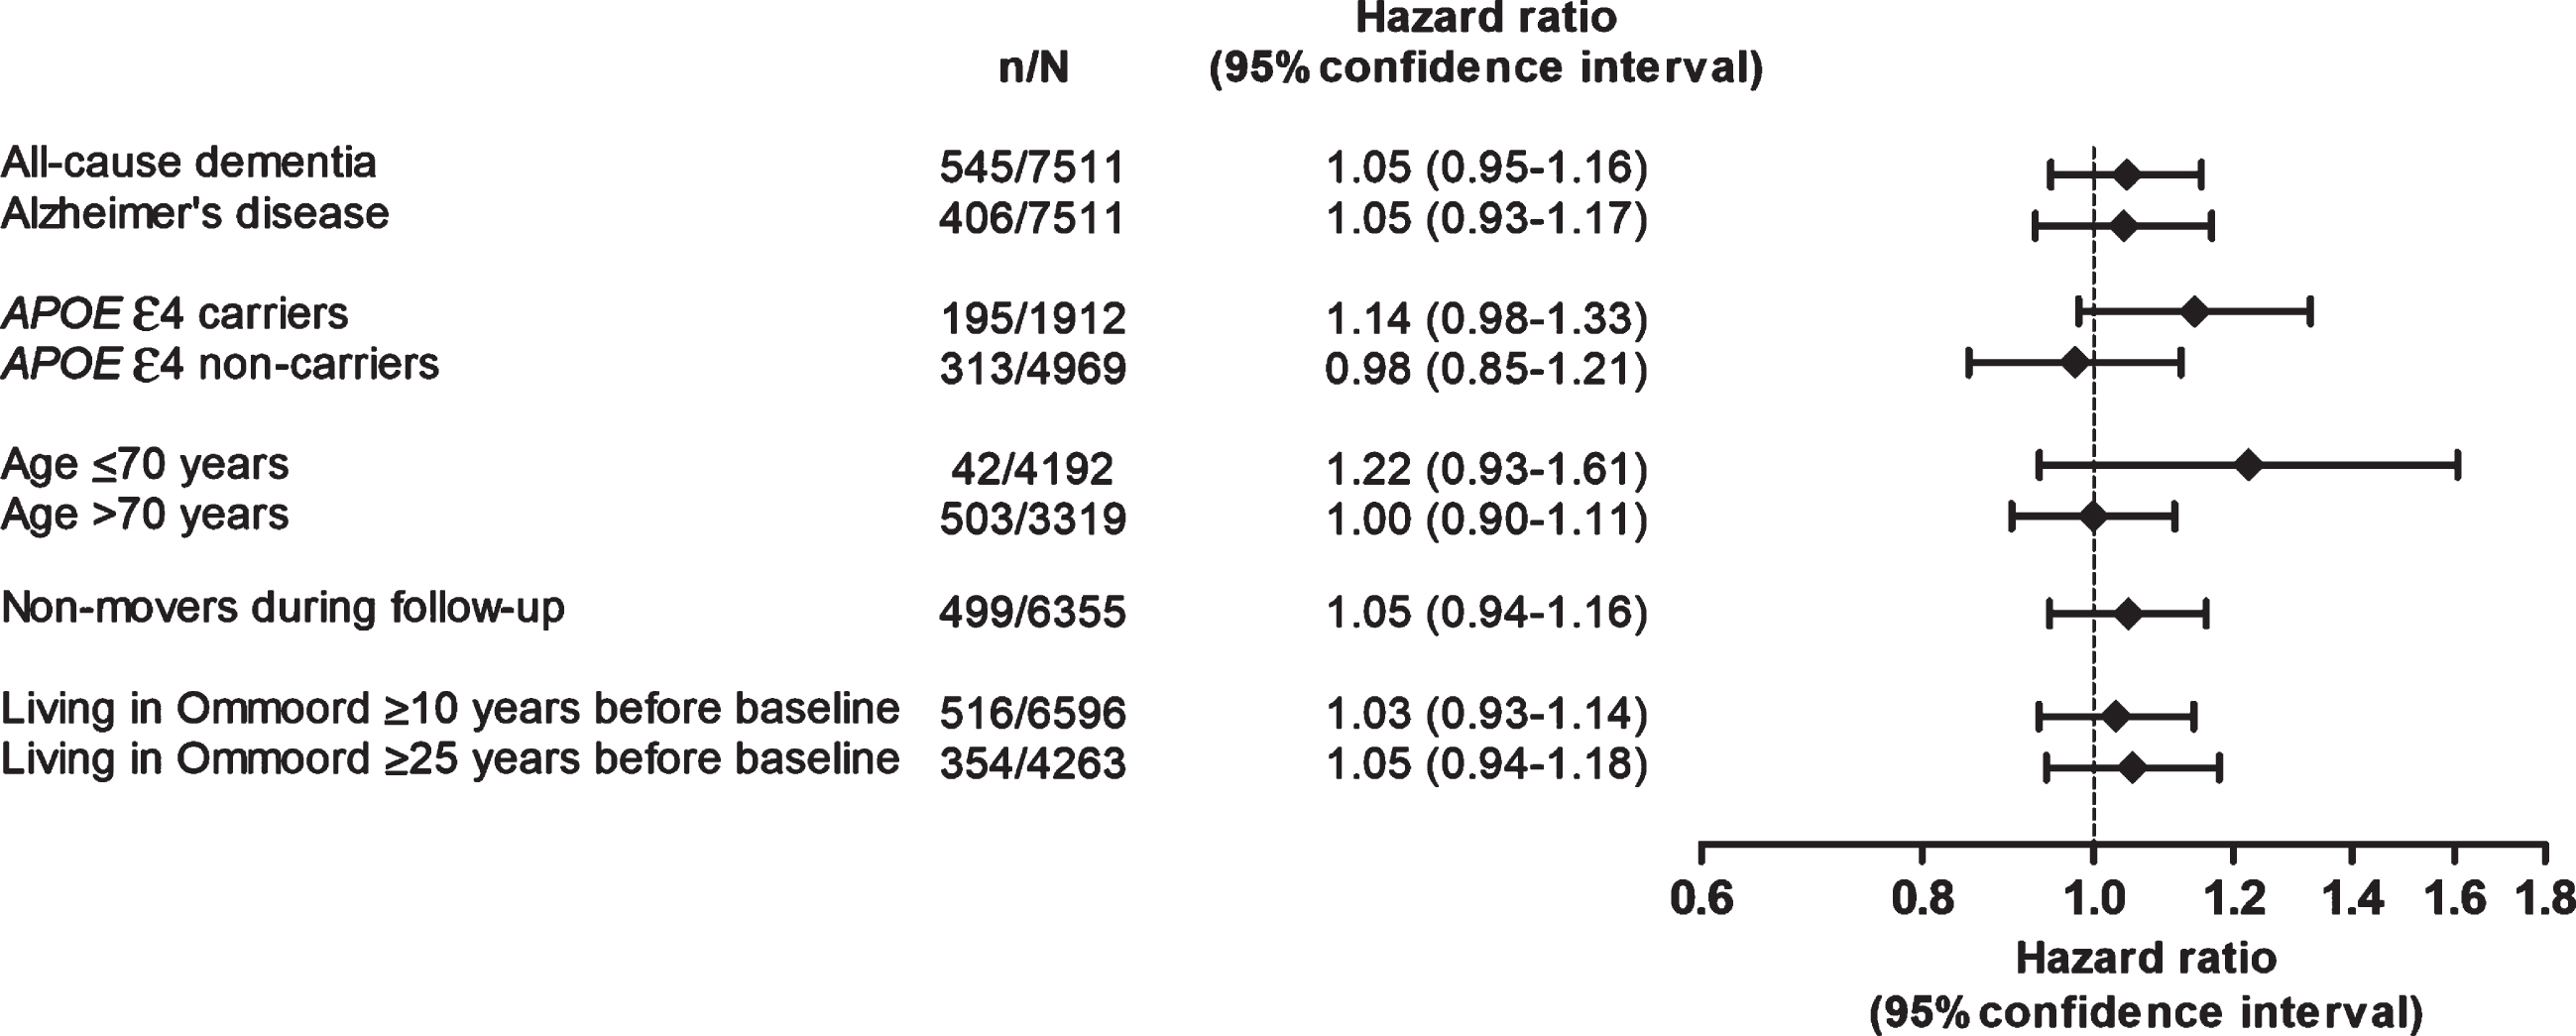
During a median follow-up of 7 years, 545 out of 7,511 participants developed dementia (incidence rate 11 per 1,000 person-years). The general marker of all air pollutants was not associated with the risk of dementia (hazard ratio (HR) [95% confidence interval (CI)] per standard deviation increase: 1.04 [0.95–1.15]), neither was exposure to PM10, PM2.5, PM2.5 absorbance, NOx, and NO2 (Table 2). However, when categorizing PM2.5 into quartiles, an increased risk of dementia was observed for participants in the second quartile (HR [95% CI]: 1.32 [1.02–1.70]) and last quartile (HR [95% CI]: 1.29 [0.97–1.71]), but not in the third quartile (HR [95% CI]: 1.13 [0.87–1.46]), compared to those in the first quartile (Fig. 2). No clear linear or non-linear association was observed when categorizing the general marker of all air pollutants or the other individual air pollutants into quartiles. Associations of exposure to the general marker of all air pollutants with the risk of dementia were similar for Alzheimer’s disease (Fig. 3). However, risk estimates were slightly higher in APOE ɛ4 carriers compared to non-carriers, and in participants below compared to those above the age of 70 years. Moreover, risk estimates were similar after excluding participants who changed residential address during follow-up, and after subsequently excluding participants who were Ommoord residence for less than 10 and 25 years before baseline. When repeating these subgroup and sensitivity analyses considering individual air pollution concentrations as exposure, similar associations were observed as for the general marker of all air pollutants (Supplementary Figure 2). Survival curves showed that participants in the highest quartile of the general marker of all air pollutants and each individual air pollutant had a lower survival rate compared to participants in the other quartiles (Supplementary Figure 3).
Table 2
Exposure to air pollution in association with the risk of dementia
| Dementia | ||
| n/N = 545/7511 | ||
| Hazard ratio (95% confidence interval) | ||
| Model I | Model II | |
| General marker of air pollution | 1.05 (0.96–1.16) | 1.05 (0.95–1.16) |
| Individual air pollutants: | ||
| PM10 | 1.05 (0.95–1.15) | 1.05 (0.95–1.16) |
| PM2.5 | 1.02 (0.93–1.11) | 1.01 (0.93–1.11) |
| PM2.5 absorbance | 1.05 (0.96–1.15) | 1.04 (0.95–1.15) |
| NOx | 1.06 (0.96–1.17) | 1.05 (0.95–1.17) |
| NO2 | 1.05 (0.96–1.16) | 1.05 (0.95–1.16) |
Effect estimates are shown per standard deviation increase (1.02 for PM10, 0.4 for PM2.5, 0.145 for PM2.5 absorbance, 12.18 for NOx, and 3.38 for NO2). Model I is adjusted for age and sex. Model II is further adjusted for smoking status, monthly household income, alcohol intake, physical activity, hours from home, body mass index, and depressive symptoms. Abbreviations: n, number of participants with incident dementia; N, total number of participants; NO, nitrogen oxide PM, particulate matter.
Fig. 2
Exposure to air pollution per quartile in association with the risk of dementia. Models are adjusted for age, sex, level of education, smoking status, monthly household income, alcohol intake, physical activity, hours from home, body mass index, and depressive symptoms. NO, nitrogen oxide; PM, particulate matter.
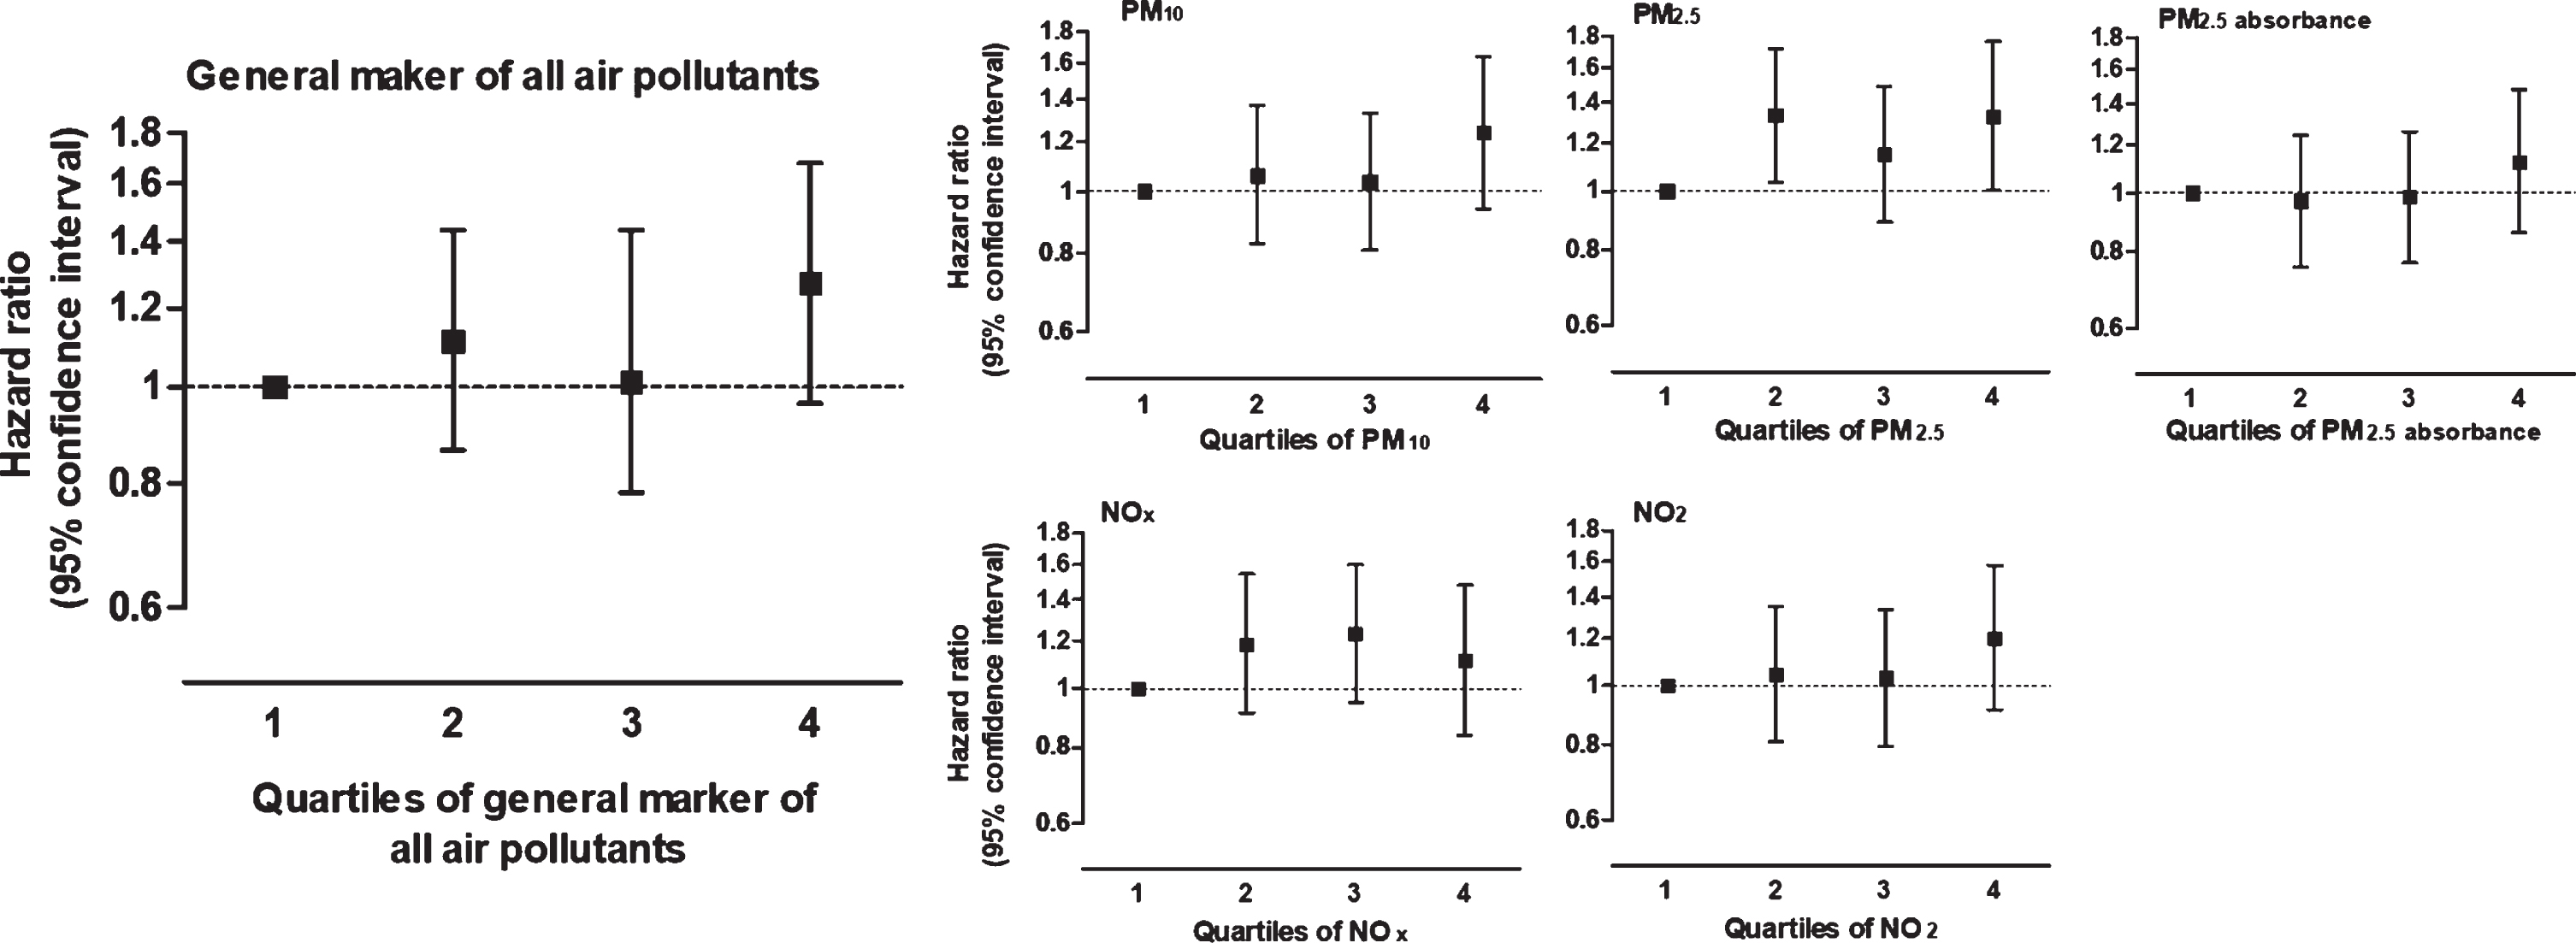
Fig. 3
Subgroup and sensitivity analyses for the association between air pollutants and the risk of dementia. Effect estimates are shown per standard deviation increase and adjusted for age, sex, level of education, smoking status, monthly household income, alcohol intake, physical activity, hours from home, body mass index, and depressive symptoms. n, number of participants with incident dementia; N, total number of participants; APOE, Apolipoprotein E; NO, nitrogen oxide; PM, particulate matter.
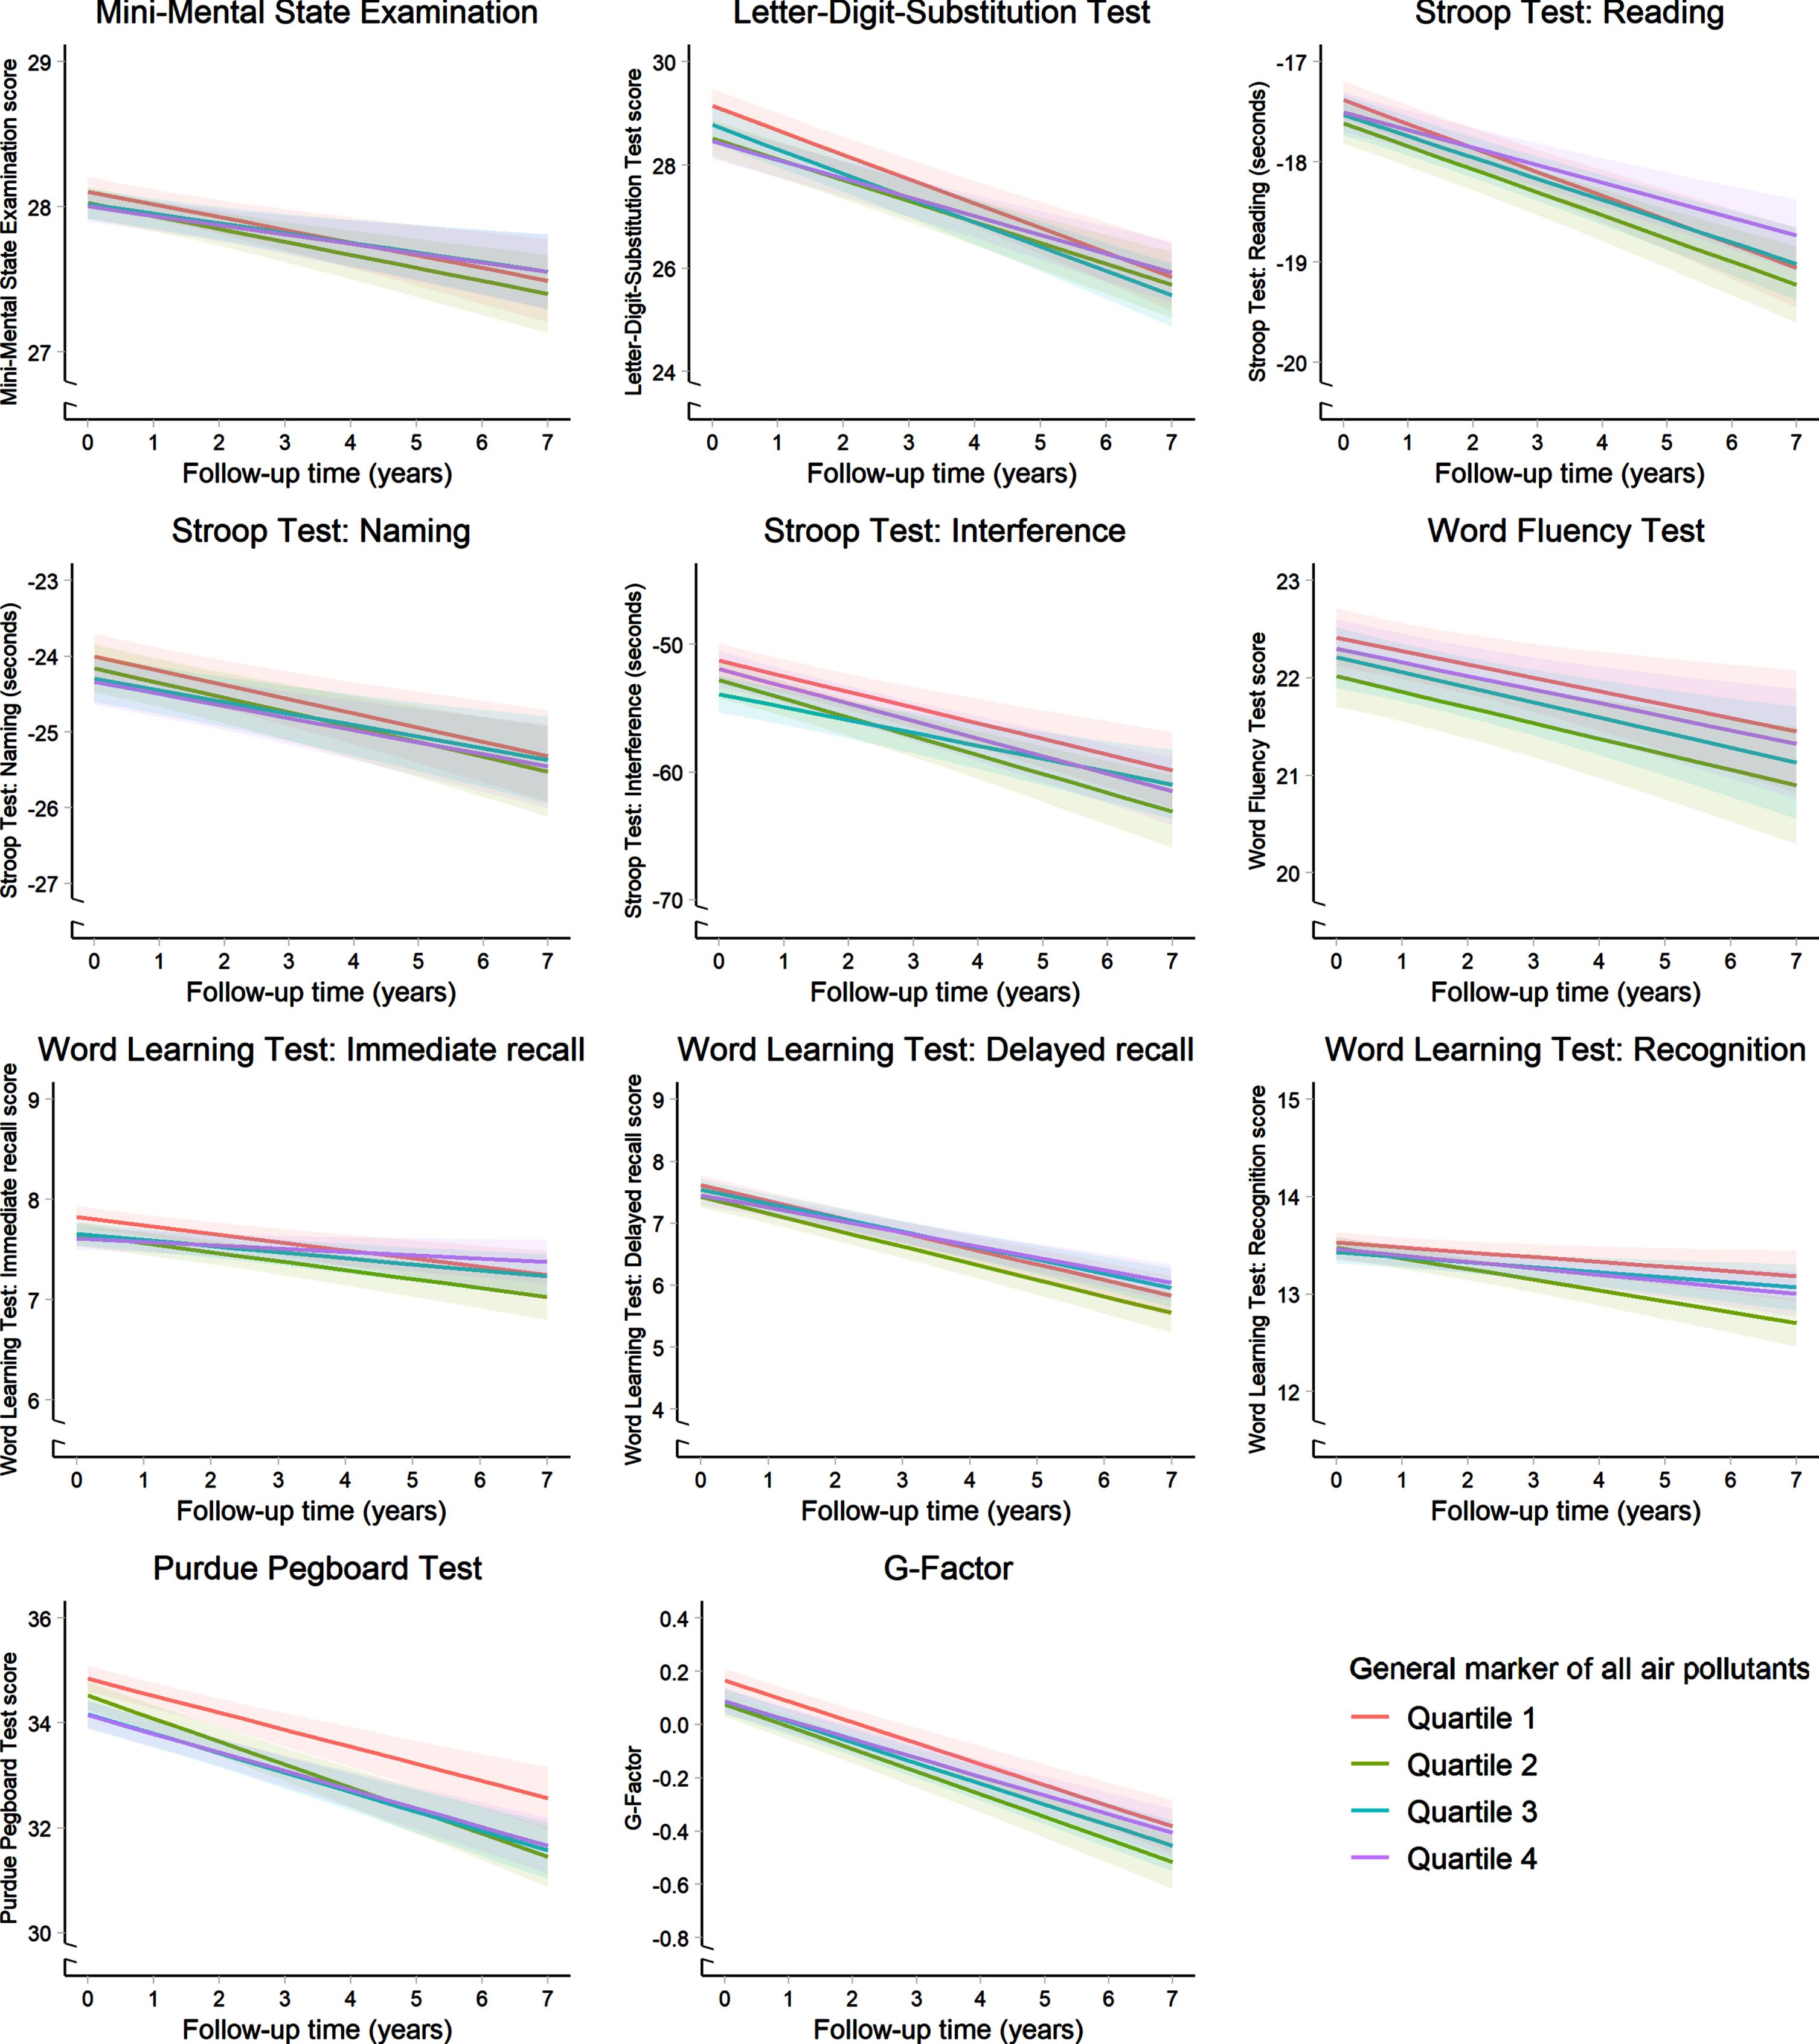
No major difference in characteristics between the total sample and the sample with cognitive performance data was observed (Supplementary Table 3), but those with cognitive reexamination data were considerably older (mean age 74.1 years) compared to those with any data on cognitive performance (mean age 67.8 years). Trajectories of cognitive test performance scores over time did not differ per quartile of the general marker of all air pollutants (Fig. 4), nor per quartile of PM10, PM2.5, PM2.5 absorbance, NOx, and NO2 levels (data not shown). Main effect and slope differences for continues air pollutant levels are presented in Supplementary Tables 4 and 5. Trajectories of cognitive test performance scores with advancing age did also not differ per quartile of the general marker of all air pollutants (Supplementary Figure 4).
Fig. 4
Cognitive performance trajectories over time per quartile of the general marker of all air pollutants. Models are adjusted for age, sex, level of education, smoking status, monthly household income, alcohol intake, physical activity, hours from home, body mass index, and depressive symptoms. Stroop scores are inversely transformed, meaning that higher scores for all cognitive tests indicate better cognitive performance.
DISCUSSION
In this large population-based study of middle-aged and elderly individuals from a well-defined suburb of approximately 4.5 km2, we found that exposure to air pollution expressed as a general marker was not associated with the risk of dementia or cognitive decline. Also, exposure levels of individual air pollutants, namely PM10, PM2.5, PM2.5 absorbance, NOx, and NO2, were not associated with either dementia or cognitive decline.
Previous population-based cohort studies determined the link between PM2.5 and the risk of dementia and found almost consistently that exposure to higher levels of PM2.5 was associated with an increased dementia risk [18–23]. Moreover, a study on the association of PM2.5 absorbance and NO2 with the risk of dementia did not observe a link [19], while three other studies found that exposure to higher levels of NO2 was associated with an increased risk of dementia [21, 23, 24]. Although we found in contrast to most of these previous studies no clear evidence for an association between air pollution and dementia, all observed effect estimates were in the hypothesized direction. That the effect estimates were small and not statistically significant may be explained by the fact that our study was conducted within a relatively small study area (4.5 km2) in which variability in pollutant levels may have been too limited to identify meaningful associations. Moreover, pollutant levels were determined at participants residential addresses using LUR models, which had an explained variance ranging from 67–95% throughout the Netherlands. Yet, performance of the LUR models within Ommoord specifically was not determined, while Ommoord only covers a small area in the Netherlands. Explained variances may therefore not directly translate. Furthermore, while we attempt to minimize exposure misclassification by correcting for the mobility of the participants, total mobility is presumably not fully covered. Consequently, exposure misclassification persists and may have diluted our effect estimates towards the null. This dilution may have been strengthened by the fact that exposure throughout lifetime could not be taken into account and by the relatively short follow-up period. In addition, although no clear disturbing pattern in general characteristics was observed across the different exposure levels, characteristics were also not uniformly distributed. Hence, confounding may has contributed to the dilution of the risk estimates.
Apart from methodological issues, non-linearity could be an alternative explanation for our null findings, because non-linear inverse associations between air pollution and dementia were observed in two prior studies that used similar methods as the current study [21, 24]. Also the variability in air pollutant concentrations was similar, but background levels in the present study were up to 3 times higher. Specifically, the first study was conducted among 2,927 participants residing in Stockholm. For every 0.88μg/m3 in PM2.5 increase a 54% increased risk of dementia was observed and for every 8.35μg/m3 increase in NOx a 14% increased dementia risk [21]. Yet, these associations were fully driven by PM2.5 levels below circa 8.5μg/m3 and NOx levels below circa 25μg/m3. The second study was conducted among 1,806 participants residing in North Sweden. NOx was not significantly associated with the risk of dementia when considering NOx as a continuous variable, but compared to participants in the first quartile (4.8–9μg/m3), those in the third quartile (17–26μg/m3) were at a 48% higher risk and those in the fourth quartile (>26μg/m3) at a 43% higher risk of dementia [24]. In the present study, such non-linear associations were not clearly visible, suggesting that air pollutant concentrations in the exposure range of this study are not differentially harmful for brain health. To further unravel the shape of the association, we encourage future studies to focus on larger study areas with more variation in air pollutant concentrations.
Competing risk could also explain in part our null findings, as exposure to air pollution has been linked to increased risks of several adverse health outcomes, including cardiovascular disease [7, 25] and poor lung function [26, 27], which subsequently leads to a higher risk of mortality [7, 25]. Indeed, we found that participants in the highest exposure quartiles of the pollutant concentrations had a lower survival rate compared to participants in the lower quartiles, suggesting that mortality precludes dementia onset.
Other factors should be considered that may explain our null findings, which are in contrast to most previous studies. For instance, particulate matter originate from more than hundred different sources, including traffic, industry, and agriculture [28]. Variation in air pollutant levels in our study originates mainly from traffic. Our null findings might indicate that traffic related air pollution is less harmful for the brain than particles from other sources. Also, some of the discrepancies between studies may be explained by differences in methods to determine dementia or air pollution, follow-up periods and population characteristics.
Several mechanisms through which air pollution potentially affect brain health have been proposed. PM2.5 may enters the brain directly through the olfactory system after inhalation [4] or through the circulatory system after crossing the blood-brain barrier [29], where it may induce oxidative stress and inflammatory responses such as microglial activation [5, 30]. Moreover, inhalation of air pollutants in the form of both particulate matter and nitrogen oxide via de lungs could cause systematic inflammation and oxidative stress, as well as cardiovascular abnormalities which may indirectly affect the brain [5–7].
Strengths and limitations
Strengths of this study include the large sample size, the extensive estimation approach that has been used to diagnose dementia and the availability of important confounders. Moreover, air pollutant levels were determined between 2009 and 2010, but the study area is fairly stable with little environmental changes over the last two decades. Modeled air pollutant levels can therefore be considered as long-term annual air pollutant levels. Nevertheless, few limitations of our study also need to be addressed. First, no information was available about small environmental changes in the study area that may have affected air pollutant levels. Second, given that air pollutant levels were highly correlated with each other, effects of individual air pollutants should be interpreted with caution. Third, we only examined ambient air pollution, while indoor air pollution from burning of biomass, as well as noise and green space may interact.
Conclusion
In conclusion, in the current study we found no clear evidence for an association between exposure to air pollution and the risk of dementia or cognitive decline.
ACKNOWLEDGMENTS
We gratefully acknowledge the study participants of the Ommoord district and their general practitioners and pharmacists for their devotion in contributing to the Rotterdam Study. We also thank all staff who facilitated assessment of participants in the Rotterdam Study throughout the years.
This study was supported by the ADAIR project (grant #JPND2019-466-037). This is an EU Joint Programme - Neurodegenerative Disease Research (JPND) project. The project is supported through the following funding organizations under the aegis of JPND - www.jpnd.eu (Ministry of Education, Youth and Sports, Czech Republic; Academy of Finland, Finland; National Research, Development and Innovation Office, Hungary; Ministry of Education, Universities and Research, Italy; ZonMW – The Netherlands Organisation for Health Research and Development, The Netherlands; Swedish Research Council, Sweden). This study was performed as part of the Netherlands Consortium of Dementia Cohorts (NCDC), which receives funding in the context of Deltaplan Dementie from ZonMW Memorabel (projectnr 73305095005) and Alzheimer Nederland. Further funding was also obtained from the Stichting Erasmus Trustfonds, grant number 97030.2021.101.430/057/RB. This study was also partly funded through the Netherlands Organisation for Health Research and Development (ZonMW) grant number 733051107.
The Rotterdam Study is supported by Erasmus Medical Centre and Erasmus University, Rotterdam, Netherlands Organization for the Health Research and Development (ZonMw), the Research Institute for Diseases in the Elderly (RIDE), the Ministry of Education, Culture and Science, the Ministry for Health, Welfare and Sports, the European Commission (DG XII), and the Municipality of Rotterdam.
The funding sources had no role in the design and conduct of the study; collection, management, analysis, and interpretation of the data; preparation, review, or approval of the manuscript; and decision to submit the manuscript for publication.
Authors’ disclosures available online (https://www.j-alz.com/manuscript-disclosures/22-0804r1).
SUPPLEMENTARY MATERIAL
[1] The supplementary material is available in the electronic version of this article: https://dx.doi.org/10.3233/JAD-220804.
REFERENCES
[1] | World Health Organization ((2019) ) Risk reduction of cognitive decline and dementia: WHO guidelines. |
[2] | Weuve J , Bennett EE , Ranker L , Gianattasio KZ , Pedde M , Adar SD , Yanosky JD , Power MC ((2021) ) Exposure to air pollution in relation to risk of dementia and related outcomes: An updated systematic review of the epidemiological literature. Environ Health Perspect 129: , 96001. |
[3] | Peters R , Ee N , Peters J , Booth A , Mudway I , Anstey KJ ((2019) ) Air pollution and dementia: A systematic review. J Alzheimers Dis 70: , S145–S163. |
[4] | Maher BA , Ahmed IA , Karloukovski V , MacLaren DA , Foulds PG , Allsop D , Mann DM , Torres-Jardon R , Calderon-Garciduenas L ((2016) ) Magnetite pollution nanoparticles in the human brain. Proc Natl Acad Sci U S A 113: , 10797–10801. |
[5] | Thiankhaw K , Chattipakorn N , Chattipakorn SC ((2022) ) PM2.5 exposure in association with AD-related neuropathology and cognitive outcomes. Environ Pollut 292: , 118320. |
[6] | Pope CA , Bhatnagar A , McCracken JP , Abplanalp W , Conklin DJ , O’Toole T ((2016) ) Exposure to fine particulate air pollution is associated with endothelial injury and systemic inflammation. Circ Res 119: , 1204–1214. |
[7] | Pranata R , Vania R , Tondas AE , Setianto B , Santoso A ((2020) ) A time-to-event analysis on air pollutants with the risk of cardiovascular disease and mortality: A systematic review and meta-analysis of 84 cohort studies. J Evid Based Med 13: , 102–115. |
[8] | Tsai TL , Lin YT , Hwang BF , Nakayama SF , Tsai CH , Sun XL , Ma CC , Jung CR ((2019) ) Fine particulate matter is a potential determinant of Alzheimer’s disease: A systemic review and meta-analysis. Environ Res 177: , 108638. |
[9] | Mazzali C , Duca P ((2015) ) Use of administrative data in healthcare research. Intern Emerg Med 10: , 517–524. |
[10] | Lang L , Clifford A , Wei L , Zhang D , Leung D , Augustine G , Danat IM , Zhou W , Copeland JR , Anstey KJ , Chen R ((2017) ) Prevalence and determinants of undetected dementia in the community: A systematic literature review and a meta-analysis. BMJ Open 7: , e011146. |
[11] | Gianattasio KZ , Prather C , Glymour MM , Ciarleglio A , Power MC ((2019) ) Racial disparities and temporal trends in dementia misdiagnosis risk in the United States. Alzheimers Dement (N Y) 5: , 891–898. |
[12] | Hajat A , Hsia C , O’Neill MS ((2015) ) Socioeconomic disparities and air pollution exposure: A global review. Curr Environ Health Rep 2: , 440–450. |
[13] | Ikram MA , Brusselle G , Ghanbari M , Goedegebure A , Ikram MK , Kavousi M , Kieboom BCT , Klaver CCW , de Knegt RJ , Luik AI , Nijsten TEC , Peeters RP , van Rooij FJA , Stricker BH , Uitterlinden AG , Vernooij MW , Voortman T ((2020) ) Objectives, design and main findings until 2020 from the Rotterdam Study. Eur J Epidemiol 35: , 483–517. |
[14] | Eeftens M , Beelen R , de Hoogh K , Bellander T , Cesaroni G , Cirach M , Declercq C , Dedele A , Dons E , de Nazelle A , Dimakopoulou K , Eriksen K , Falq G , Fischer P , Galassi C , Grazuleviciene R , Heinrich J , Hoffmann B , Jerrett M , Keidel D , Korek M , Lanki T , Lindley S , Madsen C , Molter A , Nador G , Nieuwenhuijsen M , Nonnemacher M , Pedeli X , Raaschou-Nielsen O , Patelarou E , Quass U , Ranzi A , Schindler C , Stempfelet M , Stephanou E , Sugiri D , Tsai MY , Yli-Tuomi T , Varro MJ , Vienneau D , Klot S , Wolf K , Brunekreef B , Hoek G ((2012) ) Development of land use regression models for PM(2.5), PM(2.5) absorbance, PM(10) and PM(coarse) in 20 European study areas; results of the ESCAPE project. Environ Sci Technol 46: , 11195–11205. |
[15] | Beelen R , Hoek G , Vienneau D , Eeftens M , Dimakopoulou K , Pedeli X , Tsai MY , Kunzli N , Schikowski T , Marcon A , Eriksen KT , Raaschou-Nielsen O , Stephanou E , Patelarou E , Lanki T , Yli-Tuomi T , Declercq C , Falq G , Stempfelet M , Birk M , Cyrys J , von Klot S , Nador G , Varro MJ , Dedele A , Grazuleviciene R , Molter A , Lindley S , Madsen C , Cesaroni G , Ranzi A , Badaloni C , Hoffmann B , Nonnemacher M , Kraemer U , Kuhlbusch T , Cirach M , de Nazelle A , Nieuwenhuijsen M , Bellander T , Korek M , Olsson D , Stromgren M , Dons E , Jerrett M , Fischer P , Wang M , Brunekreef B , de Hoogh K ((2013) ) Development of NO2 and NOx land use regression models for estimating air pollution exposure in 36 study areas in Europe - The ESCAPE project. Atmos Environ 72: , 10–23. |
[16] | de Bruijn RF , Bos MJ , Portegies ML , Hofman A , Franco OH , Koudstaal PJ , Ikram MA ((2015) ) The potential for prevention of dementia across two decades: The prospective, population-based Rotterdam Study. BMC Med 13: , 132. |
[17] | van der Willik KD , Licher S , Vinke EJ , Knol MJ , Darweesh SKL , van der Geest JN , Schagen SB , Ikram MK , Luik AI , Ikram MA ((2021) ) Trajectories of cognitive and motor function between ages 45 and 90 years: A population-based study. J Gerontol A Biol Sci Med Sci 76: , 297–306. |
[18] | Shaffer RM , Blanco MN , Li G , Adar SD , Carone M , Szpiro AA , Kaufman JD , Larson TV , Larson EB , Crane PK , Sheppard L ((2021) ) Fine particulate matter and dementia incidence in the adult changes in thought study. Environ Health Perspect 129: , 87001. |
[19] | Mortamais M , Gutierrez LA , de Hoogh K , Chen J , Vienneau D , Carriere I , Letellier N , Helmer C , Gabelle A , Mura T , Sunyer J , Benmarhnia T , Jacquemin B , Berr C ((2021) ) Long-term exposure to ambient air pollution and risk of dementia: Results of the prospective Three-City Study. Environ Int 148: , 106376. |
[20] | Cacciottolo M , Wang X , Driscoll I , Woodward N , Saffari A , Reyes J , Serre ML , Vizuete W , Sioutas C , Morgan TE , Gatz M , Chui HC , Shumaker SA , Resnick SM , Espeland MA , Finch CE , Chen JC ((2017) ) Particulate air pollutants, APOE alleles and their contributions to cognitive impairment in older women and to amyloidogenesis in experimental models. Transl Psychiatry 7: , e1022. |
[21] | Grande G , Ljungman PLS , Eneroth K , Bellander T , Rizzuto D ((2020) ) Association between cardiovascular disease and long-term exposure to air pollution with the risk of dementia. JAMA Neurol 77: , 801–809. |
[22] | Oudin A , Segersson D , Adolfsson R , Forsberg B ((2018) ) Association between air pollution from residential wood burning and dementia incidence in a longitudinal study in Northern Sweden. PLoS One 13: , e0198283. |
[23] | Parra KL , Alexander GE , Raichlen DA , Klimentidis YC , Furlong MA ((2022) ) Exposure to air pollution and risk of incident dementia in the UK Biobank. Environ Res 209: , 112895. |
[24] | Oudin A , Forsberg B , Adolfsson AN , Lind N , Modig L , Nordin M , Nordin S , Adolfsson R , Nilsson LG ((2016) ) Traffic-related air pollution and dementia incidence in Northern Sweden: A longitudinal study. Environ Health Perspect 124: , 306–312. |
[25] | Shah ASV , Langrish JP , Nair H , McAllister DA , Hunter AL , Donaldson K , Newby DE , Mills NL ((2013) ) Global association of air pollution and heart failure: A systematic review and meta-analysis. Lancet 382: , 1039–1048. |
[26] | Li JH , Sun SZ , Tang R , Qiu H , Huang QY , Mason TG , Tian LW ((2016) ) Major air pollutants and risk of COPD exacerbations: A systematic review and meta-analysis. Int J Chron Obstruct Pulmon Dis 11: , 3079–3091. |
[27] | Hamra GB , Laden F , Cohen AJ , Raaschou-Nielsen O , Brauer M , Loomis D ((2015) ) Lung cancer and exposure to nitrogen dioxide and traffic: A systematic review and meta-analysis. Environ Health Perspect 123: , 1107–1112. |
[28] | Mukherjee A , Agrawal M ((2017) ) World air particulate matter: Sources, distribution and health effects. Environ Chem Lett 15: , 283–309. |
[29] | Oberdorster G , Sharp Z , Atudorei V , Elder A , Gelein R , Kreyling W , Cox C ((2004) ) Translocation of inhaled ultrafine particles to the brain. Inhal Toxicol 16: , 437–445. |
[30] | Ehsanifar M , Tameh AA , Farzadkia M , Kalantari RR , Zavareh MS , Nikzaad H , Jafari AJ ((2019) ) Exposure to nanoscale diesel exhaust particles: Oxidative stress, neuroinflammation, anxiety and depression on adult male mice. Ecotoxicol Environ Saf 168: , 338–347. |


