
Neuroprotective Effect of Phloretin in Rotenone-Induced Mice Model of Parkinson’s Disease: Modulating mTOR-NRF2-p62 Mediated Autophagy-Oxidative Stress Crosstalk
Abstract
Background:
Parkinson’s disease (PD) is an age-related progressive multifactorial, neurodegenerative disease. The autophagy and Keap1-Nrf2 axis system are both implicated in the oxidative-stress response, metabolic stress, and innate immunity, and their dysregulation is associated with pathogenic processes in PD. Phloretin (PLT) is a phenolic compound reported possessing anti-inflammatory and antioxidant activities.
Objective:
To evaluate the neuroprotective potential of PLT in PD via modulating the autophagy-antioxidant axis
Methods:
The neuroprotective effect of PLT was evaluated in vitro using rotenone (ROT) exposed SH-SY5Y cell line and in vivo using ROT administered C57BL/6 mice. Mice were administered with PLT (50 and 100 mg/kg, p.o.) concomitantly with ROT (1 mg/kg, i.p) for 3 weeks. Locomotive activity and anxiety behaviors were assessed using rotarod and open field tests respectively. Further apoptosis (Cytochrome-C, Bax), α-Synuclein (α-SYN), tyrosine hydroxylase (TH), antioxidant proteins (nuclear factor erythroid 2-related factor 2 (NRF2), heme oxygenase-1 (HO-1) and autophagic (mTOR, Atg5,7, p62, Beclin,LC3B-I/II) protein activity were evaluated both in in vitro and in vivo.
Results:
PLT improved locomotive activity and anxiety-like behavior in mice. Further PLT diminished apoptotic cell death, α-SYN expression and improved the expression of TH, antioxidant, and autophagic regulating protein.
Conclusion:
Taken together, present data deciphers that the PLT effectively improves motor and non-motor symptoms via modulating the mTOR/NRF2/p62 pathway-mediated feedback loop. Hence, PLT could emerge as a prospective disease-modifying drug for PD management.
INTRODUCTION
With the increasing prevalence rate, Parkinson’s disease (PD) has been globally recognized as the second most common neurodegenerative disease (ND) after Alzheimer’s disease (AD) [1]. PD is clinically characterized by motor features (rigidity, slowness, and tremor), and non-motor features (hyposmia, rapid eye movement, sleep behavior disorder, dementia, constipation, anxiety, and depression) [2]. The histopathological hallmark of PD is the loss of dopaminergic neurons in the substantia nigra (SN) pars compacta (SNpc) and accumulation of misfolded α-Synuclein (α-SYN, which is found in intra-cytoplasmic inclusions called Lewy bodies) [3, 4]. The gold standard treatment option for PD remains Levodopa (L-Dopa), an amino acid precursor of dopamine that is based on the replacement of dopamine and provides symptomatic relief [5]. However, long-term usage of this therapy leads to the worsening of the patient’s conditions with a decrease in its efficacy [6]. Additionally modified delivery approaches are also being utilized to optimize the PD [7]. Various alternative and complementary base therapies have been proposed for PD in addition to pharmacological and non-pharmacological interventions including Ayurveda, yoga, aromatherapy, and music therapy which can alleviate patient symptoms [8]. Natural polyphenols have been implicated in the treatment of PD as they inhibit neurodegeneration and the progression of PD owing to their anti-inflammatory, antioxidant, and metal-chelating properties [9]. In addition, they also have an influence on cell survival and cell cycle genes as well as numerous signaling pathways including signal-regulated kinase, phosphoinositide 3-kinase/Akt, mitogen-activated protein kinase, serine/threonine protein kinase, protein kinase C, or inhibit NF-κB pathways involved in NDs like PD [10]. Autophagy, inflammation, and antioxidant dysfunctions play a key role in NDs especially in AD and PD [11]. Cells adjust to challenging circumstances by activating a variety of sophisticated stress-response mechanisms in response to emergencies including oxidative damage, metabolic stress, and other neurotoxins. The other stress response crosstalk with autophagy response. Eventually, the most common response is autophagic loss, one of the pathomechanism reported in almost all NDs.
Among all the existing neurotoxin-based animal models of PD, the rotenone (ROT)-induced PD model has garnered the most interest in recent years due to its ability to pass the blood-brain barrier and induce α-SYN production and misfolding [12]. Additionally, it inhibits mitochondrial complex I and damages dopaminergic neurons, resulting in a disease resembling PD. In addition, the ROT model is highly reproducible and may be a good research tool for evaluating novel neuroprotective treatments [4].
Phloretin (PLT), a natural phenolic versatile molecule, member of the class of dihydrochalcones, which is found in fruits like apricot and apple. It possesses a wide variety of pharmacological properties for instance anticancer, antioxidative, anti-inflammatory, antifungal, antiviral, anti-microbial, anti-allergic, anti-thrombotic, hepatoprotective, and estrogenic activities [13–15]. Besides being involved in the activation of apoptotic-associated gene expression and signal transduction in molecular pathways, it can increase the fluidity of biological membranes and penetration of administered drugs [16, 17]
The present study investigated the potential molecular pathways underlying the neuroprotective benefits of PLT against ROT-induced neurotoxicity in SH-SY5Y cells and C57BL/6 mice in terms of antioxidative, anti-apoptotic, and autophagic molecular signaling pathways.
MATERIALS AND METHODS
Materials
Most of the chemicals used are of reagent grade and were procured from Sigma Aldrich (St. Louis, MO, USA), Himedia laboratories, and SRL Chemicals. Antibodies were obtained from CST, ABCAM, Santacruz, and Invitrogen. Rotenone (Cat No-R0090) and Phloretin (Cat No -P1966) were procured from TCI Chemicals.
In vivo study
Animals
Animal experiments were conducted following the guidelines of the Committee for Control and Supervision of Experiments on Animals (CPCSEA) and the Institutional Animal Ethical Committee (IAEC)-NIPER-Hyderabad Telangana, India, and after getting approval of protocol no. No. NIP/05/2019/PC/335. Male C57BL/6 mice weighing 25–30 g were fed a regular diet with water ad libitum. After 7 days of acclimatization, mice were subjected to ROT and PLT drug treatments followed by behavioral and molecular study. All tests were carried out in line with national and municipal laws, as well as the international standard for the welfare of animals.
Experimental design
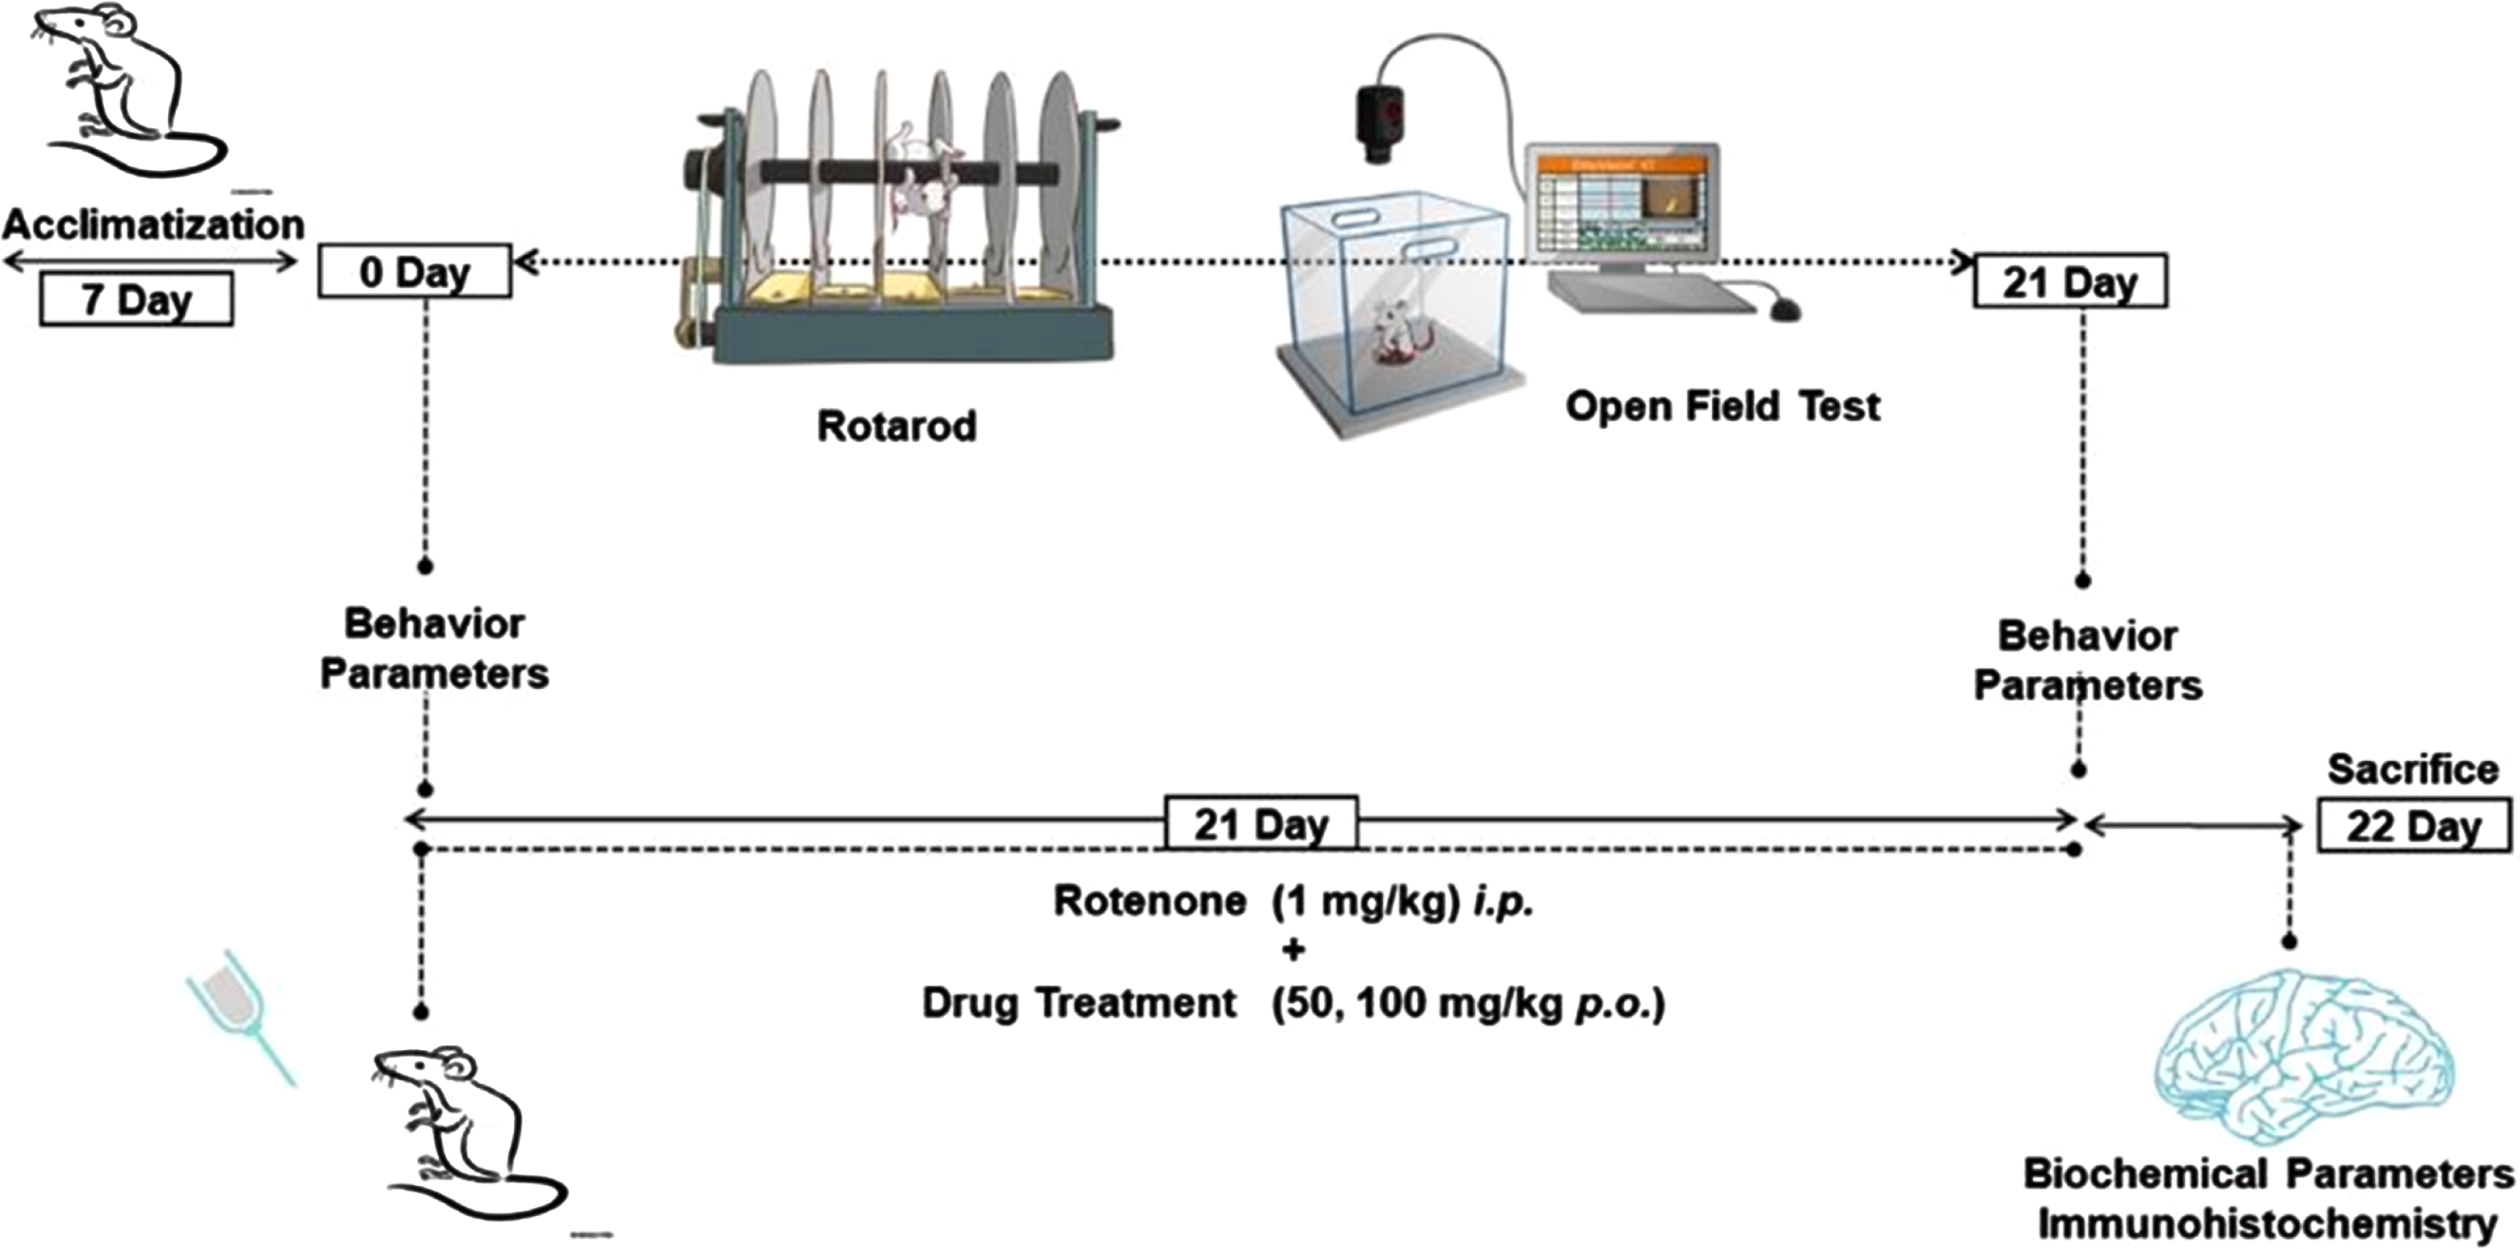
After 7 days of acclimatization, mice were divided into 5 groups (n = 10) randomly. Group I: Normal Control (NC), Group II: Vehicle Control (10% Carboxymethyl cellulose sodium (CMC-Na) p.o), Group III: ROT (1 mg/kg, i.p.), Group IV: PLT (50 mg/kg p.o.) + ROT, Group V: PLT (100 mg/kg p.o.) + ROT. On day 0, all the animals were subjected to behavioral assays such as rotarod and open field test (OFT) for baseline assessment. On day 1, animals of all the groups were administered with PLT (50 and 100 mg/kg, p.o.) concomitantly with ROT (1 mg/kg, i.p.) for 21 days except for the NC group of animals. Finally, behavioral parameters were performed on the 22nd day followed by the sacrifice, brains were excised, collected, and stored at –80°C for further molecular studies. For the immunofluorescence study, mice were perfused with PBS and 4% paraformaldehyde (PFA) perfused and the whole brains were excised, collected, and stored either in PFA (Fig. 1).
Fig. 1
Schematic presentation of animal study design.
Motor function tests
All behavior tests were carried out between 9:00 to 14:00 hours with habituation for at least 1 h before the beginning of the tests. The mice were pre-trained with a rotarod test three days before PLT administration on day 1. According to the methods reported in the previous studies [18], open-field tests and rotarod tests were used to evaluate behavioral performance. The residence time on the rotarod was recorded to detect muscle tension and balance in mice. During the OFT experiment, the events of rearing, grooming, total distance travelled, and the central zone entrance by mice within 5 min of the experiment was calculated from data obtained through ANY maze software (ANY-maze, version 6.1).
Immunofluorescence
Brain tissue sectioning was performed by cryostat (Leica CM 1950) and 20μM thick floating sections were collected. The sections were washed three times with 0.1% PBST (Triton X-100) and subjected to antigen retrieval by incubation with citrate buffer and heating at 95°C for 10 min. Later, sections were washed three times with 0.1% PBST then permeabilized in 0.25% of PBST for 1 h, and the section was rewashed with the same 0.1% PBST. Sections were blocked with 5% BSA in PBST followed by incubation with primary antibody anti-α Synuclein (Cat No.SC53955) and anti-HO (Cat No. SC516102) overnight at 4°C temperature. On the second day, sections were washed and incubated with secondary Alexa-fluor conjugated anti-mouse (A21202) and anti-Rabbit (A21245) for 2 h at room temperature. Thereafter, sections were washed in PBS and mounted with Fluoroshield DAPI, and the image was captured using a confocal microscope (TCS SP8, Leica, Germany) [19].
Immunoblotting
The middle brain from each experimental group was removed and homogenized in RIPA lysis buffer containing protease and phosphatase cocktail (Sigma Aldrich, Cat No. #P8340, Cat No. P-0044). The supernatant was collected, and protein quantification was performed by the BCA method. An equal amount (50μg) of protein was loaded and separated by SDS-PAGE before being blotted or transferred onto nitrocellulose membrane and blocked for 2 h in 3% bovine serum albumin (BSA) in TBST at room temperature. After that membrane was incubated with primary antibodies (Anti-Atg5, 12994P), Anti-Atg7(8558T), Anti-Beclin (3495S), LC3B (12741S), Anti-mTOR(2983P) Cell signalling technology, USA) (1:2000) Anti-p62 (SC25575), Anti-β-Actin (SC47778), anti-P-mTOR (SC293133), Anti-HO1, Anti-α-Synuclein (SC53955), and Anti NRF2(12721S) (Santa Cruz, USA) (1:1000), at 4°C for overnight. Following washing with TBST, membranes were incubated with horseradish peroxidase (HRP) conjugated anti-mouse (Cat No SC516102) and anti-Rabbit (Cat no SC2357) secondary antibodies (Santa Cruz, USA) (1:15000), and these primary-secondary antibodies complex chemiluminescence was observed by Fusion-FX chemiluminescence imager (Vilber Lourmat, Germany). Later, Image-J software was used to calculate the relative band densities [20].
In vitro study
Cell culture
Human neuroblastoma cells (SH-SY5Y) were Procured from NCCS (National Centre for Cell Sciences, Pune India. Cells were maintained in specific DMEM/F12 medium (Dulbecco’s Modified Eagle’s Medium/Ham’s Nutrient Mixture F12) media supplemented with 10% fetal bovine serum (FBS, Thermo) and 1% antibiotics solution (Gibco), and cells were incubated in a humid atmosphere at 37 °C and 5% CO2 incubator.
Cell viability assay
5000 cells/well were seeded in 96 well plates containing DMEM/F12 medium +10% FBS for 24 h. After 24 h cells were treated with different concentrations of PLT (100-1μM) and incubated for another 24 h. Media were removed and MTT reagent (5 mg/10 ml) was added and incubated for 4 h in the incubator, that media were removed. The formazan crystals were dissolved by the addition of 100μl of DMSO and absorbance was recorded at 570 nm in a multimode plate reader (Envision, Perkin Elmer).
Reactive oxygen species analysis
The intracellular reactive oxygen species (ROS) production in SH-SY5Y cells was assessed using the non-fluorescence probe H2DCF-DA (2′,7′-dichlorodihydrofluorescein diacetate, Sigma-Aldrich) that gives green fluorescence after reacting with ROS. DCFDA(2’,7’-dichlorodihydrofluorescein diacetate) staining as previously mentioned protocol with minor modification [21]. Cells were grown in a 6-well culture plate at the density of 5×10⁴/mL and subsequently exposed with 3.5 and 6μM PLT and 10μM ROT. After 6 h of treatment, cells were incubated with 10μM of DCFDA (Sigma-Aldrich) and incubated for 30 min at 37°C in a CO2 incubator. After incubation, cells were washed twice with PBS and examined under a fluorescent microscope (Nikon Eclipse Ti2, Germany) using filters with an excitation range of 480/30 at 200x magnification.
Analysis of mitochondrial potential (ΔΨM)
Mitochondrial potential in SHSY5Y cells was performed through JC-1 (5,5,6,6’-tetrachloro-1,1’,3,3’ tetraethylbenzimi-dazoylcarbocyanine iodide) staining as per the procedure described earlier with minor modification [22]. Generally, JC-1 dye exists in monomeric and dimeric forms. The dimeric form exhibit orange fluorescence that indicates the JC-1 aggregate (indicates negatively polarized mitochondria) while green fluorescence indicates the monomeric form that is depolarized mitochondria. Cells were grown in a 6-well culture plate at the density of 5×10⁴ cells/well followed by exposure to 3.5 and 6μM PLT and 10μM ROT. After 24 h of treatment, cells were incubated with 5μM of JC-1 dye and incubated for further 30 min at 37°C in a CO2 incubator. After incubation, cells were washed with cold PBS. The image was captured under a fluorescence microscope (Nikon Eclipse Ti2, Germany).
Cell death analysis
The effect of ROT and PLT treatment on cell death was quantified using the ratio of Acridine Orange (AO)/Ethidium Bromide (EtBr) dye fluorescence images. AO is taken up by both viable and nonviable cells and gives green and red fluorescence when it is intercalated in double-stranded DNA (dsDNA) and single-stranded RNA respectively. While EtBr is specifically taken up by nonviable cells and emits red fluorescence. The procedure for AO/EtBr was followed as described earlier [23]. Briefly, cells were grown in a 6-well culture plate and exposed with 10μM ROT and 3.5 and 6μM PLT followed by washing with 0.1 M PBS then incubated with the equal ratio of AO/EtBr (1:1). After 5 min of incubation, cells were washed with 0.1M PBS and images were captured using a fluorescence microscope (Nikon Eclipse Ti2, Germany).
Immunocytochemistry analysis
Briefly, SHSY-5Y cells were grown in a 6-well culture plate on the precoated coverslip and incubated at 37°C in a CO2 incubator. After 24 h of incubation, cells were exposed to 3.5 and 6μM PLT, and 10μM ROT for 24 h followed by thrice washing with cold PBS followed by fixing in 4% PFA for 10 min at room temperature. Later cells were permeabilized in 0.25% PBST for 45 min and subjected to the blocking 5% BSA for 2 h at room temperature. Thereafter, cells were incubated with primary antibodies such as Atg5 (1:100), Atg7 (1:100), α-Synuclein (1:100), and Beclin-1 (1:100) then incubated overnight at 4°C. After incubation, cells were incubated with secondary antibodies as Alexa conjugated anti-mouse (1:200) and anti-rabbit (1:200) for 2 h in dark at room temperature. Finally, coverslip with cells mounted with DAPI (Sigma) on pre-coated glass slides and images were captured by confocal microscope (TCS SP8, Leica, Germany) [24].
RESULTS
Behavior assay
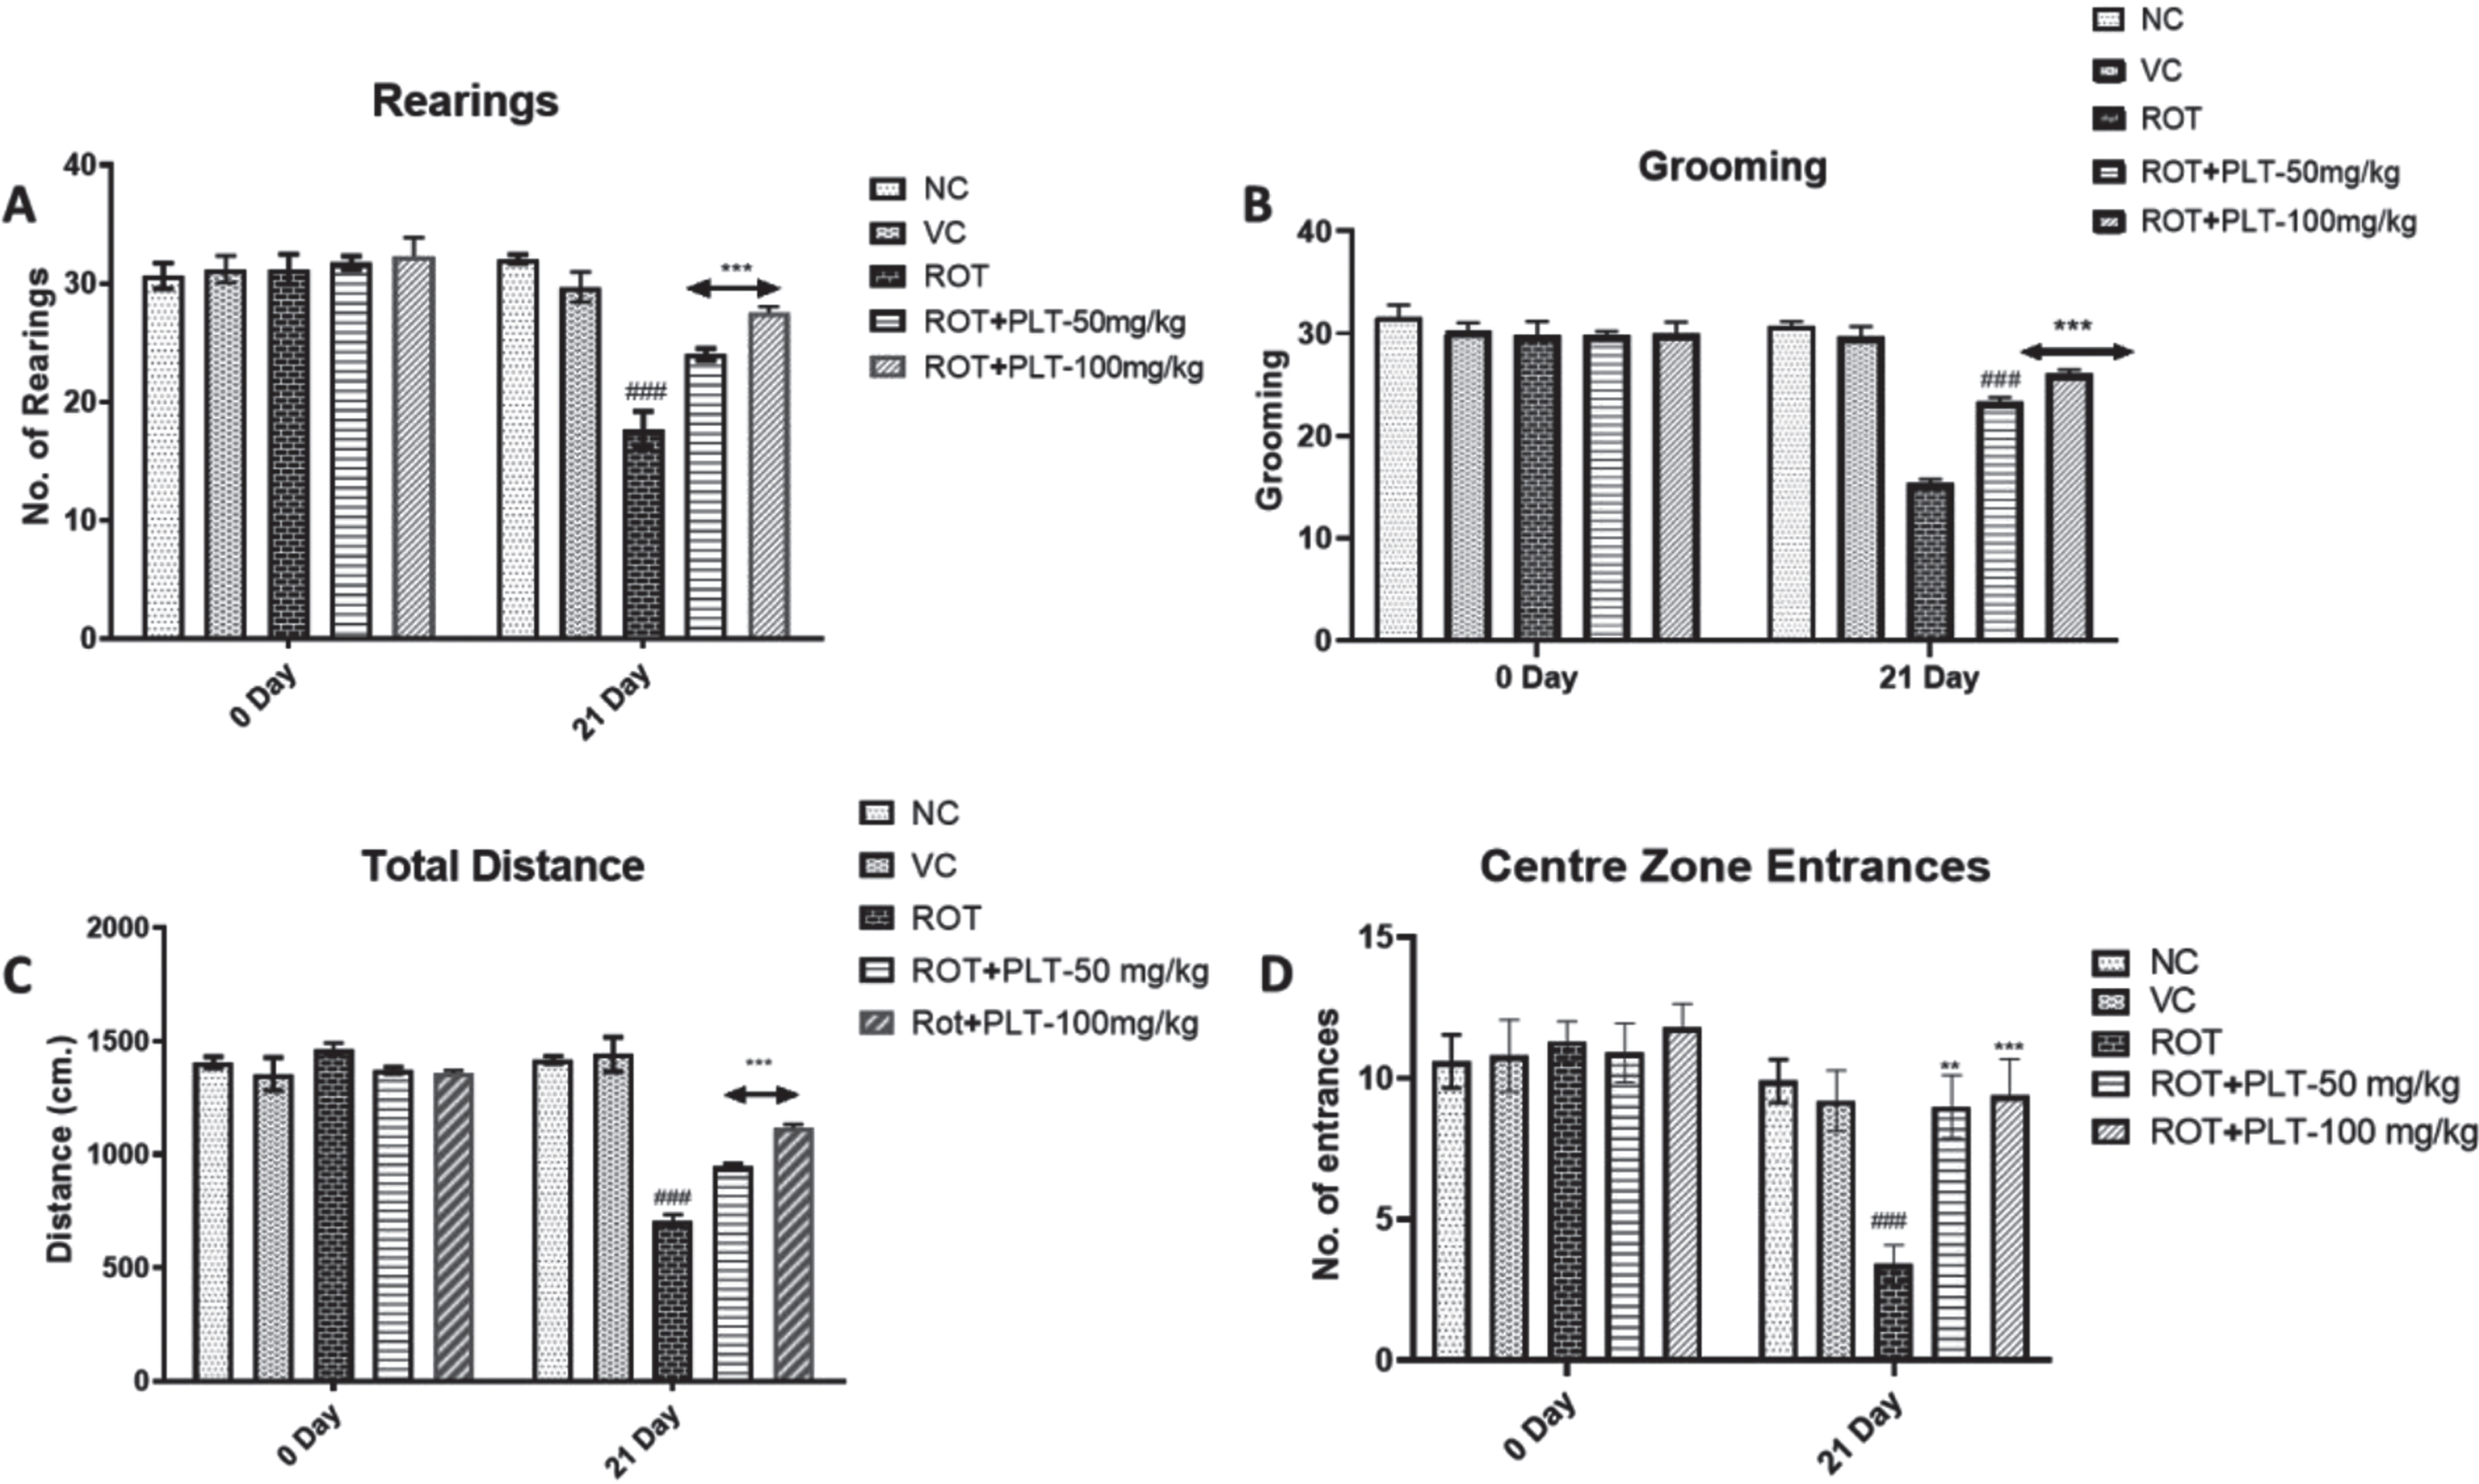
To observe the behavioral changes in mice after ROT and PLT treatment, the open field test was performed to observe the locomotor activity and anxiety-associated behaviors. Several parameters including total distance travel, center entries (in seconds), and rest time (in seconds) were observed. Results of OFT studies showed significant decreases in total distance (p < 0.001) and the number of entries (p < 0.001) in the center zone in ROT-treated mice as compared to normal mice while these changes were significantly reversed after treatment with PLT at the low dose (50 mg/kg, p < 0.0.01) and high dose (100 mg/kg, p < 0.001) as compared to ROT treated mice. Similarly, the number of rearing (p < 0.001) and grooming (p < 0.001) was significantly decreased in ROT-treated mice as compared to the NC group of mice while these changes were significantly reversed after treatment with PLT at a low dose (50 mg/kg, p < 0.001) and high dose (100 mg/kg, p < 0.001) mice as compared to ROT treated group of mice (Fig. 2A).
Fig. 2
A) Locomotor activity of animals in the open field test (Rearing, Grooming, Total Distance Travelled, and Central Zone Entrances). Data expressed as mean±SEM, n = 10. ###p < 0.001 versus NC, **p < 0.01, ***p < 0.001 versus ROT. One-way ANOVA was followed by the Tukey test as a post-ANOVA test for multiple comparisons. B) Rotarod performance in different experimental groups. The total time remaining on the revolving rod was recorded. Data expressed as mean±SEM. N = 10. ###p < 0.001 versus NC, **p < 0.01, ***p < 0.001 versus ROT. One-way ANOVA was followed by the Tukey test as a post-ANOVA test for multiple comparisons. The result with p < 0.05 were considered statistically significant.
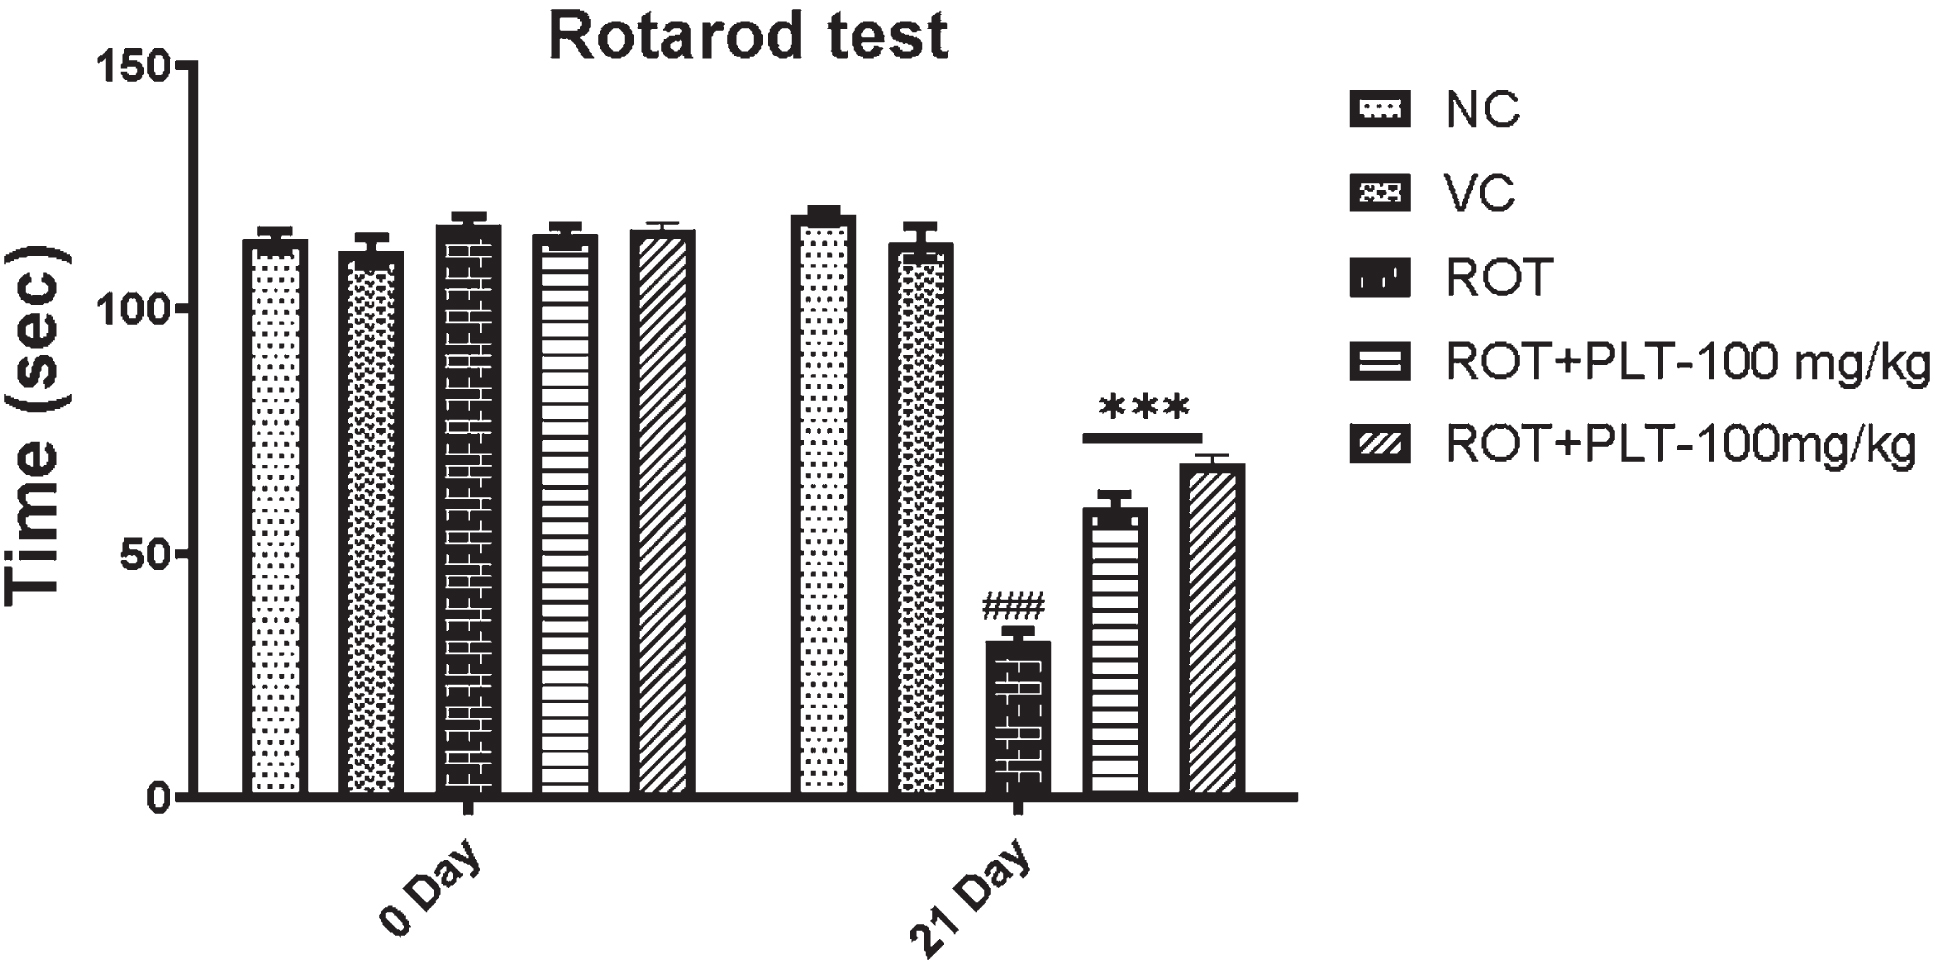
The motor performance of mice after ROT and PLT administration was observed using the accelerating rotarod test. Results of this experiment showed a decrease in the latency to fall, and the total stay time on the revolving rod is significantly decreased (***p < 0.001) in ROT-induced diseased mice as compared to the NC group of mice. While this result was significantly reversed on treatment with low dose (**p < 0.01) and high dose (**p < 0.01) of PLT treatment as compared to ROT-treated mice (Fig. 2B).
Phloretin treatment decreased α-SYN aggregation and improved the antioxidant mechanism, tyrosine hydroxylase expression
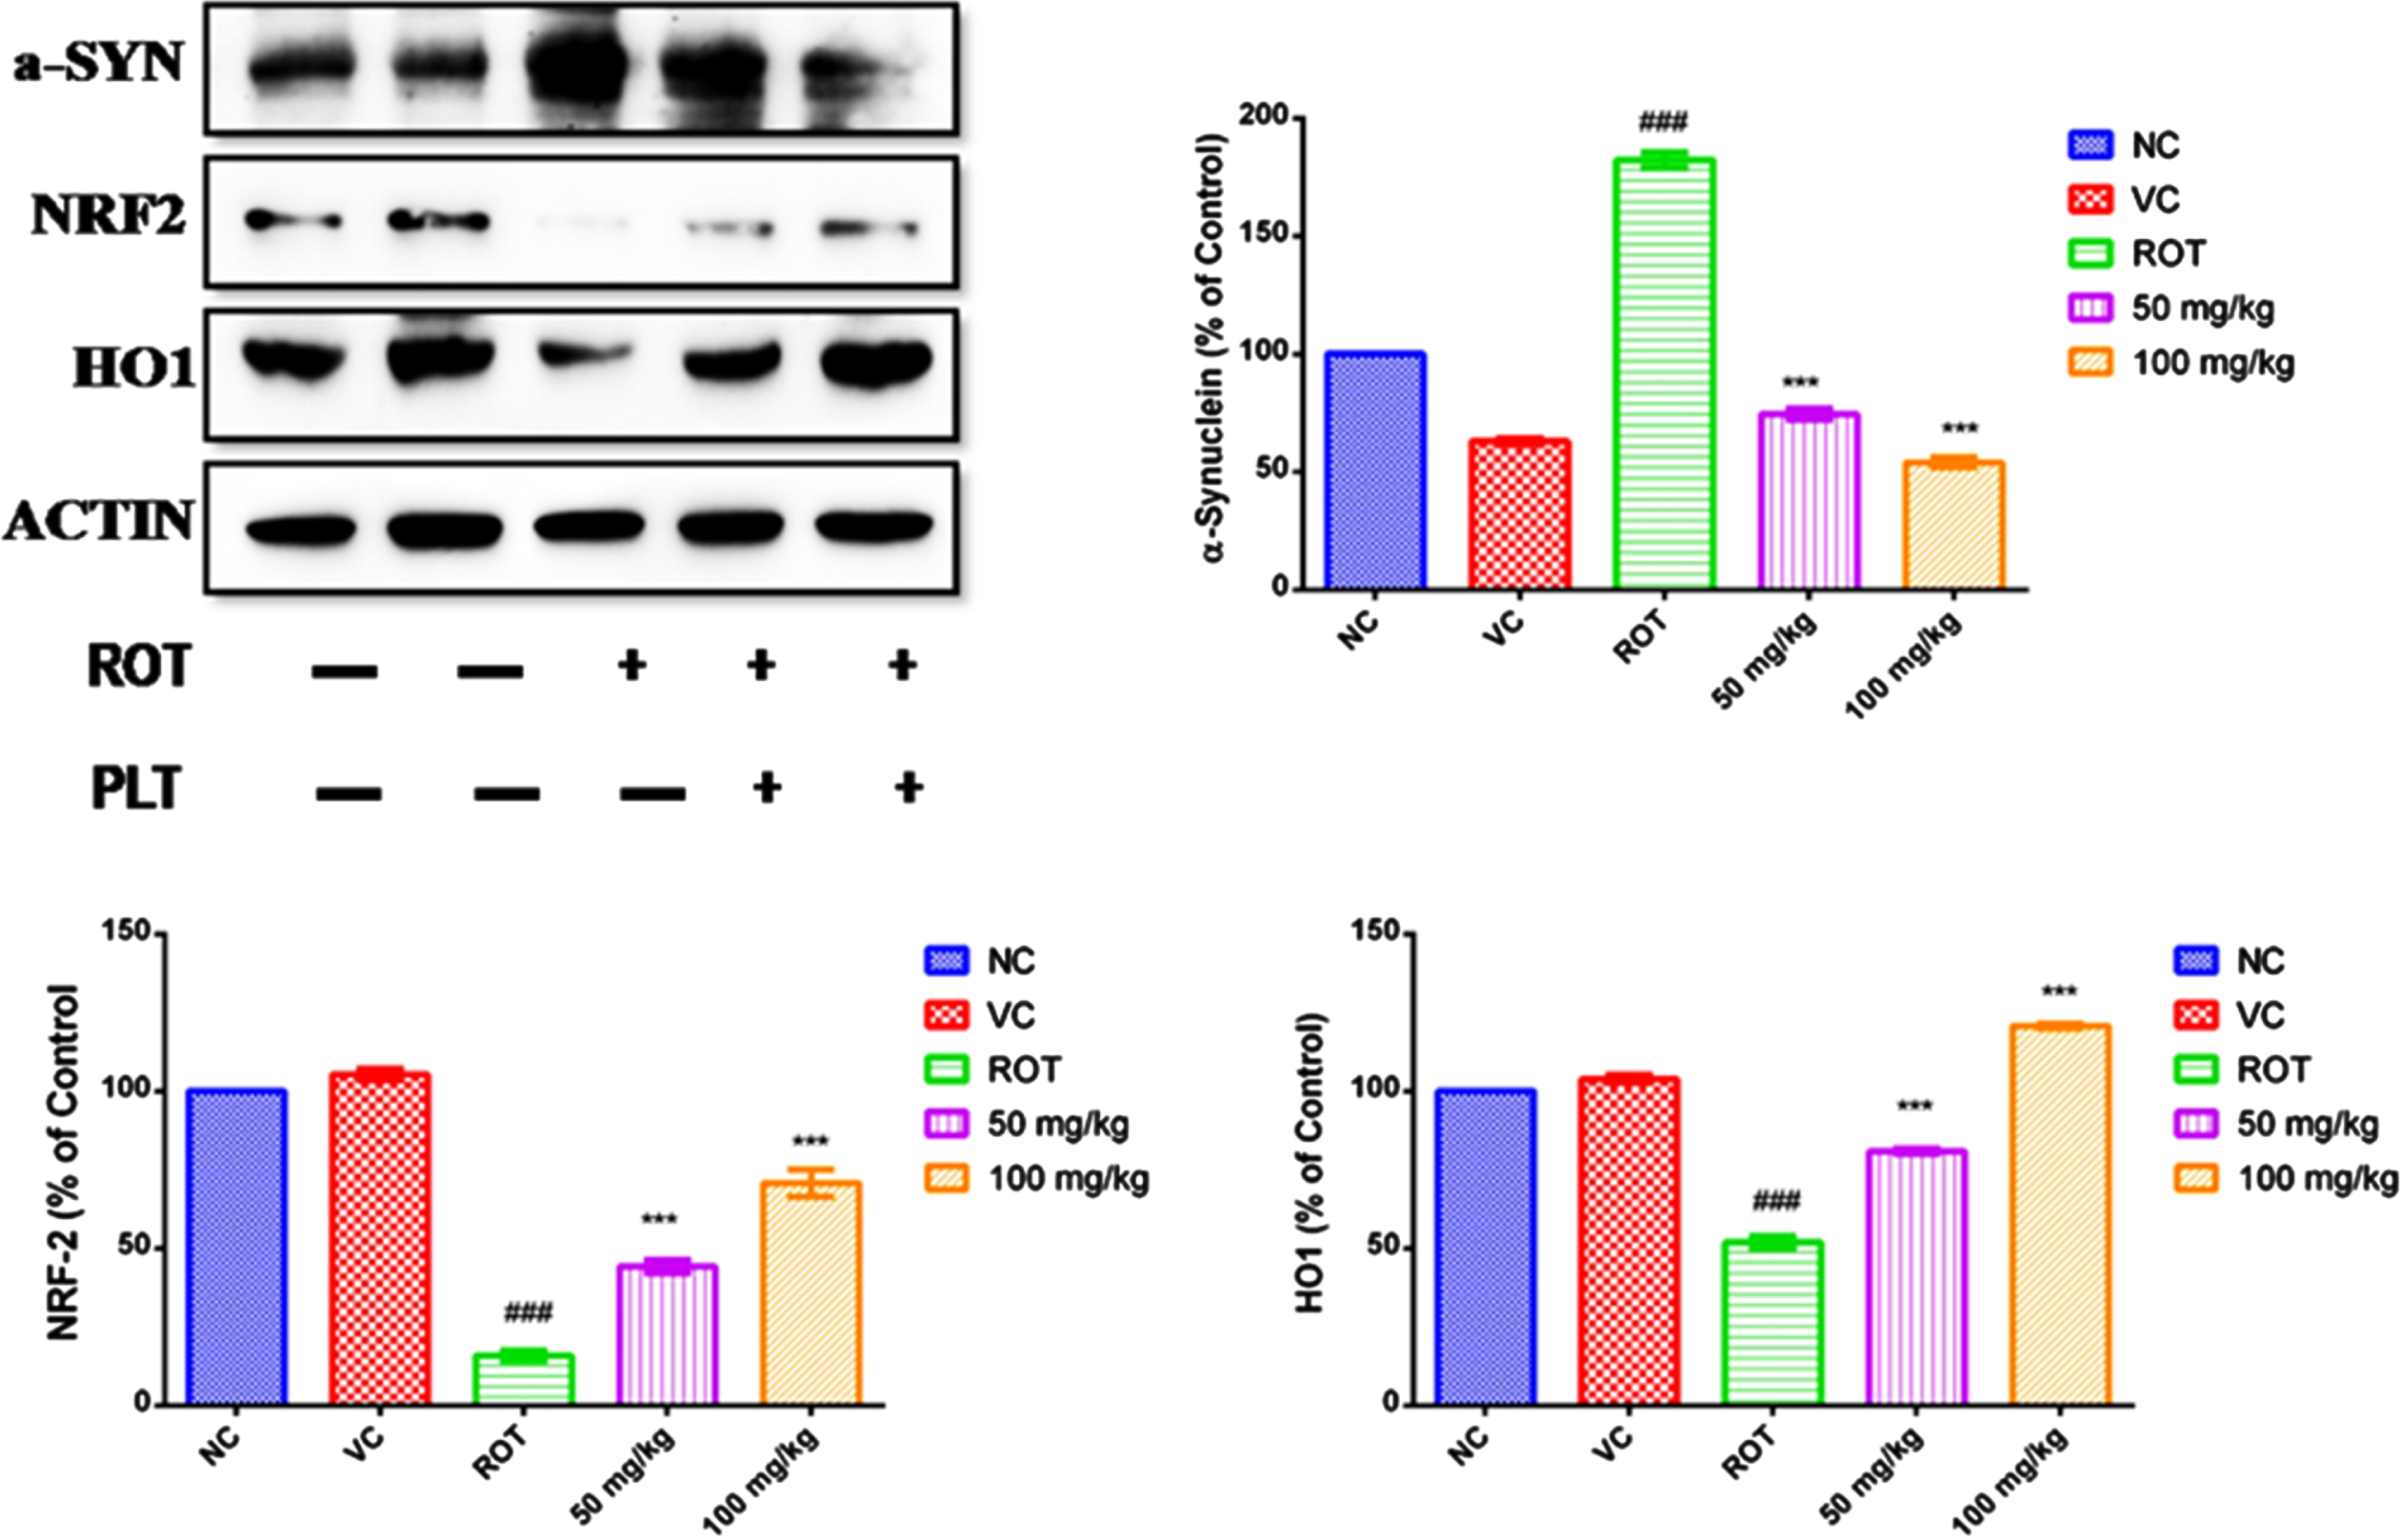
The level of protein such as α-SYN that accumulated in the brain and have a close concern with neuronal death was significantly increased (###p < 0.001) in ROT-administered mice as compared to the NC group of mice while the expression of the α-SYN protein was significantly lowered after treatment with Phloretin at a low dose (***p < 0.001) and high dose (***p < 0.001) as compared to only ROT administered group. PLT has been reported for its Nrf-2 activator potential. Given that, the expression pattern of antioxidants was studied using immunoblotting. The level of proteins that work as an antioxidant, NRF2, and HO-1 was significantly decreased (###p < 0.001) in ROT-treated mice as compared to the NC group of mice while these proteins were significantly improved after treatment with PLT at a low dose (***p < 0.001) and high dose (***p < 0.001) as compared to only ROT administered group of mice (Fig. 3A).
Fig. 3
A) Effect of PLT on α-SYN and antioxidant status: NC, Normal control rats; VC, Vehicle control; ROT, Disease control. Rot treated with PLT at 50 and 100 mg/kg, p.o. respectively. ###p < 0.001 versus NC, ***p < 0.001 versus ROT. One-way ANOVA was applied to statistical analysis, followed by post hoc analysis by “Bonferroni’s multiple comparison tests”. The results obtained are represented as mean±SEM (n = 3) and results with p < 0.05 were considered statistically significant. B) Effect of PLT on Tyrosine Hydroxylase expression: NC, Normal control rats; VC, Vehicle control; ROT, Disease control. Rot treated with PLT at 50 and 100 mg/kg, p.o. respectively. ∧p < 0.05 versus NC, **p < 0.01 versus ROT. One-way ANOVA was applied to statistical analysis, followed by post hoc analysis by “Bonferroni’s multiple comparison tests”. The results obtained are represented as mean±SEM (n = 3) and results with p < 0.05 were considered statistically significant.
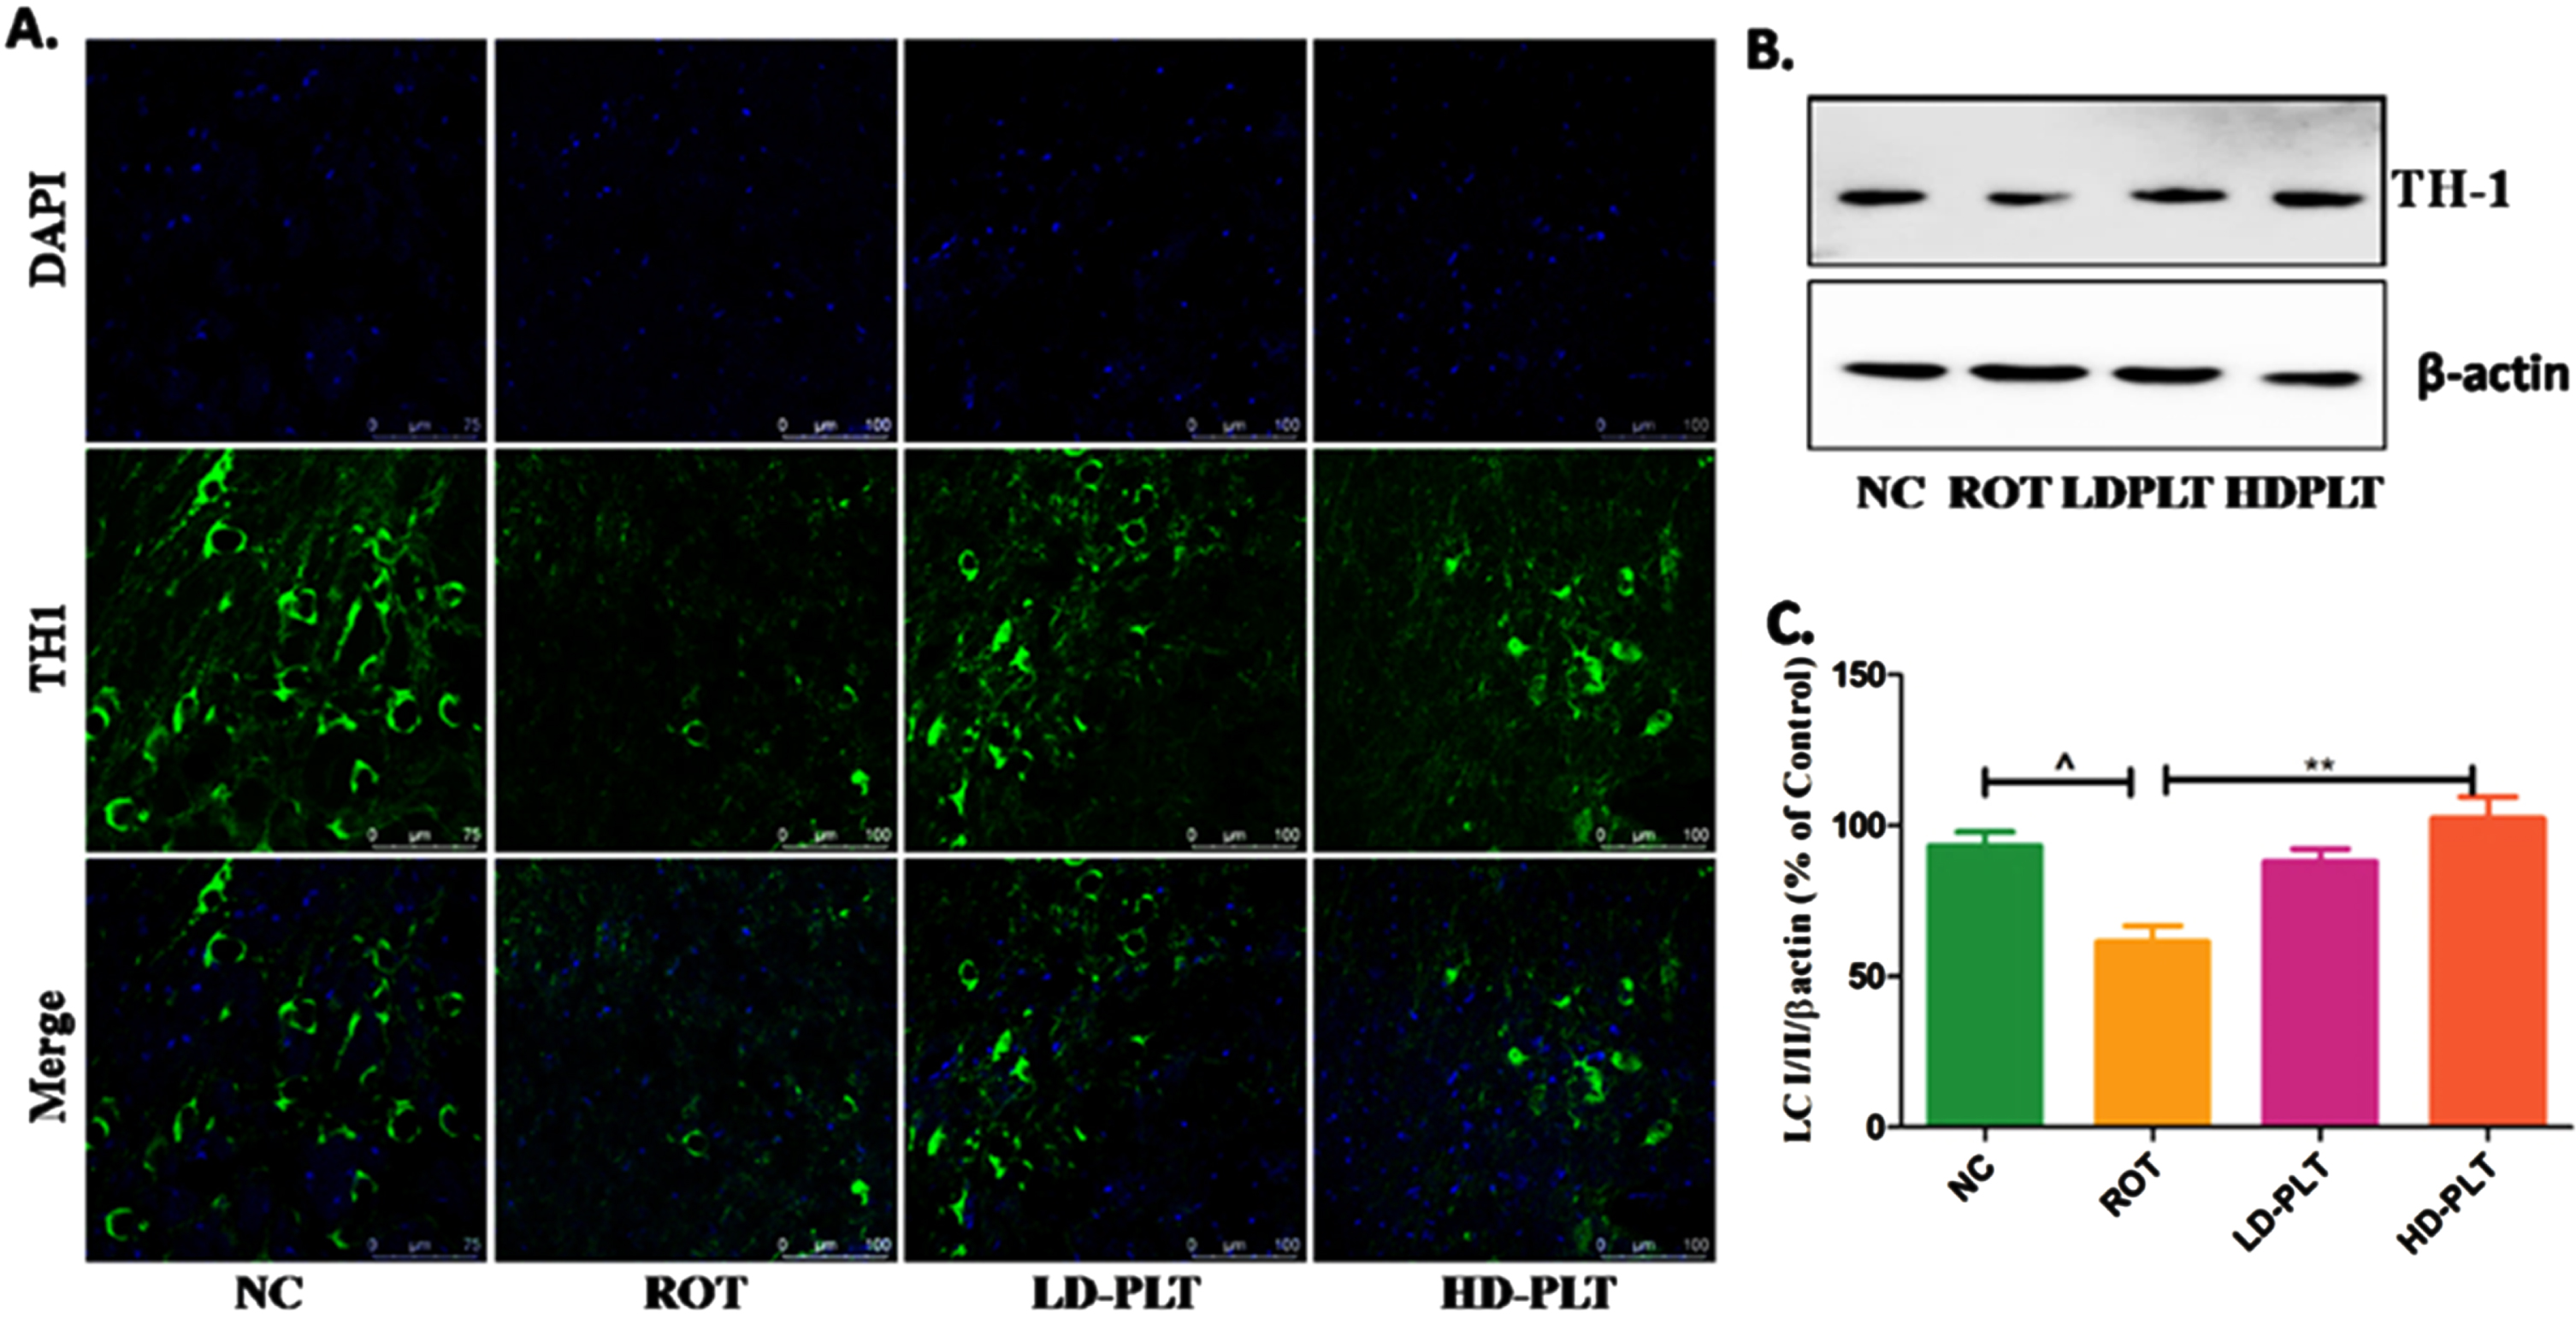
Additionally, we assessed the TH expression in the SNpc region of the brain. A significant decrease in the TH expression by immunoblotting and IF study was observed in the SNpc region of ROT-treated mice compared to the normal control, whereas PLT treatment restored the level of TH (Fig. 3B).
Phloretin treatment prevents the expression of apoptotic protein
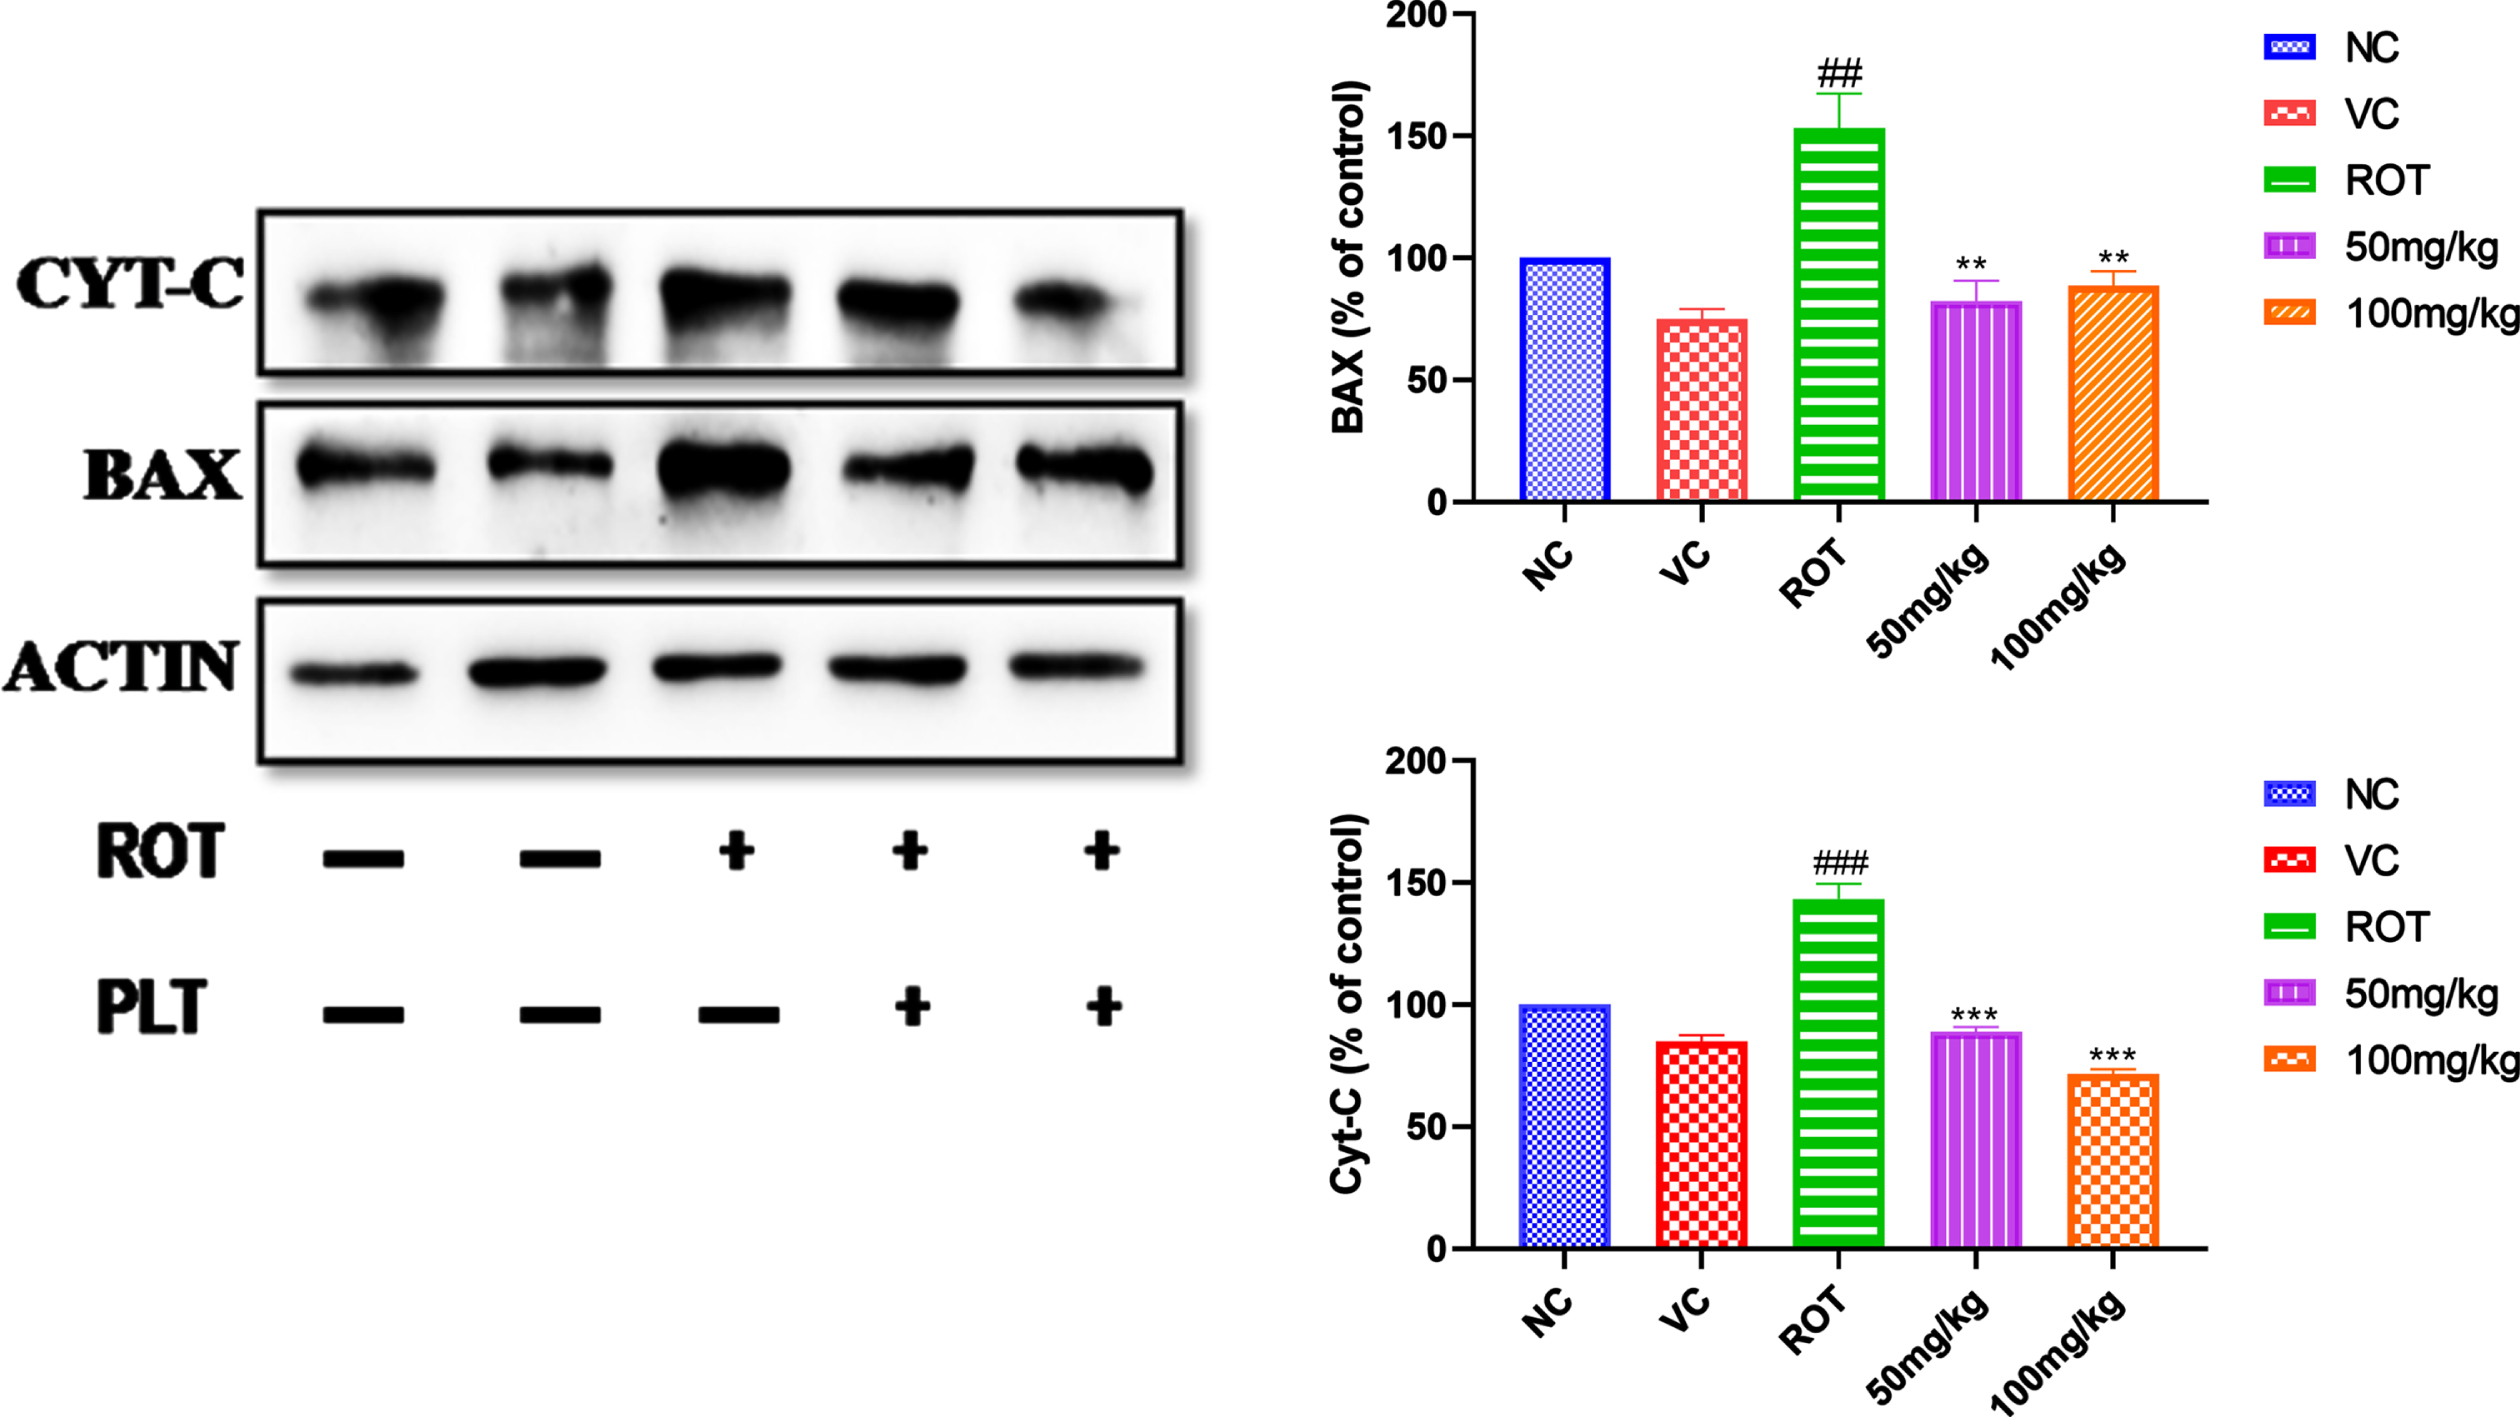
ROT induces the generation of ROS and leads to neuronal death due to an increase in apoptotic proteins, such as cytochrome-C and Bax. The expression pattern of apoptotic proteins such as the level of cytochrome-C and Bax were increased significantly (###p < 0.001) after ROT administration as compared to the NC group of mice. Whereas the level of cytochrome-C (***p < 0.001) and Bax (**p < 0.01) (**p < 0.01) was found to be significantly decreased in PLT administered group, as compared to the ROT, treated group of mice (Fig. 4).
Fig. 4
Effect of PLT on apoptotic protein. NC, Normal control rats; VC, Vehicle control; ROT, Disease control. Rot treated with Phloretin at 50 and 100 mg/kg, p.o. respectively. ###p < 0.001 versus NC, *p < 0.05, **p < 0.01, ***p < 0.001 versus ROT. One-way ANOVA was applied to statistical analysis, followed by post hoc analysis by “Bonferroni’s multiple comparison tests”. The results obtained are represented as mean±SEM (n = 3) and results with p < 0.05 were considered statistically significant.
PLT therapy delays cell death by restoring the autophagy process
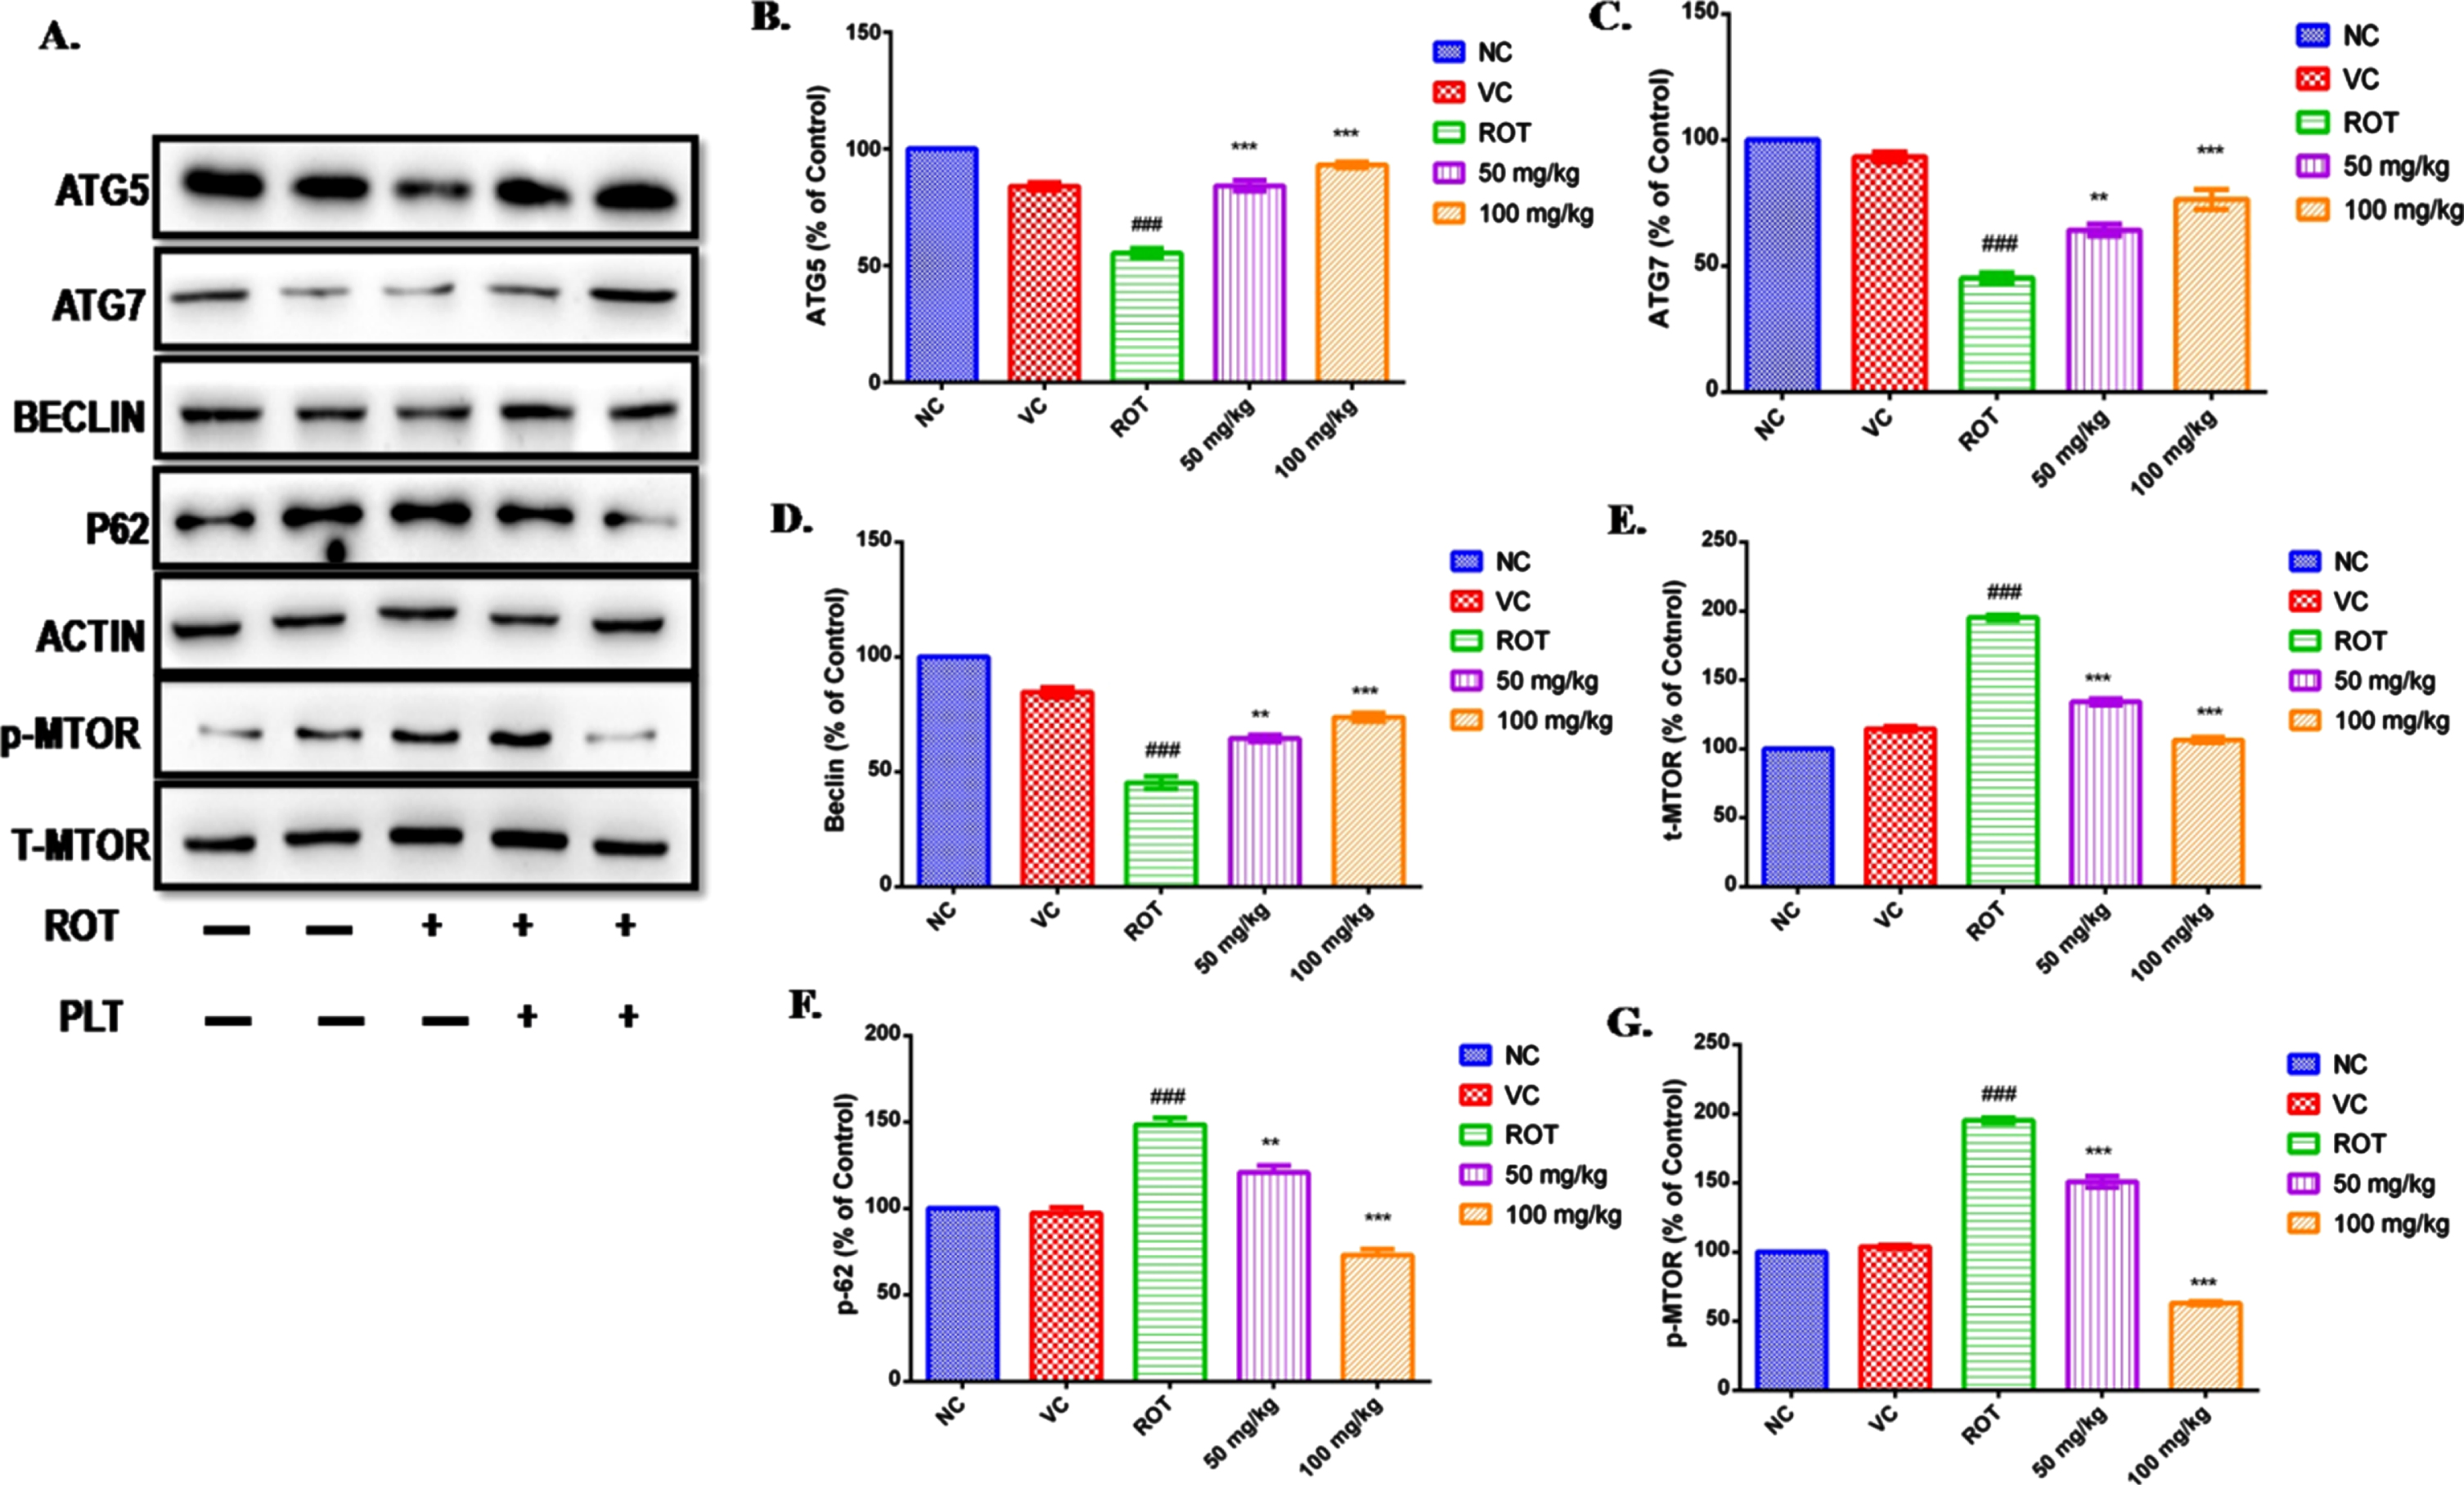
Autophagy has been reported as the main culprit behind the deranged cellular homeostasis and death in ROT-induced cell death. ROT disrupting the autophagy process in SH-SY5Y cells in a dose-dependent manner has been reported [25, 26]. PLT treatment prevents ROT-induced neuronal death in mice by regulating the expressions of the protein involved in the autophagy process. The level of autophagy proteins such as Atg5, Atg7, Beclin, p62, mTOR, and phospho-mTOR in the mice brain was assessed using immunoblotting. The results showed that the level of Atg5, Atg7, and Beclin was significantly decreased (###p < 0.001) in the ROT-exposed brain as compared to the normal control mice. However, the level of these proteins was significantly improved on PLT administration at low (Atg5 ***p < 0.001, **Atg7 p < 0.01 and Beclin **p < 0.01) and high dose (Atg5 ***p < 0.001, Atg7 ***p < 0.001 and Beclin ***p < 0.001) as compared to ROT-treated.
Results of the study revealed a significant increase in the level of p62 (Fig. 3F, ###p < 0.001) and mTOR (Fig. 5E, G, ###p < 0.001) after ROT treatment as compared to the normal group. Differentially, these results are restored after PLT treatment at low (p62 **p < 0.01 and Phospho-mTOR ***p < 0.001) and high dose (p62***p < 0.001 and Phospho-mTOR ***p < 0.001) in ROT administered mice as compared to ROT treated mice (Fig. 5).
Fig. 5
Effect of PLT on autophagy control: NC, Normal control; VC, Vehicle control; ROT, Disease control. ROT treated with PLT 50 and 100 mg/kg, p.o. respectively. ###p < 0.001 versus NC, ns, non-significant, **p < 0.01, ***p < 0.001 versus ROT. One-way ANOVA was applied to statistical analysis, followed by post hoc analysis by “Bonferroni’s multiple comparison tests”. The results obtained are presented as mean±SEM (n = 3) and results with p < 0.05 were considered statistically significant.
Cell viability of rotenone and phloretin cell toxicity
The results demonstrated that ROT significantly reduced cell viability in a dose-dependent manner. Similarly, the cell viability test of PLT was also carried out using the MTT assay in SH-SY5Y cells. Based on the MTT test, 10μM of ROT and 3.5 and 6μM PLT were chosen for further experiment.
Effect of phloretin treatment on ROS production and mitochondrial membrane potential
The fluorescent image analysis has shown that the green fluorescence signal intensity was significantly increased (**p < 0.01) in ROT exposed experimental group, compared to the normal control group. PLT-treated cells have shown significantly lowered intensity in a dose-dependent manner at low dose PLT (*p < 0.05) and high dose of PLT (**p < 0.01) even in the presence of ROT, compared to only the ROT exposed group. The intensity of green fluorescence is directly proportional to the ROS production in ROT-exposed cells.
Fig. 6
MTT test of phloretin.
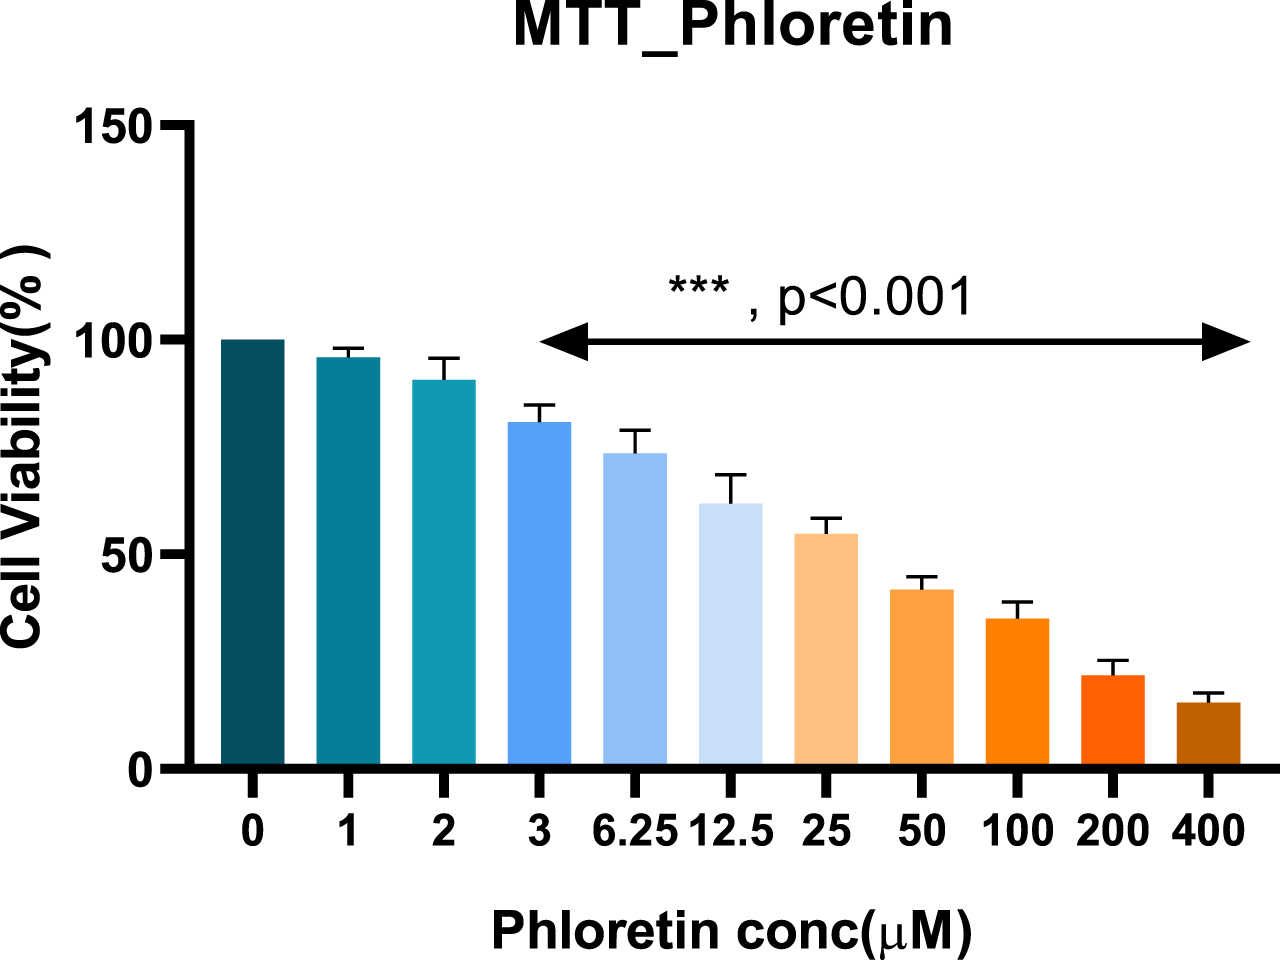
Fig. 7
The effect of PLT exposure on ROS production and mitochondrial membrane potential (MMP): ROS and MMP were quantified using DCFDA and JC-1 dye respectively. Panel A represents DCFDA-positive cells and panel C shows changes in the DCFDA intensity after ROT and Phloretin treatment. Panel B shows aggregate (Red Fluorescence) and monomer form (Green fluorescence) of mitochondria and panels D and E shows changes in red and green fluorescence intensity after ROT and PLT exposure. (***p < 0.001, **p < 0.01 and *p < 0.05). One-way ANOVA was applied to statistical analysis, followed by post hoc analysis by “Bonferroni’s multiple comparison tests”. The results obtained are represented as mean±SEM and results with p < 0.05 were considered statistically significant.
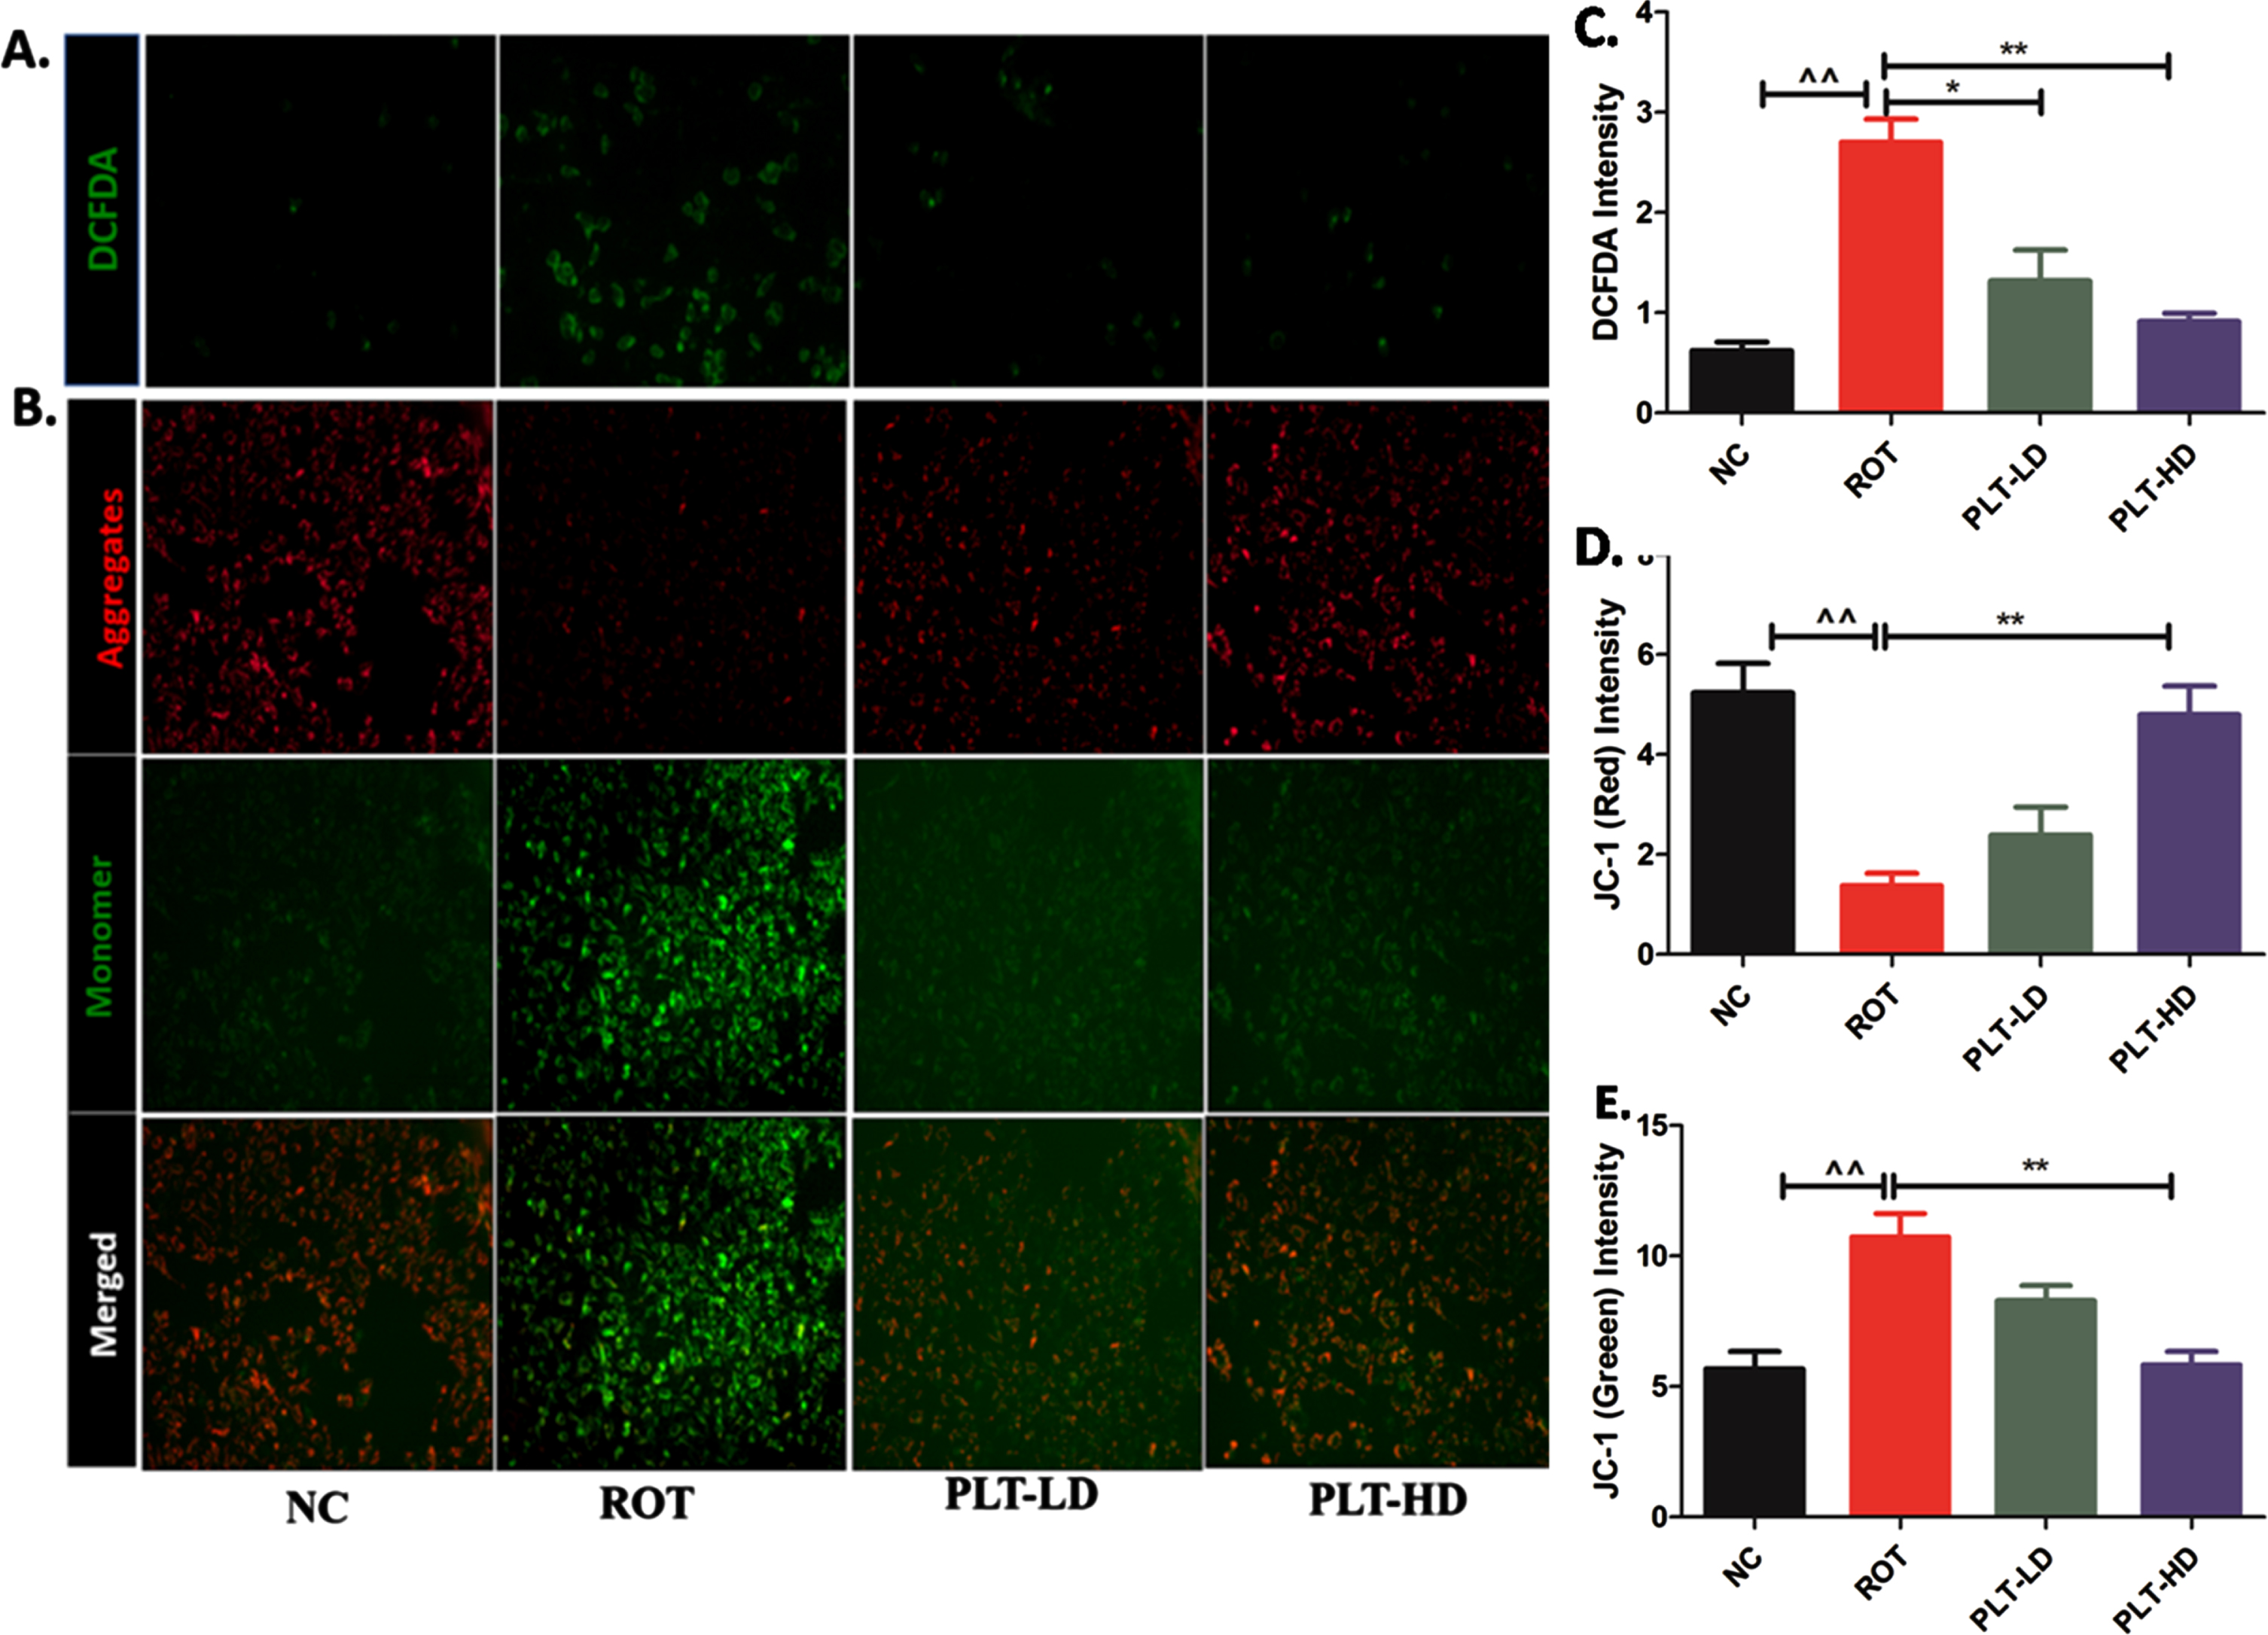
ROT being a complex-1 inhibitor primarily affects the mitochondria causing a deranged electron transport chain (ETC) function. The mitochondrial membrane potential (MMP) is the measure of mitochondrial bioenergetic perturbation and can be measured by using JC-1 dye. JC-1 is a cationic dye that specifically indicates mitochondrial depolarization and exhibits potential-dependent accumulation in mitochondria. The shifting in the red to green fluorescence is an indicator of MMP loss due to mitochondrial membrane damage. The fluorescence images indicated significant decreases in red fluoresce (**p < 0.01) while increases in green fluorescence (**p < 0.01) in ROT-exposed cells when compared to normal cells. PLT-treated cells have shown a significant increase in the red fluorescence intensity compared to green fluorescence at both low and high doses (**p < 0.01) as compared to ROT-exposed cells.
Phloretin treatment reduced cell death by regulating apoptosis and necrosis in SH-SY5Y cells
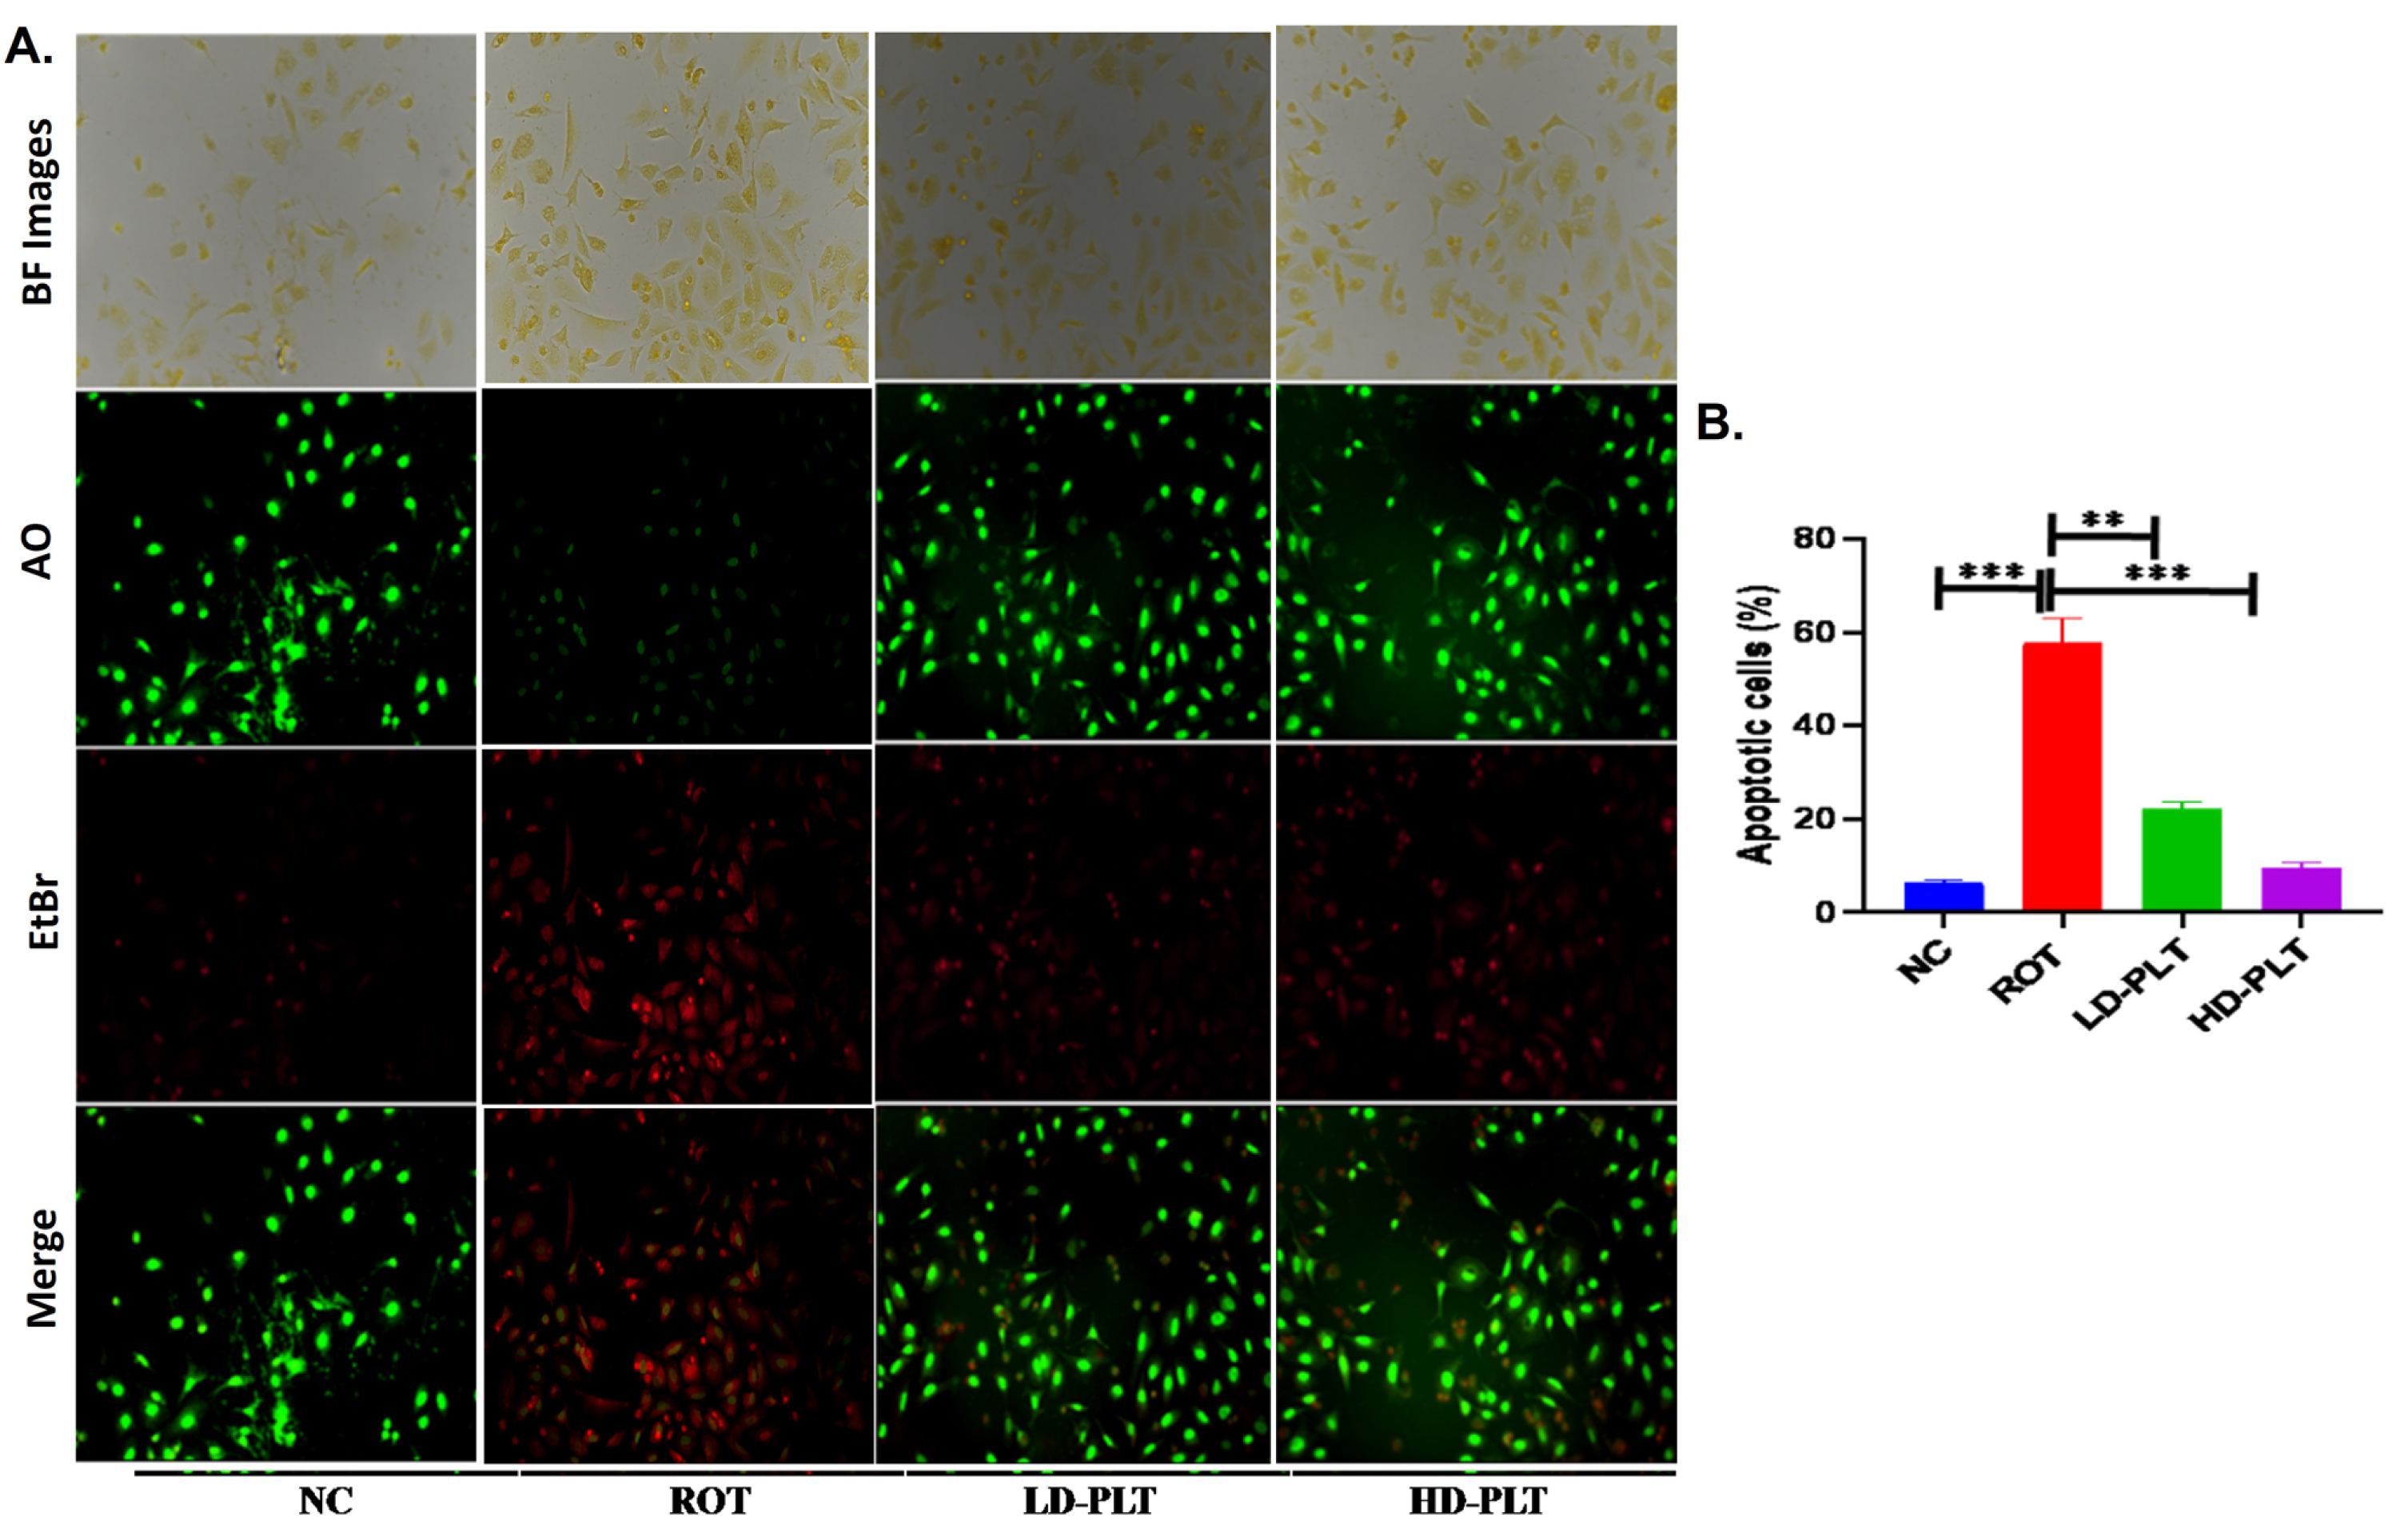
ROS production increases the process of cell death, which was confirmed by dual dye staining such as AO/EtBr staining in SH-SY5Y cells. The fluorescence images (Fig. 8) showed green, red, and orange color fluorescence indicating normal, apoptotic, and necrosis respectively. The result of the study reveals a significant increase (∧∧∧p < 0.001) in the apoptotic cells in ROT-exposed cells as compared to normal cells while the incidence of apoptotic and necrosis was significantly lowered after low (**p < 0.01) and high dose (***p < 0.001) of PLT exposure compared to ROT exposure.
Fig. 8
Cell apoptosis quantified using AO/EtBr staining. A) AO/EtBr staining of cells. B) Quantification of apoptotic cells no (***p < 0.001, **p < 0.01, and *p < 0.05). One-way ANOVA was applied to statistical analysis, followed by post hoc analysis by “Bonferroni’s multiple comparison tests”. The results obtained are represented as mean±SEM and p < 0.05 were considered statistically significant.
Effect of phloretin treatment on α-SYN deposition and antioxidant mechanism in SH-SY5Y cells
ROT exposure to the cell led to an increase in the α-SYN (Fig. 9A, 2nd panel), and a decrease in the HO-1 (Fig. 9B, 2nd panel) expression compared to the normal control. Both low and high-dose, PLT-treated cells showed a decrease in the α-SYN (Fig. 9A, 3rd, and 4thpanel), and increased HO-1 (Fig. 9B, 3rd and 4th panel) expression. The western blot study has also shown that ROT-exposed cells have increased the α-SYN (Fig. 9C, D) and decreased HO-1 (Fig. 9C, E) in the SH-SY5Y cells. While this result was significantly reversed on PLT treatment at both high doses and low doses.
Fig. 9
Effect of PLT exposure on antioxidant mechanism in ROT-exposed SH-SY5Y cells. Representative IF images of SH-SY5Y cells labeled with A) α-Synuclein, B) HO-1. C) The protein expression of α-Synuclein and HO-1 in PLT and ROT exposed SH-SY5Ycells by western blotting. Quantitative analysis of D) α-Synuclein and E) HO-1 using Image J software. The results obtained are represented as mean±SEM (n = 3). ***p < 0.001, **p < 0.01 and *p < 0.05 versus ROT.
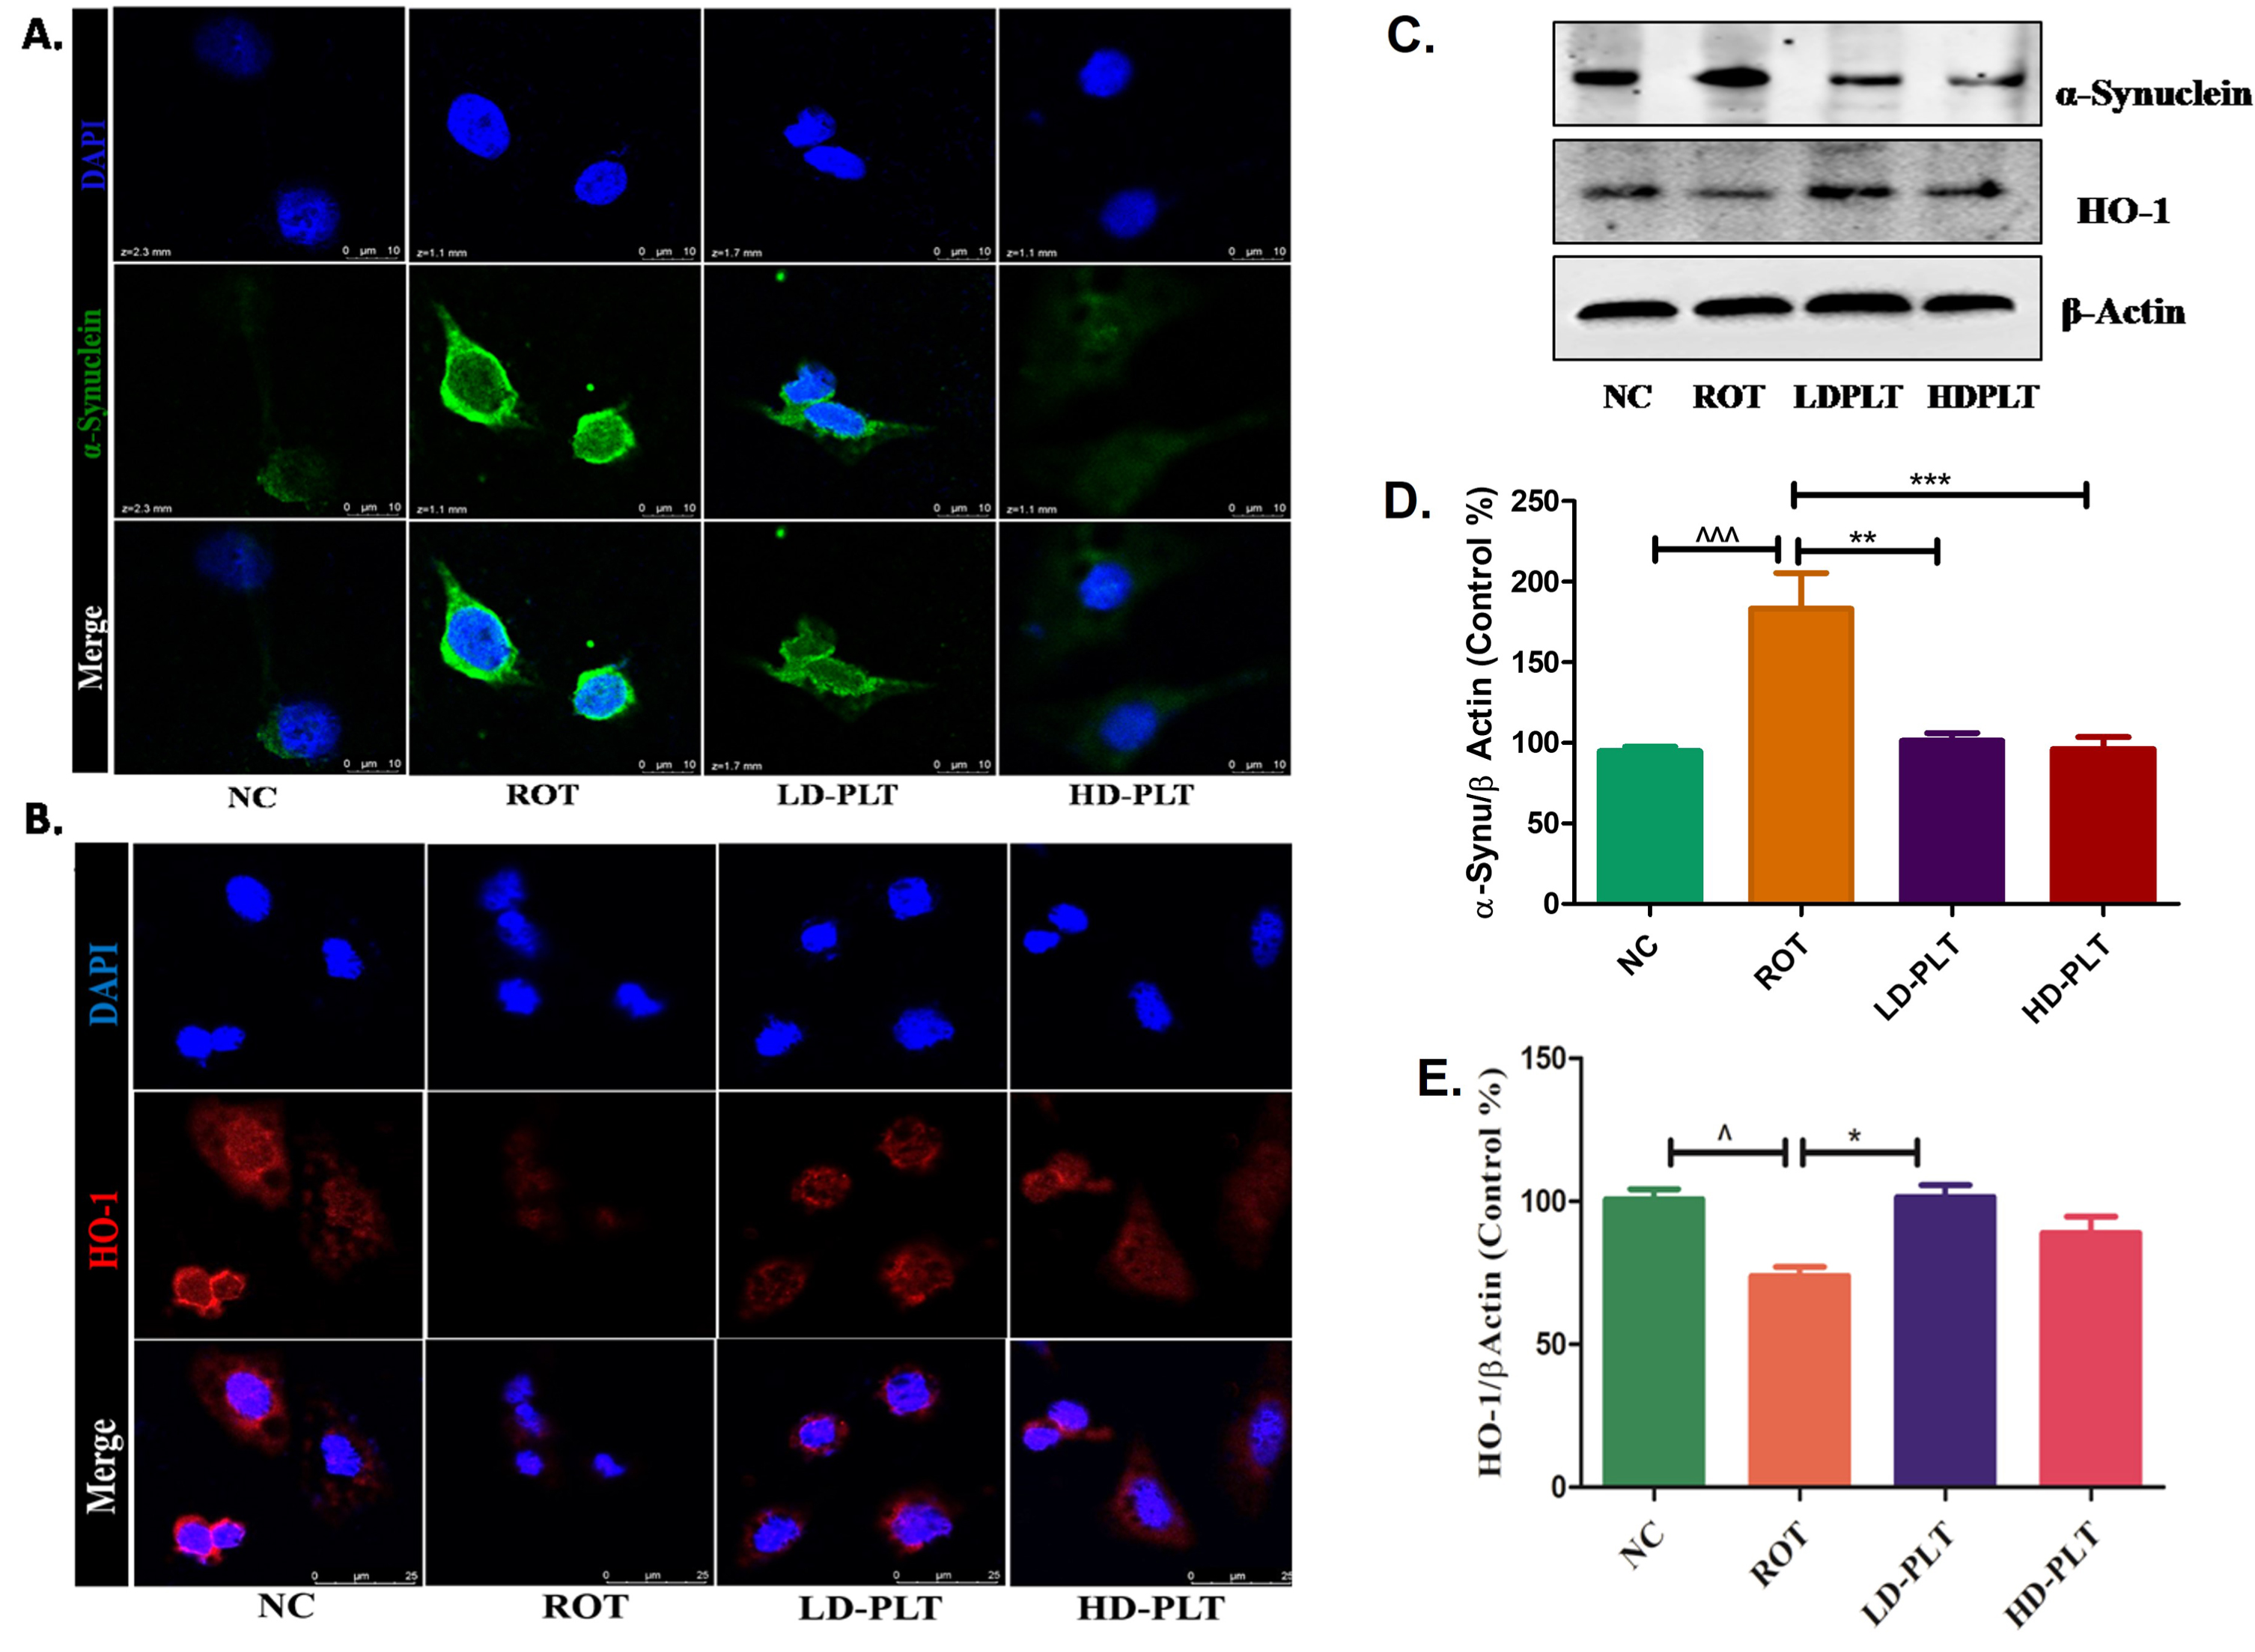
Fig. 10
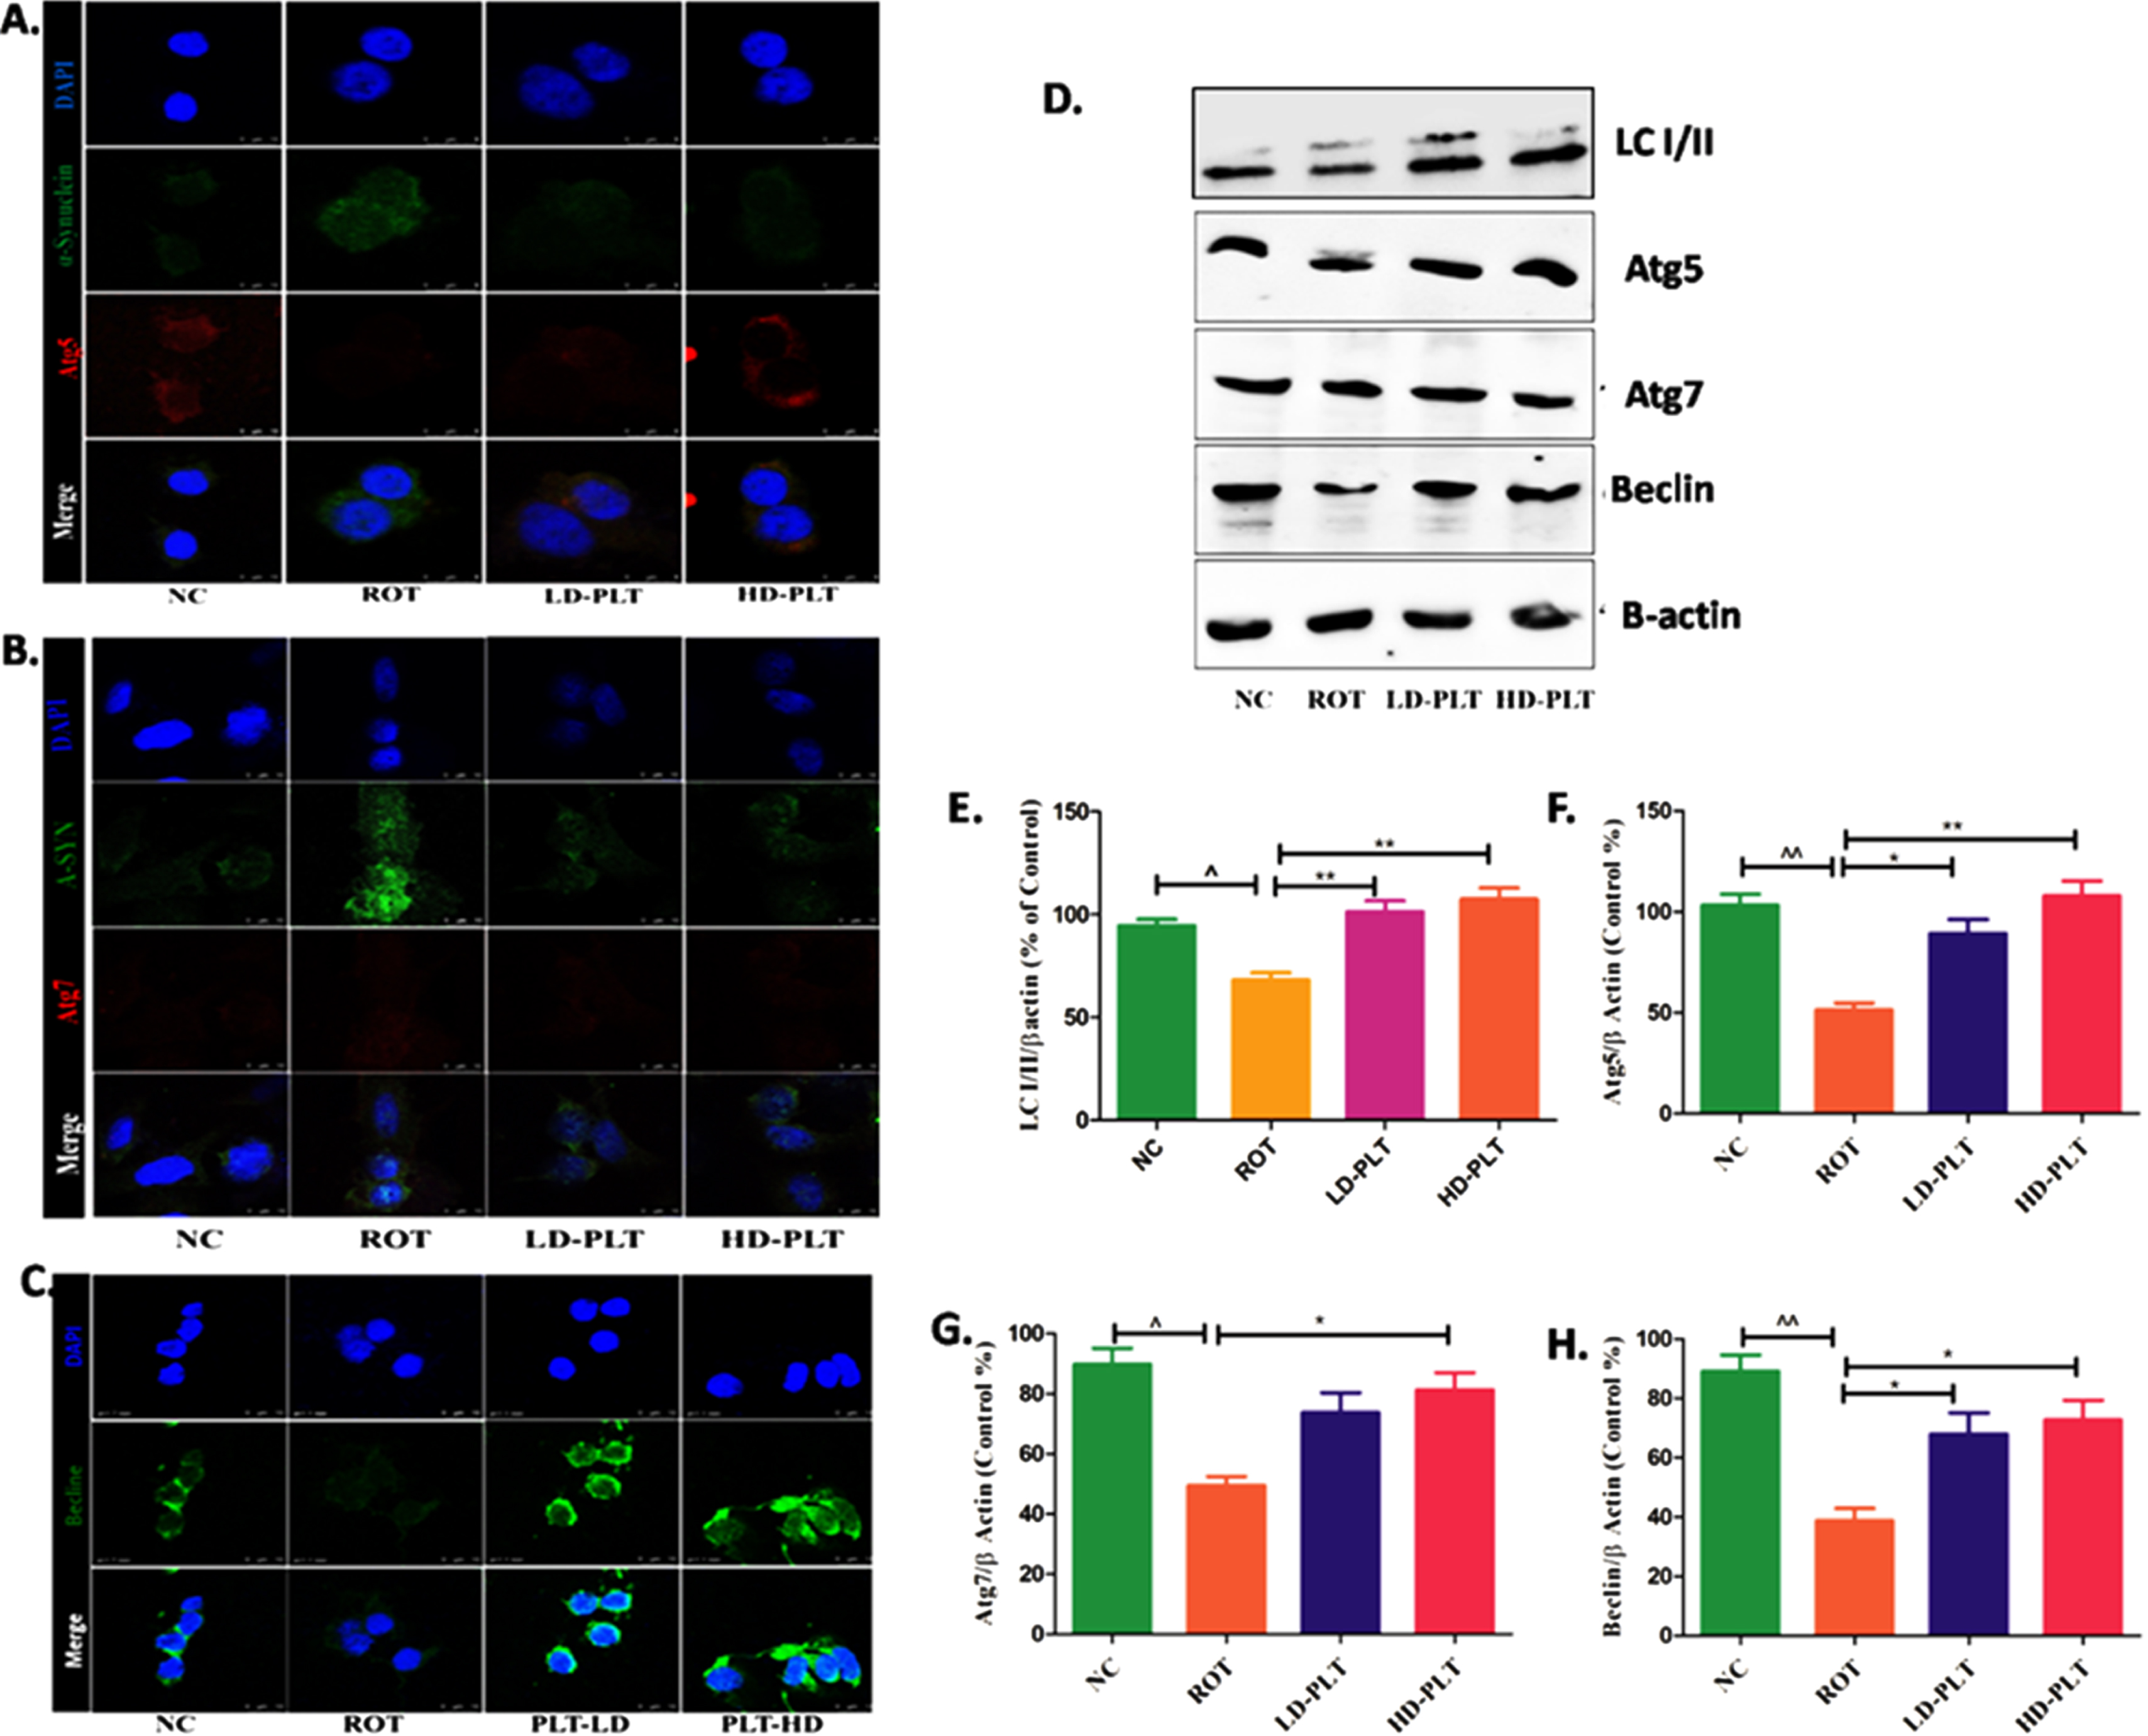
Effect of PLT exposure on autophagic proteins in ROT-exposed SH-SY5Y cells. Representative IF images of SH-SY5Y cells labeled with A) Atg-5, B) Atg-7, C) Beclin. D) Western blot image of LC3B-I/II, Atg-5, Atg-7, and Beclin in PLT and ROT exposed SH-SY5Ycells by western blotting. Quantitative densitometric analysis of E) LC3B I/II, F) Atg-5, G) Atg-7, and H) Beclin using Image J software. The results obtained are represented as mean±SEM (n = 3). ***p < 0.001, **p < 0.01 and *p < 0.05 versus ROT, ∧∧p < 0.01 and ∧p < 0.05 versus ROT.
Effect of phloretin treatment on autophagic proteins in rotenone-treated SH-SY5Y cells
As we reported the role of PLT as a regulator of autophagic proteins such as Atg5, Atg7, and Beclin in the ROT-induced mice model of PD. The finding of the in vivo study was further validated by the finding of the in vitro study. Results showed that the expression of Beclin and LC3B I/II ratio was significantly decreased after ROT treatment as compared to normal cells while Phloretin treatment showed a reverse effect after Phloretin treatment in ROT-induced cells as compared to ROT-treated cells. Similarly, the level of Atg5 and Atg7 were significantly decreased after ROT treatment as compared to normal cells while Phloretin treatment showed a reverse effect after Phloretin treatment in ROT-induced cells as compared to ROT-treated cells.
DISCUSSION
In the present study, we have explored the experimental evidence for the neuroprotective potential of PLT in terms of improving the locomotive activity, anxiety-like behavior, and antioxidant capacity in the ROT-induced PD model of mice at two doses: 50 mg/kg and 100 mg/kg. PLT at a 100 mg/kg dose has been documented as a safe dose not causing toxicity such as hepatotoxicity and lethality in mice [27, 28]. Hence a 100 mg/kg control group has not been included in the study. Additionally, the neuroprotective effect of PLT was assessed in ROT-induced neurotoxicity in SH-SY5Y cells. PLT exhibited antioxidant and neuroprotective effects in both in vivo (mice) and in vitro (SH-SY5Y cells) by regulating the expression of α-SYN the hallmark of PD disease, TH, ROS production, antioxidant proteins (NRF2 and HO-1), apoptotic cell death, and autophagy process regulating proteins such as Atg5, 7, Beclin, P62, and LC3B. Further, activation of the NRF2-HO-1 signaling axis was linked through the p62/phospho-mTOR/NRF2 pathway.
ROT, a potent inhibitor of mitochondrial ETC complex-1, mimics the motor and pathological features of PD. According to the previously published report, the subcutaneous and systemic exposure of ROT led to selective degeneration of nigral dopaminergic neurons with α-SYN aggregation, loss of TH and causes dopamine deficit in the striatum, resulting in motor dysfunction [29, 30]. Numerous investigations have demonstrated that mice and rats treated with ROT exhibited reduced locomotion and unsteady posture [31, 32]. One of the main characteristics of PD is impaired locomotor function, which manifests as diminished or slowed voluntary movements (bradykinesia) and trouble starting movements (akinesia) because of muscle rigidity [2, 33, 34]. PLT has attenuated the behavioral deficit and neuroinflammation in the MPTP-induced PD model [35]. In the line with the earlier reports, the present study showed that ROT caused motor deficits by decreasing the latency to fall [36, 37] which was improved in PLT administered group of mice (Fig. 2B). It has also restored the motor deficit in the present study as evident in the rotarod experiment.
The OFT is a common way to compare the locomotor activity, exploratory behavior, and anxiety levels of two groups of animals that are genetically distinct or have received pharmacological treatment [38, 39]. ROT administered group of mice showed significant impairment in exploratory behavior as assessed by counting, rearing, grooming, total distance traveled, and increase anxiety behavior as evaluated by counting central Zone entrances. Interestingly PLT administration has restored the exploratory and anxiety behavior in OFT (Fig. 2A). There is various underlying factor that could be related to neuronal death such as upregulation of inflammatory, autophagic loss, and oxidative signaling pathways [34, 40]. Oxidative response and autophagy regulate each other under positive and negative feedback loops depending on the differential stressor steadiness [41, 42]. To decipher the underlying factor responsible for PD-like behavioral deficits, we have examined the α-SYN and TH expression. ROT could upregulate and promote the aggregation of α-SYN synthesis independent of the chaperone-mediated lysosomal degradation perse. Further, the pathogenic increase in the α-SYN synthesis and aggregation can initiate autophagic clearance and other antioxidant defense mechanisms [43]. However, the sustained insult led to the failure of the defense mechanism in the form of autophagic loss and compromised antioxidant defense system further causing the α-SYN deposition and loss of TH, ultimately causing dopaminergic neurons degeneration. In line with the above theory of disease, the present also shows the ROT administration led to an increase in the α-SYN and a decrease in the TH in the SNpc. The latter could be related to the deranged antioxidant defense as NRF2, and HO-1 expression was also diminished. PLT by the virtue of its antioxidant potential have managed to restore the NRF2 and HO-1 level and have kept the α-SYN expression in check and maintained the TH activity in mice brain and the SH-SY5Y cells as well (Fig. 3A, B and Fig. 9A). Now if we investigate the probable initial events of ROT exposure causing the deranged antioxidant defense, would be the oxidant load in terms of increased ROS, and deranged MMP. Later also initiating the apoptotic events. PLT has also managed to maintain the MMP and abrogated the ROS, apoptotic-like cell death in the ROT exposed cell as evidenced by the JC-1, DCFDA, and AO/EtBr staining respectively (Figs. 7 and 8). Moreover, ROT treatment increases the expression of Cyt-C and Bax which causes neuronal death while PLT treatment ensures neuroprotection by downregulating proapoptotic factors CytC and Bax (Fig. 4). The PLT has previously also countered oxidative stress under other metabolic stress such as palmitic acid [44]. They reported that PLT has managed to do so by increasing the antioxidative effect via upregulating the NRF2 expression. Supporting the previous report, we have shown an increase in the NRF2, NQO1, and HO-1 expression under the influence of PLT which was found to be markedly decreased due to ROT in mice brain and SH-SY5Y cell line (Figs. 3A and 9).
NRF2 expression is closely related to the p62-mediated autophagy machinery [42, 44, 45]. P62 binds to Keap1 and favors the Nrf2 expression. The cytoplasmic protein p62 performs a variety of jobs, one of which is to serve as a selective receptor for the breakdown of ubiquitinated substrates. However, various pieces of evidence also support the idea of NRF2 increasing the p62 expression. Thus, a regulatory loop between two significant signaling pathways is created. NRF2 is needed for the autophagy functioning under oxidative stress whereas later also ensures precise functioning of autophagy and oxidative stress under the triangle feedback loop containing AMP (Adenosine Mono Phosphate)-activated protein kinase (AMPK) and mTOR. Under consistent stress, mTOR-NRF2 led to a double-negative feedback loop causing cell death instead of survival [41, 42, 46]. Previously, PLT by increasing the NRF2 through AMPK-mTOR mediated autophagy has decreased multiple sclerosis-associated neuroinflammation [47]. ROT causing inefficient autophagic clearance in a dose-dependent manner before leading to cell death has been reported previously [25, 26]. In the present study, continuous ROT exposure has blocked the autophagic-antioxidant axis function as the decrease in Atg5, Atg7, and Beclin, increase in the p62, mTOR, and lipidated LC3B expression were observed in the brain and SH-SY5Y cells as well. PLT treatment has restored the autophagic machinery by negatively regulating the p62 expression and mTOR phosphorylation. Later positively regulates Atg5, Atg7, and Beclin expression in ROT-treated mice (Figs. 5 and 10). It has been reported that Atg5 and Atg7 are essential for the induction of autophagy in mammalians while mice and rats lacking Atg5 or Atg7 perform autophagic protein degradation. The above reasoning supports the fact that PLT decreases the α-SYN deposition by maintaining the autophagic machinery. From the above discussion, we can conclude that PLT has provided neuroprotection in a multifaceted way. PLT alleviated oxidative damage and cell death. It has also maintained the autophagy mechanism in the experimental model of ROT-induced PD in mice, and the SH-SY5Y cell line as well.
Concluding remarks
Oxidative stress-autophagy has an indispensable role to play in the pathophysiology of ROT-induced PD. Referring to the above evidence, we can say that reinstating autophagy can emerge as a potential treatment option for PD. Increased autophagy offers neuroprotection against the toxic effects of ROT by increasing the clearance of pathologic α-SYN deposition. Phloretin, a hydrogenated natural product and a derivative of chalcone has modulated the autophagy-oxidative stress crosstalk via the mTOR /NRF2/p62 axis. Phloretin restored locomotive activity and reduced anxiety behavior in ROT-treated mice. Furthermore, it also reduced the expression of proapoptotic mediators and increased the antioxidant defense in the mice and SH-SY5Y cells.
ACKNOWLEDGMENTS
The authors would like to acknowledge the financial support provided by the Department of Pharmaceuticals, Ministry of Chemicals and Fertilizers, Government of India for carrying out the present research work.
Authors’ disclosures available online (https://www.j-alz.com/manuscript-disclosures/22-0793r2).
REFERENCES
[1] | Deng H , Wang P , Jankovic J ((2018) ) The genetics of Parkinson disease. Ageing Res Rev 42: , 72–85. |
[2] | Schapira AHV , Chaudhuri KR , Jenner P ((2017) ) Non-motor features of Parkinson disease. Nat Rev Neurosci 18: , 435–450. |
[3] | Betarbet R , Canet-Aviles RM , Sherer TB , Mastroberardino PG , McLendon C , Kim J-H , Lund S , Na H-M , Taylor G , Bence NF ((2006) ) Intersecting pathways to neurodegeneration in Parkinson’s disease: Effects of the pesticide rotenone on DJ-1, α-synuclein, and the ubiquitin–proteasome system. Neurobiol Dis 22: , 404–420. |
[4] | Jellinger KA ((1991) ) Pathology of Parkinson’s disease. Mol Chem Neuropathol 14: , 153–197. |
[5] | Vedam-Mai V ((2021) ) Harnessing the immune system for the treatment of Parkinson’s disease. Brain Res 1758: , 147308. |
[6] | Wu J , Lim E-C , Nadkarni NV , Tan E-K , Kumar PM ((2019) ) The impact of levodopa therapy-induced complications on quality of life in Parkinson’s disease patients in Singapore. Sci Rep 9: , 9248. |
[7] | Khatri DK , Preeti K , Tonape S , Bhattacharjee S , Patel M , Shah S , Singh PK , Srivastav S , Gugulothu D , Vora L , Singh SB ((2022) ) Nanotechnological advances for nose to brain delivery of therapeutics to improve the Parkinson therapy. Curr Neuropharmacol. doi: 10.2174/1570159X20666220507022701. |
[8] | Khatri DK , Choudhary M , Sood A , Singh SB ((2020) ) Anxiety: An ignored aspect of Parkinson’s disease lacking attention. Biomed Pharmacother 131: , 110776. |
[9] | Singh A , Tripathi P , Yadawa AK , Singh S ((2020) ) Promising polyphenols in Parkinson’s disease therapeutics. Neurochem Res 45: , 1731–1745. |
[10] | Kujawska M , Jodynis-Liebert J ((2018) ) Polyphenols in Parkinson’s disease: A systematic review of in vivo studies. Nutrients 10: , 642. |
[11] | Bacci A , Runfola M , Sestito S , Rapposelli S ((2021) ) Beyond antioxidant effects: Nature-based templates unveil new strategies for neurodegenerative diseases. Antioxidants 10: , 367. |
[12] | Liu C , Liu Z , Zhang Z , Li Y , Fang R , Li F , Zhang J ((2020) ) A scientometric analysis and visualization of research on Parkinson’s disease associated with pesticide exposure. Front Public Health 8: , 91. |
[13] | Choi BY ((2019) ) Biochemical basis of anti-cancer-effects of phloretin—A natural dihydrochalcone. Molecules 24: , 278. |
[14] | Mariadoss AVA , Vinyagam R , Rajamanickam V , Sankaran V , Venkatesan S , David E ((2019) ) Pharmacological aspects and potential use of phloretin: A systemic review. Mini Rev Med Chem 19: , 1060–1067 . |
[15] | Un H , Ugan RA , Gurbuz MA , Bayir Y , Kahramanlar A , Kaya G , Cadirci E , Halici Z ((2021) ) Phloretin and phloridzin guard against cisplatin-induced nephrotoxicity in mice through inhibiting oxidative stress and inflammation. Life Sci 266: , 118869. |
[16] | Behzad S , Sureda A , Barreca D , Nabavi SF , Rastrelli L , Nabavi SM ((2017) ) Health effects of phloretin: From chemistry to medicine. Phytochem Rev 16: , 527–533. |
[17] | Arokia Vijaya Anand M , Ramachandran V , Xu B , Karthikumar V , Vijayalakshmi S , Shalini V , Sandya Rani B , Sadiq AM , Ernest D ((2019) ) Phloretin loaded chitosan nanoparticles enhance the antioxidants and apoptotic mechanisms in DMBA induced experimental carcinogenesis. Chem Biol Interact 308: , 11–19. |
[18] | Han Y , Wang T , Li C , Wang Z , Zhao Y , He J , Fu L , Han B ((2021) ) Ginsenoside Rg3 exerts a neuroprotective effect in rotenone-induced Parkinson’s disease mice via its anti-oxidative properties. Eur J Pharmacol 909: , 174413. |
[19] | Gundu C , Arruri VK , Sherkhane B , Khatri DK , Singh SB ((2022) ) Indole-3-propionic acid attenuates high glucose induced ER stress response and augments mitochondrial function by modulating PERK-IRE1-ATF4-CHOP signalling in experimental diabetic neuropathy. Arch Physiol Biochem. doi: 10.1080/13813455.2021.2024577. |
[20] | Arruri VK , Gundu C , Kalvala AK , Sherkhane B , Khatri DK , Singh SB ((2022) ) Carvacrol abates NLRP3 inflammasome activation by augmenting Keap1/Nrf-2/p62 directed autophagy and mitochondrial quality control in neuropathic pain. Nutr Neurosci 25: , 1731–1746. |
[21] | Wang Y , Wen J , Almoiliqy M , Wang Y , Liu Z , Yang X , Lu X , Meng Q , Peng J , Lin Y ((2021) ) Sesamin protects against and ameliorates rat intestinal ischemia/reperfusion injury with involvement of activating Nrf2/HO-1/NQO1 signaling pathway. Oxid Med Cell Longev 2021: , 5147069. |
[22] | Chen Y , Chen C , Song D , Liu T , Cheng O ((2021) ) Dexmedetomidine protects SH-SY5Y cells against MPP+-induced declining of mitochondrial membrane potential and cell cycle deficits. Eur J Neurosci 54: , 4141–4153. |
[23] | Zhang Q , Zhang J , Liu B , Wei J ((2022) ) Licochalcone E inhibits trxR1 expression, alters Nrf2/STAT6 signal, and induces antitumor effects in vitro against human SH-SY5Y and SK-N-BE (2) neuroblastoma cells. Environ Toxicol 37: , 1173–1184. |
[24] | Bhat SA , Sood A , Shukla R , Hanif K ((2019) ) AT2R activation prevents microglia pro-inflammatory activation in a NOX-dependent manner: Inhibition of PKC activation and p47 phox phosphorylation by PP2A. Mol Neurobiol 56: , 3005–3023. |
[25] | Mader BJ , Pivtoraiko VN , Flippo HM , Klocke BJ , Roth KA , Mangieri LR , Shacka JJ ((2012) ) Rotenone inhibits autophagic flux prior to inducing cell death. ACS Chem Neurosci 3: , 1063. |
[26] | Xiong N , Xiong J , Jia M , Liu L , Zhang X , Chen Z , Huang J , Zhang Z , Hou L , Luo Z , Ghoorah D , Lin Z , Wang T ((2013) ) The role of autophagy in Parkinson’s disease: Rotenone-based modeling. Behav Brain Funct 9: , 13. |
[27] | Geohagen BC , Korsharskyy B , Vydyanatha A , Nordstroem L , LoPachin RM ((2018) ) Phloretin cytoprotection and toxicity. Chem Biol Interact 296: , 117. |
[28] | Reza A , Natanzi E , Mahmoudian S , Minaeie B , Sabzevari O ((2011) ) Hepatoprotective activity of phloretin and hydroxychalcones against Acetaminophen Induced hepatotoxicity in mice. Iran J Pharm Sci 7: , 89–97. |
[29] | Sherer TB , Kim JH , Betarbet R , Greenamyre JT ((2003) ) Subcutaneous rotenone exposure causes highly selective dopaminergic degeneration and α-synuclein aggregation. Exp Neurol 179: , 9–16. |
[30] | Cannon JR , Tapias V , Na HM , Honick AS , Drolet RE , Greenamyre JT ((2009) ) A highly reproducible rotenone model of Parkinson’s disease. Neurobiol Dis 34: , 279. |
[31] | Inden M , Kitamura Y , Tamaki A , Yanagida T , Shibaike T , Yamamoto A , Takata K , Yasui H , Taira T , Ariga H ((2009) ) Neuroprotective effect of the antiparkinsonian drug pramipexole against nigrostriatal dopaminergic degeneration in rotenone-treated mice. Neurochem Int 55: , 760–767. |
[32] | Tapias V , McCoy JL , Greenamyre JT ((2019) ) Phenothiazine normalizes the NADH/NAD+ ratio, maintains mitochondrial integrity and protects the nigrostriatal dopamine system in a chronic rotenone model of Parkinson’s disease. Redox Biol 24: , 101164. |
[33] | Schapira AH , Jenner P ((2011) ) Etiology and pathogenesis of Parkinson’s disease. Mov Disord 26: , 1049–1055. |
[34] | Alabi AO , Ajayi AM , Ben-Azu B , Bakre AG , Umukoro S ((2019) ) Methyl jasmonate abrogates rotenone-induced parkinsonian-like symptoms through inhibition of oxidative stress, release of pro-inflammatory cytokines, and down-regulation of immnopositive cells of NF-κB and α-synuclein expressions in mice. Neurotoxicology 74: , 172–183. |
[35] | Zhang G , Yang G , Liu J ((2019) ) Phloretin attenuates behavior deficits and neuroinflammatory response in MPTP induced Parkinson’s disease in mice. Life Sci 232: , 116600. |
[36] | Zhang J , Sun B , Yang J , Chen Z , Li Z , Zhang N , Li H , Shen L ((2022) ) Comparison of the effect of rotenone and 1-methyl-4-phenyl-1, 2, 3, 6-tetrahydropyridine on inducing chronic Parkinson’s disease in mouse models. Mol Med Rep 25: , 91. |
[37] | Khatri DK , Juvekar AR ((2016) ) Neuroprotective effect of curcumin as evinced by abrogation of rotenone-induced motor deficits, oxidative and mitochondrial dysfunctions in mouse model of Parkinson’s disease. Pharmacol Biochem Behav 150: , 39–47. |
[38] | Rao SV , Hemalatha P , Yetish S , Muralidhara M , Rajini PS ((2019) ) Prophylactic neuroprotective propensity of Crocin, a carotenoid against rotenone induced neurotoxicity in mice: Behavioural and biochemical evidence. Metab Brain Dis 34: , 1341–1353. |
[39] | Fewou SN , Röckle I , Hildebrandt H , Eckhardt M ((2019) ) Transgenic overexpression of polysialyltransferase ST8SiaIV under the control of a neuron-specific promoter does not affect brain development but impairs exploratory behavior. Glycobiology 29: , 657–668. |
[40] | Blesa J , Phani S , Jackson-Lewis V , Przedborski S ((2012) ) Classic and new animal models of Parkinson’s disease. J Biomed Biotechnol 2012: , 845618. |
[41] | Kapuy O , Papp D , Vellai T , Bánhegyi G , Korcsmáros T ((2018) ) Systems-level feedbacks of NRF2 controlling autophagy upon oxidative stress response. Antioxidants (Basel) 7: , 39. |
[42] | Hayashi K , Dan K , Goto F , Tshuchihashi N , Nomura Y , Fujioka M , Kanzaki S , Ogawa K ((2015) ) The autophagy pathway maintained signaling crosstalk with the Keap1–Nrf2 system through p62 in auditory cells under oxidative stress. Cell Signal 27: , 382–393. |
[43] | Sala G , Arosio A , Stefanoni G , Melchionda L , Riva C , Marinig D , Brighina L , Ferrarese C ((2013) ) Rotenone upregulates alpha-synuclein and myocyte enhancer factor 2D independently from lysosomal degradation inhibition. Biomed Res Int 2013: , 846725. |
[44] | Yang Q , Han L , Li J , Xu H , Liu X , Wang X , Pan C , Lei C , Chen H , Lan X ((2019) ) Activation of Nrf2 by phloretin attenuates palmitic acid-induced endothelial cell oxidative stress via AMPK-dependent signaling. J Agric Food Chem 67: , 120–131. |
[45] | ParkJ-Y, SohnH-Y, Ho KohY, JoC (123AD) Curcumin activates Nrf2 through PKCδ-mediated p62 phosphorylation at Ser351. Sci Rep 11: , 8430. |
[46] | Tang Z , Hu B , Zang F , Wang J , Zhang X , Chen H ((2019) ) Nrf2 drives oxidative stress-induced autophagy in nucleus pulposus cells via a Keap1/Nrf2/p62 feedback loop to protect intervertebral disc from degeneration. Cell Death Dis 10: , 510. |
[47] | Dierckx T , Haidar M , Grajchen E , Wouters E , Vanherle S , Loix M , Boeykens A , Bylemans D , Hardonnière K , Kerdine-Römer S , Bogie JFJ , Hendriks JJA ((2021) ) Phloretin suppresses neuroinflammation by autophagy-mediated Nrf2 activation in macrophages. J Neuroinflammation 18: , 148. |


