
Cognitive Heterogeneity and Risk of Progression in Data-Driven Subtle Cognitive Decline Phenotypes
Abstract
Background:
There is increasing recognition of cognitive and pathological heterogeneity in early-stage Alzheimer’s disease and other dementias. Data-driven approaches have demonstrated cognitive heterogeneity in those with mild cognitive impairment (MCI), but few studies have examined this heterogeneity and its association with progression to MCI/dementia in cognitively unimpaired (CU) older adults.
Objective:
We identified cluster-derived subgroups of CU participants based on comprehensive neuropsychological data and compared baseline characteristics and rates of progression to MCI/dementia or a Dementia Rating Scale (DRS) of ≤129 across subgroups.
Methods:
Hierarchical cluster analysis was conducted on individual baseline neuropsychological test scores from 365 CU participants in the UCSD Shiley-Marcos Alzheimer’s Disease Research Center longitudinal cohort. Cox regressions examined the risk of progression to consensus diagnosis of MCI or dementia, or to DRS score ≤129, by cluster group.
Results:
Cluster analysis identified 5 groups: All-Average (n = 139), Low-Visuospatial (n = 46), Low-Executive (n = 51), Low-Memory/Language (n = 83), and Low-All Domains (n = 46). Subgroups had unique demographic and clinical characteristics. Rates of progression to MCI/dementia or to DRS ≤129 were faster for all subgroups (Low-All Domains progressed the fastest > Low Memory/Language≥Low-Visuospatial and Low-Executive) relative to the All-Average subgroup.
Conclusion:
Faster progression in the Low-Visuospatial, Low-Executive, and Low-Memory/Language groups compared to the All-Average group suggests that there are multiple pathways and/or unique subtle cognitive decline profiles that ultimately lead to a diagnosis of MCI/dementia. Use of comprehensive neuropsychological test batteries that assess several domains may be a key first step toward an individualized approach to early detection and fewer missed opportunities for early intervention.
INTRODUCTION
Although Alzheimer’s disease (AD) research has moved toward earlier detection [1], our understanding of cognitive heterogeneity within the pre-mild cognitive impairment (MCI) phase or early stages of the AD continuum remains underdeveloped. Statistical data-driven approaches such as cluster analysis or latent profile analysis applied to neuropsychological test data have identified multiple mild cognitive impairment (MCI) subtypes [2–8] beyond the traditional amnestic/nonamnestic distinction [9, 10]. In various studies, amnestic (i.e., predominant memory impairment) [2, 5–8], dysnomic (i.e., predominant language impairment) [2, 6, 7], dysexecutive (i.e., predominant attention/executive functioning impairment, often with concurrent memory difficulties) [2, 6, 7], and mixed/multidomain MCI subtypes [3, 5, 8] have emerged. These empirically-derived MCI subtypes can have unique associations with cerebrospinal fluid and neuroimaging biomarkers, as well as different trajectories of functional decline and risk of dementia [2, 4, 11, 12]. Overall, data-driven methods outperform conventional methods of diagnosis in capturing individuals with MCI who have positive (i.e., abnormal) AD biomarkers, progress to dementia, or have AD pathology at autopsy [3].
Few studies have specifically examined the heterogeneity of cognitive performance within cognitively unimpaired (CU) individuals to determine if there are specific cognitive phenotypes that have increased risk of developing MCI and dementia. Studies that have examined combined CU and MCI participants in analyses have typically only classified CU participants into high- and low- average cognition groups [3, 6, 13] or into a single “subtle cognitive impairment” group [7]. An exception is a recent study that used a statistical approach to classify CU participants into cognitive phenotypic groups and then examined the association of these subtypes with modifiable vascular, physical activity, and diet factors [14]. This approach identified high-average and average groups, as well as Low-Memory and Low-Executive groups [14]. However, this study did not examine longitudinal outcomes and, to our knowledge, no studies focusing only on CU participants have longitudinally examined the impact of cognitive phenotypes on rates of progression to MCI/dementia. Therefore, the aim of our study was to identify cluster-derived groups of CU participants based on comprehensive neuropsychological test data and to compare their baseline characteristics and rates of progression to MCI/dementia.
METHODS
Participants
Participants included 365 CU individuals (i.e., without a consensus diagnosis of MCI, “impaired not MCI,” or dementia), aged 50+, who were enrolled in the longitudinal study at the University of California San Diego (UCSD) Shiley-Marcos Alzheimer’s Disease Research Center (ADRC). Inclusion criteria included stable health status, English- or Spanish-speaking, available study partner, and no history of major stroke/neurologic condition, severe psychiatric illness, substance abuse, or learning disability. Participants diagnosed with “impaired, not MCI”, MCI, or dementia at baseline were excluded from the current study. Participants completed the neuropsychological testing in their preferred language of English or Spanish. The protocol was reviewed and approved by the UCSD institutional review board. Written informed consent to participate in the study was obtained from all participants or a designated caregiver.
Neuropsychological measures
Individual neuropsychological measures from participants’ baseline visit representing the domains of memory (California Verbal Learning Test (CVLT) or CVLT-II Learning Trials 1–5; CVLT or CVLT-II Long Delay Free Recall; Wechsler Memory Scale-Revised [WMS-R] Logical Memory Delay), language (Boston Naming Test [BNT] or Multilingual Naming Test [MINT]; Category Fluency [animals, fruits, vegetables]; Letter Fluency [F, A, S];), processing speed and executive functioning (Trail Making Test Parts A and B; modified Wisconsin Card Sorting Test [WCST] categories completed), and visuospatial functioning (Block Design; Clock Drawing Test [CDT] command) were included in the cluster analysis. Consistent with our previous work, prior to analyses, each raw test score was converted to a demographically-adjusted (age, sex/gender, education) z-score [3]. Z-scores were determined based on the difference between the observed score and expected score divided by the standard error of measurement. Regression coefficients to determine the expected score were derived from a subset of the larger UCSD Shiley-Marcos ADRC sample who were considered to be robust CU participants. These robust CU participants (n = 355) had at least 1 year of follow-up data (mean follow up = 6.6 [SD = 5.6] years) and were considered CU via consensus diagnosis for the duration of their participants in the ADRC study. The robust CU participants were demographically well-matched to the participants in the current study (mean age = 71.6 years [SD = 8.5]; mean education = 14.9 years [SD = 3.7]; 59.4% female; 92.1% White).
Outcome measures
As part of the research protocol, participants completed annual clinical, neurologic, and neuropsychological evaluations [15, 16]. Clinical status (CU, MCI, or dementia) was determined at each visit based on a multidisciplinary (2 neurologists and a neuropsychologist) consensus diagnosis [3]. In addition to longitudinal clinical diagnosis, an outcome of Dementia Rating Scale (DRS) score ≤129 [17] was also examined given that a consensus diagnosis of MCI or dementia may be more heavily weighted for memory impairment and may not be as sensitive to capturing progression of nonamnestic profiles.
Analyses
A hierarchical cluster analysis was conducted on individual neuropsychological z-scores at baseline for all CU participants. Next, a discriminate function analysis was conducted to test whether the individual neuropsychological measures could predict cluster-group membership. Analysis of variance and χ2 tests compared cluster-derived groups on baseline demographic and clinical characteristics including: age, sex/gender (male or female), educational level, race, and ethnicity (Hispanic or non-Hispanic); Mini-Mental State Exam (MMSE) and DRS for general cognition; presence of a subjective memory complaint (yes or no); Apolipoprotein E (APOE) ɛ4 carrier status (carrier or noncarrier), history of diabetes (yes or no) and hypertension (yes or no); Functional Activities Questionnaire (FAQ) [18] and Clinical Dementia Rating – Sum of Boxes (CDR-SB) [19] to measure everyday functioning; and the specific neuropsychological test z-scores.
Cox regression adjusting for age, education, sex/gender, and ethnicity (Hispanic or non-Hispanic) determined the risk of progression to (a) consensus diagnosis of MCI or dementia, or (b) a DRS score ≤129 within an average of 6.25 years (range 1–20 years) by cluster group. Kaplan-Meier curves were used to depict the rate of progression to MCI/dementia or DRS score ≤129 over time. Follow-up time was restricted to 20 years or less given the low number of participants with data after 20 years (n = 8). Participants who did not progress to MCI/dementia or DRS score ≤129 during their follow-up period were censored at their last visit.
RESULTS
The following sample characteristics were observed across all participants: mean age = 71.93 (SD = 7.51) years; mean education = 15.44 (SD = 3.15) years; 55.9% female; 93.4% White; and 15.6% Hispanic/Latino/a/x/e. Cluster analysis resulted in 5 cognitive groups: 1) All-Average (n = 139), with mean performance in the average-to-above average range (i.e., mean z-score near 0 or above) in all domains; 2) Low-Visuospatial (n = 46), with low performances (i.e., mean z-score near –1 or below) on Block Design and the CDT; 3) Low-Executive (n = 51), with low performances on Trails B, WCST, and Block Design; 4) Low-Memory/Language (n = 83), with low performances on measures of memory and verbal fluency; and 5) Low-All Domains (n = 46), with low performances on the majority of tests examined (see Fig. 1). Notably, the Low-Visuospatial, Low-Executive, and Low-All Domains groups all showed low performances on Block Design, likely due to the complexity of this task requiring visuoperceptual abilities in combination with the need to efficiently plan and construct the correct block design within the time limit. A discriminant function analysis using the neuropsychological measures to predict group membership into these 5 clusters correctly classified 85.2% of the participants. A 4-cluster solution from the cluster analysis was also examined in which the Low-Executive group and the Low-Memory/Language groups were collapsed into 1 group (n = 134) while the three other groups (All-Average, Low-Visuospatial, Low-All Domains) remained consistent in both the 4- and 5-cluster solution. A discriminant function analysis predicting group membership into the 4 clusters correctly classified 85.5% of the participants. Given the potential utility of identifying a Low-Executive group, including whether there are unique characteristics or rate of progression of those with low executive functioning, we chose to focus on the 5-cluster solution.
Fig. 1
Baseline neuropsychological scores across the cluster-derived groups of cognitively unimpaired participants. Mean neuropsychological domain scores, rather than individual scores, are used for the figure only: Memory (CVLT Learning and Delay, Logical Memory Delay), Language (BNT/MINT, Category Fluency, Letter Fluency), Processing Speed (Trails A), Executive Functioning (Trails B, WCST Categories), Visuospatial (Block Design, CDT Command).
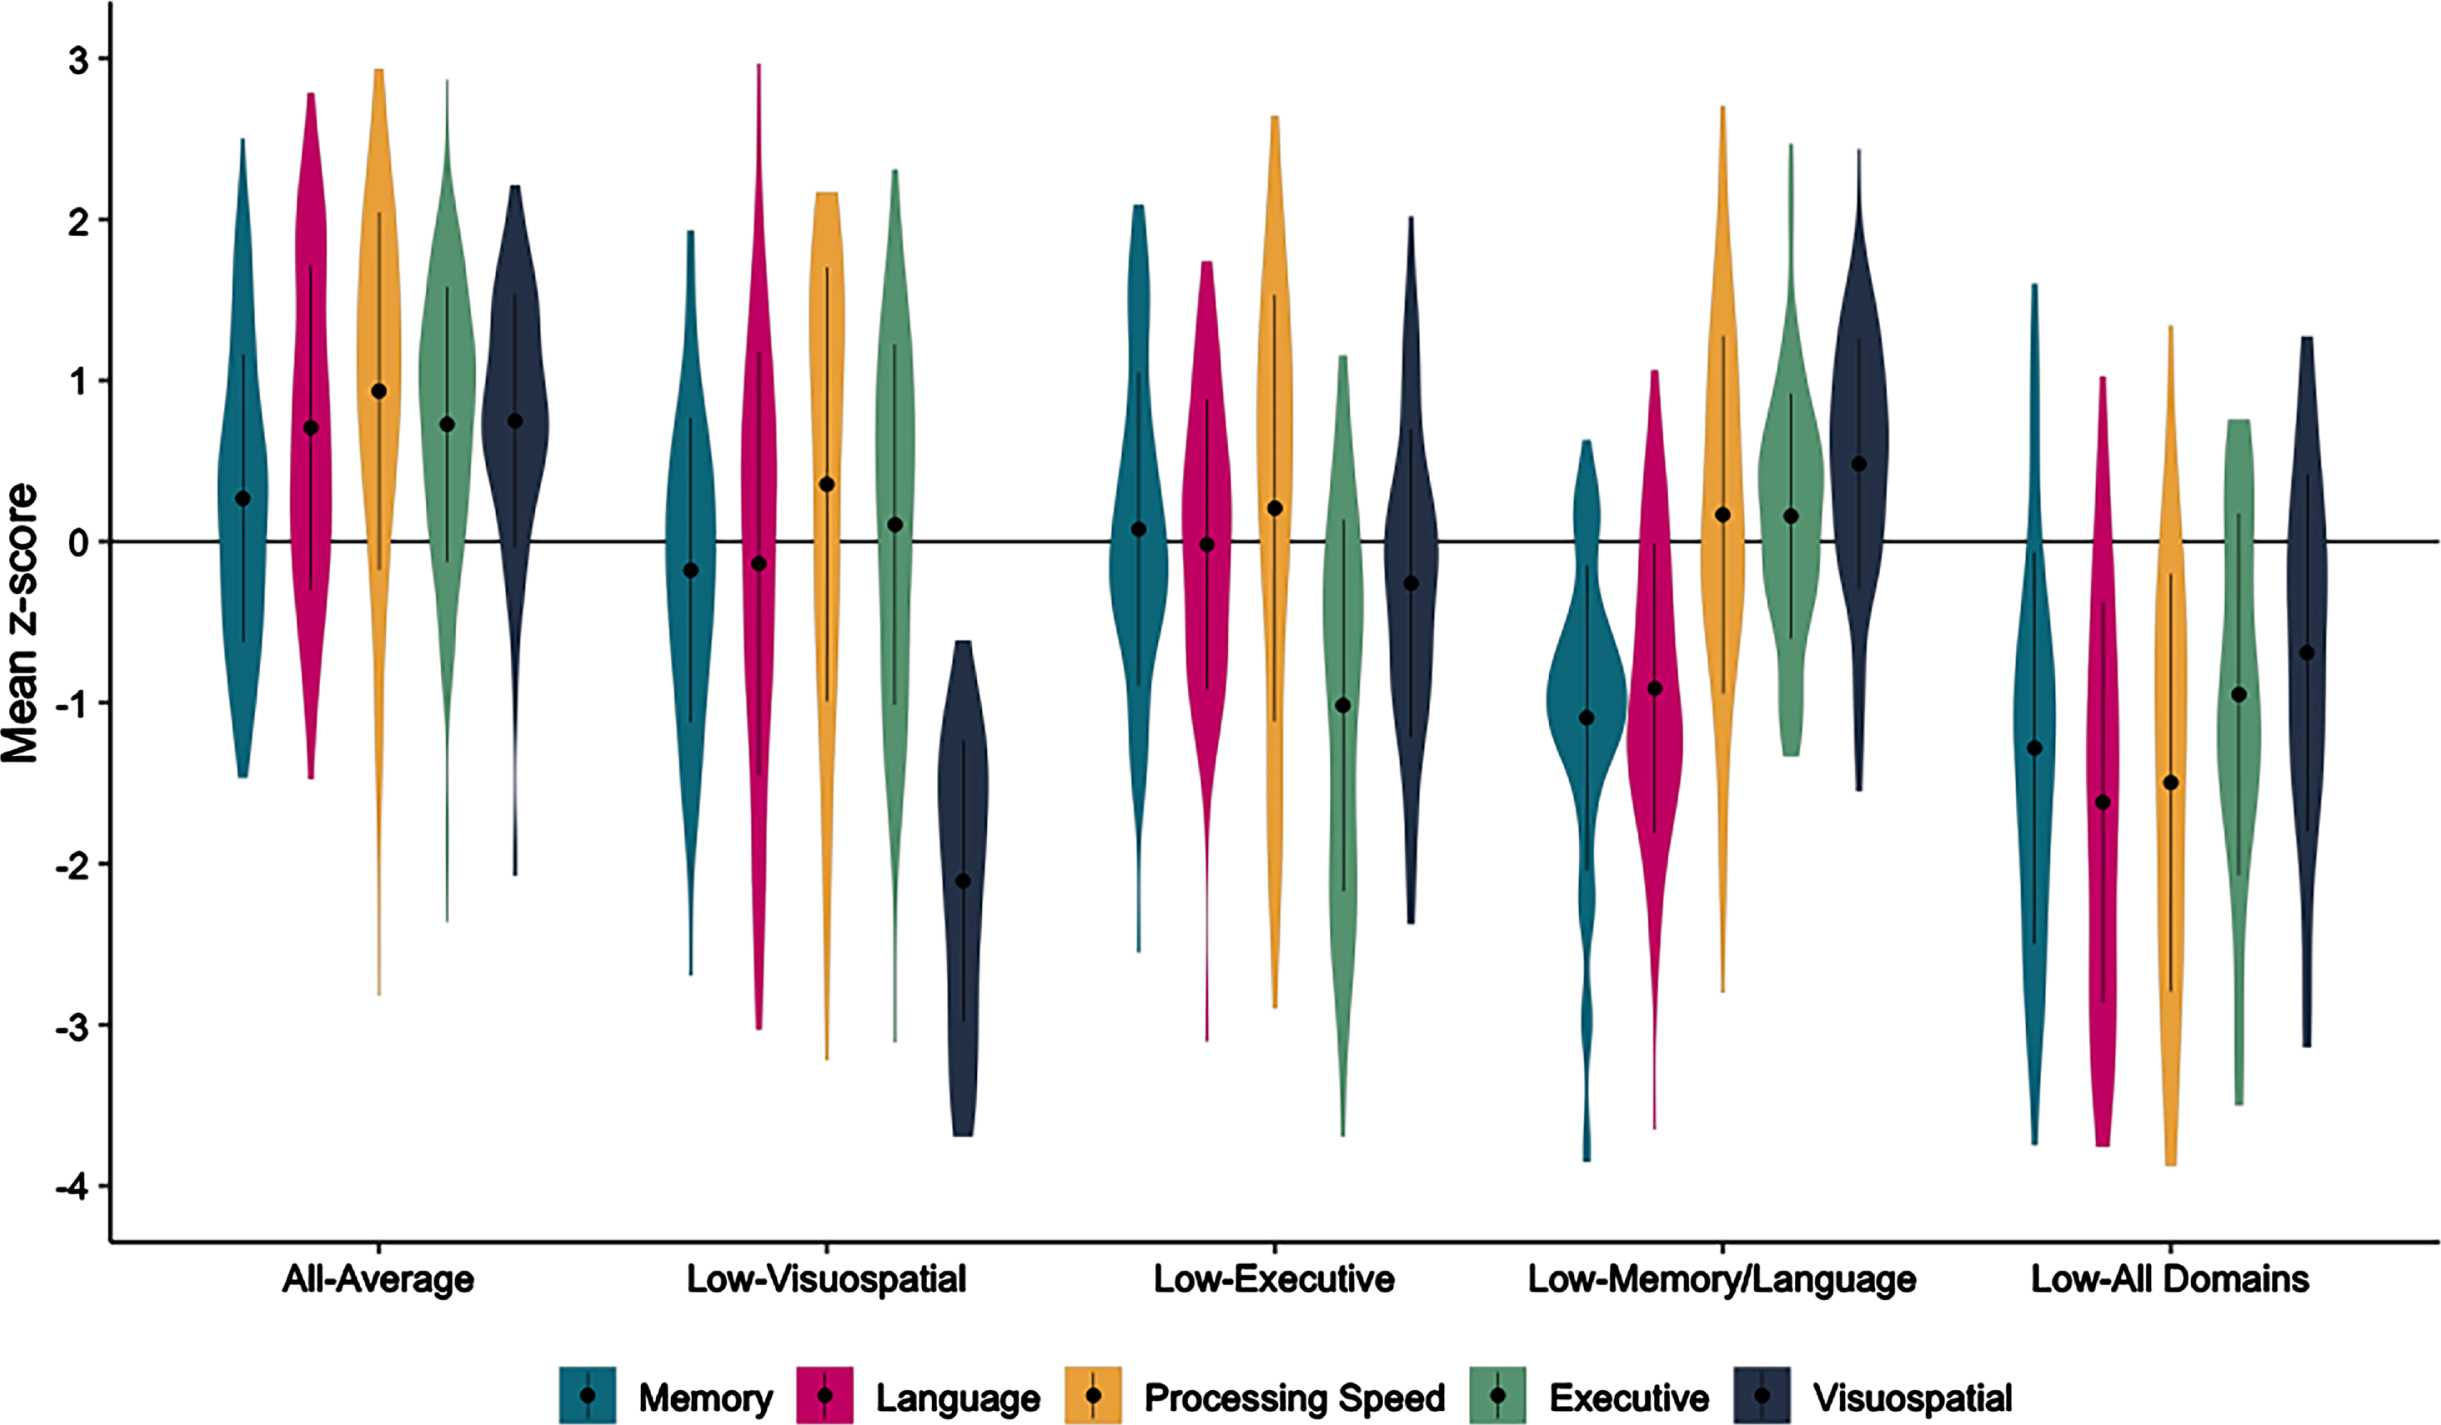
Table 1 shows the demographic, clinical characteristics, and specific mean neuropsychological test scores by cluster-derived group. Briefly, groups did not significantly differ on age, proportion of participants tested in Spanish, or diabetes status. The All-Average group had the highest proportion of APOE ɛ4 carriers yet performed the best on the MMSE and DRS at baseline. The Low-Visuospatial group had the fewest years of education and were more likely to be female and Hispanic/Latino/a/x/e. The Low-Executive group had the most difficulty in everyday functioning. The Low-Memory/Language group had the greatest proportion of participants with a subjective memory complaint and had a slightly longer duration of follow-up. The Low-All Domains group was more likely to be non-White (2.2% Black/African American, 6.5% Asian, 6.5% other race) and have a history of hypertension.
Table 1
Baseline demographic, clinical, neuropsychological, and biomarker characteristics of the cluster-derived groups
| All-Average (n = 139) | Low-Visuospatial (n = 46) | Low-Executive (n = 51) | Low-Memory/Language (n = 83) | Low-All Domains (n = 46) | F or χ2 | Effect Size | p | |
| Age | 71.67 (7.15) | 70.93 (7.60) | 71.65 (8.07) | 72.23 (7.66) | 73.50 (7.67) | F = 0.80 |
| p = 0.529 |
| Education | 15.56 (2.98)b | 14.48 (2.76)ad | 15.02 (3.43)d | 16.18 (3.40)bc | 15.17 (2.97) | F = 2.63 |
| p = 0.034 |
| Female, % | 55.4% b | 73.9% acd | 43.1% b | 53.0% b | 58.7% | χ2 = 9.87 | φc = 0.16 | p = 0.043 |
| White, % | 96.4% e | 91.3% | 92.2% | 95.2% e | 84.8% ad | χ2 = 8.49 | φc = 0.15 | p = 0.075 |
| Hispanic, % | 7.2% be | 34.8% ad | 21.6% a | 13.3% b | 19.6% a | χ2 = 22.57 | φc = 0.25 | p < 0.001 |
| Tested in Spanish, % | 0.0% | 2.2% | 2.0% | 0.0% | 2.2% | χ2 = 4.75 | φc = 0.11 | p = 0.314 |
| APOE ɛ4 carrier, % (n) | 40.8% (51/125)c | 25.6% (10/39) | 21.4% (9/42)c | 29.2% (21/72) | 28.6% (10/35) | χ2 = 7.74 | φc = 0.16 | p = 0.102 |
| Diabetes, % | 6.5% | 2.3% | 7.8% | 3.7% | 10.9% | χ2 = 4.12 | φc = 0.11 | p = 0.390 |
| Hypertension, % | 36.2% | 28.3% e | 29.4% e | 32.1% e | 50.0% bcd | χ2 = 6.55 | φc = 0.14 | p = 0.162 |
| MMSE | 29.46 (0.90)bde | 29.09 (1.05)a | 29.14 (1.06) | 28.95 (1.29)a | 29.20 (1.09)a | F = 3.62 |
| p = 0.007 |
| DRS | 140.11 (2.96)bcde | 136.93 (4.15)a | 137.33 (5.07)a | 137.32 (5.06)a | 136.04 (4.12)a | F = 13.17 |
| p < 0.001 |
| Subjective memory complaint | 32.8% d | 39.1% | 30.0% d | 49.4% ac | 40.0% | χ2 = 7.58 | φc = 0.15 | p = 0.108 |
| FAQ (n = 186) | 0.36 (0.97)c | 0.12 (0.33)c | 1.52 (4.01)ab | 0.80 (1.74) | 0.43 (0.79) | F = 2.62 |
| p = 0.037 |
| CDR-SB (n = 235) | 0.14 (0.39)c | 0.11 (0.33) | 0.44 (1.44)a | 0.32 (0.65) | 0.32 (0.64) | F = 1.70 |
| p = 0.150 |
| Years of follow-up | 5.55 (4.94)d | 5.78 (5.16) | 6.73 (6.74) | 7.20 (6.21) | 6.61 (5.62) | F = 1.34 |
| p = 0.253 |
| CVLT Learning | 0.30 (1.18)de | 0.05 (1.25)de | 0.27 (1.12)de | –1.06 (1.21)abc | –1.16 (1.47)abc | F = 25.17 |
| p < 0.001 |
| CVLT Delay | 0.26 (1.23)de | –0.14 (1.36)de | 0.25 (1.15)de | –1.13 (1.36)abc | –1.23 (1.62)abc | F = 22.79 |
| p < 0.001 |
| LM Delay | 0.37 (1.08)bcde | –0.45 (1.22)ade | –0.29 (1.33)ade | –1.09 (1.31)abc | –1.36 (1.18)abc | F = 28.57 |
| p < 0.001 |
| BNT/MINT | 0.65 (1.10)bcd | –0.40 (1.73)ae | 0.08 (1.41)ad | –0.40 (1.45)ae | –1.53 (2.57)abcd | F = 19.19 |
| p < 0.001 |
| Category Fluency | 1.05 (2.01)bcde | 0.21 (1.66)acde | –0.59 (1.55)abe | –1.17 (1.81)ab | –1.81 (1.64)abc | F = 32.52 |
| p < 0.001 |
| Letter Fluency | 0.71 (1.87)bde | –0.22 (1.96)ade | 0.45 (1.68)de | –1.16 (1.94)abce | –1.91 (1.70)abcd | F = 25.37 |
| p < 0.001 |
| Trails A | 0.91 (1.23)bcde | 0.36 (1.34)ae | 0.12 (1.46)ae | 0.17 (1.11)ae | –3.03 (3.08)abcd | F = 52.62 |
| p < 0.001 |
| Trails B | 0.96 (1.16)bcde | 0.41 (1.30)acde | –0.79 (1.49)abde | –0.20 (1.18)abce | –2.32 (2.71)abcd | F = 46.10 |
| p < 0.001 |
| WCST Categories | 0.49 (1.13)bce | –0.20 (1.57)acde | –1.37 (2.46)abe | 0.51 (0.91)bce | –0.92 (2.28)abd | F = 19.25 |
| p < 0.001 |
| Block Design | 0.86 (1.21)bce | –1.14 (1.67)ad | –1.35 (1.74)ad | 0.59 (1.39)bce | –1.63 (1.64)ad | F = 47.84 |
| p < 0.001 |
| CDT | 0.64 (1.12)b | –3.20 (1.18)acde | 0.83 (0.50)be | 0.44 (1.18)b | 0.36 (1.44)bc | F = 114.88 |
| p < 0.001 |
Data are summarized as mean (standard deviation), unless otherwise indicated. APOE, apolipoprotein E; MMSE, Mini-Mental State Exam; DRS, Dementia Rating Scale; FAQ, Functional Activities Questionnaire; CDR-SB, Clinical Dementia Rating –Sum of Boxes; CVLT, California Verbal Learning Test; LM, Logical Memory; BNT, Boston Naming Test; MINT, Multilingual Naming Test; CDT, Clock Drawing Test. Superscript indicate differences (p < 0.05) between cluster-group pairwise comparisons. asignificantly different than All-Average; bsignificantly different than Low-Visuospatial; csignificantly different than Low-Executive; dsignificantly different than Low-Memory/Language; esignificantly different than Low-All Domains.
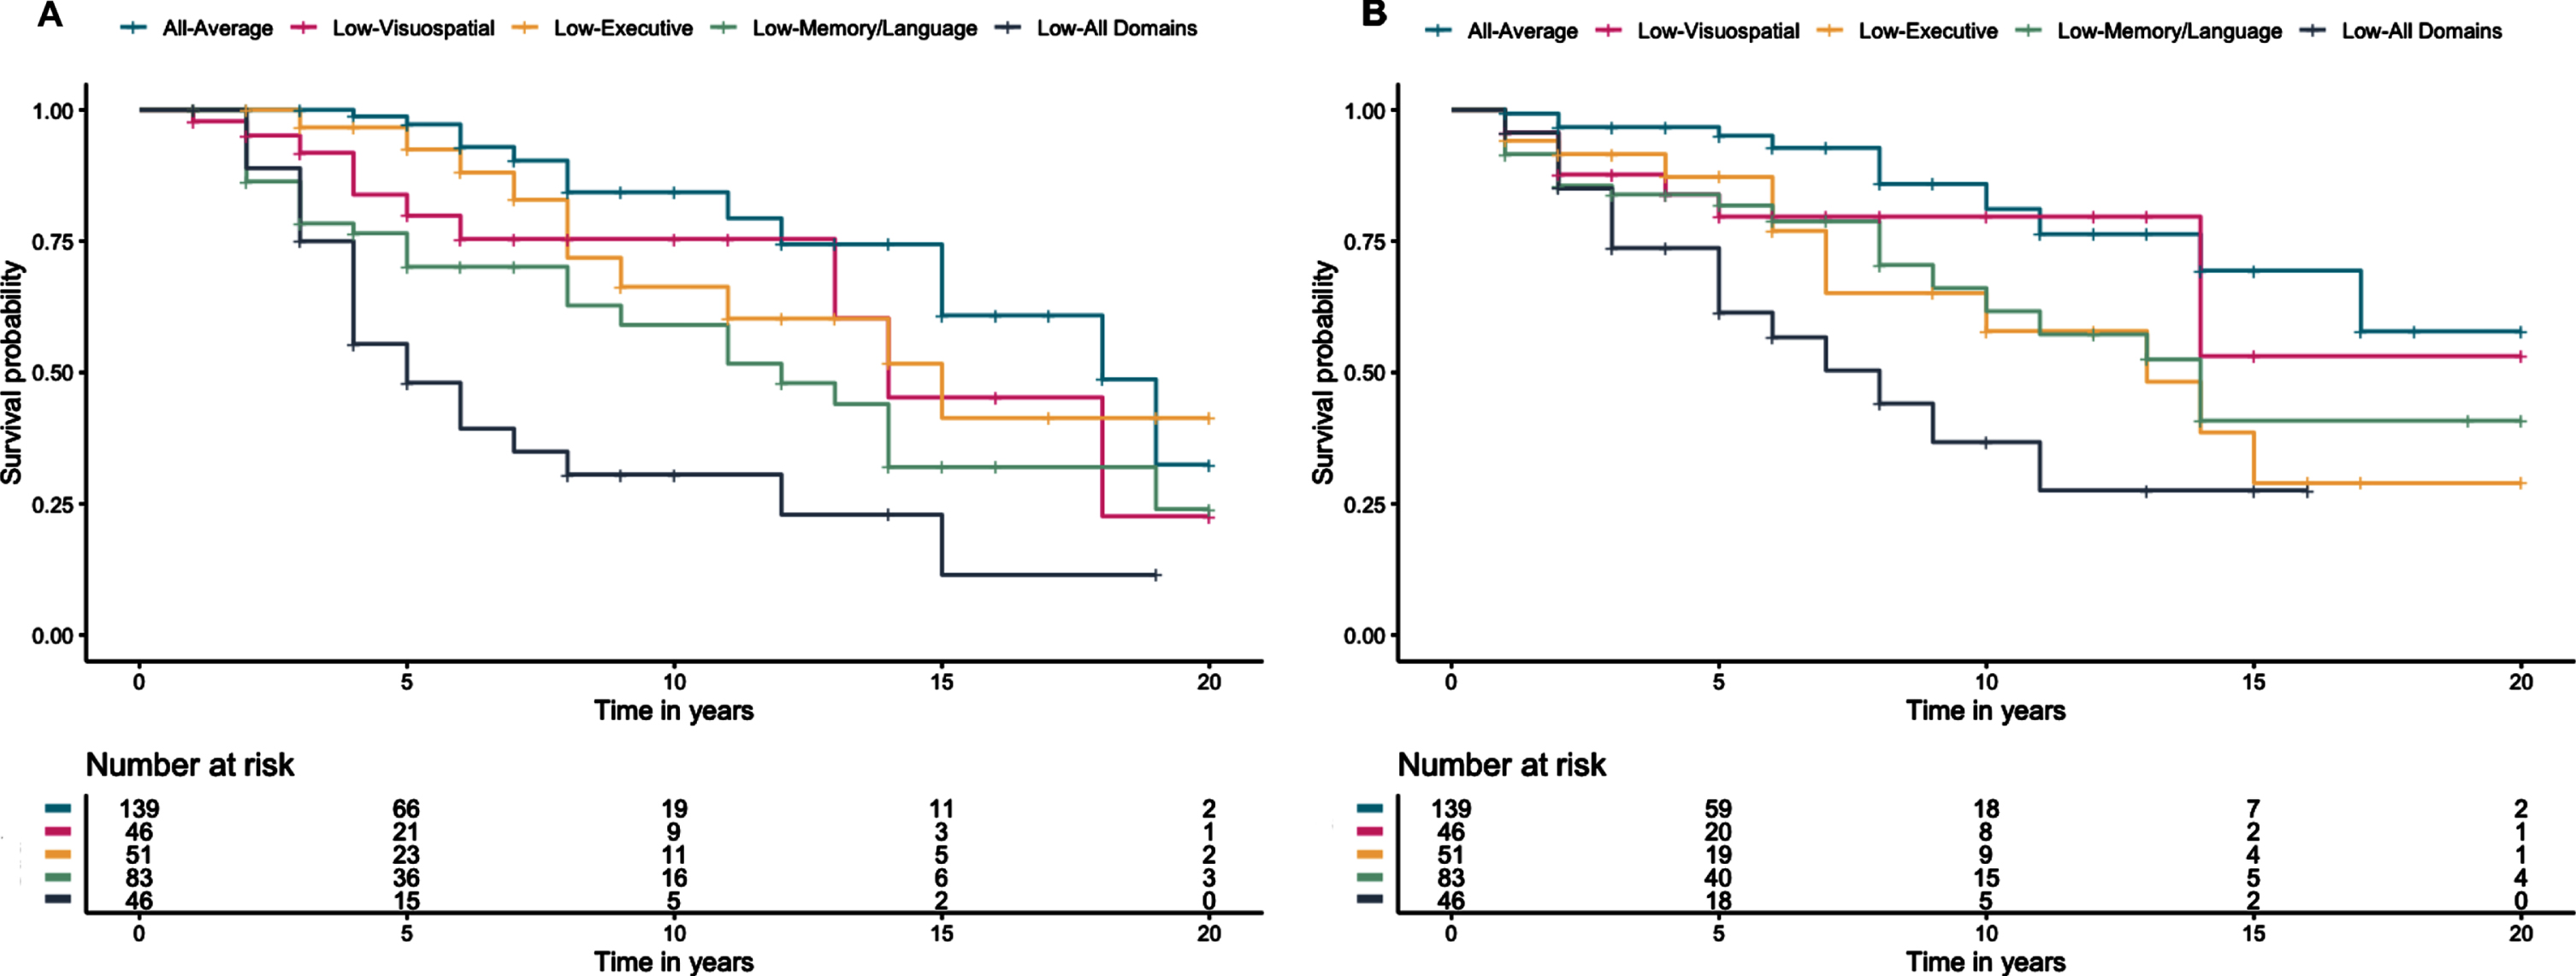
Across the sample, 85 participants progressed from CU to a diagnosis of MCI or dementia over an average of 6.89 years (SD = 4.83). Cox regressions, adjusting for age, education, sex, and ethnicity showed that relative to the All-Average group, the Low-Visuospatial (hazard ratio [HR] 2.39, 95% CI [1.03, 5.56], p = 0.044), Low-Memory/Language (HR 4.37, 95% CI [2.24, 8.51], p < 0.001), and Low-All Domains (HR 7.21, 95% CI [3.59, 14.48], p < 0.001) groups had greater risk of progressing to MCI/dementia. The Low-Executive group was also twice as likely to progress to MCI/dementia compared to the All-Average group, but did not statistically differ (HR 2.03, 95% CI [0.88, 4.70], p = 0.096). Examining all group comparisons, relative to the All-Low Domains group, the Low-Visuospatial (HR 0.33, 95% CI [0.15, 0.71], p = 0.005) and Low-Executive (HR 0.28, 95% CI [0.13, 0.61], p = 0.001) groups were less likely to progress to MCI/dementia, and while the Low-Memory/Language group was also less likely to progress, it did not statistically differ (HR 0.61, 95% CI [0.34, 1.06], p = 0.080). The Low-Executive and Low-Memory/Language groups did not differ from the Low-Visuospatial group, and the Low-Memory/Language group was more likely to progress relative to the Low-Executive group (HR 2.15, 95% CI [1.03, 4.48], p = 0.043).
Across the sample, 73 participants progressed to a DRS score of ≤129 over an average of 5.54 years (SD = 4.47). The pattern was similar to progression to MCI or dementia, with the Low-Memory/Language (HR 3.70, 95% CI [1.80, 7.56], p < 0.001) and Low-All Domains (HR 5.79, 95% CI [2.74, 12.27], p < 0.001) groups at greater risk of progression to a DRS ≤129 than the All-Average group, along with the Low-Executive group (HR 2.82, 95% CI [1.26, 6.29], p = 0.012). The Low-Visuospatial group was also twice as likely to progress to DRS ≤129 compared to the All-Average group, but did not statistically differ (HR 2.02, 95% CI [0.80, 5.06], p = 0.135). Examining all group comparisons, relative to the All-Low Domains group, the Low-Visuospatial (HR 0.35, 95% CI [0.15, 0.82], p = 0.016) was less likely to progress to a DRS ≤129. The Low-Executive (HR 0.49, 95% CI [0.23, 1.02], p = 0.057) and Low-Memory/Language (HR 0.64, 95% CI [0.34, 1.21], p = 0.166) groups were also less likely to progress relative to the All-Low Domains group but did not statistically differ. The Low-Visuospatial, Low-Executive, and Low-Memory/Language groups did not differ from each other on risk of progression to a DRS ≤129. Figure 2 shows the Kaplan Meier curves for rates of progression to MCI/dementia diagnosis and DRS ≤129.
Fig. 2
Kaplan Meier curves for time to (A) progression to consensus MCI/dementia diagnosis and (B) progression to a Dementia Rating Scale score ≤129 since baseline visit.
DISCUSSION
In this study we identified five cluster-derived groups within participants classified as cognitively unimpaired (i.e., without a consensus diagnosis of MCI/dementia). While several of the cluster groups were consistent with those observed in other studies (All-Average, Low-Executive, Low-Memory/Language) [14], Low-Visuospatial and Low-All Domains groups also emerged. The All-Average group was the largest cluster group, as expected for a CU sample, followed by the Low-Memory/Language group, a profile consistent with an early “typical” AD presentation. Across the groups, the Low-All Domains group progressed to MCI/dementia the fastest, and the All-Average group progressed the slowest; the Low-Visuospatial, Low-Executive, and Low-Memory/Language groups progressed at intermediate and similar rates, though the adjusted HRs for the Low-Memory/Language group was higher than both the Low-Visuospatial group and Low-Executive groups and statistically differed from the Low-Executive group for the progression to MCI/dementia outcome. These rates of progression reflect the possibility that there are multiple pathways or initial cognitive symptoms that ultimately lead to greater risk of a diagnosis of MCI/dementia. The pattern of results was similar when a DRS ≤129 threshold was used to assess progression to cognitive impairment, possibly because total DRS score was considered when making the consensus diagnosis. However, on this outcome, the Low-Visuospatial, Low-Executive, and Low-Memory/Language groups did not statistically differ. This suggests that the DRS may be more sensitive to capturing nonamnestic profiles relative to the consensus diagnosis.
Unlike previous studies that sought to derive cognitive subtypes in CU-only participants, our study included visuospatial measures and our results demonstrate the potential value of including these measures in a cognitive test battery when trying to determine whether someone is at increased risk for cognitive decline or progression to MCI/dementia. The Low-Visuospatial group we identified may be consistent with findings from recent work examining the heterogeneity of tau distribution in AD, which identified a group of individuals with a slow-progressing, posterior pattern of tau deposition, likely with predominant visuospatial impairment [20]. Although they had a greater proportion of female and Hispanic/Latino/a/x/e participants than the other groups, importantly, the Low-Visuospatial group was not substantially younger than the Low-Memory/Language group (or any other group), suggesting that it is likely not solely capturing individuals with posterior cortical atrophy which tends to have a younger onset than typical AD [21]. Similarly, the Low-Executive group did not differ from other groups in regard to age and did not progress as quickly as may occur in dysexecutive AD or frontotemporal dementia [22, 23]. However, even within these clusters, there is likely significant heterogeneity of pathologies and future work will need to replicate these clusters and explore underlying AD and non-AD biomarker profiles.
Despite being considered cognitively unimpaired, a cluster group with relatively widespread cognitive weaknesses emerged. This Low-All Domains group performed well on the MMSE and DRS and did not evince particularly high proportions of subjective memory complaints or everyday functioning difficulties (despite greater rates of vascular disease) and this may have contributed to their being classified as CU instead of MCI or dementia by consensus at their initial visit. Additionally, the regression weights used for the z-scores were derived from a robustly normal group, which may have resulted in these z-scores being especially sensitive to subtle weaknesses compared to a standard score based on published norms that generally have a less strict criteria for inclusion into the normative sample. The Low-Memory/Language group had the highest proportion of individuals with a subjective memory complaint, consistent with findings that self-reported memory concerns may emerge in the preclinical phase of AD [24] and be associated with cognitive decline, particularly in an ADRC sample [25]. The Low-Executive group had the worst everyday functioning, though their mean scores on the FAQ and CDR-SB still reflect minimal functional difficulty. This slightly worse functioning, however, is consistent with studies showing that executive function is more strongly associated with real-world instrumental activities of daily living than other cognitive domains [26].
Our study has several strengths including the use of a comprehensive neuropsychological test battery, thorough consensus diagnostic/classification procedures, and the opportunity to examine up to 20 years of longitudinal data on some individuals. One consistent challenge in determining the earliest cognitive changes associated with future declines is the potential for circularity of the predictor (e.g., lower cognitive scores) and the outcome (e.g., MCI/dementia). In the current study, we aimed to work around aspects of this circularity by including two outcome variables (consensus MCI/dementia and DRS score) and, importantly, examining the longitudinal rates of progression. Few previous studies have sought to identify and understand very early subtle cognitive decline profiles specifically within CU participants, despite the field’s growing focus on earlier, preclinical stages of AD [27]. We chose to examine only CU participants and this may have allowed more empirically-derived groups to emerge compared to studies that have combined CU and MCI participants and found only one or two CU phenotypes [3, 6, 28]. This is only an initial study, and more work is needed to replicate these findings in larger, more diverse, and community-based cohorts. Additionally, future projects should examine biomarker and neuropathological data to better understand the underlying etiologies of decline across the cognitive phenotypes. While an ‘amnestic’ presentation has historically been thought to be linked with AD pathology and other non-amnestic presentations thought to represent non-AD phenotypes [10], the current results suggest there are many cognitive phenotypes that predict progression, likely regardless of the underlying (and likely multiple) pathologic underpinnings.
Our results add to a growing literature documenting heterogeneity in the earliest cognitive and pathological presentations associated with AD and related disorders [29, 30]. Despite unique cognitive profiles, participants with subtle memory/language, executive, and visuospatial weaknesses all declined at faster rates than the All-Average group. These results have important implications for early identification of individuals at risk for MCI/dementia. Given that the same classification approach may not be optimal for everyone, determining profiles of subtle cognitive difficulties in CU individuals and implementing neuropsychological test batteries that assess each domain may be a key step towards an individualized approach to early detection with the goal of decreasing missed opportunities for early intervention.
ACKNOWLEDGMENTS
This work was supported by the U.S. Department of Veterans Affairs Clinical Sciences Research and Development Service (Career Development Award-2 1IK2CX001865 to K.R.T.; and Merit Award 1I01CX001842 to K.J.B), the NIH (P30 AG062429 to K.R.T, D.P.S, and M.W.B.; R03 AG070435 to K.R.T.; R01 AG049810 to M.W.B.; R01 AG063782 to K.J.B.), and the Arizona Alzheimer’s Consortium and Arizona DHS (CTR057001 to E.C.E.).
D.P.S. serves as a paid consultant for Biogen, Inc. and Takeda Pharmaceuticals. M.W.B. is a consulting editor for the Journal of the International Neuropsychological Society, a Senior Editor for Journal of Alzheimer’s Disease, and receives royalties from Oxford University Press.
Authors’ disclosures available online (https://www.j-alz.com/manuscript-disclosures/22-0684r1).
REFERENCES
[1] | Sperling RA , Rentz DM , Johnson KA , Karlawish J , Donohue M , Salmon DP , Aisen P ((2014) ) The A4 Study: Stopping AD before symptoms begin? Sci Transl Med 6: , 228fs13. |
[2] | Edmonds EC , Delano-Wood L , Clark LR , Jak AJ , Nation DA , McDonald CR , Libon DJ , Au R , Galasko D , Salmon DP , Bondi MW ((2015) ) Susceptibility of the conventional criteria for mild cognitive impairment to false-positive diagnostic errors. Alzheimers Dement 11: , 415–424. |
[3] | Edmonds EC , Smirnov DS , Thomas KR , Graves LV , Bangen KJ , Delano-Wood L , Galasko DR , Salmon DP , Bondi MW ((2021) ) Data-driven vs consensus diagnosis of MCI: Enhanced sensitivity for detection of clinical, biomarker, and neuropathologic outcomes. Neurology 97: , e1288–e1299. |
[4] | Edmonds EC , Weigand AJ , Hatton SN , Marshall AJ , Thomas KR , Ayala DA , Bondi MW , McDonald CR ((2020) ) Patterns of longitudinal cortical atrophy over 3 years in empirically derived MCI subtypes. Neurology 94: , e2532–e2544. |
[5] | Eppig JS , Edmonds EC , Campbell L , Sanderson-Cimino M , Delano-Wood L , Bondi MW , Alzheimer’s Disease Neuroimaging Initiative ((2017) ) Statistically derived subtypes and associations with cerebrospinalfluid and genetic biomarkers in mild cognitive impairment: A latentprofile analysis. J Int Neuropsychol Soc 23: , 564–576. |
[6] | Devlin KN , Brennan L , Saad L , Giovannetti T , Hamilton RH , Wolk DA , Xie SX , Mechanic-Hamilton D ((2022) ) Diagnosing mild cognitive impairment among racially diverse older adults: Comparison of consensus, actuarial, and statistical methods. J Alzheimers Dis 85: , 627–644. |
[7] | Machulda MM , Lundt ES , Albertson SM , Kremers WK , Mielke MM , Knopman DS , Bondi MW , Petersen RC ((2019) ) Neuropsychological subtypes of incident mild cognitive impairment in the Mayo Clinic Study of Aging. Alzheimers Dement 15: , 878–887. |
[8] | Edmonds EC , Ard MC , Edland SD , Galasko DR , Salmon DP , Bondi MW ((2018) ) Unmasking the benefits of donepezil via psychometrically precise identification of mild cognitive impairment: A secondary analysis of the ADCS vitamin E and donepezil in MCI study. Alzheimers Dement (N Y) 4: , 11–18. |
[9] | Winblad B , Palmer K , Kivipelto M , Jelic V , Fratiglioni L , Wahlund L-O , Nordberg A , Bäckman L , Albert M , Almkvist O , Arai H , Basun H , Blennow K , Leon MD , DeCarli C , Erkinjuntti T , Giacobini E , Graff C , Hardy J , Jack C , Jorm A , Ritchie K , Duijn CV , Visser P , Petersen RC ((2004) ) Mild cognitive impairment –beyond controversies, towards a consensus: Report of the International Working Group on Mild Cognitive Impairment. J Intern Med 256: , 240–246. |
[10] | Petersen RC ((2004) ) Mild cognitive impairment as a diagnostic entity. J Intern Med 256: , 183–194. |
[11] | Bangen KJ , Clark AL , Werhane M , Edmonds EC , Nation DA , Evangelista N , Libon DJ , Bondi MW , Delano-Wood L ((2016) ) Cortical amyloid burden differences across empirically-derived mild cognitive impairment subtypes and interaction with APOE ɛ4 genotype. J Alzheimers Dis 52: , 849–861. |
[12] | Thomas KR , Edmonds EC , Delano-Wood L , Bondi MW ((2017) ) Longitudinal trajectories of informant-reported daily functioning in empirically defined subtypes of mild cognitive impairment. J Int Neuropsychol Soc 23: , 521–527. |
[13] | Zammit AR , Yang J , Buchman AS , Leurgans SE , Muniz-Terrera G , Lipton RB , Hall CB , Boyle P , Bennett DA ((2021) ) Latent cognitive class at enrollment predicts future cognitive trajectories of decline in a community sample of older adults. J Alzheimers Dis 83: , 641–652. |
[14] | Lamar M , Drabick D , Boots EA , Agarwal P , Emrani S , Delano-Wood L , Bondi MW , Barnes LL , Libon DJ ((2021) ) Latent profile analysis of cognition in a non-demented diverse cohort: A focus on modifiable cardiovascular and lifestyle factors. J Alzheimers Dis 82: , 1833–1846. |
[15] | Galasko D , Hansen LA , Katzman R , Wiederholt W , Masliah E , Terry R , Hill LR , Lessin P , Thal LJ ((1994) ) Clinical-neuropathological correlations in Alzheimer’s disease and related dementias. Arch Neurol 51: , 888–895. |
[16] | Salmon DP , Butters N (1992) Neuropsychological assessment of dementia in the elderly. In Principles of Geriatric Neurology, Katzman R, RoweJW, eds. F.A. Davis, Philadelphia, pp. 144–163. |
[17] | Monsch AU , Bondi MW , Salmon DP , Butters N , Thal LJ , Hansen LA , Wiederholt WC , Cahn DA , Klauber MR ((1995) ) Clinical validity of the Mattis Dementia Rating Scale in detecting dementia of the Alzheimer type: A double cross-validation and application to a community-dwelling sample. Arch Neurol 52: , 899–904. |
[18] | Pfeffer RI , Kurosaki TT , Harrah CH Jr , Chance JM , Filos S ((1982) ) Measurement of functional activities in older adults in the community. J Gerontol 37: , 323–329. |
[19] | O’Bryant SE , Lacritz LH , Hall J , Waring SC , Chan W , Khodr ZG , Massman PJ , Hobson V , Cullum CM ((2010) ) Validation of the new interpretive guidelines for the clinical dementia rating scale sum of boxes score in the national Alzheimer’s coordinating center database. Arch Neurol 67: , 746–749. |
[20] | Vogel JW , Young AL , Oxtoby NP , Smith R , Ossenkoppele R , Strandberg OT , La Joie R , Aksman LM , Grothe MJ , Iturria-Medina Y , Pontecorvo MJ , Devous MD , Rabinovici GD , Alexander DC , Lyoo CH , Evans AC , Hansson O ((2021) ) Four distinct trajectories of tau deposition identified in Alzheimer’s disease. Nat Med 27: , 871–881. |
[21] | Crutch SJ , Schott JM , Rabinovici GD , Murray M , Snowden JS , van der Flier WM , Dickerson BC , Vandenberghe R , Ahmed S , Bak TH , Boeve BF , Butler C , Cappa SF , Ceccaldi M , de Souza LC , Dubois B , Felician O , Galasko D , Graff-Radford J , Graff-Radford NR , Hof PR , Krolak-Salmon P , Lehmann M , Magnin E , Mendez MF , Nestor PJ , Onyike CU , Pelak VS , Pijnenburg Y , Primativo S , Rossor MN , Ryan NS , Scheltens P , Shakespeare TJ , Suárez González A , Tang-Wai DF , Yong KXX , Carrillo M , Fox NC , Alzheimer’s Association ISTAART Atypical Alzheimer’s Disease and AssociatedSyndromes Professional Interest Area ((2017) ) Consensus classification of posterior cortical atrophy. Alzheimers Dement 13: , 870–884. |
[22] | Dickerson BC , Wolk DA , for the Alzheimer’s Disease Neuroimaging Initiative ((2011) ) Dysexecutive versus amnesic phenotypes of very mild Alzheimer’s disease are associated with distinct clinical, genetic and cortical thinning characteristics. J Neurol Neurosurg Psychiatry 82: , 45–51. |
[23] | Rascovsky K , Salmon DP , Lipton AM , Leverenz JB , DeCarli C , Jagust WJ , Clark CM , Mendez MF , Tang-Wai DF , Graff-Radford NR , Galasko D ((2005) ) Rate of progression differs in frontotemporal dementia and Alzheimer disease. Neurology 65: , 397–403. |
[24] | Jessen F , Amariglio RE , van Boxtel M , Breteler M , Ceccaldi M , Chételat G , Dubois B , Dufouil C , Ellis KA , van der Flier WM , Glodzik L , van Harten AC , de Leon MJ , McHugh P , Mielke MM , Molinuevo JL , Mosconi L , Osorio RS , Perrotin A , Petersen RC , Rabin LA , Rami L , Reisberg B , Rentz DM , Sachdev PS , dela Sayette V , Saykin AJ , Scheltens P , Shulman MB , Slavin MJ , Sperling RA , Stewart R , Uspenskaya O , Vellas B , Visser PJ , Wagner M ((2014) ) A conceptual framework for research on subjective cognitivedecline in preclinical Alzheimer’s disease.. Alzheimers Dement 10: , 844–852. |
[25] | Snitz BE , Wang T , Cloonan YK , Jacobsen E , Chang C-CH , Hughes TF , Kamboh MI , Ganguli M ((2018) ) Risk of progression from subjective cognitive decline to mild cognitive impairment: The role of study setting. Alzheimers Dement 14: , 734–742. |
[26] | Gross AL , Rebok GW , Unverzagt FW , Willis SL , Brandt J ((2011) ) Cognitive predictors of everyday functioning in older adults: Results from the ACTIVE Cognitive Intervention Trial. J Gerontol Ser B 66B: , 557–566. |
[27] | Sperling RA , Aisen PS , Beckett LA , Bennett DA , Craft S , Fagan AM , Iwatsubo T , Jack CR , Kaye J , Montine TJ , Park DC , Reiman EM , Rowe CC , Siemers E , Stern Y , Yaffe K , Carrillo MC , Thies B , Morrison-Bogorad M , Wagster MV , Phelps CH ((2011) ) Toward defining the preclinical stages of Alzheimer’s disease: Recommendations from the National Institute on Aging-Alzheimer’s Association workgroups on diagnostic guidelines for Alzheimer’s disease. Alzheimers Dement 7: , 280–292. |
[28] | Blanken AE , Dutt S , Li Y , Nation DA , for the Alzhiemer’s Disease Neuroimaging Initiative ((2019) ) Disentangling heterogeneity in Alzheimer’s disease: Two empirically-derived subtypes. J Alzheimers Dis 70: , 227–239. |
[29] | Vogel JW , Hansson O ((2022) ) Subtypes of Alzheimer’s disease: Questions, controversy, and meaning. Trends Neurosci 45: , 342–345. |
[30] | Weigand AJ , Bangen KJ , Thomas KR , Delano-Wood L , Gilbert PE , Brickman AM , Bondi MW , Alzheimer’s Disease Neuroimaging Initiative ((2020) ) Is tau in the absence of amyloid on the Alzheimer’s continuum? A study of discordant PET positivity. Brain Commun 2: , fcz046. |


