
Mild Cognitive Impairment, Reversion Rates, and Associated Factors: Comparison of Two Diagnostic Approaches
Abstract
Background:
As mild cognitive impairment (MCI) is typically used to identify prodromal stages of dementia, it is essential to identify MCI criteria with high diagnostic stability and prediction of dementia. Moreover, further investigation into pinpointing key factors for reversion is required to foresee future prognosis of MCI patients accurately.
Objective:
To explore disparities in diagnostic stability by examining reversion rates produced by two operationalizations of the MCI definition: the widely applied Petersen criteria and a version of the Neuropsychological (NP) criteria and to identify cognitive, lifestyle, and health related factors for reversion.
Methods:
MCI was retrospectively classified in a sample from the Swedish community-based study Good Aging in Skåne with the Petersen criteria (n = 744, median follow-up = 7.0 years) and the NP criteria (n = 375, median follow-up, 6.7 years), respectively. Poisson regression models estimated the effect of various factors on the likelihood of incident reversion.
Results:
Reversion rates were 323/744 (43.4%, 95% confidence intervals (CI): 39.8; 47.0) and 181/375 (48.3% 95% CI: 43.2; 53.5) for the Petersen criteria and NP criteria, respectively. Participants with impairment in a single cognitive domain, regular alcohol consumption, living with someone, older age, and lower body mass index had a higher likelihood of reverting to normal.
Conclusion:
Reversion rates were similar for Petersen and NP criteria indicating that one definition is not superior to the other regarding diagnostic stability. Additionally, the results highlight important aspects such as multiple domain MCI, cohabitation, and the role of alcohol on predicting the trajectory of those diagnosed with MCI.
INTRODUCTION
Mild cognitive impairment (MCI) is a diagnostic tool used to identify individuals in the transitionary stage between normal cognition and dementia. The Mayo Clinic’s “Petersen/Winblad criteria” [1–3] is considered the conventional way of defining MCI and requires: a self- or informant reported cognitive complaint, objective cognitive impairment in one or more cognitive domains, normal or minimally impaired daily functioning, and no dementia. However, other operationalizations of this definition have proved useful in diagnosing MCI stability and progression [4–6].
As MCI sometimes involves a fluctuating state of cognition and different degrees of impairment, a person diagnosed with MCI can have very different outcomes; they can progress to dementia, change subtypes [7, 8], continue with their MCI diagnosis, i.e., never progress to dementia; or they can revert to normal cognition [8–10]. A meta-analysis showed an overall MCI reversion rate of 25% in community-based studies [10], but the rates differ vastly between studies, ranging from 8–59% due to varying study methodologies, samples, and operationalization of the diagnostic criteria [11].
Low reversion rates can reflect desired diagnostic stability, or accurate identification of dementia progression. There are several possible etiologies for MCI such as neurologic, neurodegenerative, and psychiatric disorders, all which influence diagnostic stability [12]. When the goal is to identify MCI cases due to neurodegenerative disease such as dementia, striving to find an MCI operationalization that produces low reversion rates is important. Jak and colleagues [13] proposed an alternate operationalization to the Petersen criteria, referred to as the neuropsychological (NP) criteria. This set of criteria has shown to produce lower prevalence and reversion rates, and to more precisely identify dementia progressors when contrasted to the Petersen criteria [14–16]. The NP criteria, besides omitting the requirement of subjective and informant-based complaint, differs from the Petersen criteria in that it requires two impaired cognitive test scores within the same cognitive domain, instead of one. Also, the NP criteria requires a cut-off score of 1 standard deviation (SD), instead of the widely used 1.5 SD below the mean relative to a normative sample [13]. A proportion of healthy older adults, due to natural variability, will obtain test scores falling below normative cut-off scores, incorrectly fulfilling the requirement of objective impairment [17, 18]. An optimal cognitive testing battery, and requirements of the objective impairment criterion, should be sensitive enough to detect discreet cognitive deficits, and distinguish between the cognitively impaired and unimpaired. Several researchers argue that relying on one test score for this distinction is inappropriate, as it enhances reversion rates and the misclassification of MCI subtypes [4, 5, 19, 20]. However, the NP criteria requires extra neuropsychological tests for MCI classification, which is not always achievable and can be especially problematic when testing older adults, as fatigue can arise from extensive cognitive examination. Thus, further investigation is warranted to establish the impact of two impaired cognitive test scores versus one test score per domain when determining MCI stability and progression.
Several modifiable and non-modifiable factors are associated with reversion. For instance, demographical factors include: younger age [7, 21, 22], male sex [23], having a life partner or not [23–25], and higher [22, 26] or lower [7] levels of education. Health related factors, both mental and physical, have also been linked to reversion, such as engaging in cognitively stimulating activities [7, 21, 23, 27], as well as better concentration and performance on neuropsychological tests [8, 23, 25], impairment in a single cognitive domain MCI [7, 21, 23, 24], non-amnestic MCI or amnestic MCI, better vision and smelling ability, lack of APOE4, and larger volumes of hippocampi and amygdala, lower diastolic blood pressure [24], cardiovascular conditions such as stroke [22], and the absence of self or informant complaint [16, 21, 24]. A majority of these opposing factors (e.g., higher age, female sex) are frequently associated with prevalent and incident dementia [28]. Remarkedly, not all studies are consistent in their findings (e.g., having a partner or not) and not all established protective factors for cognitive decline (e.g., being physically active) have been specifically recognized as predictors for reversion. Hence, we sought to explore cognitive, lifestyle, and health related factors previously linked to MCI reversion, MCI stability, and incident dementia. Sleep disturbances have been linked to MCI, cognitive decline, and dementia [29, 30], but are, to our knowledge, unexplored in the context of MCI reversion, making it a novel factor in this investigation. Factors for reversion are important to consider when a patient is diagnosed with MCI, since it speaks to what the patient might reasonably expect in terms of prognosis. In addition, they can assist in developing effective interventions for halting and preventing the onset of Alzheimer’s disease, and other forms of dementia.
In summation, this work aims to investigate diagnostic stability of MCI through examining reversion rates, using two operationalizations of the MCI definition: the Petersen criteria and a modified version of the NP criteria. We have previously examined methodological concerns (e.g., cognitive testing environment) and mood (e.g., motivation at testing) as factors for reversion [8], and this study intends to extend these findings through identifying other cognitive, lifestyle, and health factors associated with reversion.
METHODS
Study population
Data were drawn from the Swedish longitudinal population study “Good Aging in Skåne” (GÅS), including participants ranging in age from 60–102 years [31]. GÅS is part of the national study “The Swedish National Study on Aging and Care” (SNAC) and has been ongoing since 2001. Participants from five municipalities in southern Sweden are randomly selected from the Swedish population register, and a new baseline cohort is added every sixth year. Participation rates varies between 60–70%. Follow-up visits were made every third year for those older than 78 years and every sixth year for those younger than 78. Participant data from three baseline waves, and their associated follow-up examinations, were pooled for the purpose of this study.
Between 2001 and 2020, 5,804 participants were examined, and during this period 1,785 and 987 were classified as MCI according the Petersen and Neuropsychological criteria, respectively. This classification event was considered their MCI baseline visit, regardless of which study wave it occurred in. As the NP criteria insists on two impaired scores per domain, fewer participants could be included in the NP sample due to incomplete cognitive data. To inspect rates and factors for reversion, these 1,785/987 participants were followed until they either: 1) reverted, 2) no longer met MCI criteria (ADL worsened, no longer reported a cognitive complaint), 3) progressed to dementia, 4) were lost to follow-up, whichever event occurred first (see Figs. 1 and 2 for further clarification). For the analysis inspecting dementia progression, reverters, and stable MCI cases were followed until they received a dementia diagnosis from the Skåne Healthcare register, which was obtained until 31 December 2020. The study was approved by the regional Ethics Committee of Lund University, and all participants signed a written informed consent.
Fig. 1
A flow chart of participant selection, drop-out, reversion of mild cognitive impairment when applying the Petersen criteria. Participants were selected from three baseline waves and were followed until they met MCI criteria, either in their first visit or follow-up examinations. Once they received their MCI diagnosis they were then followed until they were lost to follow-up, were not eligible for MCI at any of the follow-ups (i.e., their ADL worsened, progressed to dementia etc.), continued to be MCI or reverted. ADL, activities of daily living; MCI, mild cognitive impairment; CDR, clinical dementia rating scale
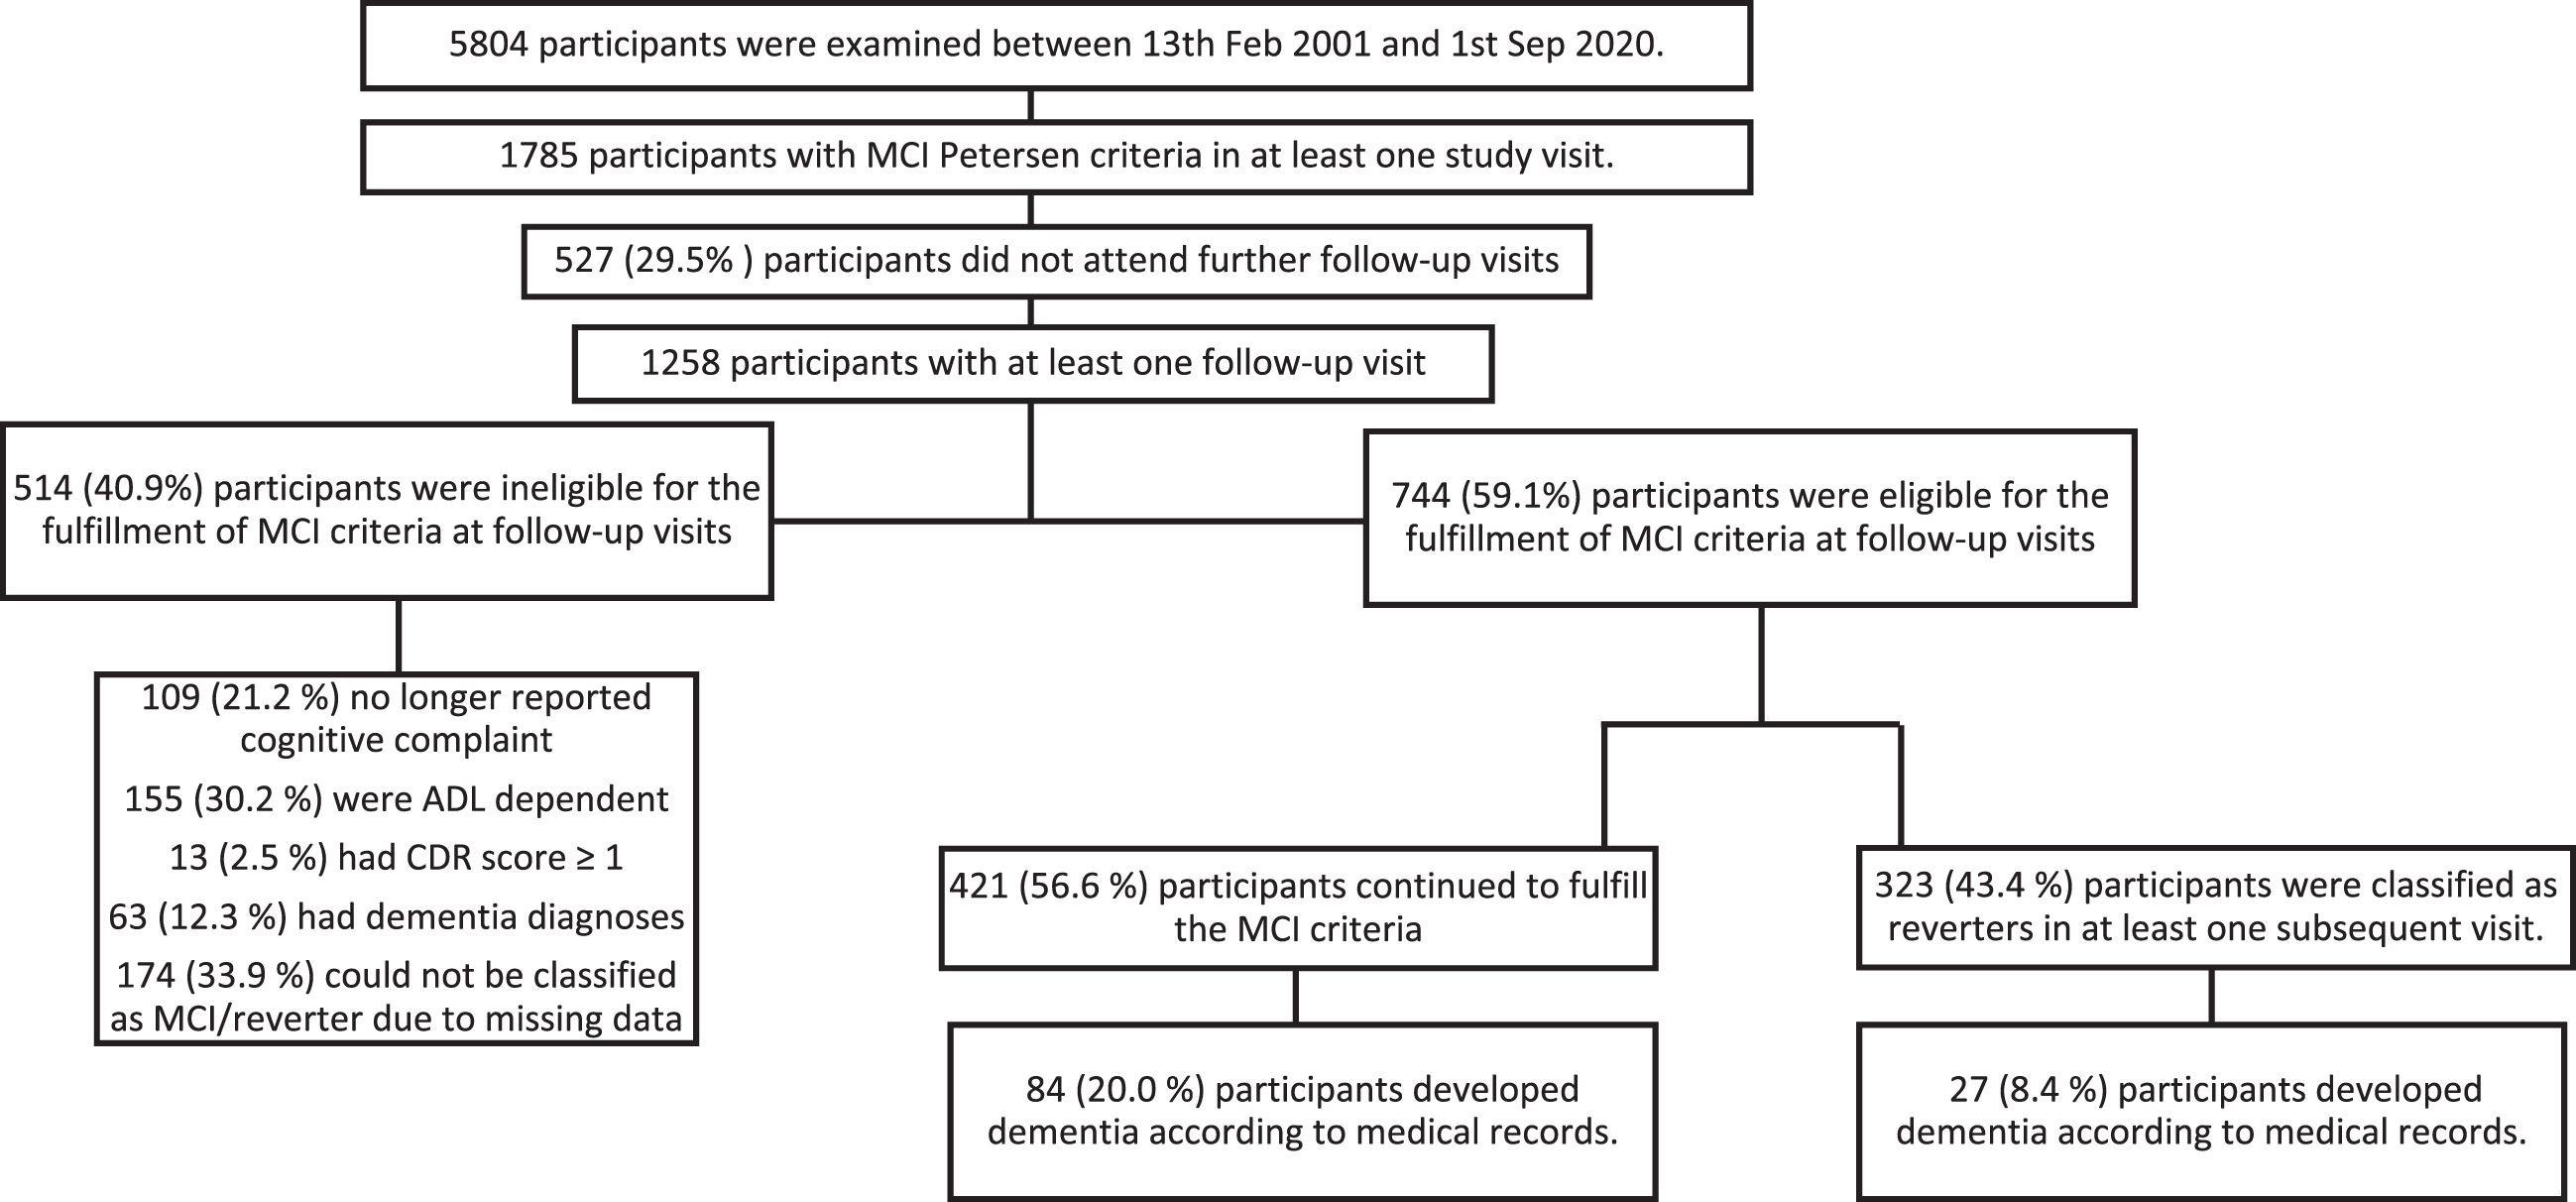
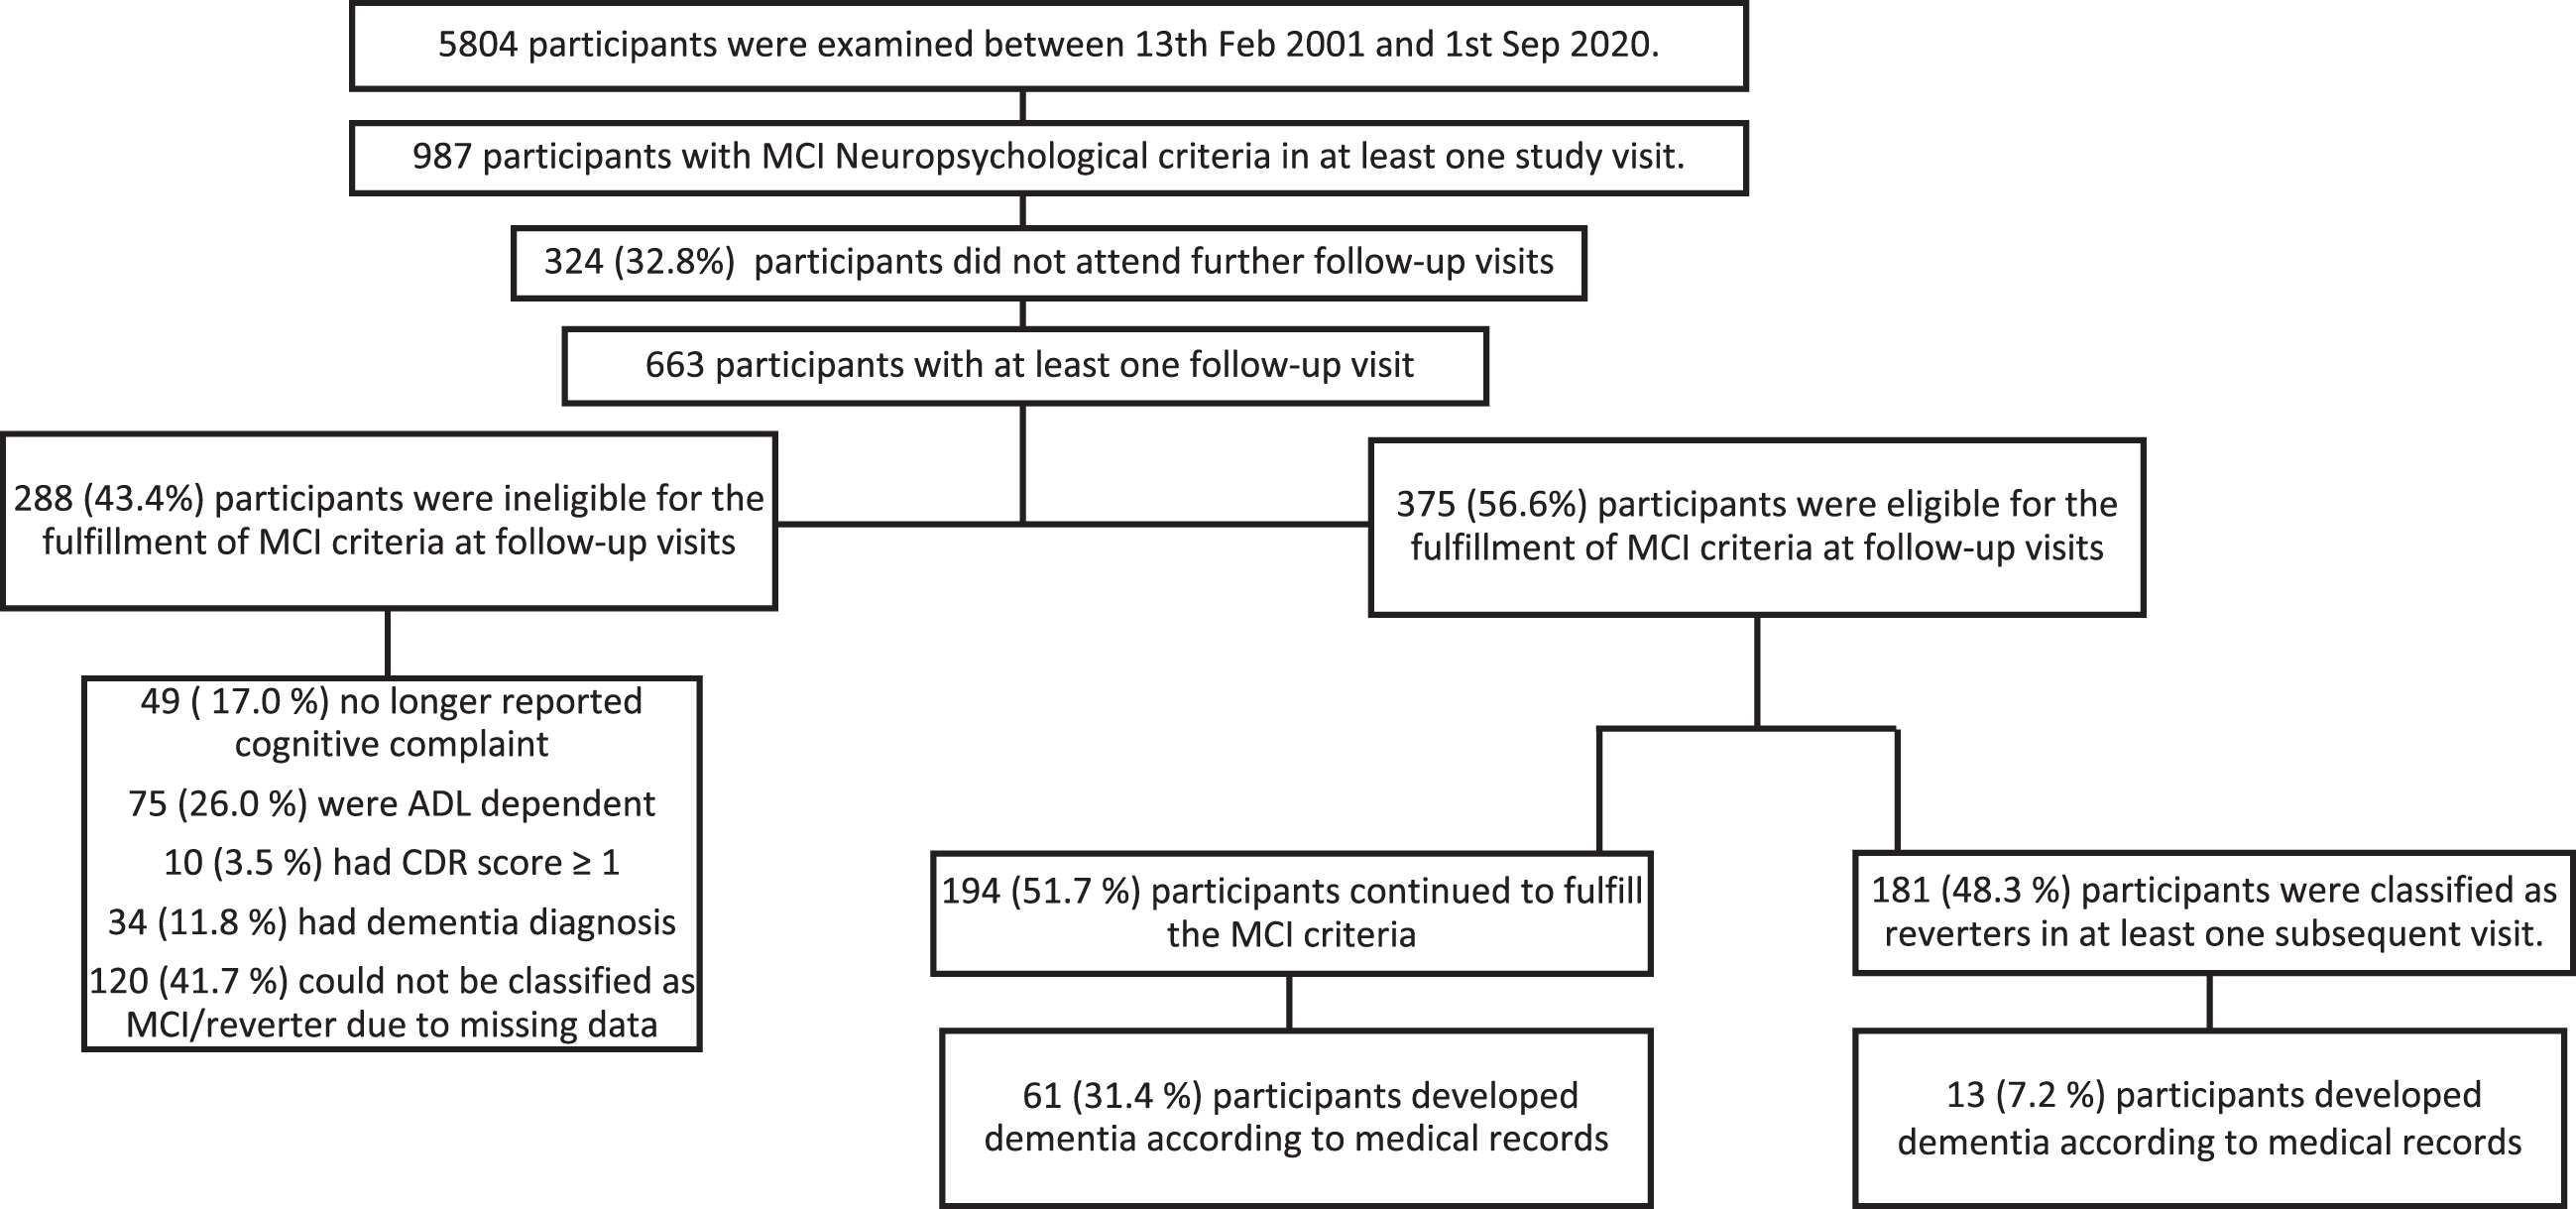
Fig. 2
A flow chart of participant selection, drop-out, reversion of mild cognitive impairment when applying the Neuropsychological criteria. Participants were selected from three baseline waves and were followed until they met MCI criteria, either in their first visit or follow-up examinations. Once they received their MCI diagnosis they were then followed until they were lost to follow-up, were not eligible for MCI at any of the follow-ups (i.e., their ADL worsened, progressed to dementia etc.), continued to be MCI or reverted. ADL, activities of daily living; MCI, mild cognitive impairment; CDR, clinical dementia rating scale
Using standardized procedures, participants filled in self-rated questionnaires, performed cognitive tests, and were examined by a physician and a nurse. An experienced test administrator conducted neuropsychological tests assessing four cognitive domains: memory (a 16-item word-recall test, a 16-word recognition test, and a 5-object delayed recall test), speed of processing (a digit cancellation test and a pattern comparison test), verbal fluency (a word fluency test of animals and professions, respectively), and executive function (a modified version of the trail making test B and the digit span backwardstest) [32].
Diagnostic criteria of MCI and reversion
An algorithmic approach, blind to prior diagnosis, was applied retrospectively. In this study, both MCI definitions have the same four requirements: a self- or informant reported cognitive complaint, objective cognitive impairment in one or more cognitive domains, normal or minimally impaired daily function, and no dementia. Researchers applying the NP criteria usually omit the requirement of the cognitive complaint [5, 15, 16], as it has been associated with elevated misclassification rates [4]. Nevertheless, as informant or subjective based complaint is a core requirement in both the original MCI definition, and in the definition mild neurocognitive disorder (Diagnostic and Statistical Manual of Mental Disorders 5th edition) and is a common reason for referral to memory clinics, this requirement is retained for both criteria. The NP criteria applied here is consequently considered a modified version. In this study, the two definitions differ in the number of required impaired test results within a cognitive domain, and their cut-off score. The Petersen criteria requires at least one impaired test score, within a cognitive domain, and below the 7th percentile relative to a normative sample. In contrast, the NP criteria requires a score below the 16th percentile, on at least two tests, within the same cognitive domain. To measure multiple domain MCI, both criteria required impaired test scores (≥1 for Petersen and ≥2 for NP within the same domain) on at least two cognitive domains. Normative values were derived from two sister studies, SNAC-Blekinge and SNAC-Stockholm, which administrated the same cognitive tests in a standardized way (Supplementary Table 1) [33]. A test score below the 7th/16th percentile, corrected for age, sex and education, was considered an impaired test score. When assuming distribution normality, the 7th/16th percentile equates to 1.5/1.0 SD below the mean.
Subjective cognitive complaint was assessed by inquiring if the participant experienced that their memory had worsened, and the informed complaint was determined by the examining physician. To assess the daily function of the participants both basic activities of daily living (bADL) and instrumental ADL (iADL) were considered. bADL and iADL were determined using the Katz index of independence [34], and a modified Lawton-Brody index [35], respectively. For MCI classification bADL was preserved, while impairment in one area was allowed for iADL [2]. The dementia diagnosis was classified by the study physician according to the Diagnostic and Statistical Manual of Mental Disorders 4th edition. These diagnoses were complemented with information from the participants’ medical records and diagnosis codes reported in the Skåne Healthcare Register, including Alzheimer’s disease, mixed dementia, vascular dementia, Lewy body dementia, and frontotemporal dementia.
Reverters were defined as participants that fulfilled all criteria for MCI, but no longer met the requirement for objective cognitive impairment, i.e., the participants had normal ADL, cognitive complaint, and no dementia, but their cognitive scores no longer fell within the range of impairment. Stable MCI was defined as participants who continued to be MCI throughout their study participation. Reverters and stable MCI were defined by both criteria separately. To calculate reversion rate, the proportion of reverters was compared to the proportion of non-reverters, i.e., the stable MCI group.
Factors for reversion
The following factors for reversion were considered: age, sex, physical activity, cohabitation, sleeping disturbances, alcohol consumption, body mass index (BMI), smoking status, total years of formal education, depressive symptoms, cardio- and cerebrovascular diseases, hypertension, diabetes mellitus type I and II, and number of impaired cognitive domains, all measured at the time of the first MCI classification.
Physical activity, cohabitation, smoking status, alcohol consumption, and years of formal education were self-reported. Participants were asked how much (during the last year) they moved and activated their bodies during their spare time and in their home, and their answers were defined accordingly: sedentary (sedentary or being mostly still) or being physically active (light to moderate exercise or heavy exercise). Cohabitation was defined as living with someone (unrelated to, if it was a spouse, partner, or child, or someone else). Smoking was defined as either current or previous smoker, or never smoked. Participants were asked how often they consumed alcohol, and their answers were categorized accordingly: no/low consumption (never or once a month, or less frequently), moderate consumption (2–4 times per month), or high consumption (2-3 times per week or more frequently).
Sleep disturbances were reported to the physician and included one or more conditions: sleep latency, waking up multiple times during the night, early awakenings, sleep apnea, or other bothersome sleeping issues.
Comorbidities were identified by several methods: self-reported to the study physician, through medical examination, and by reviewing medical records. In case of a discrepancy between the different sources, information recorded in the study database was used and in case of a missing value the information recorded in the healthcare registry was implemented. Diagnosis codes classified according to the International Classification of Diseases system version 10 were retrieved from the Skåne county healthcare registry. Cardiovascular disease was defined as: at least once being diagnosed with acute myocardial infarction, heart failure, ischemic heart disease, angina pectoris, presence of cardiac and vascular implants, heart failure, cardiac arrhythmias, cerebral infarction, nontraumatic intracranial hemorrhaged, occlusion and stenosis of precerebral or cerebral arteries, transient cerebral ischemia, and/or hypertension. Depression was measured through interview by the test administrator, using the Montgomery Åsberg Depression Rating Scale [36].
Statistical analyses
Estimation of incidence rates of reversion
The reversion incidence rates for both MCI criteria were calculated using a Poisson regression model. The baseline variables included in the model were sex, age, years of formal education, cohabitant, physical activity, alcohol consumption, BMI, cardiovascular disease, smoking status, sleep disturbances, number of cognitive domains affected, and depression. To acknowledge that the participants had different follow-up times, the time from the first MCI visit to the end of the follow-up, or incidence of reversion, whichever occurred first, was added as an offset. A robust variance estimator was implemented. Goodness of fit was assessed using a chi-square test, by comparing predicted and observed reversions, and by visual assessments of the Pearson residuals. To facilitate the interpretation of the results, average adjusted predictions (AAP) were calculated to estimate the probability of reversion based on the Poisson model. Firstly, the Poisson model was used to estimate the probability of reversion for each subject, or for a particular group of participants, e.g., females. Secondly, these probabilities were averaged, and an estimate was obtained for the study population. The 95% confidence intervals for the AAP were calculated using the delta method. Several sensitivity analyses were performed to assess the robustness of the results. Firstly, sensitivity analyses were performed to inspect reversion rates in varying MCI criteria. Therefore, the following MCI criteria requirements were relaxed in each analysis: a) no requirement of intact ADL or of cognitive complaint at follow-up for reverters or MCI; b) no requirements of MCI criteria other than objective cognitive impairment (i.e., neuropsychological test scores below cut-off) at baseline and follow-up; and c) no requirement for cognitive complaint at either baseline or follow-up to resemble original NP criteria. Secondly, a sensitivity analysis was performed to check the impact on the likelihood of reversion across classifications of alcohol consumption (Supplementary Material). Thirdly, in the original analyses, reversion rates were calculated for the NP criteria with fewer participants than for the Petersen criteria. Therefore, reversion rates were calculated in a subsample of participants that had enough data to fulfil both criteria, and that had complete follow-up data. Thereby inspecting the impact on reversion rates due to varying samples in the original analyses (Supplementary Material).
Comparison of dementia risk between reverters and stable MCI
We investigated how MCI reversion affected the likelihood of developing dementia, using a Cox proportional hazard regression model, with the occurrence of the first reversion as the only explanatory variable, which was modelled as a time-varying covariate. The median time to reversion, and the duration of follow-up, were also calculated using a Cox regression model.
For all analyses, the statistical significance level was set to 5%. The statistical analyses were performed using Stata SE 17 software (StataCorp LLC, College Station, TX, USA) and Python 3.8.5 (Python Software Foundation).
RESULTS
MCI diagnosis and follow-up
Of the 5,804 participants that were included in the study, 1,785/987 (Petersen criteria/NP criteria) were considered MCI in at least one study visit. Of those participants a further 1,258/663 had at least one follow-up visit with 744/375 eligible to fulfil the applied MCI criteria at a subsequent follow-up visit (see flow chart 1 and 2 for further clarification of eligibility). The median time for follow-up for Petersen criteria was 7.0 (95% CI: 6.8; 7.6) years and 6.7 (95% CI: 6.5; 6.9) years for NP criteria). Seen irrespective of applied MCI criteria, a majority of MCI participants had one impaired cognitive domain (≥70%) in a non-amnestic cognitive domain (≈60%). An impaired cognitive domain was at least one (Petersen criteria) or two (NP criteria) cognitive test scores below the appointed cut-off score in a single cognitive domain. Mean age for the first MCI diagnosis was 68 years of age, and women were slightly overrepresented regardless of the applied criteria (Table 1).
Table 1
Baseline demographics and characteristics of MCI sample (all) with additional predictor variables stratified into reverters and stable MCI
| Petersen criteria | Neuropsychological criteria | ||||||
| Parameter | Category | Reverters | Stable MCI | All | Reverters | Stable MCI | All |
| (n = 323) | (n = 421) | (n = 744) | (n = 181) | (n = 194) | (n = 375) | ||
| Sex, n, % | Male | 156 (48.3) | 189 (44.9) | 345 (46.4) | 93 (51.4) | 88 (45.4) | 181 (48.3) |
| Female | 167 (51.7) | 232 (55.1) | 399 (53.6) | 88 (48.6) | 106 (54.6) | 194 (51.7) | |
| Physically active, n, % | No | 8 (2.5) | 20 (4.8) | 28 (3.8) | 11 (6.1) | 13 (6.7) | 24 (6.4) |
| Yes | 312 (96.6) | 398 (94.5) | 710 (95.4) | 169 (93.4) | 180 (92.8) | 349 (93.1) | |
| Missing | 3 (0.9) | 3 (0.7) | 6 (0.8) | 1 (0.5) | 1 (0.5) | 2 (0.5) | |
| Cohabitant, n, % | No | 104 (32.2) | 169 (40.1) | 273 (36.7) | 54 (29.8) | 91 (46.9) | 145 (38.7) |
| Yes | 218 (67.5) | 249 (59.2) | 467 (62.8) | 126 (69.6) | 102 (52.6) | 228 (60.8) | |
| Missing | 1 (0.3) | 3 (0.7) | 4 (0.5) | 1 (0.5) | 1 (0.5) | 2 (0.5) | |
| Smoking status, n, % | No | 137 (42.4) | 184 (43.7) | 321 (43.2) | 74 (40.9) | 97 (50.0) | 171 (45.6) |
| Yes | 183 (56.7) | 234 (55.6) | 417 (56.0) | 106 (58.6) | 96 (49.5) | 202 (53.9) | |
| Missing | 3 (0.9) | 3 (0.7) | 6 (0.8) | 1 (0.5) | 1 (0.5) | 2 (0.5) | |
| Alcohol consumption, n, % | Low or non-consumer | 114 (35.3) | 235 (55.8) | 349 (46.9) | 71 (39.2) | 111 (57.2) | 182 (48.5) |
| Moderate consumer | 131 (40.6) | 112 (26.6) | 243 (32.7) | 71 (39.2) | 51 (26.3) | 122 (32.5) | |
| High consumer | 75 (23.2) | 71 (16.9) | 146 (19.6) | 38 (21.0) | 31 (16.0) | 69 (18.4) | |
| Missing | 3 (0.9) | 3 (0.7) | 6 (0.8) | 1 (0.5) | 1 (0.5) | 2 (0.5) | |
| Sleep disturbances, n, % | No | 195 (60.4) | 236 (56.1) | 431 (57.9) | 96 (53.0) | 104 (53.6) | 200 (53.3) |
| Yes | 128 (39.6) | 183 (43.5) | 311 (41.8) | 85 (47.0) | 90 (46.4) | 175 (46.7) | |
| Missing | 0 (0.0) | 2 (0.47) | 2 (0.27) | 0 (0.0) | 0 (0.0) | 0 (0.0) | |
| Cardiovascular disease, n, % | No | 227 (70.3) | 296 (70.3) | 523 (70.3) | 136 (75.1) | 133 (68.6) | 269 (71.7) |
| Yes | 96 (29.7) | 125 (29.7) | 221 (29.7) | 45 (24.9) | 61 (31.4) | 106 (28.3) | |
| Missing | 0 (0.0) | 0 (0.0) | 0 (0.0) | 0 (0.0) | 0 (0.0) | 0 (0.0) | |
| Hypertension, n, % | No | 226 (70.0) | 250 (59.4) | 476 (64.0) | 128 (70.7) | 111 (57.2) | 239 (63.7) |
| Yes | 97 (30.0) | 171 (40.6) | 268 (36.0) | 53 (29.3) | 83 (42.8) | 136 (36.3) | |
| Missing | 0 (0.0) | 0 (0.0) | 0 (0.0) | 0 (0.0) | 0 (0.0) | 0 (0.0) | |
| Age at first MCI diagnosis (y), m (std) [min-max] | 68.2 (8.8) [59.4–94.0] | 68.5 (9.5) [59.2–94.0] | 68.4 (9.2) [59.2–94.0] | 66.8 (8.1) [59.4–90.1] | 69.3 (9.3) [59.6–90.8] | 68.1 (8.8) [59.4–90.8] | |
| missing | 0 (0.0) | 0 (0.0) | 0 (0.0) | 0 (0.0) | 0 (0.0) | 0 (0.0) | |
| Years of education, m (std) [min-max] | 10.8 (3.6) [1.0–21.0] | 10.9 (4.2) [3.0–30.0] | 10.9 (3.9) [1.0–30.0] | 10.9 (3.9) [6.0–27.0] | 11.0 (4.0) [4.0–26.0] | 10.9 (3.9) [4.0–27.0] | |
| missing | 0 (0.0) | 0 (0.0) | 0 (0.0) | 0 (0.0) | 0 (0.0) | 0 (0.0) | |
| Body mass index kg/m2, m (std) [min-max] | 26.7 (4.1) [16.9–52.3] | 27.4 (4.5) [15.2–44.9] | 27.1 (4.4) [15.2–52.3] | 26.5 (4.2) [18.6–41.0] | 27.7 (5.0) [16.9–52.3] | 27.1 (4.7) [16.9–52.3] | |
| missing | 0 (0.0) | 1 (0.24) | 1 (0.19) | 0 (0.0) | 0 (0.0) | 0 (0.0) | |
| Depression score (MADRS), m (std) [min-max] | 2.55 (4.6) | 2.73 (4.6) | 2.65 (4.6) | 2.53 (4.7) | 3.0 (5.0) | 2.8 (4.9) | |
| [0.0–28.0] | [0.0–28.0] | [0.0–28.0] | [0.0–27.0] | [0.0–28.0] | [0.0–28.0] | ||
| Missing | 3 (0.9) | 11 (2.6) | 14 (1.9) | 3 (1.7) | 3 (1.5) | 6 (1.6) | |
| Mini mental examination test (score), m (std) [min-max] | 27.3 (1.8) [20.0–30.0] | 25.7 (2.9) [1.0–30.0] | 26.4 (2.6) [1.0–30.0] | 26.9 (2.1) [20.0–30.0] | 25.5 (3.1) [1.0–30.0] | 26.2 (2.7) [1.0–30.0] | |
| Missing | 1 (0.3) | 0 (0.0) | 1 (0.1) | 0 (0.0) | 0 (0.0) | 0 (0.0) | |
| Number of cognitive domains affected at first MCI diagnosis, n, % | 1 | 278 (86.1) | 246 (58.4) | 524 (70.4) | 153 (84.5) | 139 (71.6) | 292 (77.9) |
| 2 | 43 (13.3) | 108 (25.6) | 151 (20.3) | 25 (13.8) | 40 (20.6) | 65 (17.3) | |
| 3 | 2 (0.6) | 52 (12.4) | 54 (7.3) | 3 (1.7) | 12 (6.2) | 15 (4.0) | |
| 4 | 0 (0.0) | 15 (3.6) | 15 (2.0) | 0 (0.0) | 3 (1.5) | 3 (0.8) | |
| Amnestic domain affected at first MCI diagnosis, n, % | No | 203 (62.8) | 237 (56.3) | 440 (59.1) | 106 (58.6) | 124 (63.9) | 230 (61.3) |
| Yes | 114 (35.3) | 170 (40.4) | 284 (38.2) | 71 (39.2) | 63 (32.5) | 134 (35.7) | |
| Missing | 6 (1.9) | 14 (3.3) | 20 (2.7) | 4 (2.2) | 7 (3.6) | 11 (2.9) | |
Reversion rates in respective criteria
Of the 744 MCI participants, according to the Petersen criteria, 323 (43.4%, 95% CI: 39.8; 47.0) reverted and the incidence rate of reversion was estimated to 63.0 (95% CI: 57.4; 69.1) person/1000 year. The NP criteria produced similar reversion rates, with 181 of 375 (48.3%, 95% CI: 43.2; 53.5) reverting, and the incidence rate of reversion was estimated to 76.2 (95% CI: 67.9; 85.6) person/1000 year. The results of the sensitivity analyses were comparable with those observed in the primary analyses, with reversion rates varying between 42.1–45.3%. However, excluding cognitive complaint, as required in the original NP criteria, produced somewhat higher reversion rates (54.7%). See Table 2 for specifics. Calculation of reversion rates for the Petersen and the NP criteria, for a sample containing the same participants (n = 334), yielded a slightly lower reversion rate of the Petersen criteria (32.9%), but similar for the NP criteria (46.4%) as in the primary analyses (Supplementary Table 4).
Table 2
Cumulative reversion rates and incidence rates across operationalizations of MCI and reversion definitions
| Number of participants with follow-up | Events of reversion | Proportion of reversion events | Incidence rate per 1000 person/years | |
| % (95% Confidence interval) | (95% Confidence interval) | |||
| Petersen criteria | ||||
| Standard | 323 | 744 | 43.4% (39.8; 47.0) | 63.0 (57.4; 69.1) |
| No requirements for ADL or memory complaints at follow-up1 | 1063 | 448 | 42.1% (39.1; 45.1) | 60.8 (56.1; 66.0) |
| Only cognitive impairment requirements2 | 1579 | 684 | 43.3% (40.8; 45.8) | 63.6 (60.1; 67.8) |
| Neuropsychological criteria | ||||
| Standard | 375 | 181 | 48.3% (43.2; 53.5) | 76.2 (68.0; 85.6) |
| No requirements for ADL or memory complaints at follow-up1 | 528 | 239 | 45.3% (40.9; 49.6) | 69.6 (62.5; 77.4) |
| Only cognitive impairment requirements2 | 773 | 350 | 45.3% (41.7; 48.9) | 70.4 (64.5; 76.8) |
| No requirements for cognitive complaint neither at baseline not at follow-up3 | 528 | 289 | 54.7% (50.4;59.0) | 86.5 (79.3; 94.3) |
1All standard MCI criteria is fulfilled at first MCI event, but at follow-up only requirement was no dementia and either cognitively impaired test scores (MCI stable) or cognitively normal (non-impaired) scores (reverters). 2No requirement for MCI criteria at first MCI event or follow-up other than no dementia and impaired test scores and for reverter at follow-up no dementia and cognitively normal (non-impaired) test scores. 3Original Neuropsychological criteria, no requirement for cognitive complaint neither at baseline nor at follow-up otherwise standard MCI criteria.
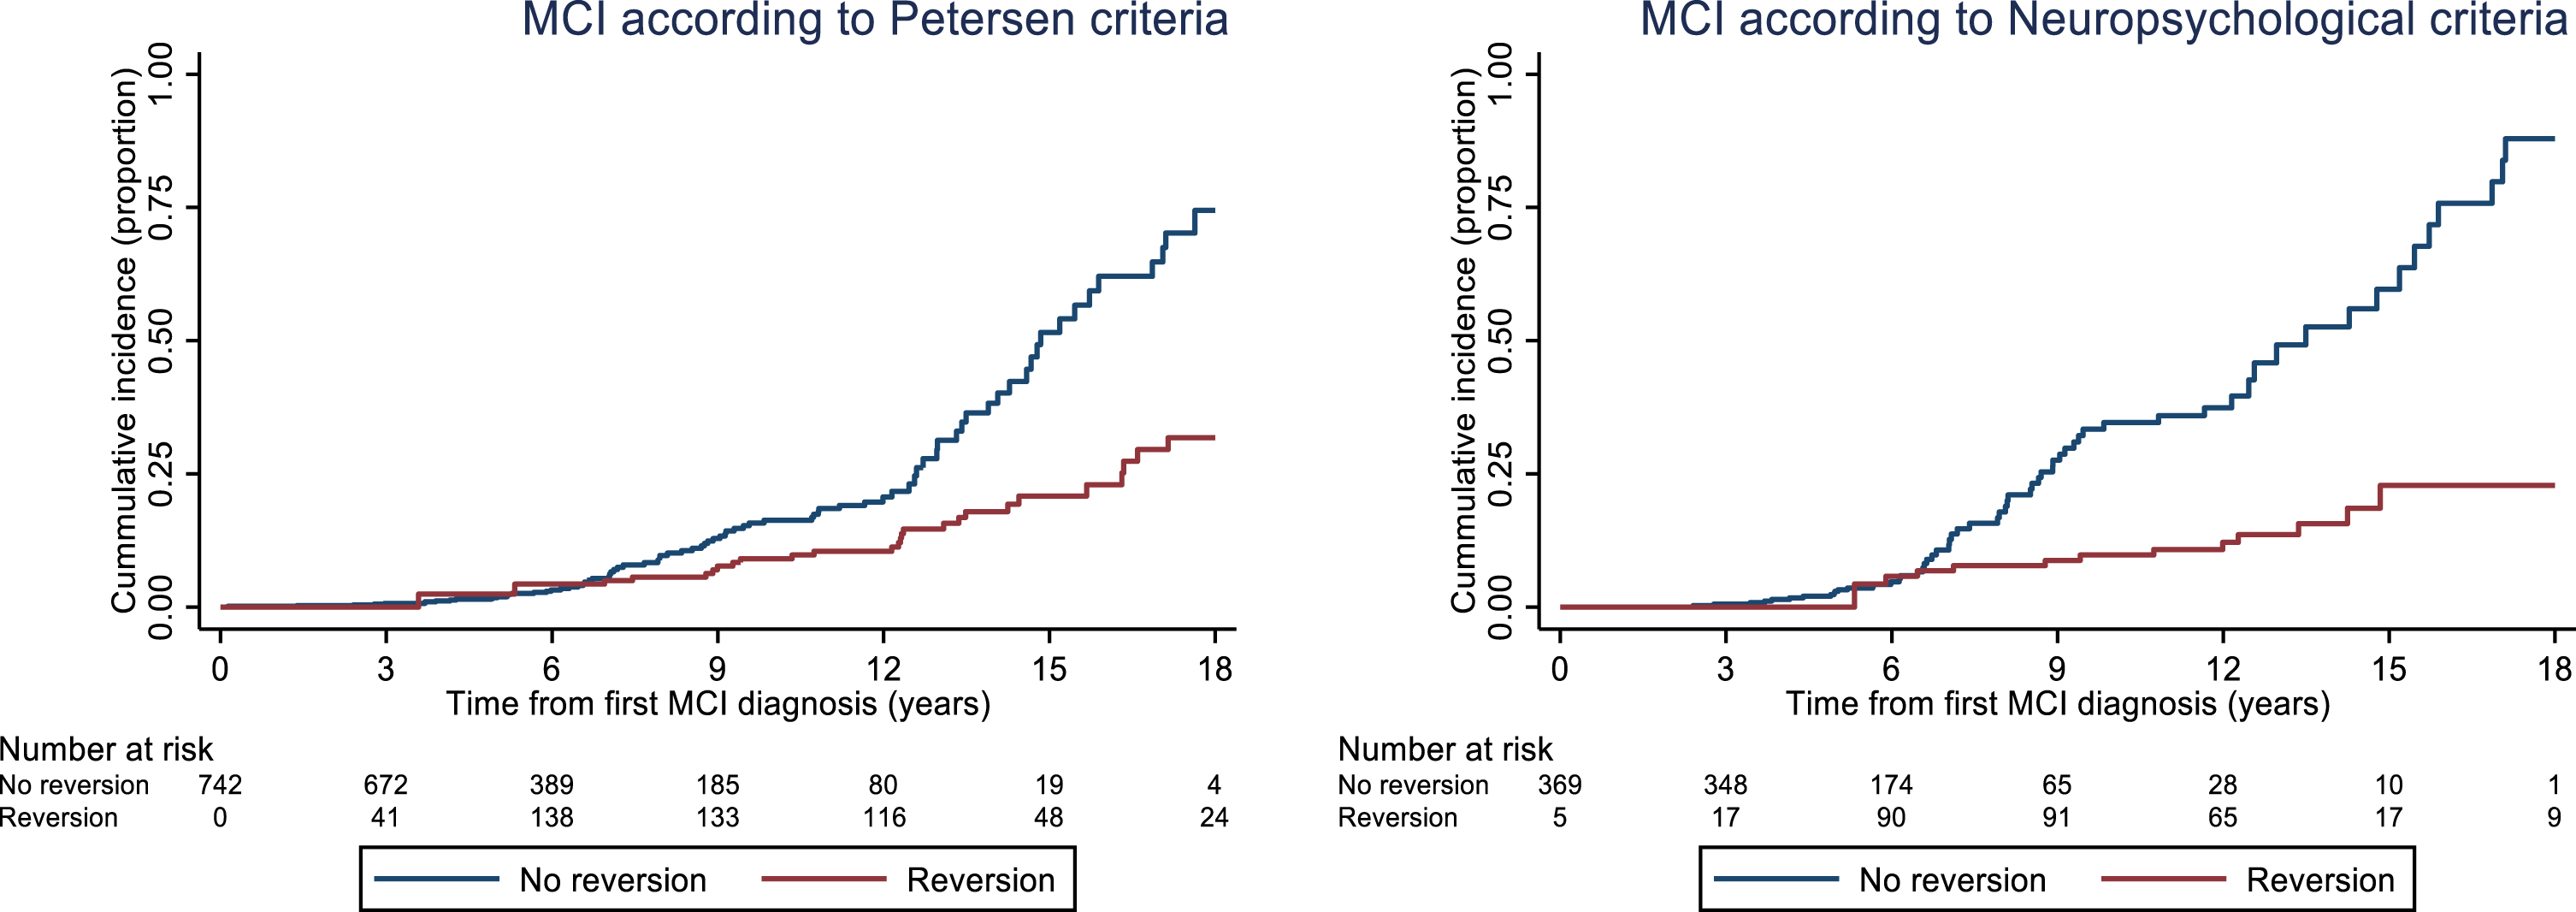
For the Petersen criteria, 111 of 7421 with baseline MCI were later diagnosed with dementia. Reverters had a lower hazard ratio (HR) (0.34, 95% CI: 0.21; 0.54) of being diagnosed with dementia compared to those with stable MCI. For the NP criteria, 74 of 374 participants with baseline MCI were later diagnosed with dementia. Reverters had a lower HR (0.17, 95% CI: 0.1; 0.34) of being diagnosed with dementia compared to those with stable MCI (Fig. 3).
Fig. 3
Cumulative incidence of dementia for participants who developed MCI according to the Petersen and Neuropsychological criteria, respectively. The curves were calculated using a Cox proportional hazard model with the occurrence of the first reversion as the only explanatory variable, which was modelled as a time-varying covariate. Of note, there are two fewer participants with baseline MCI in this analysis compared to reversion analysis (2 for Petersen criteria and 1 for NP criteria) as they were classified as dementia according to medical records but not by study physician. In this case, medical records were used for dementia diagnosis.
Baseline characteristics for reverters and stable MCI
Baseline demographics and general characteristics are presented in Table 1. On inspection slight differences were observed between reverters and non-reverters. The reverter group contained more participants that were cohabitant, had lower blood pressure, were male, and consumed more alcohol (seen for both criteria). Noticeably, there were more smokers, and they were slightly younger in the reverter group when classified according to the NP criteria.
There were observed performance differences in the cognitive tests between the reverters and the stable MCI. The majority of participants in the reverter group had only one cognitive domain affected in comparison to the stable MCI group who had additional domains affected (Petersen criteria: 86.1% versus 58.4%, NP criteria: 84.5% versus 71.6%). Cognitive test scores were overall worse in the stable MCI group in comparison to the reverter group (Table 3).
Table 3
Baseline performance scores of cognitive tests for MCI sample and for reverters and MCI stable group
| Petersen criteria | Neuropsychological criteria | |||||
| Reverters | Stable MCI | All | Reverters | Stable MCI | All | |
| (n = 323) | (n = 421) | (n = 744) | (n = 181) | (n = 194) | (n = 375) | |
| Memory tests | ||||||
| Recall test (number correctly recalled words), m (std) [min-max] | 6.5 (2.5) | 5.7 (2.2) | 6.1 (2.4) | 5.8 (2.2) | 5.3 (2.2) | 5.5 (2.2) |
| [0.0–14.0] | [0.0–12.0] | [0.0–14.0] | [0.0–12.0] | [0.0–12.0] | [0.0–12.0] | |
| Missing score, n (%) | 3 (0.9) | 9 (2.1) | 12 (1.6) | 2 (1.1) | 1 (0.5) | 3 (0.8) |
| Recognition test (hits - false hits), m (std) [min-max] | 11.2 (3.4) | 10.5 (3.3) | 10.8 (3.4) | 9.9 (3.5) | 9.9 (3.5) | 9.89 (3.5) |
| [–3.0–16.0] | [–3.0–16.0] | [–3.0–16.0] | [–3.0–16.0] | [–3.0–16.0] | [–3.0–16.0] | |
| Missing score, n, % | 8 (2.5) | 17 (4.0) | 25 (3.4) | 2 (1.1) | 6 (3.1) | 8 (2.1) |
| 5 object delay recall (number of correctly recalled objects), m (std) [min-max] | 4.7 (0.7) | 4.55 (0.7) | 4.6 (0.71) | 4.7 (0.7) | 4.5 (0.7) | 4.6 (0.7) |
| [0.0–5.0] | [1.0–5.0] | [0.0–5.0] | [0.0–5.0] | [1.0–5.0] | [0.0–5.0] | |
| Missing score, n, % | 3 (0.9) | 8 (1.9) | 11 (1.5) | 2 (1.1) | 4 (2.1) | 6 (1.6) |
| Speed of processing test | ||||||
| Digit cancellation (number of correctly identified digits), m (std) [min-max] | 17.7 (4.1) | 16.2 (4.1) | 16.9 (4.1) | 16.8 (3.6) | 15.7 (4.2) | 16.2 (3.9) |
| [8.0–29.0] | [4.0–31.0] | [4.0–31.0] | [10.0–29.0] | [6.0–27.0] | [6.0–29.0] | |
| Missing score, n, % | 3 (0.9) | 8 (1.9) | 11 (1.5) | 2 (1.1) | 5 (2.6) | 7 (1.9) |
| Pattern comparison (number of correctly identified patterns), m (std) [min-max] | 14.1 (3.6) | 12.5 (3.9) | 13.2 (3.8) | 13.8 (3.5) | 11.7 (3.7) | 12.7 (3.7) |
| [3.5–24.0] | [3.00–24.5] | [3.0–24.5] | [3.5–23.0] | [3.0–22.5] | [3.0–23.0] | |
| Missing score, n, % | 2 (0.6) | 6 (1.4) | 8 (1.1) | 0 (0.0) | 4 (2.1) | 4 (1.1) |
| Executive functioning tests | ||||||
| Trial making test B (s), m (std) [min-max] | 297 (21.9) [8.00–300.0] | 39.0 (24.9) [7.0–184.0] | 34.8 (23.9) [7.00–300.0] | 31.7 (14.7) [10.0–132.0] | 40.9 (23.8) [7.0–184.0] | 36.3 (20.3) [7.0–184.0] |
| Missing score, n, % | 38 (12.0) | 79 (18.9) | 117 (15.9) | 17 (9.4) | 31 (16.0) | 48 (12.8) |
| Digit span backwards, m (std) [min-max] | 3.84 (1.2) | 3.5 (1.1) | 3.7 (1.1) | 3.9 (1.2) | 3.5 (0.92) | 3.7 (1.1) |
| [0.0–8.0] | [0.0–7.0] | [0.0–8.0] | [0.0–8.0] | [2.0–6.0] | [0.0–8.0] | |
| Missing score, n, % | 2 (0.6) | 11 (2.6) | 13 (1.7) | 1 (0.5) | 1 (0.5) | 2 (0.5) |
| Language tests | ||||||
| Word fluency test (number of named animals), m (std) [min-max] | 20.3 (5.8) | 16.4 (6.0) | 18.1 (6.2) | 18.9 (5.7) | 14.2 (5.3) | 16.5 (6.) |
| [7.0–39.0] | [0.0–39.0] | [0.0–39.0] | [7.0–36.0] | [3.0–33.0] | [3.0–36.0] | |
| Missing score, n, % | 1 (0.3) | 13 (3.1) | 14 (1.9) | 0 (0.0) | 4 (2.1) | 4 (1.1) |
| Word fluency test (number of named professions), m (std) [min-max] | 14.8 (4.8) | 12.4 (4.8) | 13.5 (5.0) | 13.8 (4.76) | 11.1 (4.2) | 12.4 (4.7) |
| [3.0–29.0] | [0.0–31.0] | [0.0–31.0] | [3.0–31.0] | [0.0–27.0] | [0.0–31.0] | |
| Missing score, n, % | 1 (0.3) | 14 (3.3) | 15 (2.0) | 0 (0.0) | 4 (2.06) | 4 (1.1) |
Factors for reversion
Two separate multivariate Poisson regression models including all covariates were run for the Petersen and the NP criteria, respectively (Table 4). For the Petersen criteria, the models indicated that the number of affected cognitive domains, alcohol consumption, and age at classification, affected the incidence rate of reversion (Table 3). The probability of reversion for participants who had one impaired cognitive domain was 0.54 (95% CI: 0.50; 0.60). In contrast to participants with two or more impaired domains, the probability of reversion was lower 0.20 (95% CI: 0.15; 0.26). For non-consumers of alcohol, the probability of reversion was 0.35 (95% CI: 0.29; 0.41) compared to peers who reported moderate and high alcohol consumption, 0.51 (95% CI: 0.45; 0.58) and 0.49 (95% CI: 0.38; 0.59), respectively. The calculated probability of reversion for a 60-year-old participant was 0.38 (95% CI: 0.33; 0.42) while for a 70-year-old participant it was 0.46 (95% CI: 0.42; 0.50).
Table 4
Summary of the Poisson regression models with incident rate ratios for reversion using the Petersen and Neuropsychological criteria of mild cognitive impairment
| Petersen criteria | Neuropsychological criteria | |||
| Incidence rate ratio (person/year) | p | Incidence rate ratio (person/year) | p | |
| (95% CI) | (95% CI) | |||
| Living alone (cohabitant reference) | 0.86 (0.71; 1.05) | 0.136 | 0.70 (0.54; 0.92) | 0.009** |
| Moderate alcohol consumption (no/low reference) | 1.44 (1.20; 1.81) | <0.001*** | 1.24 (0.95; 1.62) | 0.119 |
| High alcohol consumption (no/low reference) | 1.40 (1.08; 1.82) | 0.010** | 1.14 (0.82; 1.59) | 0.439 |
| Female sex (male reference) | 0.91 (0.75; 1.09) | 0.291 | 0.97 (0.76; 1.22) | 0.769 |
| Age (y) | 1.02 (1.01; 1.03) | <0.001*** | 1.00 (0.98; 1.02) | 0.885 |
| BMI (kg/m2) | 0.98 (0.96; 1.01) | 0.141 | 0.97 (0.94; 0.99) | 0.046* |
| Depressive symptoms | 1.01 (0.99; 1.03) | 0.387 | 0.99 (0.97; 1.02) | 0.817 |
| Cardiovascular disease (no disease reference) | 0.89 (0.74; 1.08) | 0.239 | 0.85 (0.67; 1.08) | 0.172 |
| Smoker (non-smoker reference) | 0.98 (0.82; 1.18) | 0.869 | 1.15 (0.90; 1.47) | 0.253 |
| Sleeping disturbances (no disturbances reference) | 0.98 (0.81; 1.15) | 0.736 | 1.02 (0.81; 1.30) | 0.844 |
| Physically active (sedentary reference) | 1.14 (0.60; 2.16) | 0.692 | 1.02 (0.65; 1.59) | 0.950 |
| Two or more impaired cognitive domains (one impaired domain is reference) | 0.37 (0.27; 0.49) | <0.001*** | 0.60 (0.42; 0.86) | 0.005** |
| Years of formal education | 0.99 (0.96; 1.01) | 0.231 | 0.97 (0.94; 1.00) | 0.077 |
BMI, body max index. *p < 0.05, **p < 0.01, ***p < 0.001.
For the NP criteria, the model indicated that the number of affected cognitive domains, cohabitation, and BMI affect the incidence rate ratio of reversion. The probability of reversion for participants who had one impaired cognitive domain was 0.53 (95% CI: 0.47; 0.60). In contrast to participants with two or more impaired domains, the estimated probability of reversion was lower 0.32 (95% CI: 0.21; 0.42). For those living alone, the probability of reversion was 0.38 (95% CI: 0.30; 0.46) compared to peers cohabiting 0.54 (95% CI: 0.47; 0.62), respectively. The probability of reversion for a participant with a BMI of 18.5 kg/m2, 24.9 kg/m2, and 29.9 kg/m2 was 0.62 (95% CI: 0.46; 0.79), 0.51 (95% CI: 0.45; 0.57), and 0.43 (95% CI: 0.37; 0.50), respectively.
DISCUSSION
This study reports MCI reversion rates between 42–48% in a Swedish population sample, and similar reversion rates were found between two commonly applied definitions of MCI, the Petersen and the NP criteria. Our results show that those with stable MCI were more likely to progress to dementia than reverters, regardless of applied criteria. Additionally, fewer impaired cognitive domains, older age, alcohol consumption, lower BMI, and cohabitation at the time of MCI diagnosis increased the likelihood for reversion.
Reversion rates
Our reversion rates of 42.4% and 48.3% are higher than the 25% established in a meta-analysis [10], although they are within the reported range of 4%–59%. Moreover, they are lower than our previously established rate [8], and similar to rates from two studies applying the Petersen criteria: 37% [22] and 38% [37]. The handful of studies examining reversion rates, when applying the NP criteria, found fairly low rates of 7.4%, 11.4%, 15.8%, and 19.2% [14–16, 38]. Three of these studies also made a direct comparison to the Petersen criteria, all of which produced higher reversion rates, arguing that the Petersen criteria is overinclusive, and that the NP criteria is better in detecting true MCI. Noticeably, the reverter comparison group (i.e., the non reverters) contained other trajectory groups than stable MCI (in all of the above studies). For example, Wong and colleagues [15] reported reversion rates of 7.4% for NP and 13.5% for Petersen, but the reverter comparison group contained progressors, those with stable MCI, and those with stable intact cognition. Remarkedly, taking the same number of reverters and only comparing them to stable MCI, rates appear different with a reversion of 30.7.% for the NP and 27.8% for the Petersen criteria, thereby questioning their conclusion that the Petersen criteria is overinclusive. Additionally, it is common practice to omit cognitive complaint as a requirement for a NP MCI classification. Our sensitivity analysis showed a higher reversion rate for the NP criteria when cognitive complaint was omitted (54.7% versus 48.3%). Although, the rate discrepancy is fairly minor, it questions the value in excluding this criterion, which we argue is important as it provides an important context when interpreting the impaired test result. Additionally, both our operationalizations were successful in identifying dementia progressors, as our stable MCI groups had a higher risk of dementia in both criteria compared to the reverter groups.
These inferences, together with our results, has implications. Firstly, the NP criteria does not necessarily, in comparison to Petersen, decrease the risk of false positives [4]. Secondly, the requirement of two tests for each cognitive domain may be superfluous, which is encouraging as extensive testing could, due to fatigue, lead to unjust impaired scores. Also, previous work using data from the GÅS study showed that less than two impaired test scores per cognitive domain was not associated with reversion [8]. Thirdly, additional features for the criterion objective cognitive impairment in the MCI definition could be of equal importance in determining stability and progression. For instance, test characteristics (e.g., the reliability and validity of instruments), total number of measured domains, or level of cut-off. Finally, when comparing reversion rates, researchers must be mindful of the comparison group in addition to how reversion is defined, as rates can vary substantially thereof.
The reversion rate for NP criteria was calculated using a smaller sample than for the Petersen criteria, as it required more cognitive data for MCI classification. The sensitivity analysis, using the same participants, showed that the Petersen criteria produced a reversion rate of 13.5 percentage points lower than for the NP criteria. This supports our previous inference that the Petersen criteria is not overinclusive in comparison to the NP criteria. The reversion definition applied here could be considered strict, as it required all the MCI criteria, except for objective cognitive impairment, to be fulfilled. This potentially leads to the exclusion of stable MCI and reverter cases at follow-up, since functional and self-experienced cognitive deterioration is part of normal aging [39]. Therefore, sensitivity analyses were performed with more lenient eligibility criteria for MCI reversion. The results showed similar reversion rates across reversion definitions, indicating the robustness of our primary results. Nevertheless, we urge researchers to provide detailed information on the inclusion criteria for the cognitively intact, stable MCI, and reverters, to enable accurate rate comparisons across studies.
Factors for reversion
We found that the factors associated with reversion were criteria dependent, and the only common feature was having fewer than two impaired cognitive domains. Our results support the evidence that more than one affected cognitive domain is of importance for the future MCI trajectory, as it likely reflects both a more advanced and severe stage of the cognitive impairment [40, 41]. Studies consistently find that multiple domain MCI is associated with dementia progression [39, 42, 43], as singular domain MCI is equally associated with reversion [8, 16, 24, 44]. In addition, multiple domain is more diagnostically stable, where fewer individuals go from multiple domain to singular domain than vice versa [7, 8]. In summation, our results imply that the number of domains affected may be more crucial for diagnostic stability, and further progression, than the number of impaired scores in each domain.
Similar to our findings, that cohabitation appears beneficial for reversion, being married has been found to increase the likelihood of reversion [23], whereas living alone is associated with MCI progression and accelerated onset [45]. We assume that individuals who live with someone, or are married, have a day-to-day social contact, and social interaction evidently decreases risk of dementia [28]. Mental and social stimulation accompanying cohabitation is argued to promote cognitive reserve [46], but also perhaps shield from further cognitive deterioration [23], as people living with someone are more likely to seek help or comply with treatment. Noticeably, one study found that unmarried individuals reverted more often in comparison to progressors [25]. Others have argued that cohabiting or being married will hinder detection of cognitive impairment due to compensating factors of the partner or family member, or even due to denial of their partner’s cognitive deterioration [47]. Suggestively, further research on the role of marital status and cohabitation on MCI stability is warranted.
In this study alcohol consumption, both moderate and high consumption, increased the likelihood of MCI reversion in comparison to no or little consumption, which is consistent with reports from previous reversion studies [24, 48]. Partially contradictory to this, other studies conclude the alcohol-cognitive decline relationship to be dose response dependent, where moderate intake decreases risk of MCI progression and heavy drinking elevates risk [49, 50]. Then it is unexpected that our non/light-consumer group had a lower chance of reverting in comparison to our heavy consumers. Two explanations can be offered. Firstly, the light/non consumers contained unhealthy participants with deteriorated cognition leading to reduced or complete refrainment of alcohol consumption due to health-related issues. Noticeably, no differences in risk of reversion for low and non-consumers was detected in a sensitivity analysis (Supplementary Material) indicating that these two groups were similar. Secondly, heavy consumers or abusers could have stopped drinking leading to better cognitive health and reversion [48]. Markedly, alcohol consumption could directly reflect a rich social life, which we have noted above to be beneficial for cognitive health in older age.
Lower BMI was significantly associated with reversion. Prior studies produce contradictory outcomes, showing that both higher and lower BMI is linked to dementia progression [51–53]. Although, previous studies have failed to link BMI specifically with reversion. In our study, the incidence rate of reversion was only slightly affected by BMI (IRR: 0.97) in a fully adjusted model concluding then that the relevancy of BMI warrants further examination.
Opposing most previous work (e.g., [8, 21, 25]), but not all [54], older age was associated with reversion. This probably reflects a study design feature where healthy individuals are more prone to attend follow-up examinations and therefore cognitively preserved older adults are overrepresented in our sample.
Although sleep disturbances are more common in those with MCI, in comparison to those with normal cognition [30], our study showed similar frequencies in reported sleeping disturbances between reverters and those with stable MCI. A proposed explanation involves the nature of the sleep disturbance, as impaired cognition is mostly seen with abnormal sleep duration (short or long sleep), sleep apnea, and sleep-fragmentation [55]. We used an aggregated sleep variable containing multiple sleep disturbances, possibly being too general to detect variability in sleeping patterns for reverters and non-reverters. Consequently, further research on this potential factor for reversion is warranted.
It is well established that higher educational attainment reduces dementia risk [28] and incident MCI. Yet many previous studies (e.g., [39, 56]), including ours, fail to find that higher level of education predicts reversion [8, 21, 24, 54]. Given the similarity in duration of formal education between reverters and stable MCI, and the high level of education (11.4 years), we were not able to conclude the educational effect on reversion. Moreover, by applying education-corrected norm-scoring, when classifying the impaired from the non-impaired group, differences are reduced.
Strengths and limitations
There are several strengths to this study. Firstly, the GÅS study enables research of several large cohorts that are followed longitudinally over a long period of time, which in turn generates a large sample size of MCI participants. Secondly, the data gathering and testing of the participants is consistent between visits, ensuring cognitive impairment to be assessed equally each time. Thirdly, participants medical history was complemented with registry data. As registering a patient’s diagnosis is mandatory by law, all participants that received a dementia diagnosis via healthcare, up until the end of registry follow-up, could be incorporated in the analysis. Notably, underdiagnosis of dementia is a common issue in elderly populations, and consequently some undetected dementia cases in this study were considered non-demented. Lastly, data from GÅSs’ sister studies enabled a robust normative group.
This study is not without limitations. About 30% were lost to follow-up. Frail participants are less likely to attend follow-up visits, which could produce higher reversion rates since the healthiest returned to follow-up visits. To mitigate this effect, home visits were offered. Moreover, main baseline characteristics between attenders and those lost to follow-up were contrasted (Supplementary Material). Participants lost to follow-up, and ineligible for the application of the chosen MCI criteria (missing data or ADL-dependent), were somewhat older but otherwise had similar characteristics as those remaining in the study. Therefore, attrition bias may only play a minimal role on reversion rates. A second limitation involves reversion due to practice effects. Our participants were followed until a reversion event occurred, exposing them to multiple testing sessions, potentially leading to practice effects that masked true decline [57]. Since we implemented an extensive test battery with a larger number of non-amnestic tests, the likelihood of finding non-amnestic MCI subjects is artificially high.
Furthermore, other explanations of cognitive impairment are overlooked when applying an algorithmic approach in comparison to a consensus approach, such as, e.g., stress, distraction during testing, or side-effects of medication. Although, it is not feasible to retrospectively apply a consensus approach to a sample of over 5,000 individuals. Lastly, the present study does not examine biomarkers, genetics, or brain imaging, which could strengthen MCI diagnosis.
Future research should explore if inverse risk factors for incident MCI, or progression, are the same for MCI reversion, and examine the roll of variation in predictors between examinations (e.g., reversal of depression, or better sleeping habits). Additionally, research could focus on the status and characteristics of individuals with MCI that are typically excluded from further analyses, as they no longer meet certain criteria for MCI, reversion, or dementia at follow-up. In our sample, this was a substantial number of MCI cases (35.9% and 38.3%, for the Petersen and the NP criteria, respectively). Recent work suggests that some of these individuals (e.g., those who did not fulfil the MCI criteria because their daily function declined) are actually characteristically similar to dementia progressors [39]. Thus, this unrepresentative group of individuals can provide valuable information on MCI trajectories.
Conclusion
This work found that the 42–48% of participants that met the MCI criteria reverted at some point after diagnosis. Our results suggest that two impaired tests within the same cognitive domain and with a lenient cut-off, were not necessarily superior in diagnostic stability than when applying one test and a less lenient cut-off. Nevertheless, the search of a gold standard in the operationalization of the MCI definition, especially in the context of number of tests and optimal cut-off scores, should continue. This is especially vital as poor diagnostic stability renders high reversion rates, poor identification of factors associated with reversion and dementia progression. One ultimate goal in MCI research is to achieve precise predictions for progression, in order to enable successful drug interventions [58]. Finally, our results express important aspects of daily social stimulation, the severity of the cognitive impairment, the role of alcohol consumption, BMI, and age on predicting the future path of those diagnosed with MCI.
ACKNOWLEDGMENTS
The authors want to thank the GÅS-participants and GÅS-team members for collecting the data. The SNAC-GÅS study is funded by Swedish Ministry of Health and Social Affairs, the county Region Skåne, the Medical Faculty at Lund University, and the Swedish Research Council (grant number: No 20117-00639 and No 2017-01613).
Authors’ disclosures available online (https://www.j-alz.com/manuscript-disclosures/22-0597r3).
SUPPLEMENTARY MATERIAL
{ label (or @symbol) needed for fn } The supplementary material is available in the electronic version of this article: https://dx.doi.org/10.3233/JAD-JAD220597.
REFERENCES
[1] | Petersen RC ((2004) ) Mild cognitive impairment as a diagnostic entity. J Intern Med 256: , 183–194. |
[2] | Petersen RC , Caracciolo B , Brayne C , Gauthier S , Jelic V , Fratiglioni L ((2014) ) Mild cognitive impairment: A concept in evolution. J Intern Med 275: , 214–228. |
[3] | Winblad B , Palmer K , Kivipelto M , Jelic V , Fratiglioni L , Wahlund LO , Nordberg A , Bäckman L , Albert M , Almkvist O , Arai H , Basun H , Blennow K , de Leon M , DeCarli C , Erkinjuntti T , Giacobini E , Graff C , Hardy J , Jack C , Jorm A , Ritchie K , van Duijn C , Visser P , Petersen RC ((2004) ) Mild cognitive impairment–beyond controversies, towards a consensus: Report of the International Working Group on Mild Cognitive Impairment. J Intern Med 256: , 240–246. |
[4] | Edmonds EC , Delano-Wood L , Clark LR , Jak AJ , Nation DA , McDonald CR , Libon DJ , Au R , Galasko D , Salmon DP , Bondi MW , Alzheimer’s Disease Neuroimaging Initiative ((2015) ) Susceptibility of the conventional criteria for mild cognitive impairment to false-positive diagnostic errors. Alzheimers Dement 11: , 415–424. |
[5] | Bondi MW , Edmonds EC , Jak AJ , Clark LR , Delano-Wood L , McDonald CR , Nation DA , Libon DJ , Au R , Galasko D , Salmon DP ((2014) ) Neuropsychological criteria for mild cognitive impairment improves diagnostic precision, biomarker associations, and progression rates. J Alzheimers Dis 42: , 275–289. |
[6] | Brodaty H , Aerts L , Crawford JD , Heffernan M , Kochan NA , Reppermund S , Kang K , Maston K , Draper B , Trollor JN , Sachdev PS ((2017) ) Operationalizing the diagnostic criteria for mild cognitive impairment: The salience of objective measures in predicting incident dementia. Am J Geriatr Psychiatry 25: , 485–497. |
[7] | Han JW , Kim TH , Lee SB , Park JH , Lee JJ , Huh Y , Park JE , Jhoo JH , Lee DY , Kim KW ((2012) ) Predictive validity and diagnostic stability of mild cognitive impairment subtypes. Alzheimers Dement 8: , 553–559. |
[8] | Overton M , Pihlsgård M , Elmståhl S ((2019) ) Diagnostic stability of mild cognitive impairment, and predictors of reversion to normal cognitive functioning. Dement Geriatr Cogn Disord 48: , 317–329. |
[9] | Clem MA , Holliday RP , Pandya S , Hynan LS , Lacritz LH , Woon FL ((2017) ) Predictors that a diagnosis of mild cognitive impairment will remain stable 3 years later. Cogn Behav Neurol 30: , 8–15. |
[10] | Canevelli M , Grande G , Lacorte E , Quarchioni E , Cesari M , Mariani C , Bruno G , Vanacore N ((2016) ) Spontaneous reversion of mild cognitive impairment to normal cognition: A systematic review of literature and meta-analysis. J Am Med Dir Assoc 17: , 943–948. |
[11] | Chung JY , Yoon HJ , Kim H , Choi KY , Lee JJ , Lee KH , Seo EH ((2019) ) Reversion from mild cognitive impairment to normal cognition: False-positive error or true restoration thanks to cognitive control ability? Neuropsychiatr Dis Treat 15: , 3021–3032. |
[12] | Petersen RC , Lopez O , Armstrong MJ , Getchius TSD , Ganguli M , Gloss D , Gronseth GS , Marson D , Pringsheim T , Day GS , Sager M , Stevens J , Rae-Grant A ((2018) ) Practice guideline update summary: Mild cognitive impairment: Report of the Guideline Development, Dissemination, and Implementation Subcommittee of the American Academy of Neurology. Neurology 90: , 126–135. |
[13] | Jak AJ , Bondi MW , Delano-Wood L , Wierenga C , Corey-Bloom J , Salmon DP , Delis DC ((2009) ) Quantification of five neuropsychological approaches to defining mild cognitive impairment. Am J Geriatr Psychiatry 17: , 368–375. |
[14] | Jak AJ , Preis SR , Beiser AS , Seshadri S , Wolf PA , Bondi MW , Au R ((2016) ) Neuropsychological criteria for mild cognitive impairment and dementia risk in the Framingham Heart Study. J Int Neuropsychol Soc 22: , 937–943. |
[15] | Wong CG , Thomas KR , Edmonds EC , Weigand AJ , Bangen KJ , Eppig JS , Jak AJ , Devine SA , Delano-Wood L , Libon DJ , Edland SD , Au R , Bondi MW ((2018) ) Neuropsychological criteria for mild cognitive impairment in the Framingham Heart Study’s Old-Old. Dement Geriatr Cogn Disord 46: , 253–265. |
[16] | Thomas KR , Edmonds EC , Eppig JS , Wong CG , Weigand AJ , Bangen KJ , Jak AJ , Delano-Wood L , Galasko DR , Salmon DP , Edland SD , Bondi MW , Alzheimer’s Disease Neuroimaging Initiative ((2019) ) MCI-to-normal reversion using neuropsychological criteria in the Alzheimer’s Disease Neuroimaging Initiative. Alzheimers Dement 15: , 1322–1332. |
[17] | Nikolai T , Děchtěrenko F , Yaffe B , Georgi H , Kopecek M , Červenková M , Vyhnálek M , Bezdicek O ((2022) ) Reducing misclassification of mild cognitive impairment based on base rate information from the Uniform data set. Aging Neuropsychol Cogn. doi: 10.1080/13825585.2021.2022593. |
[18] | Binder LM , Iverson GL , Brooks BL ((2009) ) To err is human: “Abnormal” neuropsychological scores and variability are common in healthy adults. Arch Clin Neuropsychol 24: , 31–46. |
[19] | Loewenstein DA , Acevedo A , Small BJ , Agron J , Crocco E , Duara R ((2009) ) Stability of different subtypes of mild cognitive impairment among the elderly over a 2- to 3-year follow-up period. Dement Geriatr Cogn Disord 27: , 418–423. |
[20] | Clark LR , Delano-Wood L , Libon DJ , McDonald CR , Nation DA , Bangen KJ , Jak AJ , Au R , Salmon DP , Bondi MW ((2013) ) Are empirically-derived subtypes of mild cognitive impairment consistent with conventional subtypes? J Int Neuropsychol Soc 19: , 635–645. |
[21] | Koepsell TD , Monsell SE ((2012) ) Reversion from mild cognitive impairment to normal or near-normal cognition: Risk factors and prognosis. Neurology 79: , 1591–1598. |
[22] | Artero S , Ancelin M-L , Portet F , Dupuy A , Berr C , Dartigues J-F , Tzourio C , Rouaud O , Poncet M , Pasquier F , Auriacombe S , Touchon J , Ritchie K ((2008) ) Risk profiles for mild cognitive impairment and progression to dementia are gender specific. J Neurol Neurosurg Psychiatry 79: , 979–984. |
[23] | Roberts RO , Knopman DS , Mielke MM , Cha RH , Pankratz VS , Christianson TJH , Geda YE , Boeve BF , Ivnik RJ , Tangalos EG , Rocca WA , Petersen RC ((2014) ) Higher risk of progression to dementia in mild cognitive impairment cases who revert to normal. Neurology 82: , 317–325. |
[24] | Sachdev PS , Lipnicki DM , Crawford J , Reppermund S , Kochan NA , Trollor JN , Wen W , Draper B , Slavin MJ , Kang K , Lux O , Mather KA , Brodaty H , Sydney Memory, Ageing Study Team ((2013) ) Factors predicting reversion from mild cognitive impairment to normal cognitive functioning: A population-based study. PLoS One 8: , e59649. |
[25] | Pandya SY , Lacritz LH , Weiner MF , Deschner M , Woon FL ((2017) ) Predictors of reversion from mild cognitive impairment to normal cognition. Dement Geriatr Cogn Disord 43: , 204–214. |
[26] | Tokuchi R , Hishikawa N , Kurata T , Sato K , Kono S , Yamashita T , Deguchi K , Abe K ((2014) ) Clinical and demographic predictors of mild cognitive impairment for converting to Alzheimer’s disease and reverting to normal cognition. J Neurol Sci 346: , 288–292. |
[27] | ShimadaH, DoiT, LeeS, MakizakoH ((2019) ) Reversible predictors of reversion from mild cognitive impairment to normal cognition: A 4-year longitudinal study. Alzheimers Res Ther 11: , 24. |
[28] | Livingston G , Huntley J , Sommerlad A , Ames D , Ballard C , Banerjee S , Brayne C , Burns A , Cohen-Mansfield J , Cooper C , Costafreda SG , Dias A , Fox N , Gitlin LN , Howard R , Kales HC , Kivimäki M , Larson EB , Ogunniyi A , Orgeta V , Ritchie K , Rockwood K , Sampson EL , Samus Q , Schneider LS , Selbæk G , Teri L , Mukadam N ((2020) ) Dementia prevention, intervention, and care: 2020 report of the Lancet Commission. Lancet 396: , 413–446. |
[29] | Shi L , Chen S-J , Ma M-Y , Bao Y-P , Han Y , Wang Y-M , Shi J , Vitiello MV , Lu L ((2018) ) Sleep disturbances increase the risk of dementia: A systematic review and meta-analysis. Sleep Med Rev 40: , 4–16. |
[30] | da Silva RAPC ((2015) ) Sleep disturbances and mild cognitive impairment: A review. Sleep Sci 8: , 36–41. |
[31] | Ekström H , Elmståhl S ((2006) ) Pain and fractures are independently related to lower walking speed and grip strength: Results from the population study “Good Ageing in Skane”. Acta Orthop 77: , 902–911. |
[32] | Overton M , Pihlsgård M , Elmståhl S ((2018) ) Up to speed: Birth cohort effects observed for speed of processing in older adults: Data from the Good Ageing in Skåne population study. Intelligence 67: , 33–43. |
[33] | Lagergren M , Fratiglioni L , Hallberg IR , Berglund J , Elmståhl S , Hagberg B , Holst G , Rennemark M , Sjölund BM , Thorslund M , Wiberg I , Winblad B , Wimo A ((2004) ) A longitudinal study integrating population, care and social services data. The Swedish National study on Aging and Care (SNAC). Aging Clin Exp Res 16: , 158–168. |
[34] | Katz S , Akpom CA ((1976) ) A measure of primary sociobiological functions. Int J Health Serv 6: , 493–508. |
[35] | Lawton MP , Brody EM ((1969) ) Assessment of older people: Self-maintaining and instrumental activities of daily living. Gerontologist 9: , 179–186. |
[36] | Montgomery SA , Asberg M ((1979) ) A new depression scale designed to be sensitive to change. Br J Psychiatry 134: , 382–389. |
[37] | Matthews FE , Stephan BC , McKeith IG , Bond J , Brayne C , Medical Research Council Cognitive F, Ageing S ((2008) ) Two-year progression from mild cognitive impairment to dementia: To what extent do different definitions agree? J Am Geriatr Soc 56: , 1424–1433. |
[38] | Thomas KR , Cook SE , Bondi MW , Unverzagt FW , Gross AL , Willis SL , Marsiske M ((2020) ) Application of neuropsychological criteria to classify mild cognitive impairment in the active study. Neuropsychology 34: , 862–873. |
[39] | Angevaare MJ , Vonk JMJ , Bertola L , Zahodne L , Watson CW , Boehme A , Schupf N , Mayeux R , Geerlings MI , Manly JJ ((2022) ) Predictors of incident mild cognitive impairment and its course in a diverse community-based population. Neurology 98: , e15–e26. |
[40] | Gainotti G , Quaranta D , Vita MG , Marra C ((2014) ) Neuropsychological predictors of conversion from mild cognitive impairment to Alzheimer’s disease. J Alzheimers Dis 38: , 481–495. |
[41] | Ganguli M , Snitz BE , Saxton JA , Chang CC , Lee CW , Vander Bilt J , Hughes TF , Loewenstein DA , Unverzagt FW , Petersen RC ((2011) ) Outcomes of mild cognitive impairment by definition: A population study. Arch Neurol 68: , 761–767. |
[42] | Aerts L , Heffernan M , Kochan NA , Crawford JD , Draper B , Trollor JN , Sachdev PS , Brodaty H ((2017) ) Effects of MCI subtype and reversion on progression to dementia in a community sample. Neurology 88: , 2225–2232. |
[43] | Klekociuk SZ , Summers MJ ((2014) ) Exploring the validity of mild cognitive impairment (MCI) subtypes: Multiple-domain amnestic MCI is the only identifiable subtype at longitudinal follow-up. J Clin Exp Neuropsychol 36: , 290–301. |
[44] | Manly JJ , Tang MX , Schupf N , Stern Y , Vonsattel JP , Mayeux R ((2008) ) Frequency and course of mild cognitive impairment in a multiethnic community. Ann Neurol 63: , 494–506. |
[45] | Grande G , Vetrano DL , Cova I , Pomati S , Mattavelli D , Maggiore L , Cucumo V , Ghiretti R , Vanacore N , Mariani C , Rizzuto D ((2018) ) Living alone and dementia incidence: A clinical-based study in people with mild cognitive impairment. J Geriatr Psychiatry Neurol 31: , 107–113. |
[46] | Håkansson K , Rovio S , Helkala E-L , Vilska A-R , Winblad B , Soininen H , Nissinen A , Mohammed AH , Kivipelto M ((2009) ) Association between mid-life marital status and cognitive function in later life: Population based cohort study. BMJ 339: , b2462. |
[47] | Bradford A , Kunik ME , Schulz P , Williams SP , Singh H ((2009) ) Missed and delayed diagnosis of dementia in primary care: Prevalence and contributing factors. Alzheimer Dis Assoc Disord 23: , 306–314. |
[48] | Roberts R , Knopman DS ((2013) ) Classification and epidemiology of MCI. Clin Geriatr Med 29: , 753–772. |
[49] | Xu G , Liu X , Yin Q , Zhu W , Zhang R , Fan X ((2009) ) Alcohol consumption and transition of mild cognitive impairment to dementia. Psychiatry Clin Neurosci 63: , 43–49. |
[50] | Lao Y , Hou L , Li J , Hui X , Yan P , Yang K ((2021) ) Association between alcohol intake, mild cognitive impairment and progression to dementia: A dose-response meta-analysis. Aging Clin Exp Res 33: , 1175–1185. |
[51] | Joo SH , Yun SH , Kang DW , Hahn CT , Lim HK , Lee CU ((2018) ) Body mass index in mild cognitive impairment according to age, sex, cognitive intervention, and hypertension and risk of progression to Alzheimer’s disease. Front Psychiatry 9: , 142. |
[52] | Cronk BB , Johnson DK , Burns JM , Alzheimer’s Disease Neuroimaging Initiative ((2010) ) Body mass index and cognitive decline in mild cognitive impairment. Alzheimer Dis Assoc Disord 24: , 126–130. |
[53] | Cova I , Clerici F , Maggiore L , Pomati S , Cucumo V , Ghiretti R , Galimberti D , Scarpini E , Mariani C , Caracciolo B ((2016) ) Body mass index predicts progression of mild cognitive impairment to dementia. Dement Geriatr Cogn Disord 41: , 172–180. |
[54] | Welstead M , Luciano M , Muniz-Terrera G , Saunders S , Mullin DS , Russ TC ((2021) ) Predictors of mild cognitive impairment stability, progression, or reversion in the Lothian Birth Cohort 1936. J Alzheimers Dis 80: , 225–232. |
[55] | Yaffe K , Falvey CM , Hoang T ((2014) ) Connections between sleep and cognition in older adults. Lancet Neurol 13: , 1017–1028. |
[56] | Lopez OL , Jagust WJ , Dulberg C , Becker JT , DeKosky ST , Fitzpatrick A , Breitner J , Lyketsos C , Jones B , Kawas C ((2003) ) Risk factors for mild cognitive impairment in the Cardiovascular Health Study Cognition Study: Part 2. Arch Neurol 60: , 1394–1399. |
[57] | Sanderson-Cimino M , Elman JA , Tu XM , Gross AL , Panizzon MS , Gustavson DE , Bondi MW , Edmonds EC , Eppig JS , Franz CE , Jak AJ , Lyons MJ , Thomas KR , Williams ME , Kremen WS ((2022) ) Practice effects in mild cognitive impairment increase reversion rates and delay detection of new impairments. Front Aging Neurosci 14: , 847315. |
[58] | Graves LV , Edmonds EC , Thomas KR , Weigand AJ , Cooper S , Bondi MW ((2020) ) Evidence for the utility of actuarial neuropsychological criteria across the continuum of normal aging, mild cognitive impairment, and dementia. J Alzheimers Dis 78: , 371–386. |
Notes
1 There were fewer at risk MCI participants (1 for Petersen and 2 for NP) included in the dementia analysis as there were discrepancies between GÅS diagnosis and medical records. In this analysis, medical records were used for dementia diagnosis.


