
Monitoring Alzheimer’s Disease Progression in Mild Cognitive Impairment Stage Using Machine Learning-Based FDG-PET Classification Methods
Abstract
Background:
We previously introduced a machine learning-based Alzheimer’s Disease Designation (MAD) framework for identifying AD-related metabolic patterns among neurodegenerative subjects.
Objective:
We sought to assess the efficiency of our MAD framework for tracing the longitudinal brain metabolic changes in the prodromal stage of AD.
Methods:
MAD produces subject scores using five different machine-learning algorithms, which include a general linear model (GLM), two different approaches of scaled subprofile modeling, and two different approaches of a support vector machine. We used our pre-trained MAD framework, which was trained based on metabolic brain features of 94 patients with AD and 111 age-matched cognitively healthy (CH) individuals. The MAD framework was applied on longitudinal independent test sets including 54 CHs, 51 stable mild cognitive impairment (sMCI), and 39 prodromal AD (pAD) patients at the time of the clinical diagnosis of AD, and two years prior.
Results:
The GLM showed excellent performance with area under curve (AUC) of 0.96 in distinguishing sMCI from pAD patients at two years prior to the time of the clinical diagnosis of AD while other methods showed moderate performance (AUC: 0.7–0.8). Significant annual increment of MAD scores were identified using all five algorithms in pAD especially when it got closer to the time of diagnosis (p < 0.001), but not in sMCI. The increased MAD scores were also significantly associated with cognitive decline measured by Mini-Mental State Examination in pAD (q < 0.01).
Conclusion:
These results suggest that MAD may be a relevant tool for monitoring disease progression in the prodromal stage of AD.
INTRODUCTION
Alzheimer’s disease (AD) is the most common cause of dementia. In 2020, it was estimated that 58.66 million people suffer from dementia, and this number is expected to increase to 152 million by 2050 [1]. AD can be definitively diagnosed after death by testing brain tissue in an autopsy and identifying the pathological hallmarks of AD, such as amyloid plaques and neurofibrillary tangles [2]. Probable and possible diagnosis can be made based on clinical assessment [3]. However, these clinical indicators emerge in the later disease stages, and the clinical diagnosis of AD is modestly sensitive, but remarkably nonspecific under a wide range of evaluation criteria (sensitivity: 70.9% –87.3%, specificity: 44.3% –70.8%) when compared to postmortem diagnosis [4].
The ability to monitor the progression of AD in clinical practice has important consequences for patient care. Not only would identifying those patients with MCI who are at risk of developing AD allow for a judicious prescription of disease-modifying pharmaceuticals (such as aducanumab [5]), but a paradigm of early detection and diagnosis can allow the time required for the effects of non-pharmaceutical approaches in delaying the onset or severity of symptoms to manifest, such as the purposeful maintenance of cognitive reserve or social stimulation therapy [6]. A number of neuroimaging studies have shown that the changes in levels of amyloid-β42, levels of phosphorylated tau, and temporoparietal hypometabolism on 18F-fluorodeoxyglucose (18F-FDG) positron emission tomography (PET) can be considered as complementary AD diagnostic markers [7], which may be able to diagnose AD a couple years prior to clinical symptoms.
18F-FDG is the most widely used radiotracer for PET, which can monitor the glucose metabolic activity in different regions of the brain in vivo. It has been suggested that 18F-FDG-PET can identify functional changes before anatomical changes occur [8]. The pattern of hypometabolism in the posterior cingulate gyrus, parahippocampal gyrus, posterior parietal cortex, middle and inferior temporal gyri regions have been consistently reported in 18F-FDG-PET studies in AD, compared to age-matched cognitively healthy individuals [9, 10]. A systemic review suggested that using 18F-FDG-PET can achieve moderate level of sensitivity (78–98%) and specificity (78–99%) for early detection of AD [11].
Recent development of machine learning techniques showed promising potential in aiding 18F-FDG-PET readings with improved prediction performance (i.e., classification accuracy: 85% to 100%) [12]. Previously, we developed a machine learning-based Alzheimer’s Disease Designation (MAD) algorithm that summarizes the whole-brain metabolic activity into a single value (i.e., MAD score) using different machine-learning algorithms such as a general linear model (GLM), scaled subprofile modeling (SSM), and a support vector machine (SVM) [13]. MAD reliably classified patients with early-stage AD versus age-matched healthy controls with high sensitivity (84%) and specificity (95%) in 10-fold cross-validation. A higher MAD score would imply an AD-related metabolic pattern and advanced cognitive impairment [13]. The MAD score was used as an informative metric for early detection of AD conversion at cross-sectional analysis [13]. However, it has not been tested if MAD can also be used to monitor disease progression (e.g., would a non-increasing MAD score in response to anti-AD treatment suggest that disease progression has been deterred?).
In this study, we sought to test the reliability of the MAD framework for monitoring AD progression in the prodromal stage (i.e., mild cognitive impairment, MCI). MCI is a stage before the mild AD stage, where a patient can maintain most of daily functions independently while cognitive abnormalities can be detected with comprehensive clinical testing. It is the earliest stage when symptoms may be evident. To this end, we applied our pre-trained MAD framework, as developed in [13], on a set of longitudinal 18F-FDG-PET scans that we have identified from the Alzheimer’s Disease Neuroimaging Initiative (ADNI; https://adni.loni.usc.edu/) database. We tested if MAD scores can discriminate MCI patients who progress to AD (pAD) versus who do not (sMCI). We validated the performance of five different prediction models included in MAD for monitoring the AD progression. We have also assessed if the prospective changes in MAD scores are correlated with the changes in cognitive deteriorations in the MCI stage of AD progression.
MATERIALS AND METHODS
Machine learning-based Alzheimer’s disease Designation (MAD)
The details about the development of MAD have been described elsewhere [13]. Briefly, to train the MAD classifiers, we used 111 cognitively healthy (CH) individuals (mean age±sd: 75.3±6.4, age range: 63–94, 55 female, Mini-Mental State Examination (MMSE): 29.0±1.1) and 94 patients with AD (mean age±sd: 75.5±8.3, age range: 56–90, 35 female, MMSE: 24.2±1.8) from the ADNI dataset. All 18F-FDG-PET image pre-processing was performed using Statistical Parametric Mapping (SPM) toolbox version 12 (https://www.fil.ion.ucl.ac.uk/spm/software/spm12/). As described in [13], we used the “old spatial normalization” routine with the PET template available in SPM12. Next, the 18F-FDG-PET images were smoothed using an 8-mm full width at half maximum Gaussian kernel. Finally, intensity normalization was conducted by dividing the PET values by the mean of whole-brain activity. The performance of the MAD framework was assessed based on the GLM, SSM, and SVM classification methods. Two different approaches were used in the SSM, where a principal component analysis (PCA) is used to derive the dominant brain metabolic patterns that explain the majority of the metabolic covariance [14]. SSM/PCA1 uses the single principal component (PC) that provides maximum separation between two groups. SSM/PCA2 uses a stepwise regression to combine relevant PCs to produce the optimal spatial metabolic pattern that separates the two groups. For the optimization routine in SVM (i.e., the most widely used machine learning technique for neuroimaging-based biomarker development [12]), we employed the iterative single data algorithm (ISDA) and sequential minimal optimization (SMO). All five prediction models exhibited a desirable classification accuracy for distinguishing AD patients and CHs through 10-fold cross-validation (i.e., sensitivity >0.75, specificity >0.75), while the best performance was achieved by SVM-ISDA model (sensitivity = 0.84, specificity = 0.95). Further details related to the MAD framework can be found in [13], and the MAD software is available at: https://www.kolabneuro.com/software1.
Subject selection
The data used in this study was obtained from the ADNI. The ADNI was launched in 2003 as a public-private partnership, led by Principal Investigator Michael W. Weiner, MD. The primary goal of ADNI has been to test whether serial magnetic resonance imaging (MRI), PET, other biological markers, and clinical and neuropsychological assessment can be combined to measure the progression of MCI and early AD. The ADNI database comprised over 2600 subjects. For up-to-date information, see https://www.adni-info.org.
We queried the ADNI database for CH and MCI with 18F-FDG-PET availability resulting in 261 CH and 461 MCI. Quality assurance of the images was performed (e.g., inclusion of the entire cerebellum). Patients who were diagnosed with AD at baseline were not considered for the purpose of this study. Participants who were consecutively scanned (2 times for CH and 3 times for MCI) and were not included in the original MAD development [13] were included. MCI patients were divided into prodromal AD (pAD) versus stable MCI (sMCI), depending on the AD diagnosis during the follow-up period. pAD without at least two years of scans prior to the AD diagnosis were excluded. As a result, we included 54 CH, 51 sMCI, and 39 pAD in this study (Supplementary Figure 1). For pAD, Year 0 was defined as the year of AD diagnosis, and thus the prior scans were defined as Year –1 and Year –2. To use the consistent nomenclature and to simplify the result presentation, the first scan was defined as Year –2 for CH and sMCI as well. The details have been described elsewhere [15].
Demographic information of all participants is presented in Table 1, which include five neuropsychiatric exam scores: MMSE (a short screening tool for assessing overall cognitive impairment, score ranges from 0 (worst) to 30 (best)) [16], Clinical Dementia Rating Scale (CDR; a screening tool for dementia, score ranges from 0 (best) to 3 (worst)) [17], Geriatric Depression Scale (GDS; a self-report scale for symptoms of depression, score ranges from 0 (best) to 15 (worse)) [18], Functional Activities Questionnaire (FAQ; measuring the complex activities of daily living, score ranges from 0 (best) to 20 (worse)) [19], and Neuropsychiatric Inventory Questionnaire (NPI-Q; psychopathology assessment including delusions, anxiety, hallucinations, dysphoria, lability, euphoria, disinhibition irritability, apathy, agitation/aggression, and aberrant motor behavior factors, score ranges from 0 (best) to 36 (worse)) [20].
Table 1
Demographic information and clinical follow-up data
| CH (N = 54) | sMCI (N = 51) | pAD (N = 39) | p* | p** | ||
| Year 0$ | Males/females | 30/24 | 25/26 | 26/13 | 0.24 | 0.09 |
| Age mean (SD) | 75.81 (5.87) | 74.97 (5.68) | 73.84 (7.46) | 0.33 | 0.41 | |
| MMSE mean (SD) | 28.80 (2.10) | 28.12 (2.57) | 24.74 (2.89) | <0.001 | <0.001 | |
| CDR (SD) | 0.03 (0.11) | 0.35 (0.37) | 0.57 (0.18) | <0.001 | <0.001 | |
| GDS (SD) | 0.63 (1.33) | 1.43 (1.23) | 2.33 (1.84) | <0.001 | 0.01 | |
| FAQ (SD) | 0.15 (0.56) | 3.69 (5.76) | 10.03 (5.45) | <0.001 | <0.001 | |
| NPI-Q (SD) | 0.23 (0.33) | 2.22 (2.92) | 3.56 (3.26) | <0.001 | 0.03 | |
| Year –1 | MMSE mean (SD) | n/a | 28.29 (2.10) | 26.13 (2.56) | <0.001 | <0.001 |
| CDR (SD) | n/a | 0.32 (0.28) | 0.55 (0.15) | <0.001 | <0.001 | |
| GDS (SD) | n/a | 1.43 (1.50) | 2.03 (1.75) | 0.09 | 0.09 | |
| FAQ (SD) | n/a | 2.61 (4.32) | 6.18 (5.32) | <0.001 | <0.001 | |
| NPI-Q (SD) | n/a | 2.16 (2.91) | 2.54 (2.93) | 0.54 | 0.54 | |
| Year –2 | MMSE mean (SD) | 28.91 (1.37) | 28.29 (1.57) | 26.87 (1.54) | <0.001 | <0.001 |
| CDR (SD) | 0.02 (0.09) | 0.30 (0.25) | 0.50 (0.00) | <0.001 | <0.001 | |
| GDS (SD) | 0.50 (1.12) | 1.18 (1.22) | 1.67 (1.36) | <0.001 | 0.07 | |
| FAQ (SD) | 0.07 (0.33) | 2.10 (3.24) | 5.32 (4.22) | <0.001 | <0.001 | |
| NPI-Q (SD) | 0.30 (0.94) | 1.29 (2.34) | 2.49 (2.60) | <0.001 | 0.03 |
CH, cognitively healthy; sMCI, stable mild cognitive impairment; pAD, prodromal Alzheimer’s disease; MMSE, Mini-Mental State Examination; N, number of subjects; CDR, Clinical Dementia Ratio; FAQ, Functional Assessment Questionnaire; GDS, Geriatric Depression Scale; NPI-Q, Neuropsychiatric Inventory Questionnaire; n/a, not available, SD, standard deviation. *statistical test among three groups. **statistical test between MCI and pAD. The sex ratio is compared by the chi-square test. $For AD, this is the time that the subjects were clinically diagnosed with AD.
Statistical analysis
MAD scores using five different approaches were estimated for all participants as described above. MAD scores represents z-scores relative to the mean and standard deviation of 111 control subjects that were used in MAD classifier training [13]. The area under curve (AUC) of receiver-operating characteristic (ROC) curve analysis was used to compute the performance of MAD and other clinical variables in discriminating pAD versus sMCI subjects at baseline. Differences in MAD scores between groups (i.e., MCI versus AD) over time were assessed with general linear model with repeated measures (GLM-RM) with sex and age at baseline as covariates followed by post-hoc Bonferroni test. As a reference, the longitudinal changes of MAD scores in CH was separately analyzed with paired t-test. The associations between longitudinal changes in MAD scores and changes in clinical measurements (MMSE, GDS, NPI, and FAQ) were assessed by a multiple linear regression analysis with dummy variables for subjects. Secondarily, to examine whether the association between other clinical variables (GDS, NPI, and FAQ) were mainly driven by cognitive impairment, the multiple linear regression analysis was repeated with including MMSE as a covariate. The p-values were corrected for multiple comparisons using a false discovery rate method, which is denoted by q-values. For all statistical tests, p (or q) <0.05 was considered as significant. All statistical analyses were conducted with the Statistical Package for the Social Sciences (IBM-SPSS Statistics, version 27) and Matlab 2017b (Mathworks, Inc., Natick, MA).
RESULTS
Discrimination of sMCI from pAD patients at MCI stage (baseline)
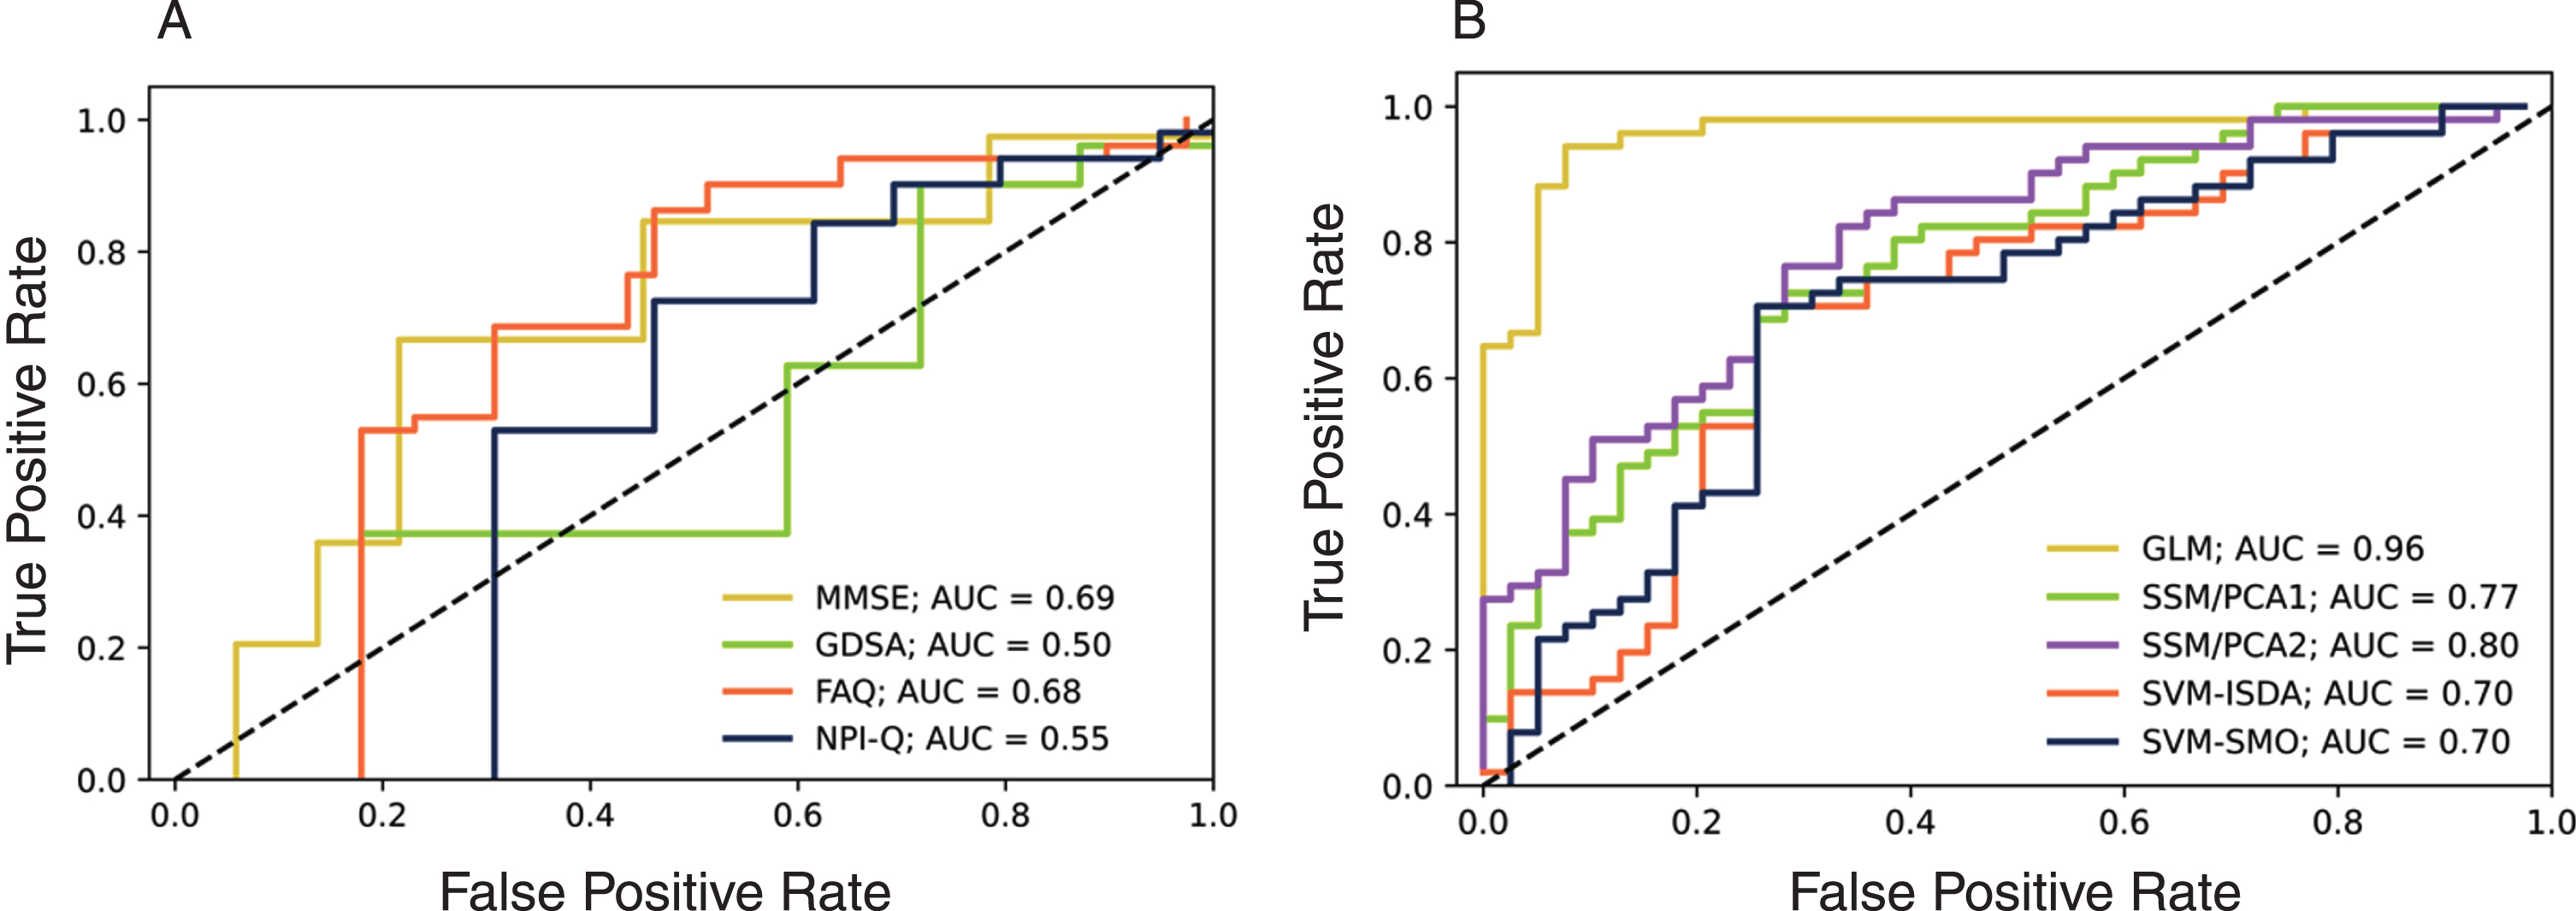
Although the means were statistically different between the sMCI versus pAD (Table 1), the ROC curve analysis of clinical variables showed relatively low AUC for separating the two groups at Year –2, ranging from 0.50 to 0.69 (Fig. 1A). The imaging-based discriminations (i.e., MAD) generally produced higher AUC (>0.7) while the GLM showed the best performance of AUC = 0.96. The other methods showed moderate performance (AUC: 0.7–0.8) (Fig. 1B).
Fig. 1
The ROC curves for discrimination of sMCI subjects from those that progress to AD subjects at Year –2. A) clinical variables, B) MAD scores.
Longitudinal changes in MAD scores
To examine whether all five MAD scores were affected by the longitudinal changes in brain metabolic activity occurring in pAD prior to the AD diagnosis, we conducted a 2×3 GLM-RM analysis (Group: sMCI versus pAD×Time: Year –2, –1, and 0). Significant interaction effects were observed in all five MAD scores (GLM: F (1, 89) = 41.31, p < 0.001; SSM/PC1: F (1, 89) = 16.26, p < 0.001; SSM/PC2: F (1, 89) = 30.85, p < 0.001; SVM/ISDA: F (1, 89) = 46.35, p < 0.001; SVM/SMO: F (1, 89) = 42.82, p < 0.001), while the SVM/ISDA showed the most significant effects. This result is in line with our previous study reporting that SVM/ISDA showed the best performance in predicting the future development of AD from MCI state [13].
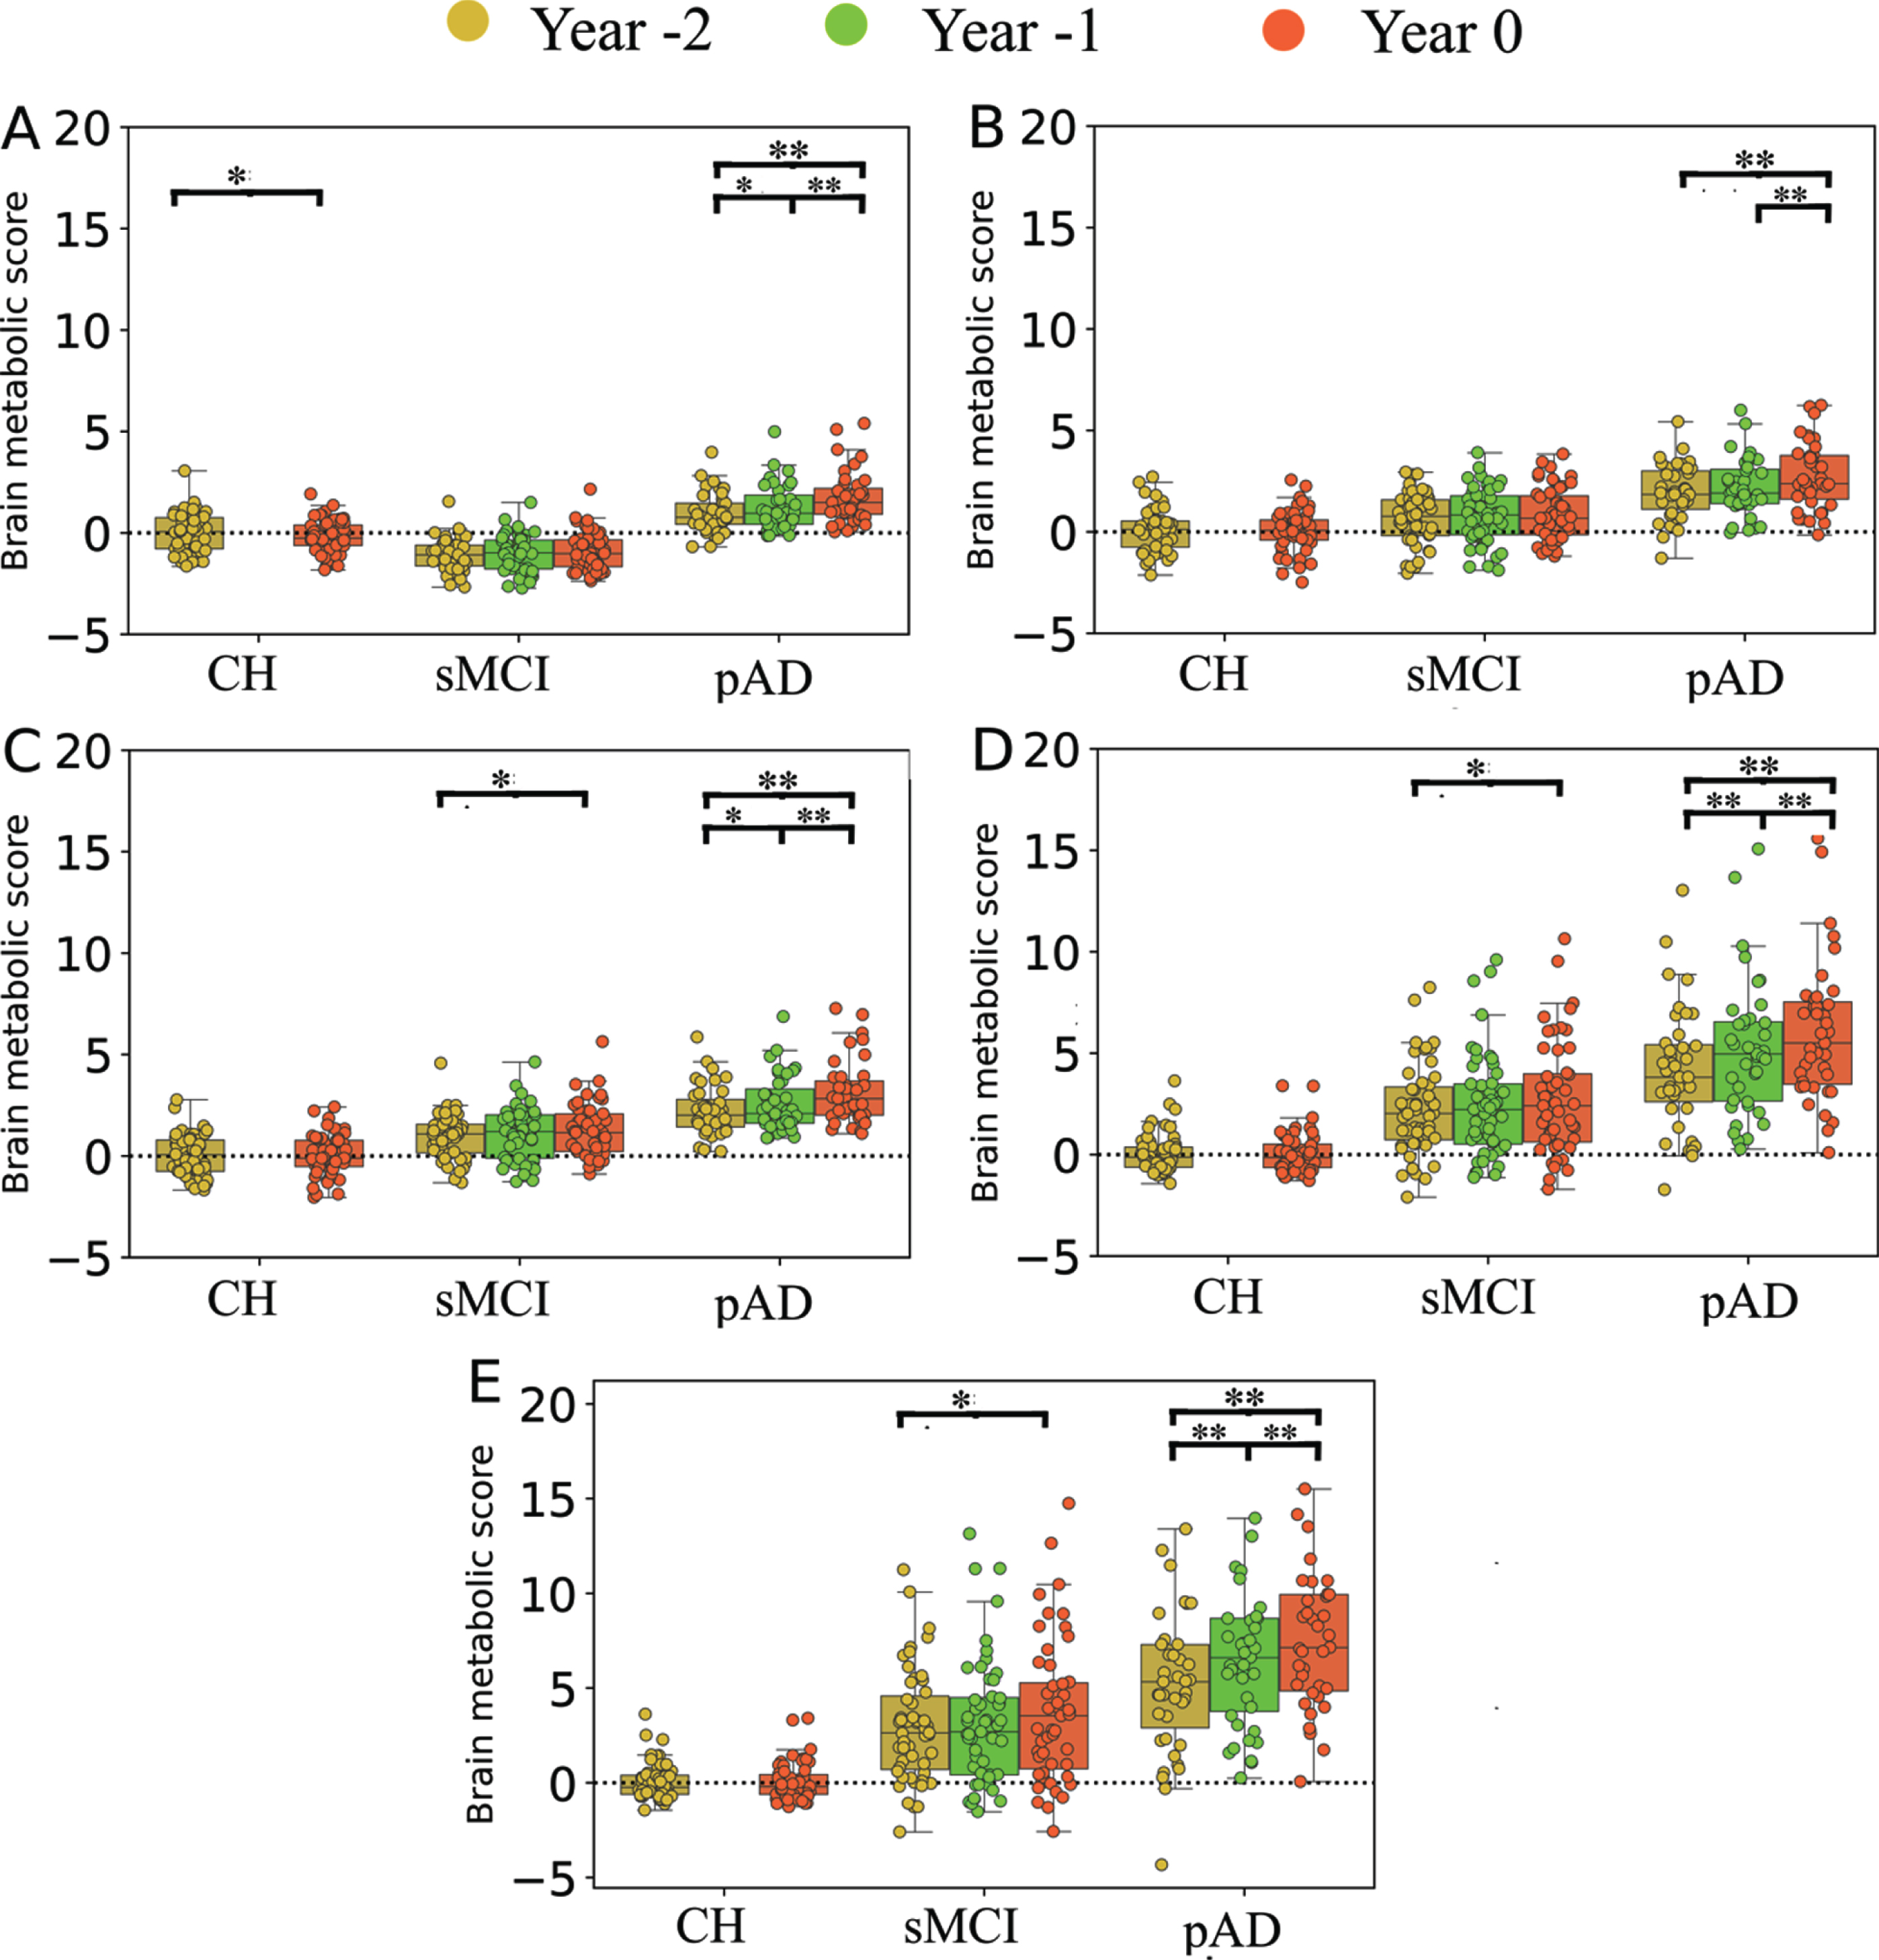
Post-hoc analyses confirmed significant increase of MAD scores over time within pAD contrasting the year of AD diagnosis versus 1 or 2 years prior, in all five different approaches (p < 0.001). In the earlier stage (contrasting Year –2 versus –1), four different MAD approaches showed significant increase over time (p < 0.01) but not for SSM/PCA1 (p = 0.18). On the contrary, sMCI patients showed relatively stationary MAD scores over time when compared for 1 year apart (p > 0.08). When compared for 2 years apart in sMCI cohort (Year 0 versus Year –2), a small but significant increment was observed in MAD scores when assessed with SSM/PCA2 (p = 0.02), SVM/ISDA (p = 0.04), and SVM/SMO (p = 0.04), but not with GLM (p = 0.14) or SSM/PCA1 (p = 0.17). For details of post-hoc analysis results, see Fig. 2 and the Supplementary Material. As expected, CH group also showed relatively stationary MAD scores over 2 years (p > 0.85) except for the GLM-based scores (t(53) = 2.92, p = 0.02, paired-sample t-test) (Fig. 2).
Fig. 2
Box plots representing the results of MAD scores on CH, sMCI, and pAD groups at different time points (i.e., Year –2, Year –1, and Year 0) calculated using different MAD approaches. A) GLM, B) SSM/PCA1, C) SSM/PCA2, D) SVM-ISDA, and E) SVM-SMO. Group (sMCI versus pAD)×time (Year –2, –1, and 0) comparison was analyzed with GLM-RM with age and sex as covariates, followed by post hoc Bonferroni test. The effect of time in CH was evaluated using paired t-test. These results show a significant annual increment of MAD scores prior to dementia diagnosis in pAD by all five prediction models. *p < 0.05, **p < 0.01, ***p < 0.001.
Clinical relevance of longitudinal changes in MAD scores
We utilized a multiple linear regression analysis to determine whether the changes in MAD scores over time correlated changes in clinical scores in sMCI and pAD groups, respectively. The summary of results is displayed in Fig. 3.
Fig. 3
Longitudinal association across neuropsychological measures and MAD scores within each group, determined by multiple regression analysis. A) sMCI group, B) pAD group. MMSE: Mini-mental state examination; GDS: Geriatric Depression Scale; FAQ: Functional Assessment Questionnaire; NPI-Q: Neuropsychiatric Inventory Questionnaire. *q < 0.05, **q < 0.01, ***q < 0.001 corrected for multiple comparisons using false discovery rate. The color bar stands for t-test values, whereas the numbers inside the cells are beta values obtained from a multiple linear regression analysis. These results show strong correlations between changes in MAD scores and cognitive performance in pAD.
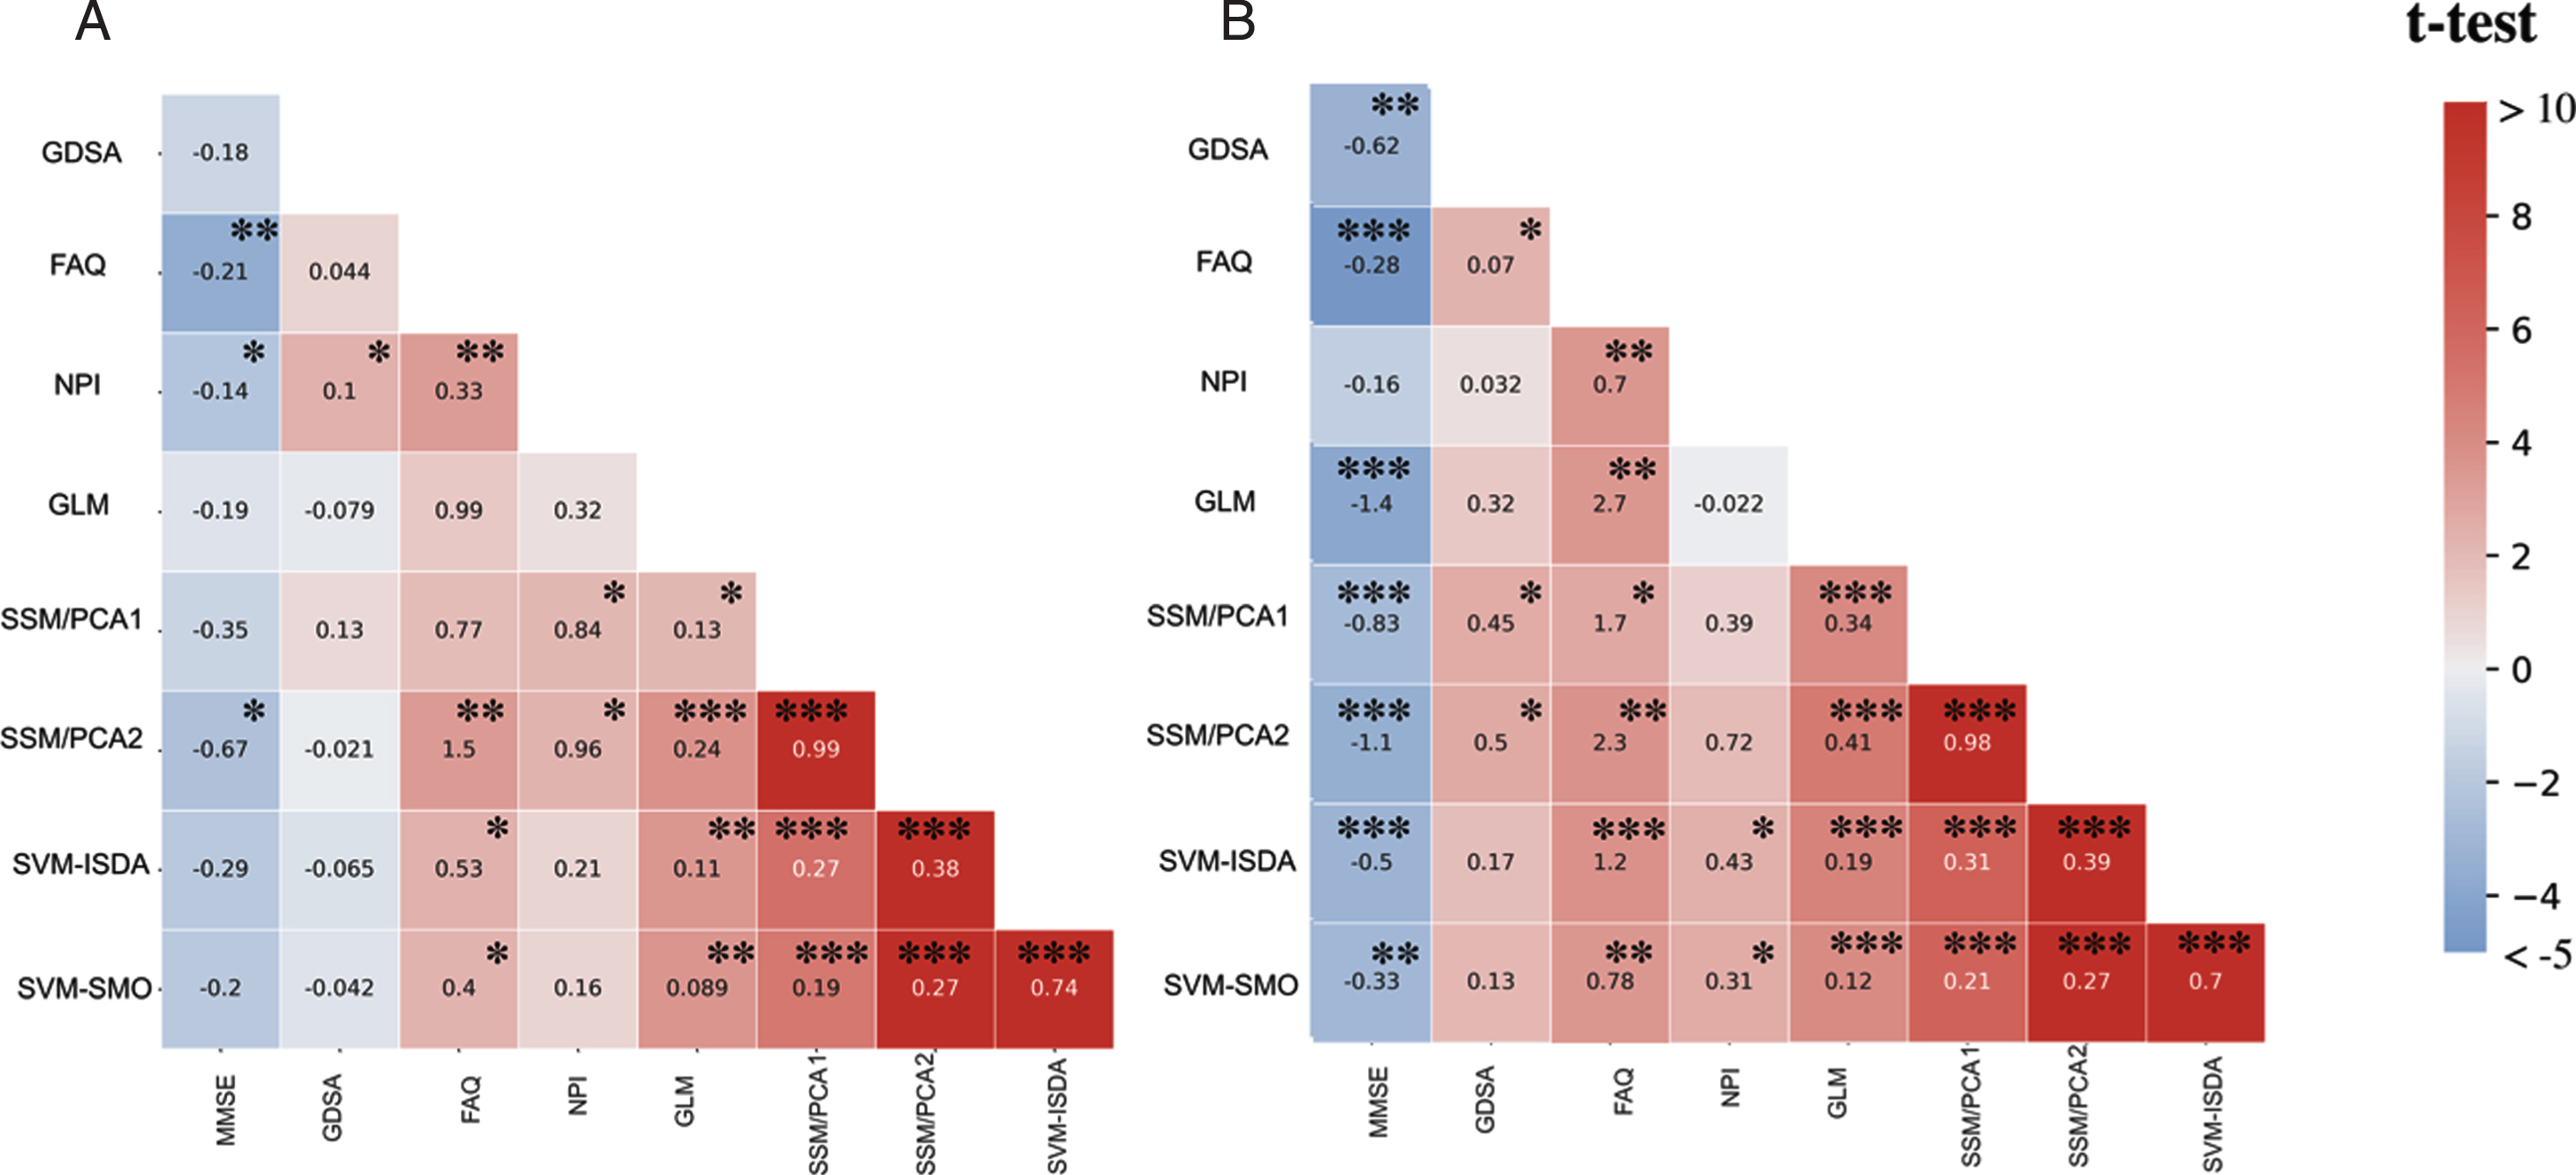
In the pAD group, changes in the overall cognitive performance measured by MMSE were significantly correlated with longitudinal changes in MAD scores in all five algorithms (q < 0.01), i.e., GLM (t(77) = –3.91, q < 0.001), SSM/PCA1 (t(77) = –2.73, q < 0.001), SSM/PCA2 (t(77) = –3.44, q < 0.001), SVM-ISDA (t(77) = –3.17, q < 0.001), and SVM-SMO (t(77) = –2.93, q = 0.009). In the sMCI group, we observed a weaker but significant correlation between changes in MMSE and with changes in SSM/PCA2 scores (t(101) = –2.43, q = 0.029), while other prediction algorithms (i.e., GLM, SSM/PCA1, SVM-ISDA, and SVM-SMO) did not show any significant correlation (q > 0.10).
Weaker, yet significant associations were observed between changes in depressive symptoms measured by GDS and MAD scores estimated by the SSM/PCA1 (t(77) = 2.56, q = 0.023) and SSM/PCA2 (t(77) = 2.72, q = 0.015) in the pAD group. No significant association was observed in sMCI (q > 0.5). Similarly, changes in neuropsychiatric symptoms measured by NPI were also significantly correlated with changes in MAD scores estimated by SVM-ISDA (t(77) = 2.47, q = 0.028), and SVM-SMO (t(77) = 2.57, q = 0.023), but not by other algorithms (q > 0.05). In the sMCI group, we observed a similar correlation with NPI scores over time with MAD scores estimated by SSM/PCA1 (t(101) = 2.18, q = 0.047) and SSM/PCA2 (t(101) = 2.28, q = 0.040), but not by other prediction algorithms (q > 0.05). Of note, these correlations were abolished when corrected for MMSE in both pAD and sMCI (q > 0.18).
In pAD, changes in the overall daily activities measured by FAQ were associated with changes in MAD scores estimated by all five different algorithms (GLM, t(77) = 3.52, q = 0.001; SSM/PCA1, t(77) = 2.77, q = 0.014; SSM/PCA2, t(77) = 3.69, q = 0.001; SVM-ISDA, t(77) = 3.83, q < 0.001; and SVM-SMO, t(77) = 3.53, q = 0.001). In the sMCI group, a correlation was observed between changes in FAQ and MAD scores estimated by SSM/PCA2 (t(101) = 3.38, q = 0.002), SVM-ISDA (t(101) = 2.32, q = 0.003) and SVM-SMO (t(101) = 2.32, q = 0.003), but not by GLM or SSM/PCA1 (q > 0.08). These correlations were abolished, however when corrected for MMSE in both pAD and sMCI (q > 0.18).
DISCUSSION
As expected, we found that MAD in general shows superior AUC than other clinical variables (Fig. 1). Most notably, GLM method showed AUC of 0.96. However, this result should be interpreted with cautions because the sample size was further reduced from our previous study [13], i.e., we previously included all MCI patients with baseline FDG PET scans, then stratified them according to their clinical follow-up diagnosis, which resulted in higher number of subjects (pAD: n = 55; sMCI: n = 186). This resulted in moderate sensitivity (0.655) and specificity (0.720) [13]. In the present study, however, we applied different inclusion criteria for pAD (at least two FDG PET scans prior to AD diagnosis) and sMCI (at least three consecutive FDG PET scans), resulting in much lesser sample size (pAD: n = 39, sMCI: n = 51), which may have introduced an unspecific bias, e.g., most sMCI patients showed negative MAD-GLM scores (Fig. 2A). Further work using GLM and 18F-FDG-PET is required to confirm this finding.
We have confirmed that the MAD scores increased annually prior to dementia diagnosis in pAD by all five prediction models (Fig. 2). Greater increment was observed when it was closer to the time of diagnosis (Year –1 versus Year 0), then the prior years (Year –2 versus Year –1). The effect size was the greatest when SVM-ISDA was used, which also showed the greatest group differentiation (AD versus CH) in cross-sectional analysis [13]. In sMCI and CH, no significant increase was observed when assessed annually. When compared for two years apart, there was a significant increase of MAD scores in sMCI with SSM/PCA1, SVM-ISDA, or SVM-SMO, and in CH with GLM. This was in line with our previous study where we showed that age, one of the most significant risk factors for AD development, was correlated with MAD scores in CH and sMCI [13]. Older age has also been associated with other neuroimaging-based markers for AD such as hippocampal volume [21], white matter hyperintensities [22], whole-brain structural MRI patterns [23], and cortical atrophy patterns [24].
It is yet unclear whether the abnormal glucose metabolic pattern that we see in FDG-PET is specific to AD or it merely reflects accelerated aging process in AD. Unlike other tracers that bind to specific proteins that characterizes AD such as florobetapir [25], florbetaben [26], flutemetamol [27], and flortaucipir [28], the FDG uptake level represents overall “health” of the brain regions, the decline of which is potentially associated with neuronal loss, mitochondrial dysfunction, loss of synaptic activities, or a combination of these [29]. In fact, we have recently demonstrated that MAD scores were also elevated in some patients with other types of dementia such as dementia with Lewy bodies, frontotemporal dementia, and primary progressive aphasia, suggesting the non-specificity of FDG-PET-based markers for AD in non-AD dementia [30]. And, it has been previously demonstrated that AD patients also show an accelerated pattern of morphological [31] and metabolic [32] changes associated with healthy aging itself. In addition, cognitive decline due to normal aging has been linked to the presence of some pathological features (such as lipofuscin, argyrophilic grains, neuromelanin, tau pathology, and corpora amylacea) that are related to AD [33].
Of note for the current study, the yearly increments of MAD scores were significantly correlated with worsening of cognitive symptoms in pAD that was confirmed in all five prediction models (Fig. 3). Other clinical variables (depression, psychiatric symptoms, and daily activities) were also correlated with MAD scores, although it may have been primarily driven by cognitive decline, i.e., inclusion of MMSE as a covariate abolished the statistical significance. Interestingly, changes in MAD score determined by SSM/PCA2 was correlated with changes in MMSE in sMCI, albeit there was only 0.17 points decrease in MMSE over 2 years (compared to 2.13 points decrease in pAD).
GLM showed the best association with clinical symptom progression (i.e., MMSE) in pAD (Fig. 3). This is not surprising because GLM finds a beta-map (a “reference” vector) that maximizes the group differences of its dot-products with each subjects’ vectorized FDG-PET scans. And thus, the most “progressed” patients may have greater impact on beta-value definition. This is similar in SSM methods, except that the patterns are defined to maximize the variance-accounted-for in the spatial covariance across the whole-brain. On the other hand, SVM-based scores are estimated by the dot-product of residual images of each subject and the orthonormal vector to the hyperplane. And SVM’s hyperplane (i.e., the optimal line or decision boundary in the SVM algorithm that separates groups) was trained to maximize the margins between support vectors (i.e., the vectorized FDG-PET scans of subjects whose distance was the closest to the hyperplane). Therefore, the scale of dot-product is not meant to be relevant while the sign of it determines the label of the classifier (AD versus NL). Consequently, it is not surprising that the z-scores of SVM-based scores are much more variable than GLM- and SSM-based scores (Fig. 2).
It should be noted that MAD topology is not exclusively characterized by hypometabolism, but a large hypermetabolic area including the cerebellum, thalamus, and paracentral lobule, also consist of its topology [13]. Using graph theory, we have previously demonstrated that these hypermetabolic regions are the key brain regions with higher betweenness centrality (or hub of information flow) in the GLM-based AD-related brain metabolic network [15]. In pAD, these “hub” regions showed annually increasing FDG uptake prior to the diagnosis of AD while no further decrease of hypometabolism was observed [15]. In the current study, we demonstrated that increasing MAD scores were associated with cognitive decline prior to dementia diagnosis, potentially suggesting that the hypermetabolism identified in pAD and AD may also be detrimental (albeit its potential role as a compensatory mechanism cannot be ruled out).
Conclusion
This study was conducted to validate our MAD framework for longitudinal studies in the prodromal stage of AD. To this end, we applied a MAD framework on a set of longitudinal 18F-FDG-PET scans acquired from 54 CHs, 51 sMCI, and 39 pAD subjects at the time of the clinical diagnosis of AD, and two years prior. All five MAD scores successfully differentiated pAD versus sMCI. An annual increment of MAD scores were confirmed through five different machine-learning algorithms. Changes in MAD scores were also significantly correlated with worsening clinical symptom severity in pAD. These results suggest that MAD may be a relevant tool for monitoring disease progression in the prodromal stage of AD.
ACKNOWLEDGMENTS
This study is supported by grant number RGPIN-2016-05964 from Natural Science and Engineering Research Council of Canada (NSERC). Student stipends and postdoctoral salary support was provided by MITACS and Parkinson Canada.
For MAD algorithm development, data collection and sharing were funded by the Alzheimer’s Disease Neuroimaging Initiative (ADNI) (National Institutes of Health Grant U01 AG024904) and DOD ADNI (Department of Defense award number W81XWH-12-2-0012). ADNI is funded by the National Institute on Aging, the National Institute of Biomedical Imaging and Bioengineering, and through generous contributions from the following: AbbVie, Alzheimer’s Association; Alzheimer’s Drug Discovery Foundation; Araclon Biotech; BioClinica, Inc.; Biogen; Bristol-Myers Squibb Company; CereSpir, Inc.; Cogstate; Eisai Inc.; Elan Pharmaceuticals, Inc.; Eli Lilly and Company; EuroImmun; F. Hoffmann-La Roche Ltd and its affiliated company Genentech, Inc.; Fujirebio; GE Healthcare; IXICO Ltd.;Janssen Alzheimer Immunotherapy Research & Development, LLC.; Johnson & Johnson Pharmaceutical Research & Development LLC.; Lumosity; Lundbeck; Merck & Co., Inc.;Meso Scale Diagnostics, LLC.; NeuroRx Research; Neurotrack Technologies; Novartis Pharmaceuticals Corporation; Pfizer Inc.; Piramal Imaging; Servier; Takeda Pharmaceutical Company; and Transition Therapeutics. The Canadian Institutes of Health Research is providing funds to support ADNI clinical sites in Canada. Private sector contributions are facilitated by the Foundation for the National Institutes of Health (https://www.fnih.org). The grantee organization is the Northern California Institute for Research and Education, and the study is coordinated by the Alzheimer’s Therapeutic Research Institute at the University of Southern California. ADNI data are disseminated by the Laboratory for Neuro Imaging at the University of Southern California. We also acknowledge support from the St. Boniface Hospital Research Foundation (Grant Nos. 1406–3216 and 1410–3216), the Canadian Institute of Health Research (CIHR; Grant No. PJT-162144) to B.C.A., the Honourable Douglas and Patricia Everett, Royal Canadian Properties Limited Endowment Fund (Grant No. 1403–3131) to B.C.A. B.C.A. also previously held the Manitoba Dementia Research Chair (funded by the Alzheimer’s Society of Manitoba and Research Manitoba).
Authors’ disclosures available online (https://www.j-alz.com/manuscript-disclosures/22-0585r1).
DATA AVAILABILITY STATEMENT
The MAD algorithm is available via the corresponding author’s lab website (https://www.kolabneuro.com/).
SUPPLEMENTARY MATERIAL
[1] The supplementary material is available in the electronic version of this article: https://dx.doi.org/10.3233/JAD-220585.
REFERENCES
[1] | Guerchet M , Prince M , Prina M (2020) Numbers of people with dementia worldwide: An update to the estimates in the World Alzheimer Report 2015. |
[2] | Selkoe DJ , Hardy J ((2016) ) The amyloid hypothesis of Alzheimer’s disease at 25 years. EMBO Mol Med 8: , 595–608. |
[3] | Perrin RJ , Fagan AM , Holtzman DM ((2009) ) Multimodal techniques for diagnosis and prognosis of Alzheimer’s disease. Nature 461: , 916–922. |
[4] | Beach TG , Monsell SE , Phillips LE , Kukull W ((2012) ) Accuracy of the clinical diagnosis of Alzheimer disease at National Institute on Aging Alzheimer Disease Centers, 2005-2010. J Neuropathol Exp Neurol 71: , 266–273. |
[5] | Dhillon S ((2021) ) Aducanumab: First approval. Drugs 81: , 1437–1443. |
[6] | Livingston G , Sommerlad A , Orgeta V , Costafreda SG , Huntley J , Ames D , Ballard C , Banerjee S , Burns A , Cohen-Mansfield J , Cooper C , Fox N , Gitlin LN , Howard R , Kales HC , Larson EB , Ritchie K , Rockwood K , Sampson EL , Samus Q , Schneider LS , Selbæk G , Teri L , Mukadam N ((2017) ) Dementia prevention, intervention, and care. Lancet 390: , 2673–2734. |
[7] | Sachdev PS , Blacker D , Blazer DG , Ganguli M , Jeste DV , Paulsen JS , Petersen RC ((2014) ) Classifying neurocognitive disorders: The DSM-5 approach. Nat Rev Neurol 10: , 634–642. |
[8] | Chételat G , Arbizu J , Barthel H , Garibotto V , Law I , Morbelli S , van de Giessen E , Agosta F , Barkhof F , Brooks DJ , Carrillo MC , Dubois B , Fjell AM , Frisoni GB , Hansson O , Herholz K , Hutton BF , Jack CR , Lammertsma AA , Landau SM , Minoshima S , Nobili F , Nordberg A , Ossenkoppele R , Oyen WJG , Perani D , Rabinovici GD , Scheltens P , Villemagne VL , Zetterberg H , Drzezga A ((2020) ) Amyloid-PET and 18 F-FDG-PET in the diagnostic investigation of Alzheimer’s disease and other dementias. Lancet Neurol 19: , 951–962. |
[9] | Del Sole A , Clerici F , Chiti A , Lecchi M , Mariani C , Maggiore L , Mosconi L , Lucignani G ((2008) ) Individual cerebral metabolic deficits in Alzheimer’s disease and amnestic mild cognitive impairment: An FDG PET study. Eur J Nucl Med Mol Imaging 35: , 1357–1366. |
[10] | Mosconi L ((2005) ) Brain glucose metabolism in the early and specific diagnosis of Alzheimer’s disease. FDG-PET studies in MCI and AD. Eur J Nucl Med Mol Imaging 32: , 486–510. |
[11] | Rice L , Bisdas S ((2017) ) The diagnostic value of FDG and amyloid PET in Alzheimer’s disease—A systematic review. Eur J Radiol 94: , 16–24. |
[12] | Rathore S , Habes M , Iftikhar MA , Shacklett A , Davatzikos C ((2017) ) A review on neuroimaging-based classification studies and associated feature extraction methods for Alzheimer’s disease and its prodromal stages. Neuroimage 155: , 530–548. |
[13] | Katako A , Shelton P , Goertzen AL , Levin D , Bybel B , Aljuaid M , Yoon HJ , Kang DY , Kim SM , Lee CS , Ko JH ((2018) ) Machine learning identified an Alzheimer’s disease-related FDG-PET pattern which is also expressed in Lewy body dementia and Parkinson’s disease dementia. Sci Rep 8: , 13236. |
[14] | Moeller J , Strother S , Sidtis J , Rottenberg D ((1987) ) Scaled subprofile model: A statistical approach to the analysis of functional patterns in positron emission tomographic data. J Cereb Blood Flow Metab 7: , 649–658. |
[15] | Gupta V , Booth S , Ko JH , Alzheimer’s Disease Neuroimaging Initiative (2021) Hypermetabolic cerebellar connectome in Alzheimer’s disease. Brain Connect. 10.1089/brain.2020.0937. |
[16] | Folstein MF , Folstein SE , McHugh PR ((1975) ) “Mini-mental state". A practical method for grading the cognitive state of patients for the clinician. J Psychiatr Res 12: , 189–198. |
[17] | Berg L ((1988) ) Clinical Dementia Rating (CDR). Psychopharmacol Bull 24: , 637–639. |
[18] | Yesavage JA ((1988) ) Geriatric depression scale. Psychopharmacol Bull 24: , 709–711. |
[19] | Pfeffer RI , Kurosaki TT , Harrah CH , Chance JM , Filos S ((1982) ) Measurement of functional activities in older adults in the community. J Gerontol 37: , 323–329. |
[20] | Kaufer DI , Cummings JL , Ketchel P , Smith V , MacMillan A , Shelley T , Lopez OL , DeKosky ST ((2000) ) Validation of the NPI-Q, a brief clinical form of the Neuropsychiatric Inventory. J Neuropsychiatry Clin Neurosci 12: , 233–239. |
[21] | Fraser MA , Shaw ME , Cherbuin N ((2015) ) A systematic review and meta-analysis of longitudinal hippocampal atrophy in healthy human ageing. Neuroimage 112: , 364–374. |
[22] | Carmichael O , Schwarz C , Drucker D , Fletcher E , Harvey D , Beckett L , Jack CR , Weiner M , DeCarli C , Alzheimer’s Disease Neuroimaging Initiative ((2010) ) Longitudinal changes in white matter disease and cognition in the first year of the Alzheimer disease neuroimaging initiative. Arch Neurol 67: , 1370–1378. |
[23] | Casanova R , Barnard RT , Gaussoin SA , Saldana S , Hayden KM , Manson JE , Wallace RB , Rapp SR , Resnick SM , Espeland MA , Chen JC , WHIMS-MRI Study Group and the Alzheimer’s disease Neuroimaging Initiative ((2018) ) Using high-dimensional machine learning methods to estimate an anatomical risk factor for Alzheimer’s disease across imaging databases. Neuroimage 183: , 401–411. |
[24] | Lee JS , Kim C , Shin JH , Cho H , Shin DS , Kim N , Kim HJ , Kim Y , Lockhart SN , Na DL , Seo SW , Seong JK ((2018) ) Machine learning-based individual assessment of cortical atrophy pattern in Alzheimer’s disease spectrum: Development of the classifier and longitudinal evaluation. Sci Rep 8: , 4161. |
[25] | Okamura N , Yanai K ((2010) ) Florbetapir (18F), a PET imaging agent that binds to amyloid plaques for the potential detection of Alzheimer’s disease. IDrugs 13: , 890–899. |
[26] | Alongi P , Sardina DS , Coppola R , Scalisi S , Puglisi V , Arnone A , Raimondo GD , Munerati E , Alaimo V , Midiri F , Russo G , Stefano A , Giugno R , Piccoli T , Midiri M , Grimaldi LME ((2019) ) 18F-Florbetaben PET/CT to assess Alzheimer’s disease: A new analysis method for regional amyloid quantification. J Neuroimaging 29: , 383–393. |
[27] | Matsuda H , Ito K , Ishii K , Shimosegawa E , Okazawa H , Mishina M , Mizumura S , Ishii K , Okita K , Shigemoto Y , Kato T , Takenaka A , Kaida H , Hanaoka K , Matsunaga K , Hatazawa J , Ikawa M , Tsujikawa T , Morooka M , Ishibashi K , Kameyama M , Yamao T , Miwa K , Ogawa M , Sato N ((2021) ) Quantitative evaluation of 18F-flutemetamol PET in patients with cognitive impairment and suspected Alzheimer’s disease: A multicenter study. Front Neurol 11: , 578753. |
[28] | Fleisher AS , Pontecorvo MJ , Devous MD Sr , Lu M , Arora AK , Truocchio SP , Aldea P , Flitter M , Locascio T , Devine M , Siderowf A , Beach TG , Montine TJ , Serrano GE , Curtis C , Perrin A , Salloway S , Daniel M , Wellman C , Joshi AD , Irwin DJ , Lowe VJ , Seeley WW , Ikonomovic MD , Masdeu JC , Kennedy I , Harris T , Navitsky M , Southekal S , Mintun MA A16 Study Investigators((2020) ) Positron emission tomography imaging with [18F] flortaucipir and postmortem assessment of Alzheimer disease neuropathologic changes. JAMA Neurol 77: , 829–839. |
[29] | Ko JH , Strafella AP ((2022) ) Metabolic imaging and plasticity. Handb Clin Neurol 184: , 121–132. |
[30] | Lau A , Beheshti I , Modirrousta M , Kolesar TA , Goertzen AL , Ko JH ((2021) ) Alzheimer’s disease-related metabolic pattern in diverse forms of neurodegenerative diseases. Diagnostics (Basel) 11: , 2023. |
[31] | Beheshti I , Mishra S , Sone D , Khanna P , Matsuda H ((2020) ) T1-weighted MRI-driven brain age estimation in Alzheimer’s disease and Parkinson’s disease. Aging Dis 11: , 618. |
[32] | Beheshti I , Nugent S , Potvin O , Duchesne S ((2021) ) Disappearing metabolic youthfulness in the cognitively impaired female brain. Neurobiol Aging 101: , 224–229. |
[33] | Keller JN ((2006) ) Age-related neuropathology, cognitive decline, and Alzheimer’s disease. Ageing Res Rev 5: , 1–13. |


