
Estimating Likelihood of Dementia in the Absence of Diagnostic Data: A Latent Dementia Index in 10 Genetically Informed Studies
Abstract
Background:
Epidemiological research on dementia is hampered by differences across studies in how dementia is classified, especially where clinical diagnoses of dementia may not be available.
Objective:
We apply structural equation modeling to estimate dementia likelihood across heterogeneous samples within a multi-study consortium and use the twin design of the sample to validate the results.
Methods:
Using 10 twin studies, we implement a latent variable approach that aligns different tests available in each study to assess cognitive, memory, and functional ability. The model separates general cognitive ability from components indicative of dementia. We examine the validity of this continuous latent dementia index (LDI). We then identify cut-off points along the LDI distributions in each study and align them across studies to distinguish individuals with and without probable dementia. Finally, we validate the LDI by determining its heritability and estimating genetic and environmental correlations between the LDI and clinically diagnosed dementia where available.
Results:
Results indicate that coordinated estimation of LDI across 10 studies has validity against clinically diagnosed dementia. The LDI can be fit to heterogeneous sets of memory, other cognitive, and functional ability variables to extract a score reflective of likelihood of dementia that can be interpreted similarly across studies despite diverse study designs and sampling characteristics. Finally, the same genetic sources of variance strongly contribute to both the LDI and clinical diagnosis.
Conclusion:
This latent dementia indicator approach may serve as a model for other research consortia confronted with similar data integration challenges.
INTRODUCTION
Harmonized measures of cognitive functioning, cognitive impairment, and dementia are critical for consortium-based studies of aging that combine multiple cohorts. Large samples comprised of multiple studies are essential for testing genetic and environmental effects that require large numbers of participants to discover significant and meaningful associations and for incorporating diverse populations in dementia research. In practice, a dementia diagnosis requires progressive impairment in cognition sufficient to interfere with functioning in everyday life. The most frequent cause of dementia is Alzheimer’s disease in which memory impairment is the most common presentation [1]. In clinical settings, establishing dementia diagnoses typically entails teams of clinicians who integrate information from neurological examination, clinical neuropsychological testing, neuroimaging, and/or markers from cerebrospinal fluid [2–4]. These procedures align with current diagnostic criteria [5]. Large population-based studies of aging, however, cannot feasibly implement such clinical protocols, and instead must rely on a combination of mental status tests, various statistical algorithms applied to brief cognitive batteries, or, alternatively, linkage with administrative records such as Medicare (e.g., Health and Retirement Study (HRS) [6]; National Health and Aging Trends Study [7]) or national patient registries [8].
The purpose of this paper is to show that a latent approach to estimating likelihood of dementia can be coordinated across available data from studies in a multi-study consortium as well as for individual studies. Our intention is that this latent dementia indicator approach may serve as a model for other research consortia confronted with similar challenges. Latent variable approaches offer an intuitively appealing option. A latent variable is a statistically weighted combination of available measures which serve as indicators of a concept; in this case, the concept is dementia. Here the latent indicators of dementia incorporate functional ability in addition to cognitive performance [9]. Functional ability refers to the components of instrumental activities of daily living affected by cognitive functioning (e.g., shopping, handling routine household tasks, finding one’s way, balancing a checkbook) [10]. Recent applications of latent variable models have proven to be valid and reliable, as reported in numerous articles in this journal [11, 12] and elsewhere [13]. These latent dementia approaches partition variance attributed to general cognitive ability from variance attributed to functional ability, to remove premorbid cognitive ability from loss of function signaling dementia. The latent dementia factor characterized by the overlap of cognitive and functional ability indicators has been referred to as delta (δ) with the variance accounted for by “cognition alone” retained in a residual general cognitive ability g’ factor rather than being part of the δ factor [9, 13]. In prior studies, the correlation between δ and dementia diagnosis is stronger than the correlation between general cognitive ability and dementia diagnosis [9, 11, 13]. Latent variable approaches have been employed by others in a variety of different samples [13, 14], but has not yet extended to pooling across studies.
In this study, we create an indicator of likelihood of dementia using a latent conceptualization of dementia that we apply across studies to perform coordinated analyses. First, we describe the development of our latent dementia index (LDI), which reflects the likelihood that a person has dementia, and then apply it to 10 twin studies participating in the international consortium on the Interplay of Genes and Environments across Multiple Studies (IGEMS). Scores on cognitive tests and survey assessments of functional ability are used to create these LDI scores. Then, we evaluate sensitivity and specificity of the LDI using studies from the consortium where clinical diagnoses of dementia are available.
Because the consortium includes twins, we use classical twin models to validate the LDI by estimating the genetic overlap underlying the LDI and clinical diagnoses of dementia. Classical twin models compare similarity between members of monozygotic (MZ) twin pairs, who share 100% of their genes, to similarity between members of dizygotic (DZ) twin pairs, who on average share 50% of their genes. From the difference between MZ and DZ twin correlations, it is possible to estimate proportions of variance explained by genetic factors and by environmental factors. Heritability (or proportion of variance explained by genetic factors) of clinically diagnosed dementia is approximately 60% in prior twin studies [15, 16]. If heritability of LDI is of similar magnitude, the result supports the utility of the LDI. Strong genetic correlations between the LDI and clinically diagnosed dementia would offer evidence that the genetic effects underlying clinically diagnosed dementia are the same as those underlying the LDI. In addition, the non-shared environmental correlations can be used to infer whether—as would be expected—twins with poorer LDI scores are diagnosed more often with dementia than their co-twins [17, 18].
METHODS
Study samples
All samples used in the analyses are part of the IGEMS consortium [19, 20]. We included 10 studies from four countries (Sweden, Denmark, United States, and Australia), representing all IGEMS studies with both a functional ability measure and a cognitive assessment battery that includes memory. To the extent possible, we wished to know for each participant whether or not the person ever developed probable dementia. Therefore, we selected the most recent assessment wave for each participant with cognitive, memory, and/or functional ability data. No participant was included more than once. The individual studies are presented in Table 1 and described below. The combined sample size across all studies was 15,770. This study was approved by the University of Southern California Institutional Review Board.
Table 1
Analytic sample characteristics by study
| Sample | N | % Female | # of Twin Type | Mean Age at Testing (SD) | Years of Study | % Clinically Diagnosed Dementia | ||
| MZ | DZ-SS | DZ-OS | ||||||
| Sweden | ||||||||
| HARMONY | 1381 | 56% | 391 | 611 | 349 | 81.0 (7.41) | 1998–2004 | 41% |
| SATSA | 548 | 60% | 197 | 348 | 0 | 77.8 (8.92) | 1999–2012 | 12% |
| GENDER | 479 | 50% | 0 | 0 | 479 | 80.0 (3.96) | 1995–2005 | 17% |
| OCTO-Twin | 561 | 66% | 246 | 315 | 0 | 87.6 (3.91) | 1991–2002 | 26% |
| Australia | ||||||||
| OATS | 592 | 65% | 329 | 169 | 92 | 74.9 (5.71) | 2006–2018 | 4% |
| Denmark | ||||||||
| MADT | 4306 | 49% | 1470 | 1388 | 1448 | 56.4 (6.34) | 1998 | – |
| LSADT | 4626 | 59% | 1555 | 2820 | 220 | 80.1 (6.37) | 1995–2005 | – |
| US | ||||||||
| CAATSA | 675 | 59% | 241 | 261 | 166 | 49.2 (14.51) | 1999–2003 | – |
| MIDUS | 1341 | 56% | 517 | 459 | 341 | 60.4 (12.01) | 2004–2014 | – |
| VETSA | 1261 | – | 736 | 525 | 0 | 61.5 (2.64) | 2008–2013 | – |
HARMONY, Study of Dementia in Swedish Twins; SATSA, Swedish Adoption/Twin Study of Aging; GENDER, Ageing in Women and Men: A Longitudinal Study of Gender Differences in Health Behavior and Health among Elderly; OCTO-Twin, Origins of Variance in the Oldest-Old; OATS, Older Australian Twins Study; LSADT, Longitudinal Study of Aging Danish Twins; MADT, Middle-Aged Danish Twins Study; CAATSA, Carolina African-American Twin Study of Aging; MIDUS, Midlife Development in the United States; VETSA, Vietnam Era Twin Study of Aging; MZ, monozygotic; DZ-SS, dizygotic same sex; DZ-OS, dizygotic opposite sex.
Sweden
The four Swedish studies were drawn from the Swedish Twin Register, a population-based register of twins born in Sweden since 1886. Studies include the cross-sectional census: the Study of Dementia in Swedish Twins termed by the Swedish acronym HARMONY for Hälsa (health), ARv (genes), Miljö (environment), Och (and), NY (new) [21], and three longitudinal studies of specific subgroups: the Swedish Adoption/Twin Study of Aging (SATSA) [22], Ageing in Women and Men: A Longitudinal Study of Gender Differences in Health Behavior and Health among Elderly (GENDER) [23], and the Origins of Variance in the Oldest-Old (OCTO-Twin) [24]. Some individuals were part of both HARMONY and one of the three longitudinal studies. Those individuals were placed in the analytic sample that contained their most recent cognitive, memory, and/or functional ability data.
HARMONY entailed screening all living twins in the Swedish Twin Register aged 65+ years [25], then referring for clinical workup all twins who screened positive for cognitive impairment along with their co-twin and a control sample of healthy twin pairs. Individuals were evaluated between 1998 and 2004. The analytic sample included 1,381 individuals.
SATSA is a longitudinal study that began in 1984 and follows same-sex twins who indicated they had been separated before the age of 10 years and reared apart, and a matched sample of twins reared together. All SATSA twins who reached age 50 were invited to participate in in-person testing (IPT). We included only data from the fifth through ninth IPTs (1999–2012) when word list recall was collected. The analytic sample included 548 individuals.
OCTO-Twin includes same-sex twin pairs over the age of ∼80 (79–98 years) at baseline in 1991, with five follow-up waves obtained through 2002. The analytic sample included 561 individuals.
GENDER is a longitudinal study of opposite-sex twin pairs born between 1916 and 1925 who were aged 70–79 years at the first IPT and had three IPT waves between 1995 and 2005. The analytic sample included 479 individuals.
Denmark
The two Danish twin studies were drawn from the Danish Twin Registry and include the Longitudinal Study of Aging Danish Twins (LSADT) [26] and the Middle-Aged Danish Twins Study (MADT) [27]. LSADT is a cohort-sequential study of same sex twin pairs that began in 1995. Initially, LSADT included twins aged 75+ years, but as new cohorts were recruited the age minimum was lowered to 70, resulting in age ranges from 70 to 96 years. MADT is a longitudinal study of both same- and opposite-sex twin pairs born between 1931 and 1952 who were first assessed in 1998, resulting in age ranges from 45 to 68 years. The analytic sample included 4,626 in LSADT and 4,306 in MADT.
Australia
The Older Australian Twins Study (OATS) [28] started in 2006 with the recruitment of twins aged 65 and older, including twins from the Australian Twin Registry as well as new volunteers from the community. In-person evaluations included core components for diagnosing dementia, including medical and neuropsychological examinations, informant interview, blood collection, and brain imaging [28]. The analytic sample included 592 individuals.
United States
The three US studies include the Carolina African-American Twin Study of Aging (CAATSA) [29], the twin sample of the Midlife Development in the United States (MIDUS) [30], and the Vietnam Era Twin Study of Aging (VETSA) [31].
CAATSA is a cross-sectional sample of African American twins from North Carolina recruited by phone book/internet/credit service searches and voter registration records in 1999 through 2003 [29, 32]. The analytic sample included 675 individual twins ranging in age from 20 s through 80 s.
MIDUS is a nationally representative longitudinal study, which also collected a twin subsample of both same- and opposite-sex twin pairs ascertained using a random-digit dialing procedure and supplemented with additional twin pairs recruited through referrals given by non-twin participants [33]. Cognitive function and self-rated functional ability were assessed in two waves in 2004 to 2006 and in 2013 to 2014. The analytic sample included 1,341 individuals, ages ranging from 34 to 82 years.
VETSA is a longitudinal study of a national sample of male twins who served in the military during the Vietnam era (1965–1975), recruited through the Vietnam Era Twin Registry. All twins were 51 to 61 years of age at initial assessment wave and were 55 to 67 years of age at the second assessment wave that was used in the analyses. The analytic sample included 1,261 individuals.
Variables
The 10 IGEMS studies differ considerably in the number and type of memory, other cognitive, and functional ability measures available. Memory measures represent various episodic memory tasks. Other cognitive measures encompass domains of verbal ability, visuospatial ability, analytical reasoning, verbal fluency, processing speed, and working memory, with each study typically assessing only some domains. Functional ability measures encompass everyday activities that require cognition in order to function independently. In our analyses, we included measures of memory and other cognitive domains that were available in each participating study (as shown in Table 2 and described in detail in the Supplementary Material). Consistent with prior work [34], we converted raw memory and other cognitive scores into the proportion of maximum possible, a variation of percentage of maximum possible (POMP) values [35]. All scores were coded so that higher values indicated better performance. When there was a total correct score, the POMP score was the raw score divided by maximum possible (i.e., proportion correct). When raw score values were number of items generated during a timed task (e.g., verbal fluency), the POMP score was the number of items generated divided by the time allotted. When raw score values were times to complete a task with lower scores indicative of better performance (e.g., trails), we calculated the POMP score by subtracting time to complete from maximum time then dividing by maximum time. The proportions were then multiplied by 10 so that all scores ranged from 0 to 10; the transformation does not affect the covariance matrices analyzed [35].
Table 2
Latent dementia indicator standardized factor loadings and correlations by study
| Country | Sweden | Australia | Denmark | US | ||||||
| Study | HARMONY (n = 1,381) | SATSA (n = 548) | GENDER (n = 479) | OCTO-Twin (n = 561) | OATS (n = 592) | MADT (n = 4,306) | LSADT (n = 4,626) | CAATSA (n = 675) | MIDUS (n = 1,341) | VETSA (n = 1,261) |
| Memory Variables | ||||||||||
| Word List Immediate Recall | 0.89a | 0.79a | 0.91a | 0.85a | 0.74a | 0.64a | 0.39 | 0.86a | 0.56a | |
| Word List Delayed Recall | 0.82 | 0.79 | 0.90 | 0.90 | 0.69 | 0.70 | 0.82 | 0.52 | ||
| Word List Delayed Recognition | 0.68 | 0.67 | 0.69 | 0.31 | ||||||
| Prose Recall Immediate | 0.90a | 0.56 | 0.90a | 0.91 | ||||||
| Prose Recall Delayed | 0.61 | 0.83 | 0.92 | |||||||
| Picture Memory | 0.69 | 0.62 | 0.87 | |||||||
| Cognitive Variables | ||||||||||
| Block Design | 0.60 | 0.53 | 0.52 | 0.77 | 0.40 | |||||
| Digits Forward | 0.31 | 0.51 | 0.16 | 0.27 | 0.30 | 0.20 | 0.20 | |||
| Digits Backward | 0.47 | 0.61 | 0.31 | 0.40 | 0.49 | 0.30 | 0.31 | 0.25 | ||
| Figure Identification | 0.52 | 0.49 | 0.85 | |||||||
| Figure Rotation | 0.44 | 0.29 | ||||||||
| Semantic Fluency | 0.76 | 0.42 | 0.33 | 0.52 | 0.27 | 0.31 | ||||
| Letter Fluency | 0.70 | 0.57 | 0.35 | 0.20 | ||||||
| Information | 0.49 | 0.48 | 0.81 | |||||||
| Synonyms | 0.68 | 0.54 | 0.64 | 0.76 | ||||||
| Symbol Digit | 0.60 | 0.53 | 0.52 | 0.81 | 0.45 | 0.41 | 0.56 | 0.26 | ||
| Trails A | 0.40 | 0.26 | ||||||||
| Trails B | 0.47 | 0.37 | ||||||||
| Functional Ability | –0.77 | –0.43 | –0.44 | –0.28 | –0.32 | 0.15 | 0.32 | –0.15 | –0.14 | –0.25 |
| LDI mean (variance) | 2.79 (1.00b) | 5.11 (1.00b) | 3.98 (1.00b) | 2.01 (1.00b) | 5.33 (1.00b) | 4.43 (1.00b) | 4.74 (1.00b) | 2.10 (1.00b) | 3.21 (1.00b) | 8.82 (1.00b) |
| Correlations | ||||||||||
| Clinically Diagnosed Dementia | –0.75 | –0.46 | –0.58 | –0.64 | –0.41 | – | – | – | – | – |
| Mental Status | 0.79 | 0.63 | 0.53 | 0.80 | 0.52 | – | 0.45 | 0.48 | – | – |
| Age | 0 | 0 | 0 | 0 | 0 | 0 | 0 | 0 | 0 | 0 |
| Male | –0.06 | 0.07 | 0.18 | –0.01 | 0.19 | 0.17 | 0.06 | 0.07 | 0.21 | – |
LDI, latent dementia index. Loadings only shown in table for tests in multiple studies. a and b indicate unstandardized loading was fixed to 1.0. Loadings not displayed in the table by sample include: SATSA: Analogies (0.56); OATS: Naming (0.46), Similarities (0.45), List Immediate Short Delay Recall (after interference list: 0.89); CAATSA: Alphabet Span (0.39); MIDUS: Counting Backward (0.21), Number Series (0.27), Stop-Go Switching (0.10); VETSA: Semantic Fluency-Boy Names (0.28), Hidden Figures (0.28), Letter-Number Sequencing (0.22), Matrix Reasoning (0.34), Reading (0.43), Spatial Span Forward (0.17), Spatial Span Backward (0.25), Stroop (0.19), Vocabulary (0.30). All loadings shown for HARMONY, GENDER, and OCTO-Twin. Fixed loading of word list immediate recall to 1.0 (unstandardized) in all studies except OCTO-Twin and CAATSA where we instead fixed logical memory immediate to 1.0 (unstandardized). OCTO-Twin did not have word list and CAATSA, which used Telephone Interview for Cognitive Status –modified (TICSm) 10-item scale, did not have adequate variance on this test. Clinically diagnosed dementia is dichotomized as dementia vs. not dementia, which includes all subthreshold and mild impairment categories. Seven HARMONY twins missing clinical diagnoses, so Ns do not all sum to full sample analytic N. Mental status is obtained by MMSE in HARMONY, SATSA, OCTO-Twin, and OATS and by TICS (removing word list item used as word list immediate recall) in CAATSA. HARMONY n = 1,131 for MMSE scores. MMSE, Mini-Mental State Examination.
Five studies (n = 3,490) from Sweden and Australia administered a complete diagnostic protocol and applied clinical diagnostic criteria to establish clinical diagnoses of dementia, including type of dementia, also whether the person met criteria for mild cognitive impairment (MCI) or cognitively impaired/not dementia (CIND). MCI and CIND were considered not-dementia in our dichotomous clinically diagnosed dementia variable, which was coded 1 = dementia (of any type) and 0 = not-dementia.
Swedish and Danish twin registries were both linked to population-based health registries that contained diagnostic information. There is a lag between the time a clinical diagnosis is made at a clinic and how soon the registry records the diagnostic code. Based on data from the three Swedish Twin Register longitudinal studies, it was estimated that a dementia ICD code appears in the National Patient Registry (NPR) on average 5.5 years after the diagnosis is first made [36, 37]. Thus, in our analyses of agreement between registry and LDI, we determined whether the participant had an ICD code for dementia in any registry within 5 years after the assessment wave used for scoring the LDI.
Data analysis
LDI scores
Raw data from each study sample were used in one-factor confirmatory factor analysis (CFA) models to estimate LDI in each of the 10 studies. CFA tests the hypothesis that the observed variables fit the latent structure of the model. Figure 1 illustrates the one-factor CFA model fit to each study sample. This model allows for existing variability in the number and type of memory, other cognitive, and functional ability measures administered across studies. For example, not every study included word list learning and recall among their memory measures. For studies that did, the number of words could vary from 10 to 16, the number of learning trials from 1 to 5, the delay before recall from 5 to 30 min.
Fig. 1
General Latent Dementia Index (LDI) Model (Variables Taken From HARMONY). LDI, latent dementia index; manifest variables include: COG1 – COGc, non-memory cognitive ability variables (e.g., block design, verbal fluency, digit span); MEM1 – MEMd, memory ability measures (e.g., immediate recall, delayed recall, and recognition); and functional ability, which is a composite measure of instrumental activities of daily living that require some level of cognitive functioning. Manifest variable intercepts and latent means are indicated by triangles with a value of 1 inserted in them. Residual variances (ɛ) are estimated for each manifest variable. * indicates that the parameter is estimated whereas values along paths (e.g., 0) indicate that the parameter is fixed to that value.
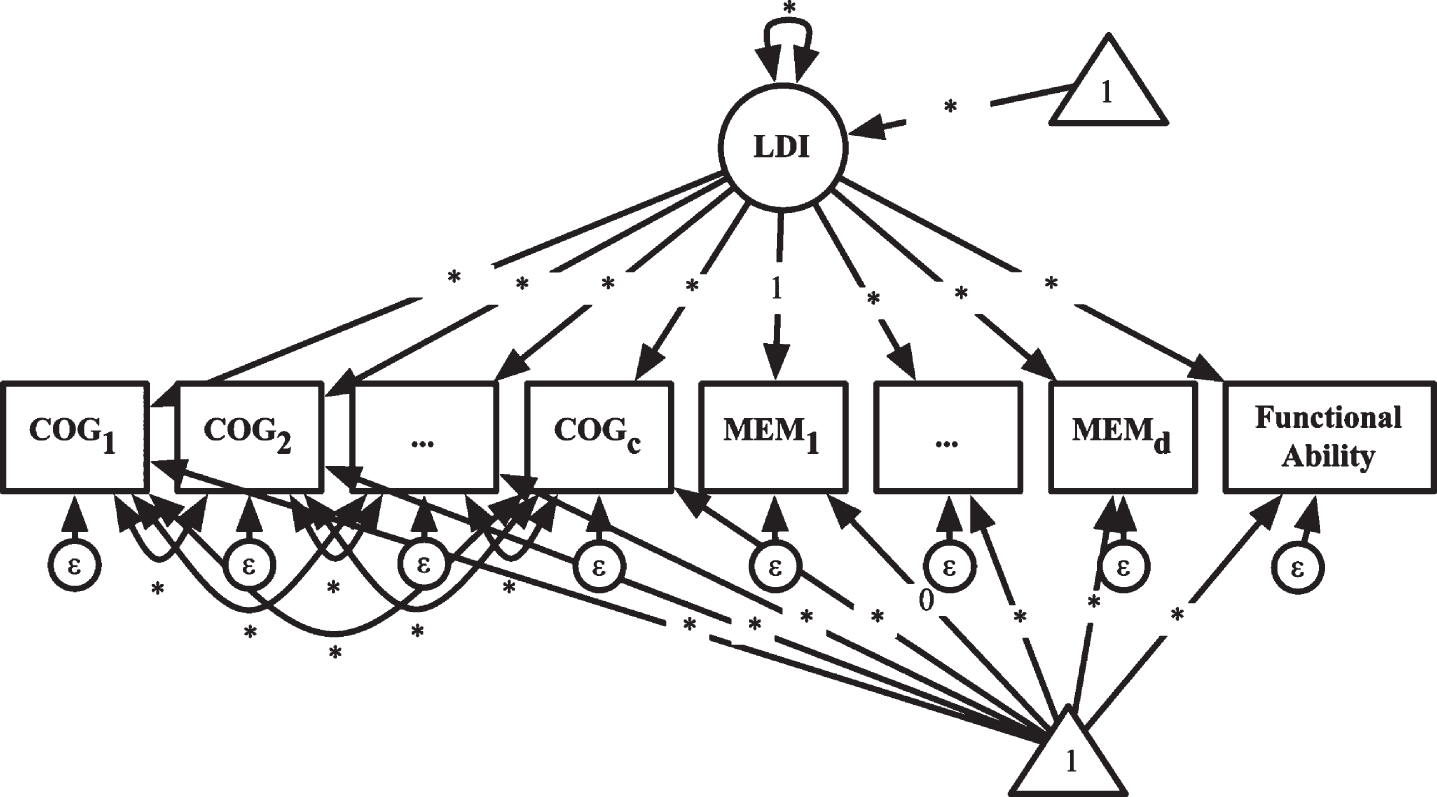
Consistent with prior approaches [9, 11, 13], cognitive ability was modeled as part of the LDI but with correlated residuals, which in effect splits the cognitive ability variance into a residual general cognitive ability component that represents baseline cognitive ability and a latent dementia indicator component that represents those cognitive abilities and functional areas affected by dementia. Both functional ability and memory were considered unique to the LDI. The separability of memory from general cognitive ability is already well-supported [38, 39] and matches the outcomes of prior δ studies [9, 13] that showed factor loadings of the memory measures on the general cognitive ability factor became non-significant after adding δ to the models.
The model in Fig. 1 saturates the correlations among the residuals of the non-memory cognitive ability variables, thereby statistically addressing differences among studies in the number of tests that assess the same domain. We specified one memory variable factor loading constrained to 1.0 to scale the LDI and allow the LDI variance to be estimated. The intercept of the same memory variable was constrained to 0 so that the mean of the LDI could be estimated. This scaling of means and variances has the effect of scaling the LDI scores by similar tasks across study so that studies can be coordinated meaningfully.
Analyses were conducted in Mplus 8.4 [40]. Maximum likelihood with robust standard errors was used as the estimator to account for violations of multivariate normality and missing data. Non-response was assumed to be missing at random or missing not at random. In both cases, full information maximum likelihood is the recommended approach for obtaining least biased parameter estimates and standard errors [41]. To obtain unbiased standard errors, we accounted for the dependence between twins in the same family. Factor scores were scaled such that lower scores indicate greater likelihood of dementia. Finally, age at testing was included in the model as a predictor of the cognitive, memory, and functional ability variables to center obtained scores at age 60 [42].
To pool all studies for coordinated analyses of the entire consortium data set, study sample LDI scores were re-centered to align with HARMONY LDI scores. The aligned individual scores were constructed by adding the difference between each individual’s sample mean and HARMONY LDI mean to each individual score (e.g.,
LDI validity
Criterion validity was evaluated by estimating correlations of continuous LDI scores with dichotomously coded clinically diagnosed dementia. Subsequently, cut-off points were derived for the LDI (1 = likely to have dementia; 0 = unlikely to have dementia) using dementia prevalence within the study when available or otherwise based on prevalence in the population from which the study was drawn (e.g., national rate of dementia in Denmark was 9% in those 65+ years old [43]; in the US, 10% in those 65+ years-old [44, 45]. Using these cut-off points on the LDI, we calculated sensitivity (true positive rate), specificity (true negative rate), positive predictive value (proportion of people below cut-off who have the disease), false positive rate (those incorrectly identified as having the disease), negative predictive value (proportion of people above cut-off who do not have the disease), and accuracy (sum of true positives and true negatives, or those categorized correctly) compared with dichotomous clinical diagnosis.
Separately, we used the LDI as the reference standard and register diagnosis as the test to examine the specificity of the LDI. Given the Scandinavian national registries have shown approximately 50% sensitivity and nearly 100% positive predictive validity (i.e., there are minimal false positive cases [36, 37, 46]), we expected the LDI would show high specificity and capture nearly everyone who had a dementia code in a national registry.
Genetically informed analyses
We conducted univariate and bivariate quantitative genetic analyses with univariate twin models fit to the LDI scores (Fig. 2a). In classical twin (“ACE”) models, additive genetic (A) components are the cumulative additive effect of genotype and are estimated by virtue of the fact that MZ twins share 100% of their genes and DZ twins share 50% of their genes, on average. Shared environmental (C) components are the cumulative effect of any environment that makes twins reared in the same family more similar to one another and estimated under the assumption that shared environmental influences affect twins similarly regardless of genetic relatedness. Non-shared environmental (E) components are any environmental factor that makes twins different from one another, including measurement error. Broad heritability estimates of LDIs were estimated to infer whether additive genetic influence was similar across studies using their respective 95% confidence intervals.
Fig. 2
Univariate Twin Model (a) and Bivariate Twin Model (b) for One Twin Only. The univariate model in (a) gives the example of decomposing the observed latent dementia index (LDI) variance into random latent genetic (A), shared environmental (C), and non-shared environmental (E) variance components. In this model, LDI intercepts are estimated and residual variances of the LDI are constrained to be zero. Univariate ACE models were fit to dichotomized clinically diagnosed dementia and dichotomized LDI scores. In these models, thresholds replace intercepts. Effects of age at cognitive assessment (presented) and age2 (not presented) were estimated. The subscripts 1 and 2 refer to twin 1 and twin 2, respectively. The bivariate model (b) estimates decomposes the LDI and clinically diagnosed dementia into random latent genetic (A), shared environmental (C), and non-shared environmental (E) variance components and estimates the correlations between the respective components (Cov(A), Cov(C), and Cov(E)). Effects of age at cognitive assessment (presented) and age2 (not presented) were estimated.
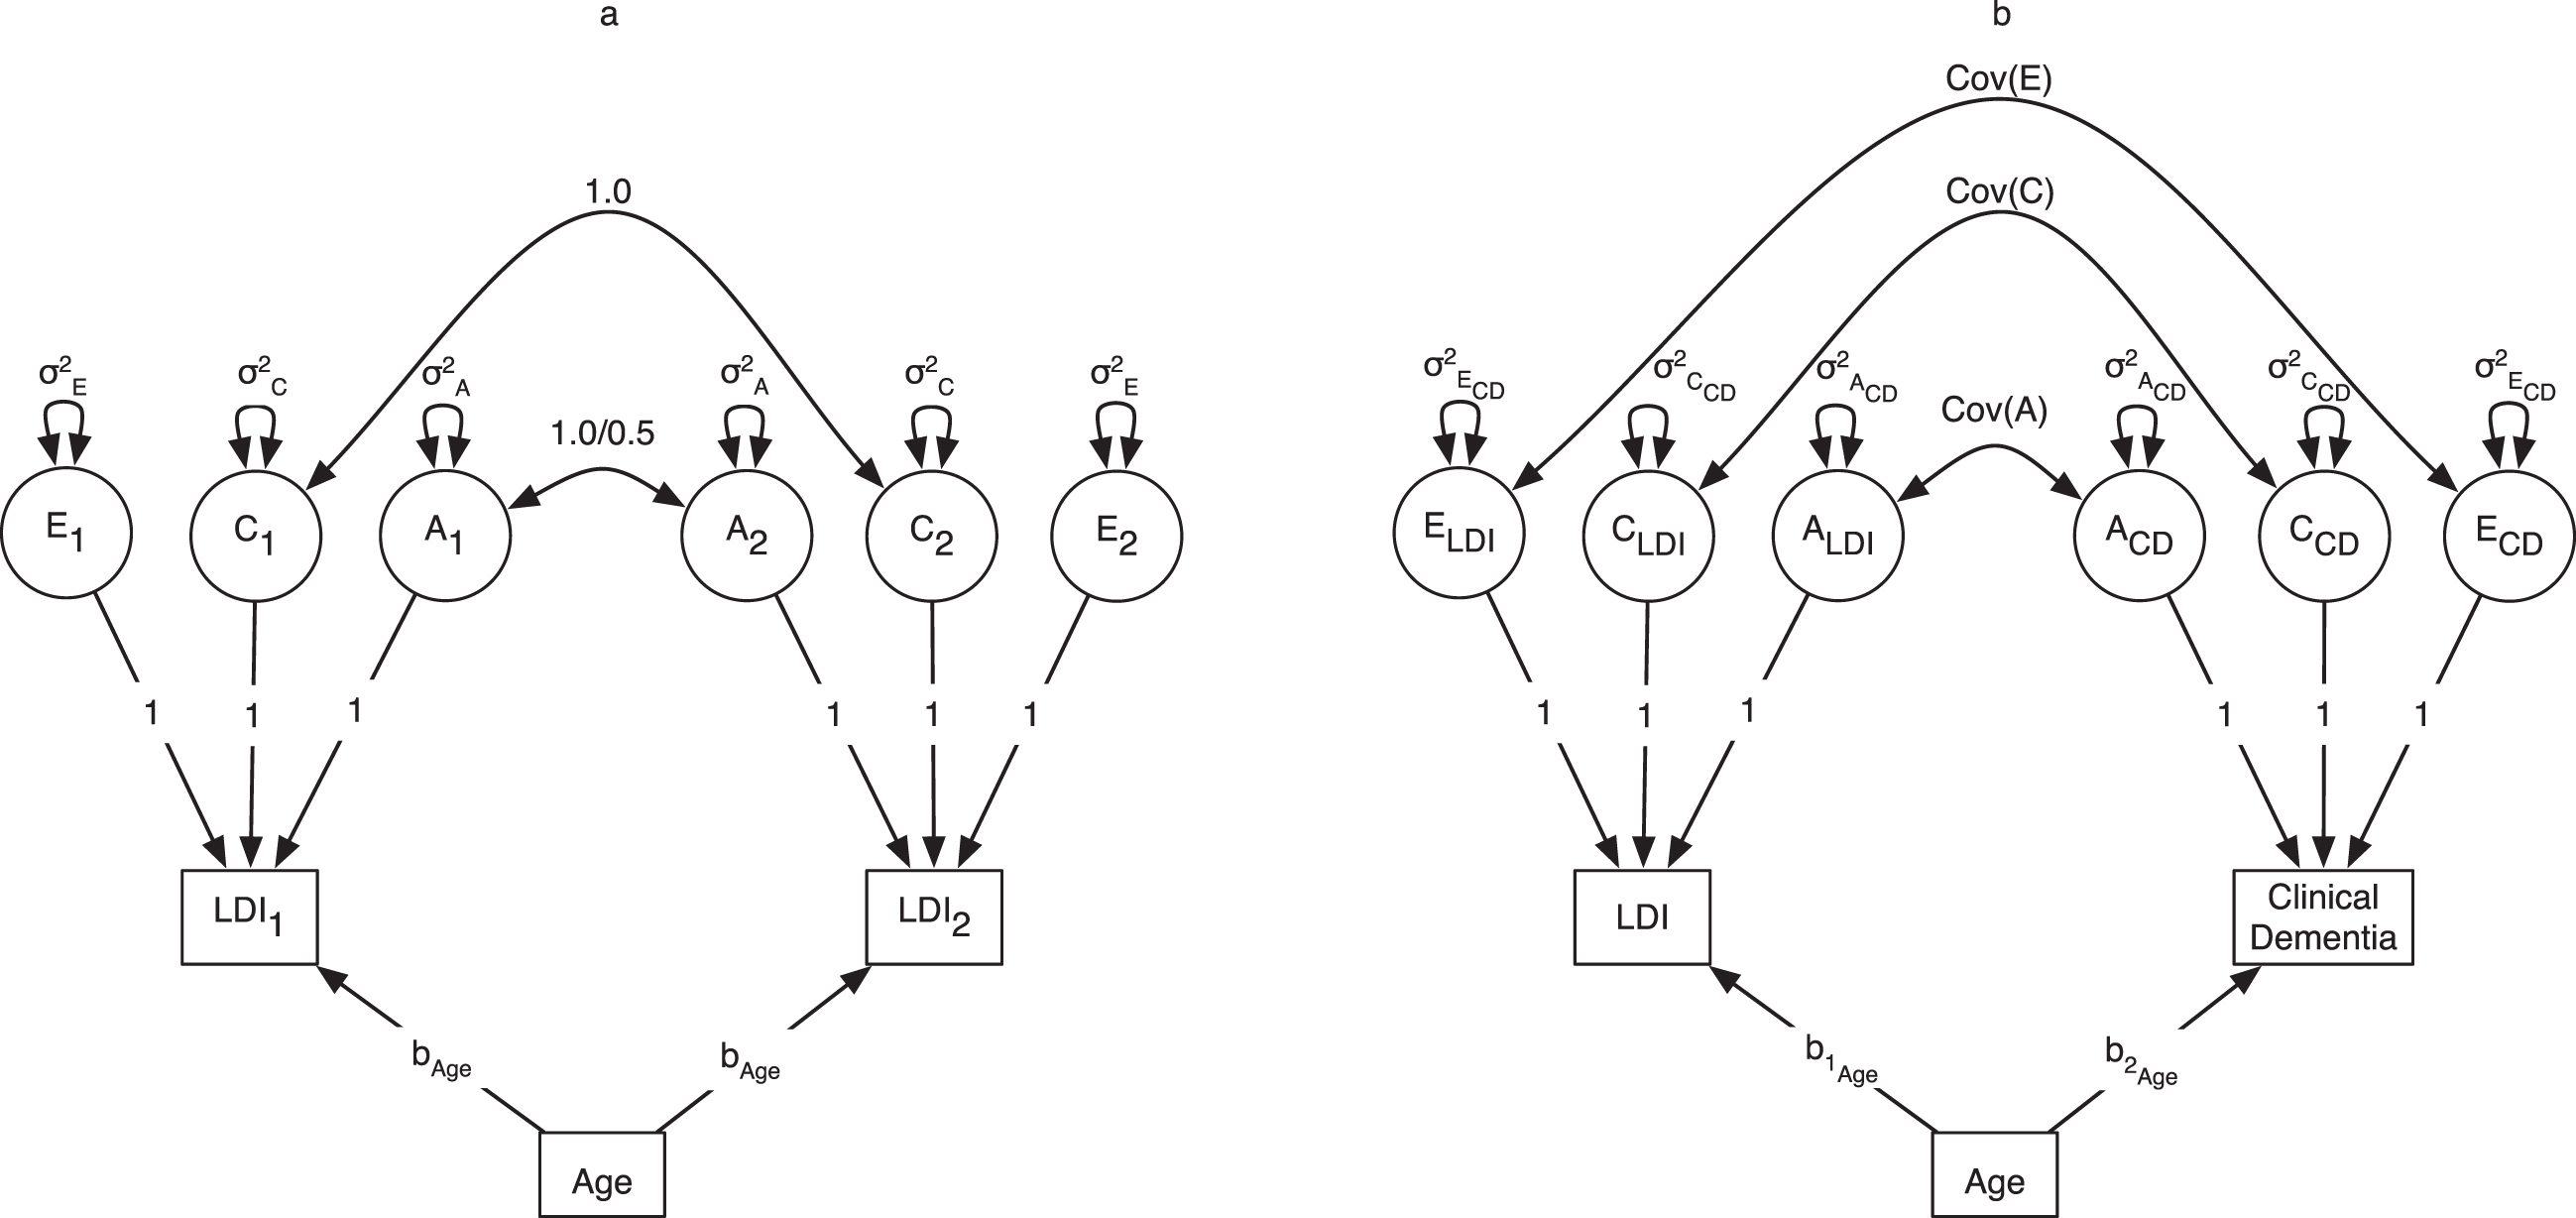
Bivariate ACE models were fit to the continuous LDI scores and dichotomous clinical diagnoses (Fig. 2b, with observed and latent variables presented for one twin only for simplicity of presentation). Genetic and environmental covariances were estimated to construct the genetic and environmental correlations between LDI and clinically diagnosed dementia as product-moment correlations and reported with 95% confidence intervals. Intercepts and thresholds were constrained across twins and zygosity groups. Age and age-squared were included in all models to reduce bias in the shared environmental variance given that the twins are tested at nearly identical ages (r = 0.95). Proportions of variability in LDI and clinically diagnosed dementia attributed to genetic (A, or h2) and environmental (C, or c2, and E, or e2) components were estimated by dividing these variance components by the total variance estimate.
Univariate ACE models were estimated with maximum likelihood, and bivariate twin models were estimated using weighted least squares because of including the dichotomous clinical diagnosis.
RESULTS
LDI scores
Table 2 shows the standardized factor loadings from the LDI model for the 10 studies (Supplementary Table 1 presents unstandardized results). Loadings were generally in the same range across all studies (0.20s to 0.80s, standardized), regardless of which cognitive tests were included. Loadings for the memory tests generally were more strongly associated with the LDI (0.30s to 0.90s, standardized) than the non-memory cognitive items. LDI factor means were lowest (i.e., greatest likelihood of dementia) in studies with highest proportion of individuals diagnosed with dementia (e.g., HARMONY, OCTO-Twin) and highest (i.e., least likelihood of dementia) in studies with the smallest proportion of individuals diagnosed with dementia (e.g., OATS, VETSA), with rates of dementia mirroring age distribution of the respective studies. As seen in Supplementary Table 1, variances for the LDI score were lower in US and Danish studies, suggesting relatively greater precision of the LDI mean estimate.
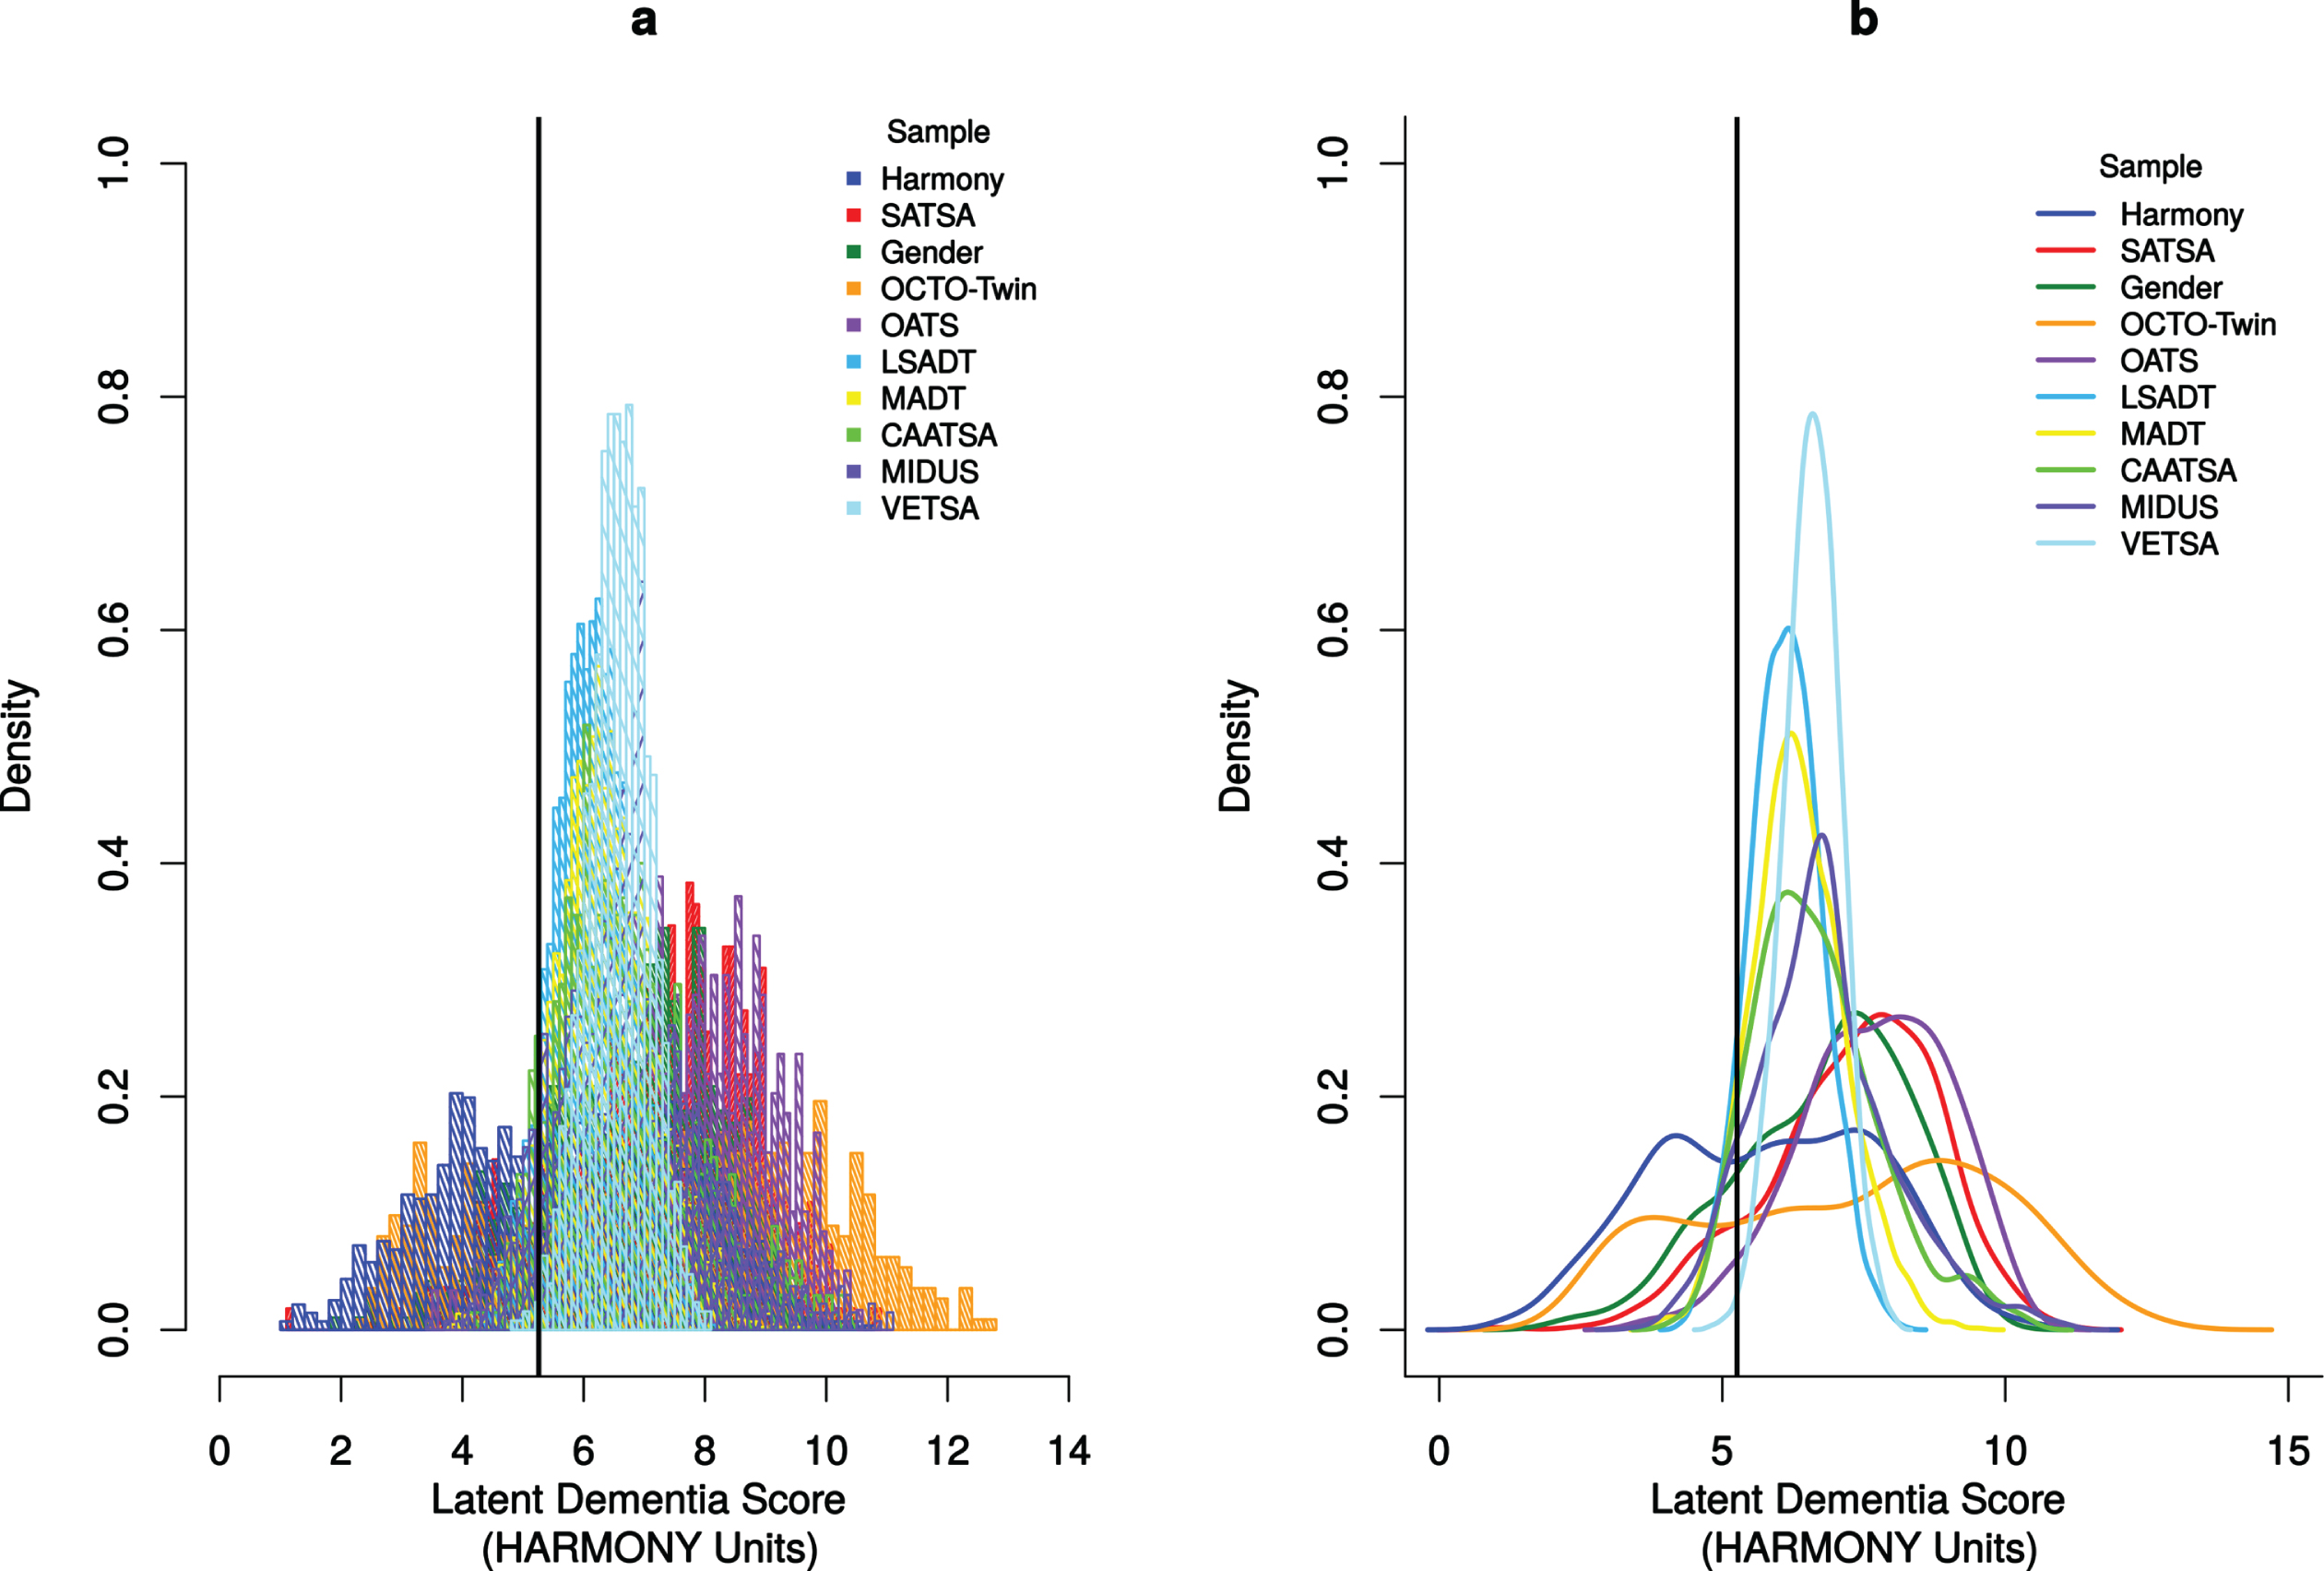
Figure 3 displays the LDI factor score histograms (Fig. 3a) and density functions (Fig. 3b) for all studies. The vertical black line in the plot represents the LDI cut-off point for categorizing individuals as likely to have dementia with values to the left of the black line categorized as “likely” and values to the right of the black line categorized as “unlikely”. This histogram provides support for a continuous LDI that distinguishes between individuals who have higher likelihood of dementia from those who have lower likelihood of dementia. The overlapping density curves depict the shape of each study’s LDI distribution, which is normally distributed. Although the distribution is symmetric and there is no noticeable skewness, the distribution is platykurtic with a value less than 3.00 (2.09), which suggests that there are fewer extreme values in our LDI distribution than a Gaussian distribution.
Fig. 3
Histogram (left panel) and Density Curves (right panel) of the 10 IGEMS studies (HARMONY units). Panel a is histogram of the probability densities for all 10 studies. Panel b is the Gaussian kernel density plots of all 10 studies. Units are converted to those estimated in the HARMONY. The solid black vertical line indicates the cut-off score (5.26) used to categorize twins with probable dementia (left of the line) and twins without probable dementia (right of the line).
LDI scores consistently correlated with clinically diagnosed dementia across studies (see lower portion of Table 2). All values are moderate to high, ranging from –0.41 in OATS to –0.75 in HARMONY. Correlations between LDI and mental status screening scores (e.g., Mini-Mental State Examination [MMSE] or Telephone Interview for Cognitive Status [TICS]) also ranged from a moderate value of 0.48 in CAATSA to a large value of 0.80 in OCTO-Twin.
Table 3 shows the criterion validity analyses for the studies that have clinical diagnoses available. Consistent with our selection of cut-off points that prioritize keeping false positives at a minimum, false positives were low (range: 1.7–7.0%) and specificity was high (90.5–98.2%) in all studies. Sensitivity varied across the five studies from HARMONY at 87% to SATSA at 51%. These sensitivity levels are highest in studies with higher disease prevalence. Separately, sensitivities for registry dementia codes within 5 years of neuropsychological testing were 88%, 93%, 93%, 89% for HARMONY, SATSA, GENDER, and OCTO-Twin, respectively.
Table 3
Criterion validity
| Sample | N | LDI Cut-Off Score | False Positive | Sensitivity | Specificity | Positive Predictive Value | Negative Predictive Value | Accuracy | Disease Prevalence |
| Sweden | |||||||||
| HARMONY | 1374 | 5.26 | 5.60 | 86.50 | 90.50 | 86.40 | 90.60 | 88.90 | 41.10 |
| SATSA | 548 | 6.12 | 5.70 | 50.80 | 93.60 | 50.80 | 93.60 | 88.70 | 11.50 |
| GENDER | 477 | 5.15 | 6.50 | 62.60 | 92.20 | 61.70 | 92.40 | 87.20 | 16.80 |
| OCTO-Twin | 561 | 3.54 | 7.00 | 73.30 | 90.60 | 73.30 | 90.60 | 86.10 | 26.00 |
| Australia | |||||||||
| OATS | 589 | 4.80 | 1.70 | 60.00 | 98.20 | 60.00 | 98.20 | 96.60 | 4.20 |
LDI, latent dementia index. Some twins are missing clinical diagnoses, so ns do not all sum to full sample analytic N. False positive, sensitivity, specificity, positive predictive value, and negative predictive value, accuracy and disease prevalence expressed in %.
Genetically informed analyses
Table 4 presents univariate ACE estimates and genetic and environmental correlations from bivariate ACE models for clinically diagnosed dementia where available, quantitative LDI, and dichotomized LDI. Pooled heritability estimates (h2) of the quantitative LDI scores (first set of columns in Table 4), dichotomous LDI scores (second set of columns in Table 4), and the dichotomously coded clinical diagnosis variable (third set of columns in Table 4) are comparable, showing h2 = 53%, 59%, and 61%, respectively. Shared environmental variance (c2) components underlying LDI were negative across all studies and so were set to zero in the models. Non-shared environmental factors (e2) accounted for the remaining variance, with estimates of 47%, 41%, and 39% respectively for quantitative LDI, dichotomous LDI, and clinically diagnosed dementia. Results for individual studies were far more variable than the pooled results. These results suggest that LDI modestly underestimates h2 and modestly overestimates e2.
Table 4
Univariate ACE standardized parameter estimates and bivariate ACE correlations (95% confidence intervals)
| Univariate LDI | Univariate Dichotomous LDI | Univariate Clinically Diagnosed Dementia | Bivariate Correlations LDI < ->Clinically Diagnosed Dementia | |||||||||
| Sample | h2 | c2 | e2 | h2 | c2 | e2 | h2 | c2 | e2 | rA | rC | rE |
| All | 0.53 (0.50, 0.56) | 0.00 (0.00, 0.00) | 0.47 (0.44, 0.50) | 0.59 (0.36, 0.82) | 0.00 (–0.18 –0.18) | 0.41 (0.33, 0.49) | 0.61 (0.50, 0.72) | 0.00 (–0.01, 0.01) | 0.39 (0.28, 0.50) | –0.66 (–0.74, –0.58) | – | –0.51 (–0.59, –0.42) |
| HARMONY | 0.09 (–0.06, 0.23) | 0.00 (0.00, 0.00) | 0.91 (0.77, 1.06) | 0.34 (0.14, 0.54) | 0.00 (–0.02, 0.02) | 0.66 (0.46, 0.86) | 0.35 (0.14, 0.56) | 0.00 (–0.01, 0.01) | 0.65 (0.44, 0.86) | –0.65 (–0.81, –0.49) | – | –0.64 (–0.75, –0.52) |
| SATSA/ GENDER | 0.47 (0.34, 0.60) | 0.00 (0.00, 0.00) | 0.53 (0.40, 0.66) | 0.18 (–1.19, 1.54) | 0.01 (–0.80, 0.83) | 0.81 (0.18, 1.44) | 0.56 (0.28, 0.84) | 0.00 (0.00, 0.00) | 0.44 (0.16, 0.72) | –0.48 (–0.66, –0.29) | – | –0.57 (–0.76, –0.38) |
| OCTO-Twin | 0.47 (0.34, 0.60) | 0.00 (0.00, 0.00) | 0.53 (0.40, 0.66) | 0.60 (0.39, 0.81) | 0.00 (0.00, 0.00) | 0.40 (0.19, 0.61) | 0.43 (–0.39, 1.24) | 0.00 (–0.65, 0.65) | 0.57 (0.29, 0.86) | –0.55 (–0.76, –0.34) | – | –0.57 (–0.76, –0.39) |
| OATS | 0.61 (0.51, 0.70) | 0.00 (0.00, 0.00) | 0.40 (0.30, 0.49) | 0.20 (–1.25, 1.64) | 0.35 (–0.89, 1.59) | 0.46 (0.03, 0.88) | 0.53 (–0.57, 1.64) | 0.39 (–0.68, 1.46) | 0.08 (–0.09, 0.24) | –0.81 (–0.98, –0.63) | – | –0.30 (–0.53, –0.06) |
| MADT | 0.43 (0.37, 0.48) | 0.00 (0.00, 0.00) | 0.58 (0.52, 0.63) | 0.31 (–0.22, 0.84) | 0.00 (–0.39, 0.39) | 0.69 (0.48, 0.90) | – | – | – | – | – | – |
| LSADT | 0.49 (0.43, 0.55) | 0.00 (0.00, 0.00) | 0.51 (0.45, 0.57) | 0.18 (–0.52, 0.88) | 0.16 (–0.36, 0.68) | 0.66 (0.39, 0.93) | – | – | – | – | – | – |
| CAATSA | 0.67 (0.58, 0.76) | 0.00 (0.00, 0.00) | 0.33 (0.24, 0.42) | 0.31 (–0.13, 0.75) | 0.00 (–0.03, 0.03) | 0.69 (0.25, 1.13) | – | – | – | – | – | – |
| MIDUS | 0.29 (0.19, 0.40) | 0.00 (0.00, 0.00) | 0.71 (0.60, 0.81) | 0.00 (–0.06, 0.06) | 0.26 (0.03, 0.50) | 0.74 (0.51, 0.97) | – | – | – | – | – | – |
| VETSA | 0.60 (0.53, 0.66) | 0.00 (0.00, 0.00) | 0.40 (0.34, 0.47) | – | – | – | – | – | – | – | – | – |
h2 is the proportion of total variance in LDI, dichotomous LDI, or clinically diagnosed dementia attributed to additive genetic factors; c2 is the proportion of variance in LDI, dichotomous LDI, or clinically diagnosed dementia attributed to common environmental variance; e2 is the proportion of variance in LDI, dichotomous LDI, or clinically diagnosed dementia attributed to nonshared environmental variance; rA = genetic correlation between LDI and clinically diagnosed dementia; rC = common environmental correlation between LDI and clinically diagnosed dementia; rE = non-shared environmental correlation between LDI and clinically diagnosed dementia; 95% confidence intervals are below each point estimate. GENDER consists only of opposite-sex DZ pairs of twins and so was combined with SATSA given the similarity in sampling characteristics. Few VETSA participants met the dichotomous LDI cutoff, so model estimates of the dichotomized LDI could not be made.
Moderate to strong genetic correlations were observed between the quantitative LDI scores and clinical diagnoses across all studies, with rA = –0.66 for the combined sample (range: rA = –0.81 to –0.48 for individual studies; see last set of columns in Table 4), suggesting genetic sources of variability in common to LDI and clinical diagnoses. Non-shared environmental correlations were small to moderate and significant, with rE = –0.51 for the combined sample (range: rE = –0.64 to –0.30 for individual studies). Twins who had higher LDI scores compared to their co-twins were, in fact, more likely to be diagnosed with dementia.
DISCUSSION
This study serves as a starting point for addressing the issue of quantifying and categorizing dementia for multi-study integration. The results show that latent dementia factor scores can be extracted from heterogeneous variables and reasonably placed on the same scale for pooled analyses. Furthermore, this study produces the first latent dementia approach that addresses the issue of coordinating scores of dementia likelihood for individuals in studies without clinical diagnoses available. Meaningful comparison of scores across studies hinge on careful selection of a conceptually similar variable, like episodic memory used in the current study, to scale the latent variable means and variance. The advantage of this approach is the ability to handle the real-world practicalities of diverse samples and datasets and provide flexibility for what samples to include in an integrated analysis.
There are three features of our LDI approach that make the method useful to other consortia. First, the model has the benefit that samples can be added or removed from analyses when testing different hypotheses, each of which may only be possible to test in a subset of samples, without requiring the re-establishment of metric invariance in each instance. Second, the univariate approach simplifies the data analyses while maintaining consistency with other LDI approaches (e.g., δ approaches [47]), insofar as the residual cognitive ability variance is separated out of the LDI scores. Third, the LDI approach produces both a continuous measure of dementia likelihood as well as cutoff scores that can be used to dichotomize the LDI score with good accuracy, thereby enabling characterization of probable disease presence and degree of disease severity [48]. Like many clinical conditions, dementia is not a binary state. Rather, the progression from normal cognitive functioning to clinical disease occurs in small degrees, ranging from slight memory lapses to severe broad impairments. The LDI score captures this range. Furthermore, quantitative measures increase power to detect relationships and processes underlying dementia. We note that, although some studies in the IGEMS consortium have a broad age range, we suggest that the LDI score is not useful at ages younger than 50 or 60. Sensitivity and specificity of the LDI against clinically diagnosed dementia was calculated for age 65 and older. LDI is a measure of dementia likelihood, which is especially desirable when a study lacks other ways to identify dementia cases; it is not a measure of risk of future dementia.
The genetically informed analyses provide additional support for the validity of the LDI. The relative stability of the heritability estimates of the quantitative LDI, the dichotomized LDI, and dichotomized clinical diagnosis variable in the combined sample replicates prior twin study findings on the heritability of dementia and Alzheimer’s disease in Swedish studies [15, 16, 49], with approximately 55–60% of the variability attributed to genetic differences between individuals. This finding is notable given the wide range of heritability and non-shared environmental estimates across the studies, suggesting that the pooled sample yields reliable population estimates.
The genetic correlations between the LDI and clinically diagnosed dementia also are informative about the validity of LDI scores. Genetic causes account for approximately 40% of the shared variance and suggest that a sizeable proportion of variance shared by the LDI and clinically diagnosed dementia is due to all genetic causes combined. Future work determining whether the same set of causal loci account for variance shared by the LDI and clinically diagnosed dementia would provide further validation of this methodological approach and the LDI construct.
Non-shared environmental causes account for greater than 25% of the shared variance between the LDI and clinically diagnosed dementia. Our finding of small- to moderately-sized non-shared environmental correlations indicates that, within families, the twin with the lower LDI score (indicating greater likelihood) is also more likely diagnosed with dementia than the co-twin with the higher LDI score. This analysis tests how well LDI predicts clinical dementia while adjusting for genetic and environmental selection [17, 18]. From these results, we can conclude that the LDI is capable of rank ordering persons within pair and between pairs.
This study serves to highlight the benefits of implementing a latent index approach, but it is not without limitations. We did not address types of dementia. We recognize that the validation of the LDI against clinical diagnoses is partially circular, given that for some studies some of the same cognitive and functional ability measures may be used in both the LDI and in the clinical diagnostic workup, and this may have inflated the validity coefficient. At the same time, the clinical diagnoses are able to incorporate additional information, such as whether the functional loss is due to physical conditions rather than cognitive impairment, or if physical conditions such as low vision may have interfered with cognitive performance. Taking all of these considerations into account, however, the LDI approach provides evidence that using only a portion of the information included in clinical diagnoses was sufficient to classify cases accurately with the LDI. Although results were generally consistent across studies, there was variability in how well the LDI model performed across studies, particularly in the correlations between LDI and clinically diagnosed dementia. Such variability is expected in as much as sampling error is expected within a given study and between studies. However, all the values could be ranked according to the prevalence of dementia in each study. Similarly, there was study variability in the genetically informative analyses, perhaps because of differential attrition or sample recruitment methods. The LDI can be calculated with very few cognitive tests but performs better if there are a number of domains encompassed by the cognitive measures. In addition, when LDI scores were pooled across study, the distribution of scores appeared to be sensible. Finally, the latent index should be regarded as a research tool, not as a clinical determination.
Conclusion
We extended prior research on latent variable approaches to estimating dementia likelihood in single studies to multiple studies. Developing a continuous measure of dementia likelihood that can be pooled across samples provides greater power than a dichotomous measure and increases the likely generalizability of findings. The consistency of our results across diverse studies (where dementia assessment may or may not have ever been intended) suggests this latent dementia indicator approach can be applied to any study of cognitive aging with everyday cognitive function measures. Most large surveys of aging include at least one measure of memory, one non-memory measure of cognition, and a measure of instrumental activities of daily living, which are the elements used for deriving the LDI scores. The implication is that many studies could adopt this method to coordinate estimation of likelihood of dementia diagnosis. Furthermore, the simplicity of the single factor LDI model specified in this study means that it can be applied easily across additional studies within research consortia.
ACKNOWLEDGMENTS
This work was supported by US National Institutes of Health (NIH) grants R01 AG060470 to MG and NLP and RF1 AG058068 to Pike, LaDu, and MG and a grant from the Alzheimer’s Association (AARF-17-505302) to CRB.
HARMONY was supported by NIH grant R01 AG08724 to MG. SATSA was supported by grants NIH R01 AG04563, R01 AG10175, the John D. and Catherine T. MacArthur Foundation Research Network on Successful Aging, the Swedish Council For Working Life and Social Research (FAS) (97:0147:1B, 2009-0795), and the Swedish Research Council (825-2007-7460, 825-2009-6141) to NLP. GENDER was supported by the MacArthur Foundation Research Network on Successful Aging to McClearn and The Axel and Margaret Ax:son Johnson’s Foundation, The Swedish Council for Social Research, and the Swedish Foundation for Health Care Sciences and Allergy Research to Malmberg. OCTO-Twin was supported by grant NIH R01 AG08861 to McClearn. OATS was funded by a National Health & Medical Research Council and Australian Research Council Strategic Award Grant of the Ageing Well, Ageing Productively Program (ID No. 401162), and NHMRC Project Grants (ID 1045325 and 1085606) to PS. OATS participant recruitment was facilitated through Twins Research Australia, a national resource in part supported by a Centre for Research Excellence Grant (ID: 1079102), from the National Health and Medical Research Council. We also acknowledge the contribution to this study of the OATS research team listed at https://cheba.unsw.edu.au/project/older-australian-twins-study. The Danish Twin Registry was supported by grants from The National Program for Research Infrastructure 2007 from the Danish Agency for Science and Innovation, the Velux Foundation, and NIH grant P01 AG08761 to Vaupel and KC. CAATSA was funded by NIH grant R01 AG13662 to KEW. MIDUS was supported by the John D. and Catherine T. MacArthur Foundation Research Network on Successful Midlife Development and by NIH grant P01 AG20166 to Ryff. VETSA was supported by NIH grants R01 AG050595 and R01 AG022381 to WSK and CEF. The Cooperative Studies Program of the Office of Research & Development of the US Department of Veterans Affairs also provided financial support for the development and maintenance of the Vietnam Era Twin (VET) Registry.
The content of this manuscript is solely the responsibility of the authors and does not necessarily represent the official views of the funding agencies.
Authors’ disclosures available online (https://www.j-alz.com/manuscript-disclosures/22-0472r1).
SUPPLEMENTARY MATERIAL
[1] The supplementary material is available in the electronic version of this article: https://dx.doi.org/10.3233/JAD-220472.
REFERENCES
[1] | Sperling RA , Aisen PS , Beckett LA , Bennett DA , Craft S , Fagan AM , Iwatsubo T , Jack CR , Kaye J , Montine TJ , Park DC , Reiman EM , Rowe CC , Siemers E , Stern Y , Yaffe K , Carrillo MC , Thies B , Morrison-Bogorad M , Wagster M V. , Phelps CH ((2011) ) Toward defining the preclinical stages of Alzheimer’s disease: Recommendations from the National Institute on Aging-Alzheimer’s Association workgroups on diagnostic guidelines for Alzheimer’s disease. Alzheimers Dement 7: , 280–292. |
[2] | Bennett DA , Schneider J , Arvanitakis Z , Wilson R ((2012) ) Overview and findings from the religious orders study. Curr Alzheimer Res 9: , 628–645. |
[3] | Berg L , McKeel DJ , Miller J , Storandt M , Rubin E , Morris J ((1998) ) Clinicopathologic studies in cognitively healthy aging and Alzheimer’s disease: Relation of histologic markers to dementia severity, age, sex, and apolipoprotein E genotype. Arch Neurol 55: , 326–335. |
[4] | Snider B , Fagan A , Roe C , Shah A , Grant E , Xiong C , Morris J , Holtzman D ((2009) ) Cerebrospinal fluid biomarkers and rate of cognitive decline in very mild dementia of the Alzheimer type. Arch Neurol 66: , 638–645. |
[5] | McKhann GM , Knopman DS , Chertkow H , Hyman BT , Jack CR Jr , Kawas CH , Klunk WE , Koroshetz WJ , Manly JJ , Mayeux R , Mohs RC , Morris JC , Rossor MN , Scheltens P , Carrillo MC , Thies B , Weintraub S , Phelps CH. ((2011) ) The diagnosis of dementia due to Alzheimer’s disease: Recommendations from the National Institute on Aging-Alzheimer’s Association workgroups on diagnostic guidelines for Alzheimer’s disease. Alzheimers Dement 7: , 263–269. |
[6] | Chen Y , Tysinger B , Crimmins E , Zissimopoulos J ((2019) ) Analysis of dementia in the US population using Medicare claims: Insights from linked survey and administrative claims data. Alzheimers Dement 6: , 197–207. |
[7] | Freedman V , Kasper J ((2019) ) Cohort Profile: The National Health and Aging Trends Study (NHATS). Int J Epidemiol 48: 1044–1045g. |
[8] | Dahl A , Berg S , Nilsson SE ((2007) ) Identification of dementia in epidemiological research: A study on the usefulness of various data sources. Aging Clin Exp Res 19: , 381–389. |
[9] | Royall DR , Palmer RF , O’Bryant SE ((2012) ) Validation of a latent variable representing the dementing process. J Alzheimers Dis 30: , 639–649. |
[10] | Barberger-Gateau P , Fabrigoule C , Rouch I , Letenneur L , Dartigues JF ((1999) ) Neuropsychological correlates of self-reported performance in instrumental activities of daily living and prediction of dementia. J Gerontol B Psychol Sci Soc Sci 54: , 293–303. |
[11] | Peh CX , Abdin E , Vaingankar JA , Verma S , Chua BY , Sagayadevan V , Seow E , Zhang Y , Shahwan S , Ng LL , Prince M , Chong SA , Subramaniam M ((2017) ) Validation of a latent construct for dementia in a population-wide dataset from Singapore. J Alzheimers Dis 55: , 823–833. |
[12] | Royall DR , Palmer RF ((2013) ) Validation of a latent construct for dementia case-finding in Mexican-Americans. J Alzheimers Dis 37: , 89–97. |
[13] | Gavett BE , Vudy V , Jeffrey M , John SE , Gurnani AS , Adams JW ((2015) ) The [delta] latent dementia phenotype in the uniform data set: Cross-validation and extension. Neuropsychology 29: , 344–352. |
[14] | Hurd MD , Martorell P , Delavande A , Mullen KJ , Langa KM ((2013) ) Monetary costs of dementia in the United States. N Engl J Med 368: , 1326–1334. |
[15] | Beam CR , Kaneshiro C , Jang JY , Reynolds CA , Pedersen NL , Gatz M ((2020) ) A twin study of sex differences in genetic risk for all dementia, Alzheimer’s disease (AD), and non-AD dementia. J Alzheimers Dis 76: , 539–551. |
[16] | Gatz M , Reynolds CA , Fratiglioni L , Johansson B , Mortimer JA , Berg S , Fiske A , Pedersen NL ((2006) ) Role of genes and environments for explaining Alzheimer disease. Arch Gen Psychiatry 63: , 168–174. |
[17] | Røysamb E , Tambs K ((2016) ) The beauty, logic and limitations of twin studies. Nor Epidemiol 26: , 35–46. |
[18] | Turkheimer E , Harden KP ((2014) ) Behavior genetic research methods: Testing quasi-causal hypotheses using multivariate twin data. In Handbook of Research Methods in Personality and Social Psychology, Reis HT, Judd CM, eds. Cambridge University Press, New York, NY, pp. 159–187. |
[19] | Pedersen NL , Christensen K , Dahl AK , Finkel D , Franz CE , Gatz M , Horwitz BN , Johansson B , Johnson W , Kremen WS , Lyons MJ , Malmberg B , McGue M , Neiderhiser JM , Petersen I , Reynolds CA ((2013) ) IGEMS: The consortium on Interplay of Genes and Environment across Multiple Studies. Twin Res Hum Genet 16: , 481–489. |
[20] | Pedersen NL , Gatz M , Finch BK , Finkel D , Butler DA , Dahl Aslan A , Franz CE , Kaprio J , Lapham S , McGue M , Mosing MA , Neiderhiser J , Nygaard M , Panizzon M , Prescott CA , Reynolds CA , Sachdev P , Whitfield KE ((2019) ) IGEMS: The Consortium on Interplay of Genes and Environment Across Multiple Studies - An Update. Twin Res Hum Genet 22: , 809–816. |
[21] | Gatz M , Fratiglioni L , Johansson B , Berg S , Mortimer JA , Reynolds CA , Fiske A , Pedersen NL ((2005) ) Complete ascertainment of dementia in the Swedish Twin Registry: The HARMONY study. Neurobiol Aging 26: , 439–447. |
[22] | Pedersen NL , McClearn GE , Plomin R , Nesselroade JR , Berg S , DeFaire U ((1991) ) The Swedish Adoption Twin Study of Aging: An update. Acta Genet Med Gemellol (Roma) 40: , 7–20. |
[23] | Gold CH , Malmberg B , McClearn GE , Pedersen NL , Berg S ((2002) ) Gender and health: A study of older unlike-sex twins. J Gerontol Soc Sci 57B: , S168–S176. |
[24] | McClearn GE , Johansson B , Berg S , Pedersen NL , Ahern F , Petrill SA , Plomin R ((1997) ) Substantial genetic influence on cognitive abilities in twins 80 or more years old. Science 276: , 1560–1563. |
[25] | Lichtenstein P , Sullivan PF , Cnattingius S , Gatz M , Johansson S , Carlström E , Björk C , Svartengren M , Wolk A , Klareskog L , de Faire U , Schalling M , Palmgren J , Pedersen NL ((2006) ) The Swedish Twin Registry in the third millennium: An update. Twin Res Hum Genet 9: , 875–882. |
[26] | McGue M , Christensen K ((2007) ) Social activity and healthy aging: A study of aging Danish twins. Twin Res Hum Genet 10: , 255–265. |
[27] | Pedersen DA , Larsen LA , Nygaard M , Mengel-From J , McGue M , Dalgård C , Hvidberg L , Hjelmborg J , Skytthe A , Holm N V. , Kyvik KO , Christensen K ((2019) ) The Danish Twin Registry: An updated overview. Twin Res Hum Genet 22: , 499–507. |
[28] | Sachdev PS , Lee T , Wen W , Ames D , Batouli AH , Bowden J , Brodaty H , Chong E , Crawford J , Kang K , Mather K , Lammel A , Slavin MJ , Thalamuthu A , Trollor J , Wright MJ ((2013) ) The contribution of twins to the study of cognitive ageing and dementia: The Older Australian Twins Study. Int Rev Psychiatry 25: , 738–747. |
[29] | Whitfield KE ((2013) ) A registry of adult African American twins: The Carolina African American Twin Study of Aging. Twin Res Hum Genet 16: , 476–480. |
[30] | Kendler KS , Heath AC , Neale MC , Kessler RC , Eaves LJ ((1992) ) A population-based twin study. J Am Med Association 268: , 1877–1882. |
[31] | Kremen WS , Franz CE , Lyons MJ ((2013) ) VETSA: The Vietnam Era Twin Study of Aging. Twin Res Hum Genet 16: , 399–402. |
[32] | Whitfield KE , Brandon DT , Wiggins S , Vogler G , McClearn G ((2003) ) Does intact pair status matter in the study of African American twins? The Carolina African American Twin Study of Aging. Exp Aging Res 29: , 407–423. |
[33] | Kessler RC , Gilman SE , Thornton LM , Kendler KS ((2004) ) Health, well-being, and social responsibility in the MIDUS twin and sibling subsamples. In How Healthy Are We? A National Study of Well-Being at Midlife, Brim OG, Ryff CD, Kessler RC, eds. The University of Chicago Press, Chicago, IL, pp. 124–152. |
[34] | Reynolds CA , Gatz M , Pedersen NL ((2002) ) Individual variation for cognitive decline: Quantitative methods for describing patterns of change. Psychol Aging 17: , 271–287. |
[35] | Cohen P , Cohen J , Aiken LS , West SG ((1999) ) The problem of units and the circumstance for POMP. Multivariate Behav Res 34: , 315–346. |
[36] | Rizzuto D , Feldman AL , Karlsson IK , Dahl Aslan AK , Gatz M , Pedersen NL ((2018) ) Detection of dementia cases in two Swedish health registers: A validation study. J Alzheimers Dis 61: , 1301–1310. |
[37] | Jin Y-P , Gatz M , Johansson B , Pedersen NL ((2004) ) Sensitivity and specificity of dementia coding in two Swedish disease registries. Neurology 63: , 739–741. |
[38] | Binder EF , Storandt M , Birge SJ ((1999) ) The relation between psychometric test performance and physical performance in older adults. J Gerontol A Biol Sci Med Sci 54: , 428–432. |
[39] | Loewenstein DA , Ownby R , Schram L , Acevedo A , Rubert M , Argüelles T ((2001) ) An evaluation of the NINCDS-ADRDA neuropsychological criteria for the assessment of Alzheimer’s disease: A confirmatory factor analysis of single versus multi-factor models. J Clin Exp Neuropsychol 23: , 274–284. |
[40] | Muthén LK , Muthén BO , (1998-2017) Mplus User’s Guide,Eighth edition. Muthén & Muthén, Los Angeles, CA. |
[41] | Enders CK ((2010) ) Applied Missing Data Analysis, Guilford Press, New York, NY. |
[42] | Mehta PD , West SG ((2000) ) Putting the individual back into individual growth curves. Psychol Methods 5: , 23–43. |
[43] | Taudorf L , Nørgaard A , Islamoska S , Jørgensen K , Laursen TM , Waldemar G ((2019) ) Declining incidence of dementia: A national registry-based study over 20 years. Alzheimers Dement 15: , 1383–1391. |
[44] | Hebert LE , Weuve J , Scherr PA , Evans DA ((2013) ) Alzheimer disease inthe United States (2010-2050) estimated using the 2010 census. Neurology 80: , 1778–1783. |
[45] | Plassman BL , Langa KM , Fisher GG , Heeringa SG , Weir DR , Ofstedal MB , Burke JR , Hurd MD , Potter GG , Rodgers WL , Steffens DC , Willis RJ , Wallace RB ((2007) ) Prevalence of dementia in the United States: The Aging, Demographics, and Memory Study. Neuroepidemiology 29: , 125–132. |
[46] | Phung TKT , Andersen BB , Høgh P , Kessing LV , Mortensen PB , Waldemar G ((2007) ) Validity of dementia diagnoses in the Danish hospital registers. Dement Geriatr Cogn Disord 24: , 220–228. |
[47] | Royall DR , Palmer RF ((2012) ) Getting past “g”: Testing a new model of dementing processes in dementia. J Neuropsychiatry Clin Neurosci 24: , 37–46. |
[48] | Jack CR , Bennett DA , Blennow K , Carrillo MC , Dunn B , Haeberlein SB , Holtzman DM , Jagust W , Jessen F , Karlawish J , Liu E , Molinuevo JL , Montine T , Phelps C , Rankin KP , Rowe CC , Scheltens P , Siemers E , Snyder HM , Sperling R , Elliott C , Masliah E , Ryan L , Silverberg N ((2018) ) NIA-AA Research Framework: Toward a biological definition of Alzheimer’s disease. Alzheimers Dement 14: , 535–562. |
[49] | Gatz M , Fiske A , Reynolds CA , Wetherell JL , Johansson B , Pedersen NL ((2003) ) Sex differences in genetic risk for dementia. Behav Genet 33: , 95–105. |


