
Plasma Neurofilament Light Chain and Clinical Diagnosis in Frontotemporal Dementia Syndromes
Abstract
Background:
Frontotemporal dementia (FTD) syndromes, mimics, phenocopy (phFTD), and slowly progressive behavioral variant FTD (bvFTD) can be difficult to distinguish clinically. Biomarkers such as neurofilament light chain (NfL) may be helpful.
Objective:
To study plasma NfL levels in people with FTD syndromes and determine if plasma NfL can distinguish between FTD syndromes and phFTD.
Methods:
Plasma NfL levels were estimated using both Simoa® Quanterix HD-X™ and SR-X™ machines grouped via final diagnosis after investigation and review.
Results:
Fifty participants were studied: bvFTD = 20, semantic variant FTD (svFTD) = 11, non-fluent variant FTD (nfvFTD) = 9, FTD with motor neuron disease (MND) = 4, phFTD = 2, slow progressors = 3, FTD mimic = 1, mean age 67.2 (SD 8.4) years. NfL levels were significantly higher in the FTD group compared to phenocopy group (p = 0.003). Median NfL (IQR) pg/mL was comparable in the FTD syndromes: bvFTD 41.10 (50.72), svFTD 44.38 (16.61), and nfvFTD 42.61 (22.93), highest in FTD with MND 79.67 (45.32) and lowest in both phFTD 13.99 (0.79) and slow progressors 17.97 (3.62).
Conclusion:
Plasma NfL appears to differentiate FTD syndromes and mimics. However, a lower NfL may predict a slower, but not necessarily absence of neurodegeneration, and therefore appears limited in distinguishing slow progressors from FTD phenocopies. Larger numbers of patients from all clinical groups are required to strengthen diagnostic utility.
INTRODUCTION
The diagnosis of frontotemporal dementia (FTD) syndromes can be challenging, especially in the earliest stages. There is a compelling need for reliable, acceptable, and accessible biomarkers which can improve the accuracy of diagnosis and provide information about prognosis [1]. We have previously reported a delay to diagnosis of 5 to 7 years from the time of first FTD symptom [2]. Delays to diagnosis and diagnostic uncertainty have caused harm to patients and caregivers, impeding access to appropriate medical support and increase patient and carer stress [3].
Several subtypes or variants of FTD have been described with different but overlapping features [4, 5]. All can present with behavioral changes noted by loved ones. The most frequent subtype, behavioral variant FTD (bvFTD), is most notable for early changes in behavior, social conduct, and personality [4]. Non-fluent variant FTD (nfvFTD) is associated with progressive deficits in motor speech production and grammar, and semantic variant FTD (svFTD) presents with progressive deficits in semantic knowledge and naming. Motor neuron disease can affect patients with FTD (FTD-MND) [6]. Furthermore, patients with an initial diagnosis of FTD can develop atypical parkinsonism, such as progressive supranuclear palsy (PSP) (akinetic-rigid parkinsonism and vertical gaze paresis) and cortico-basal degeneration (CBD) (asymmetrical parkinsonism, apraxia and cortical sensory loss) [7, 8].
Some patients present with very subtle changes in behavior on the background of pre-existing personality features, raising the possibility of bvFTD. Differentiating bvFTD from a subgroup of patients, termed here as bvFTD phenocopies (phFTD), is very difficult and often not possible on first consultation. FTD phenocopies are regarded as having clinical features often indistinguishable to bvFTD but have a non-progressive course and do not progress to dementia [9–11]. Although there remains controversy regarding the phenocopy syndrome, their features are usually ascribed to late onset psychiatric or personality disorder [12, 13]. Differentiating the two syndromes can be difficult in the absence of compelling neuroimaging findings or genetic confirmation, limiting prognostic information accessible to patients and families when faced with these syndromes.
In contrast to phFTD, some people with bvFTD have very slowly progressive syndromes, denoted here as ‘slow progressors’. Although these individuals demonstrate neurodegeneration on neuroimaging and a progressive course, they appear to have milder functional impairment and a survival in excess of the estimated mean survival in bvFTD of 6–8 years from symptom onset [11, 14]. Very slowly progressive bvFTD has been described in association with the hexanucleotide expansion in the C9orf72 gene [15, 16].
Neurofilament light chain (NfL) is an axon derived scaffolding protein in neurons, dendrites, and neuronal soma, which can be measured in plasma through advances in single-molecule array (Simoa®) technology [17]. Plasma NfL has been shown to correlate with disease progression and brain imaging findings as a measure of ongoing axonal injury [1, 18]. Researchers have demonstrated differences between blood NfL levels in healthy controls and FTD syndromes [1, 19–24]. However, the majority of studies have been in individuals with bvFTD [21], or pooled FTD syndromes in a single analysis [25], or examined its utility in predicting disease onset in genetic FTD [19, 20, 26, 27]. Rohrer and colleagues [22] found that disease severity correlated with NfL level by including both the 3 FTD syndromes and logopaenic variant primary progressive aphasia (lvPPA), which is usually regarded as a language onset AD [28–30]. They demonstrated a wide variability in NfL levels within each clinical group, with serum NfL levels of bvFTD overlapping with healthy controls [22]. Prior reports of variability in NfL levels may be due to the inclusion of people with phenocopy or slowly progressive FTD syndromes.
Previous studies have also largely been performed in highly selected research populations, using a single Simoa® machine to assay results [21, 22, 31], making it difficult to interpret in clinical settings where diverse machines may be used. Some researchers used enzyme-linked immunosorbent assays (ELISA) [23].
In this real-world exploratory study, we sought to evaluate plasma NfL levels in patients with a diagnosis of a possible FTD syndrome assessed at a tertiary specialty outpatient cognitive neurology service. We assessed inter-assay correlation between two Simoa® platforms (Quanterix SR-X™ and Quanterix HD-X™). We separated clinical FTD syndromes and compared plasma NfL between clinical groups, including phFTD and slow progressors who initially presented with a possible FTD diagnosis. We ypothesized that plasma NfL levels would show a high correlation between the two Simoa® platforms and be elevated in patients with clinically confirmed FTD syndromes compared to slow progressors or phFTD.
METHODS
Clinic setting
The Eastern Cognitive Disorders Clinic (ECDC) is a national tertiary-referral center for the diagnosis and management of cognitive disorders located at an Australian university hospital, Box Hill Hospital, Melbourne. ECDC clinicians have a particular interest in FTD syndromes and young onset dementias.
Standard protocol approvals, registrations, and patient consents
Approval for the study was obtained from the local ethics committee (HREC/16/EH/62) at Eastern Health. All participants and their legal caregivers were provided written consent. Participant recruitment and blood samples were taken between November 2016 and July 2018. Initial analyses were performed on Quanterix SR-X™ (January 2021, Sweden) and later on the Quanterix HD-X™ (May 2021, Melbourne).
Participants
We included participants with a diagnosis of the following FTD syndromes: bvFTD, svFTD, nfvFTD, and FTD-MND. Initial and final FTD diagnosis and specific clinical syndrome, including phFTD or slowly progressors, was made after clinical consensus conferences during multidisciplinary meetings involving 3 cognitive neurologists (AB, DD, CK), a speech pathologist (CL) and a clinical neuropsychologist (NR). Accepted consensus diagnostic criteria for bvFTD (Rascovsky’s [32]) and PPA (Gorno-Tempini [33]) were used. For patients with PPA, we included those with nfvFTD and svFTD, and excluded those with lvPPA. A diagnosis of definite FTD was made on post-mortem diagnosis where available or confirmed pathogenic genetic mutation. Note that genetic screening is not a standard part of our FTD work-up.
We used published definitions of FTD phenocopy [11, 34] and slowly progressive FTD. The latter remains somewhat diffusely defined, so, in conjunction with clinical parameters, a duration of disease in excess of 7.6 years was used to define slow progressors, based on a natural history study that suggested that this was the median survival in bvFTD patients when phFTD were excluded [11]. Participants with phFTD had to demonstrate the absence of neurodegeneration with no interval fronto-temporal atrophy or hypometabolism seen on MRI brain and FDG-PET respectively, and stable serial clinical and neuropsychology assessment over at least a period of 3 years per the current definitions [10]. We noted the development of parkinsonism, PSP or cortico-basal degeneration during follow-up to explore if higher NfL levels were associated with these additional clinical features. We collected duration of disease (defined as the time from first reported FTD symptom onset to NfL sample), duration of follow-up by our clinical service, MRI and FDG-PET findings, and Cambridge Behavioural Inventory (CBI), Mini-Mental State Examination (MMSE), and Addenbrooke Cognitive Examination-Revised (ACE-R) scores where available. NfL results were grouped with respect to the final diagnoses obtained after consensus conference.
Measurement of NfL concentrations
Fasting venous blood was taken in EDTA tubes. Plasma was processed via immediate centrifugation, and stored at –80°C, according to standardized procedures. The NfL assays were performed by two independent technicians (1 in each center) blinded to the clinical data.
Quanterix HD-X™ (Melbourne)
Plasma EDTA samples were thawed and centrifuged at 10,000 g for 5 min at room temperature. Plasma NfL was assayed using the HD-X Simoa® NF-light™ Advantage Kit (Quanterix Corporation, MA, USA) on the Simoa® HD-X™ Analyzer (Quanterix Corporation, MA, USA) according to the manufacturer’s instructions (mean limit of detection = 0.038 pg/mL). Briefly, assay calibrants provided in the kit were run neat in triplicates. Control samples and patient samples were diluted 1:4 and assayed in duplicates. The average intra-plate coefficient of variability (CV) was 5.05%. Four quality control (QC) samples were included in every plate. The average inter-plate CV of the QC samples was 5.58%.
Quanterix SR-X™ (Sweden)
Plasma NfL levels were measured using a Simoa® SR-X NF-Light Advantage Kit (Quanterix Corporation, MA, USA), a digital immunoassay (mean limit of detection = 0.0552 pg/mL), according to the manufacturer’s recommendations (Quanterix Corporation, Billerica, MA USA). All samples were diluted 1:4 in a sample diluent and analyzed in duplicates. The average intra-plate CV was 4.97%. Four QC samples were included in every plate. The average inter-plate CV of the QC samples was 6.59%.
Statistical analysis
Non-parametric tests were applied for all non-paired between-group analyses. The Wilcoxon rank sum test (Mann Whitney test) used to test differences between median NfL between two groups. A p value of <0.05 was regarded as significant. A Spearman correlation was used to evaluate correlation between results from the two laboratories (between the pilot research HD-X and SR-X platforms). A Bland-Altman analysis with logarithmic values was performed to evaluate the bias between the mean differences of the two assays.
The estimated optimal cut-off level for dichotomizing values for total FTD versus FTD phenocopy was selected by maximizing the Youden index. The receiver operating characteristics (ROC) curve was used to calculate the area under the curve (AUC) and plasma NfL cut-off for optimal sensitivity and specificity.
All statistical analysis was performed in the R programming language using RStudio (version 4.1.0) and boxplots were generated using the ggplot2 (version 3.3.5) package.
RESULTS
Participants
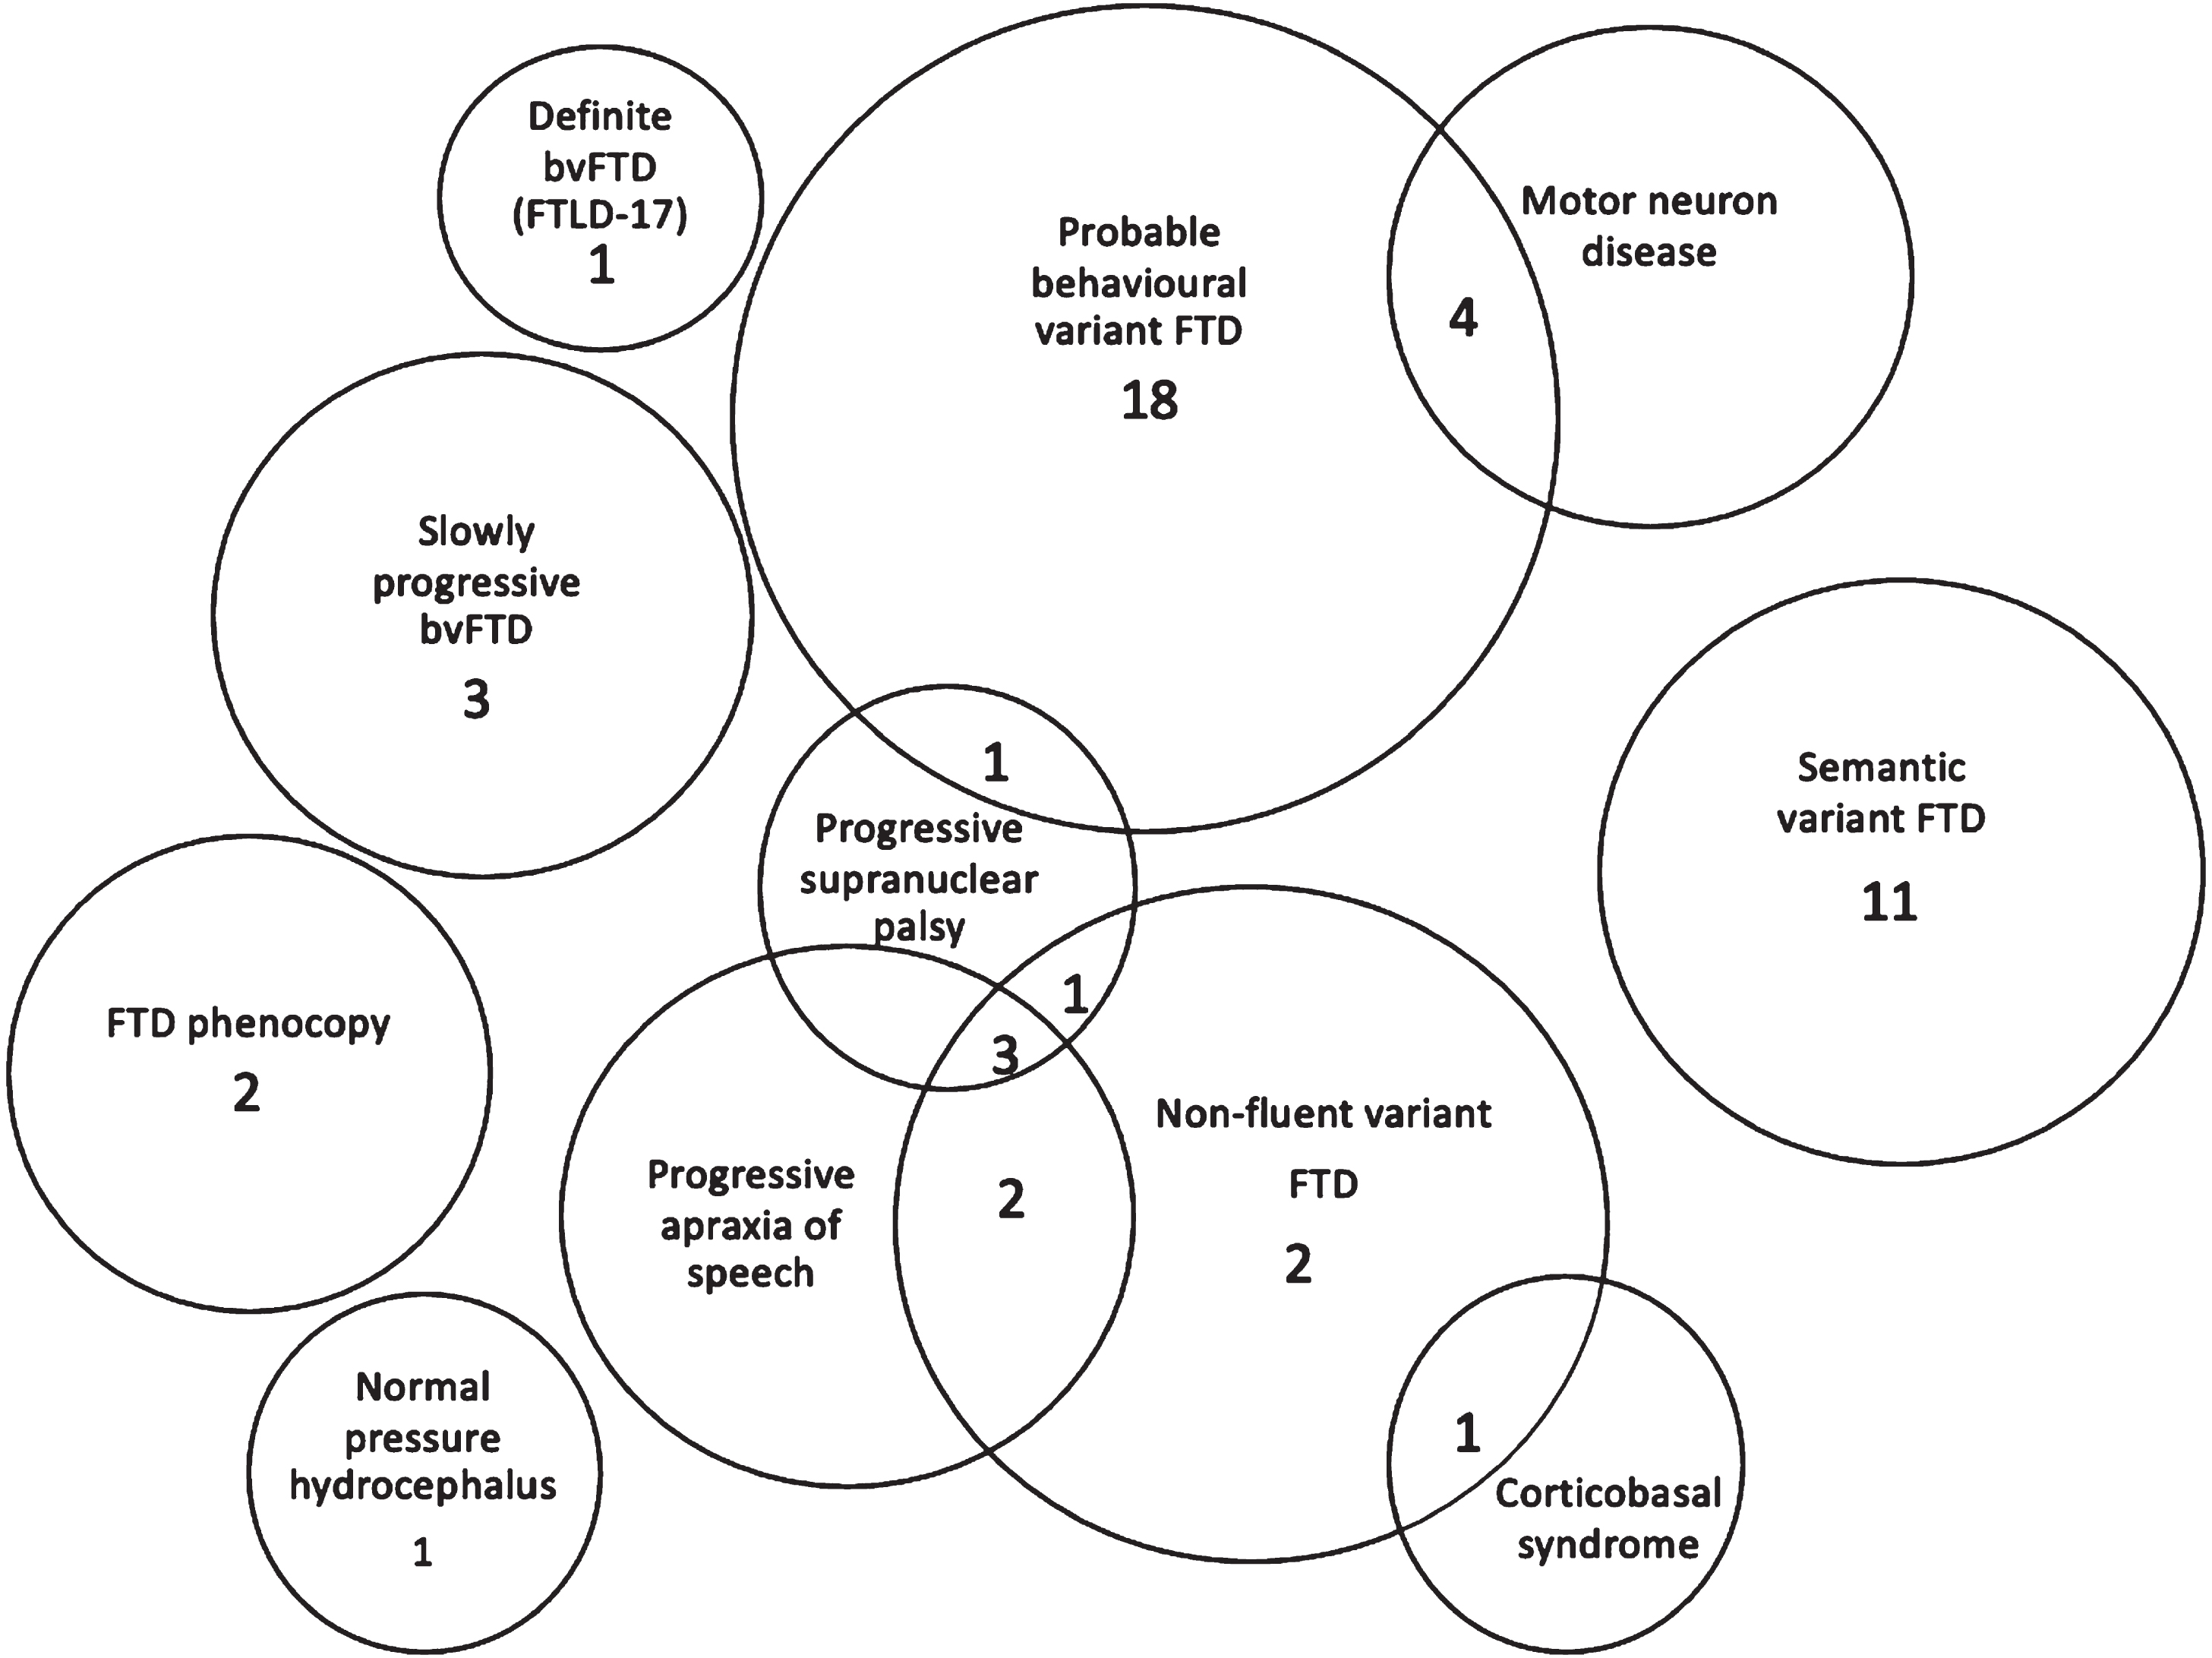
Fifty-one patients with an initial diagnosis of a FTD syndrome referred to ECDC were recruited and included in the SR-X™ analyses. One patient was excluded from the HD-X™ analyses as evaluable plasma was not available, leaving a total of 50 patients for HD-X™ and correlation analysis. One patient was a ‘FTD mimic’ and had a diagnosis of normal pressure hydrocephalus (NPH) made after investigation, with disproportionate and enlarged subarachnoid space hydrocephalus (DESH), leaving 20 patients with bvFTD, 4 with FTD-MND, 9 with nfvFTD, 11 with svFTD, 2 with phFTD, and 3 slowly progressive bvFTD.
Of the 50 patients analyzed, the mean age of patients at the time of first symptom onset was 62.3 (SD = 8.4) years, and the mean age at time of blood draw was 67.2 (8.4) years. Average follow-up duration was 3.6 (2.4) years. Thirty-four patients were men (68%). A summary of the demographics, median plasma NfL level obtained from HD-X™, duration of disease, follow-up, CBI, MMSE, and ACE-R scores for each FTD syndrome, mimic, phFTD and slow progressor is presented in Table 1. The final diagnosis is presented in Fig. 1.
Table 1
Summary of patient characteristics
| Total | FTD-MND | bvFTD | nfvFTD | svFTD | phFTD | Slowly progressive bvFTD | Normal pressure hydrocephalus (FTD mimic) | |
| Number | 50 | 4 | 20 | 9 | 11 | 2 | 3 | 1 |
| Mean age (SD), y | 67.2 (8.4) | 68.5 (16.2) | 65.5 (9.2) | 68.4 (6.7) | 68.4 (6.0) | 71.5 (6.36) | 67.7 (8.5) | 61 |
| Mean age onset (SD), y | 62.3 (8.4) | 66.0 (15.3) | 61.1 (8.8) | 64.7 (7.6) | 62.3 (5.8) | 62.5 (4.95) | 58.3 (10.0) | 55 |
| Male % | 68 | 50 | 81 | 66.7 | 45.5 | 50 | 100 | 100 |
| Disease duration, mean (SD), y | 5.0 (2.8) | 2.8 (1.3) | 4.2 (1.8) | 3.8 (2.4) | 6.1 (2.9) | 9.0 (1.4) | 9.7 (1.2) | 6 |
| Serum NfL, median (IQR), pg/mL | 79.67 (45.32) | 41.10 (50.72) | 42.61 (22.93) | 44.38 (16.61) | 13.99 (0.79) | 17.97 (3.62) | 30.8 | |
| Duration of follow-up, mean (SD), y | 3.6 (2.4) | 3.3 (1.7) | 4.4 (2.1) | 3.6 (1.3) | 4.2 (2.1) | 3.0 (2.8) | 9 (3.0) | 8 |
| CBI | NA | 85.8 (12.8) | 24.3 (14.7) | 26.3 (10.1) | 64 | NA | 72 | |
| CBI number | NA | 5 | 7 | 3 | 1 | NA | 1 | |
| ACE-R | NA | 71.0 (21.9) | 82.0 (7.6) | 70.4 (16.2) | 84 | 83 | 90 | |
| ACE-R number | NA | 12 | 4 | 7 | 1 | 1 | 1 | |
| MMSE | NA | 25.1 (3.7) | 28.0 (1.6) | 26.1 (3.2) | 27.0 (2.8) | 24.0 (1.4) | 28 | |
| MMSE number | NA | 19 | 6 | 8 | 2 | 2 | 1 |
SD, standard deviation; NfL, neurofilament light; IQR, interquartile range; CBI, Cambridge Behavioural Inventory; ACE-R, Addenbrooke’s Cognitive Examination-Revised; MMSE, Mini-Mental State Examination; FTD-MND, frontotemporal dementia with motor neuron disease; bvFTD, behavioral variant frontotemporal dementia; phFTD, frontotemporal dementia phenocopy; nfvFTD, non-fluent variant frontotemporal dementia; svFTD, semantic variant frontotemporal dementia.
Fig. 1
Final diagnosis. Numbers of patients (total 50) in each clinical group at final diagnosis. Patients with overlapping clinical features are also presented in Venn diagram. FTD, frontotemporal dementia; bvFTD, behavioral variant frontotemporal dementia; FTLD-17, frontotemporal degeneration with parkinsonism linked to chromosome 17.
Clinical syndrome
Definite and probable bvFTD
Nineteen participants had a final clinical diagnosis of probable bvFTD, and one patient had definite bvFTD and parkinsonism as confirmed by post-mortem finding of a 4-repeat tauopathy secondary to FTD with Parkinsonism linked to chromosome 17 (FTDP-17), due to MAPT gene mutation on chromosome 17 [35, 36]. All patients had confirmatory hypometabolism on FDG-PET imaging if available (n = 19, 95%). Sixteen of the 20 (90%) fulfilled the behavioral and cognitive symptoms of Rascovsky’s criteria for probable bvFTD at initial consultation, and 2 of these 16 were later reclassified as slow progressors after longitudinal follow-up. One patient with probable bvFTD developed PSP during follow-up.
Possible bvFTD and slow progressors
Of the 7 patients with possible bvFTD at initial consultation, 3 were reclassified as probable bvFTD and one patient had definite bvFTD. A further 3 patients were reclassified to slow progressor, NPH with DESH, and phFTD respectively. The three slow progressor patients have had a mean follow-up time of 9.0 (3.0) years and disease duration of 9.7 (1.2) years.
Fig. 2
A) Plasma neurofilament light in each diagnostic group. Median NfL is represented in the boxplot by the thick line. The 1st and 3rd quartiles are represented by the hinges. The lower and upper whiskers indicate the smallest and largest NfL value that are 1.5 times the interquartile range, respectively. NfL values beyond the end of the whiskers are plotted individually. P values using the Wilcoxon rank sum test between the median NfL for phFTD and each diagnostic group is shown. slow progressor, slowly progressive bvFTD; phFTD, frontotemporal dementia phenocopy; nfvFTD, non-fluent variant frontotemporal dementia; bvFTD, behavioral variant frontotemporal dementia; svFTD, semantic variant frontotemporal dementia; MND, motor neuron disease; NPH, normal pressure hydrocephalus.
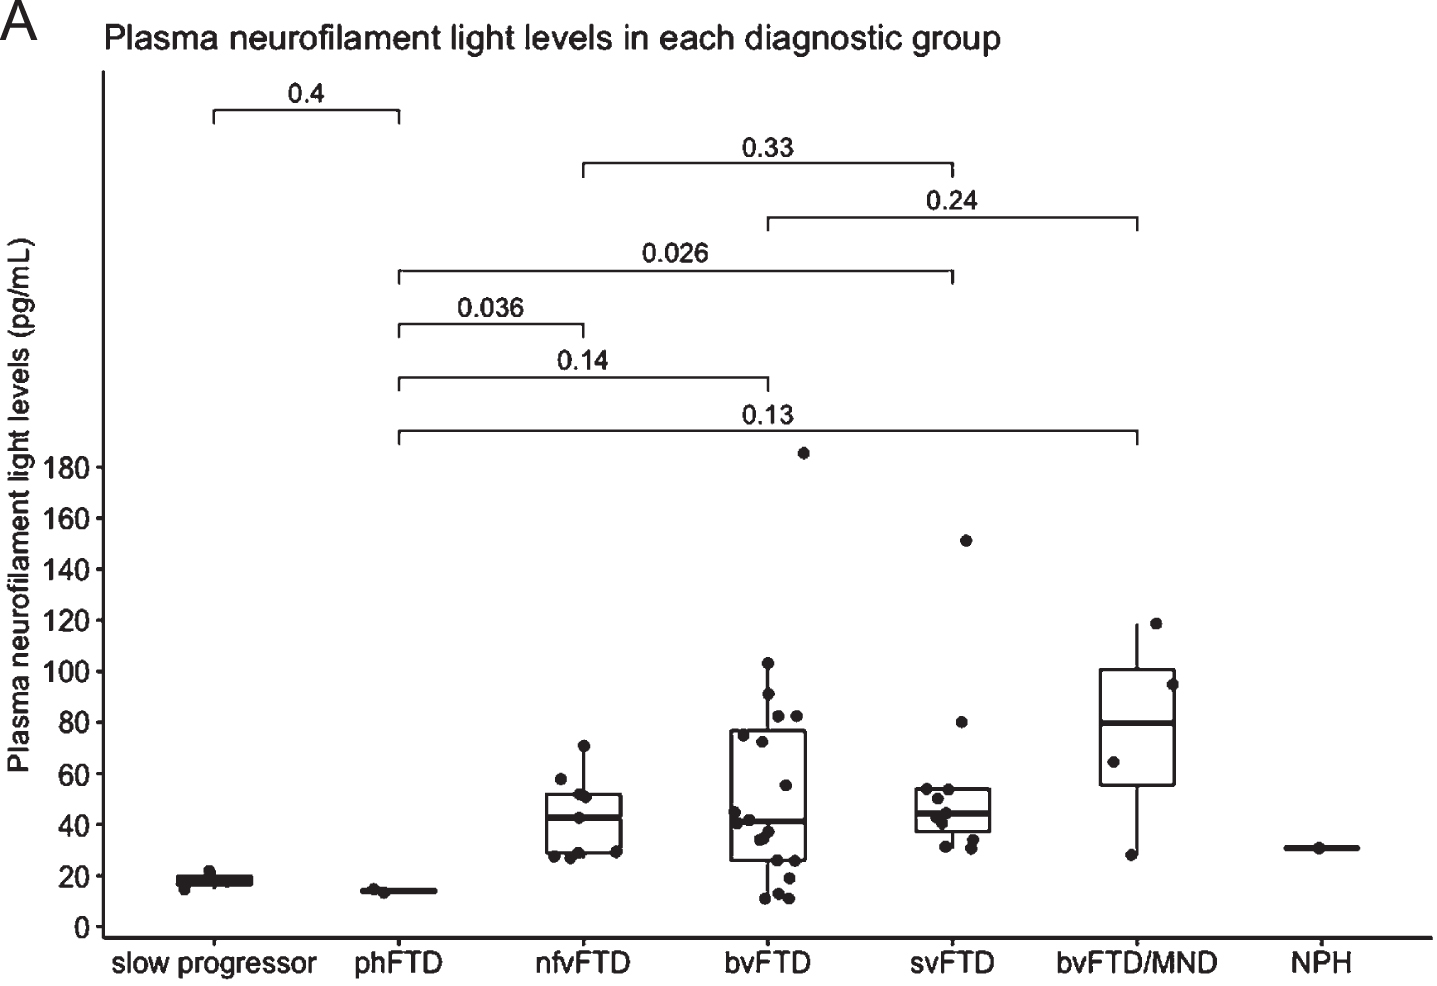
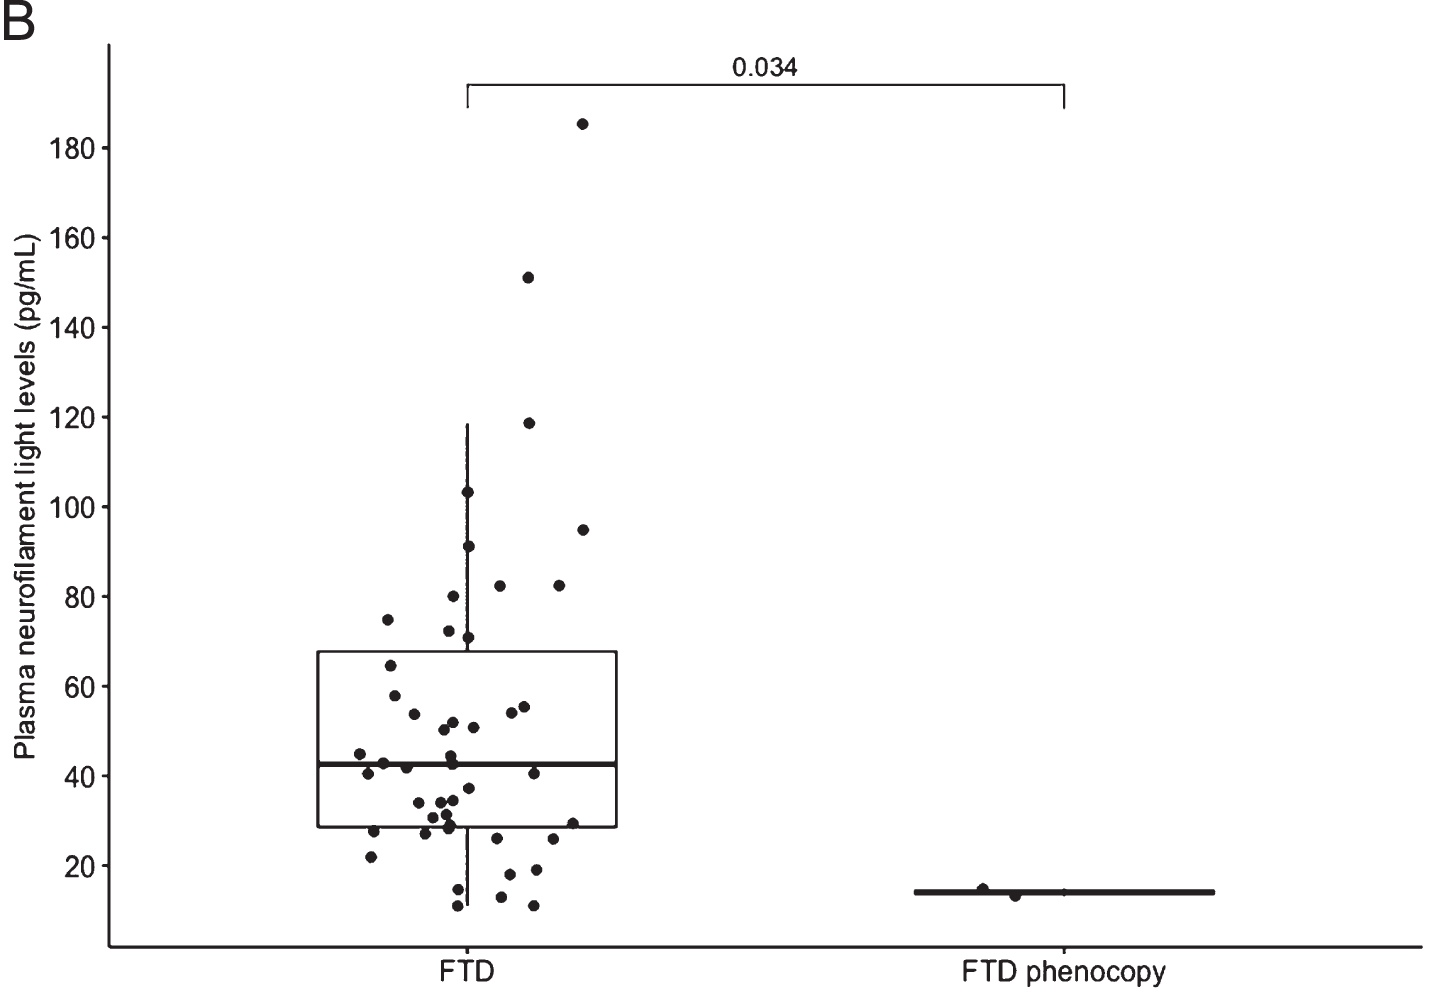
Fig. 2
B) Boxplot of all FTD versus FTD phenocopy. Median NfL is represented in the boxplot by the thick line. The 1st and 3rd quartiles are represented by the hinges. The upper and lower whiskers indicate the smallest and largest NfL value that are 1.5 times the interquartile range, respectively. NfL values beyond the end of the whiskers are plotted individually. The p value using the Wilcoxon rank sum test between the median NfL for FTD phenocopy and all FTD syndromes is shown. FTD, frontotemporal dementia
phFTD
Two patients had a final diagnosis of phFTD. One of these patients fulfilled Rascovsky’s criteria for possible bvFTD at initial visit but did not demonstrate clinical progression nor evidence of neurodegeneration on MRI and FDG-PET brain for 5 years. The second patient with phFTD also had features of behavioral changes without clinical progression.
FTD mimic
The patient with an initial diagnosis of possible bvFTD who had a final diagnosis of NPH with DESH [37] presented with significant behavior and executive deficits and a CBI of 72 (out of maximum score of 184), without the clinical triad described in NPH [38]. His FDG-PET scan revealed changes consistent with sulcal enlargement seen on his MRI brain. He was excluded from the exploratory cut-pointanalysis.
FTD-MND
Four participants had a clinically confirmed diagnosis of FTD-MND.
nfvFTD
Nine patients had nfvFTD as a final diagnosis; one of these patients was initially diagnosed with a primary progressive aphasia that could not be further subtyped due to the severity of symptoms at presentation. Five patients had concurrent progressive apraxia of speech (PAOS) at initial diagnosis; 4 patients developed PSP features, and 1 patient developed CBD features with cortical sensory loss during follow-up. One patient with nfvFTD has a post-mortem confirmation revealing TDP-43 inclusions (McKenzie type 1 [39]). No significant difference in NfL was found in nfvFTD patients with or without PSP features.
svFTD
Eleven participants had a diagnosis of svFTD. MRI imaging was available on 10 patients of whom 9 of 10 (90%) had left predominant anterior temporal lobe atrophy, and 1 of 10 (10%) had right temporal lobe variant FTD [40]. One patient with svFTD with a NfL of 151.08 pg/mL progressed to executive dysfunction within 2 years and severe prosopagnosia within 4 years of language symptom onset.
Disease duration and duration of follow-up
Mean duration of disease for all participants was 5.0 (2.8) years with a mean follow-up time of 3.6 (2.4) years. Patients with phFTD and slow progressors had the highest mean disease duration (9.0 (1.4) and 9.7 (1.2) years respectively) and mean duration of follow-up (3.0 (2.8) and 9.0 (3.0) years respectively).
Patients with svFTD had a longer mean duration of disease 6.1 (2.9) years, compared to bvFTD (4.2 (1.8) years) cohort (p = 0.05), without MND, and excluding the slow progressors, and a longer duration of follow-up (svFTD, mean 4.2 (2.1) years versus bvFTD 2.4 (2.1) years, p = 0.03).
Correlation of SR-X™ and HD-X™
Plasma NfL levels were not normally distributed, and values were log transformed. There was a significant correlation between testing platforms (r = 0.96, p < 0.0001). Bland Altman analysis obtained a Log bias of 0.14 (standard deviation 0.07, 95% limits of agreement 0.001 to 0.29). Inter-assay comparisons and Bland Altman plot of the NfL values derived from SR-X and HD-X plasma NfL can be found in Supplementary Figure 2.
Plasma NfL levels
Plasma NfL levels analysed using HD-X™ were highest in patients with FTD-MND, followed by svFTD and bvFTD patients. Levels of NfL were significantly higher in the total FTD group compared to phFTD (p = 0.003) and compared to the slow progressor group (p = 0.008), but small patient numbers were noted. Plasma NfL levels were also higher in bvFTD compared to phFTD group but did not reach statistical significance (p = 0.14) (see Table 1).
Lowest quartile: Twelve patients in the lowest quartile of plasma NfL (range 7.68–10.92 pg/mL) had mean disease duration of 6.7 (2.9) years; probable bvFTD (n = 6), slow progressors (n = 3), phFTD (n = 2) and nfvFTD (n = 1).
Highest quartile: Thirteen patients in the upper quartile of plasma NfL (range 64.54 to 185.37 pg/mL) had mean duration of disease of 4.0 (1.8) years; FTD-MND (n = 3), bvFTD (n = 7), svFTD (n = 2), and nfvFTD (n = 1). Within 12 months of NfL being taken, 8 of these patients were deceased and 1 patient had been transferred to a nursing home.
Exploration of clinical cut-point
The estimated optimal cut-point to distinguish FTD phenocopy from FTD was 16.38 pg/mL, with sensitivity of 91.5% and specificity of 100%, AUC 0.936 (CI 0.850, 1.001).
DISCUSSION
We found that plasma NfL levels were elevated in all clinical syndromes of FTD compared to previously published normal levels [21, 22]. We found excellent correlation and low bias of agreement of NfL between the SR-X™ and HD-X™ Quanterix analyzers, providing confidence in the validity of these results. Although assessment of intra-assay NfL variability has been performed in previous serum NfL studies [21, 22], the inter-assay validation methodology used in our study has not been described in previous blood NfL studies relating to FTD syndromes [20, 23, 25, 31].
Notwithstanding the small numbers in our groups, we demonstrated a highly significant difference in plasma NfL in all clinical subtypes of total FTD compared to patients with phFTD (p = 0.003). Our exploratory cut-point of 16.38 pg/mL had high sensitivity (91.5%) and specificity (100%) in distinguishing the phFTD from the FTD group. We found that a single plasma NfL assay demonstrated potential for distinguishing non-progressive behavioral changes (e.g., phFTD) from progressive neurodegenerative FTD syndromes.
In agreement with previous studies where higher serum NfL levels were correlated with faster frontal lobe atrophy rates [22], patients in our study with a higher plasma NfL demonstrated more rapid clinical progression. Also similar to previous studies, FTD-MND patients had the highest plasma NfL, perhaps reflecting the rate of destruction in motor neurons [31, 41, 42].
We found less variability in NfL levels in the svFTD cohort when compared to the probable bvFTD group, as well as longer duration of disease and greater duration of follow-up. While this may seem somewhat perplexing given the extent of atrophy and severity of impairments in most people with svFTD, there is evidence that a wave of neuroinflammation precedes atrophy, suggesting that the most rapid atrophy affecting the anterior temporal lobes has already passed by the time the person presents clinically [43, 44]. The duration of disease for patients with svFTD was consistent with prior natural history studies, in which clinical progression within 5 to 7 years after symptom onset was demonstrated [45].
Our subset of svFTD and nfvFTD patients all showed raised plasma NfL compared to our estimated cut-point, but there were no significant differences in mean plasma NfL between these PPA subtypes, similar to previous studies [21, 46]. It is possible that this is due to the relatively smaller regions or more focal neuronal degeneration despite heterogeneous neuropathologies [33].
Although 4 out of 9 (56%) of people with nfvFTD at initial diagnosis later developed PSP or CBD features, and 2 out of 20 (10%) patients with bvFTD developed parkinsonism and PSP respectively, no difference in NfL was found with or without these additional clinical features. Although it has been shown that mean plasma NfL levels in PSP patients without FTD are higher than controls [47, 48], it remains to be seen in larger patient populations if higher NfL levels herald the development of atypical parkinsonian features as a marker of more widespread progressive tau protein deposition [8, 49].
Importantly, our cut-off of 16.38 pg/mL using the HD-X was able to distinguish FTD phenocopy patients from those with FTD syndromes and is similar to these cut-points obtained in previous studies, despite assay differences. These prior studies also compared all FTD participants to healthy controls without cognitive or behavioral symptoms, or to people with primary psychiatric disorders. Two recent studies looked at the utility of serum NfL in distinguishing bvFTD from primary psychiatric disorders have found cut-points of 19.9 [25] (sensitivity 80%, specificity 65%) and 23.7 pg/mL (sensitivity 85% and specificity 78%) [50], respectively.
We speculate that NfL may be of adjunctive utility for patients presenting with cognitive and behavioral symptoms. A raised level above an agreed cut-point may increase diagnostic confidence in distinguishing between clinical syndromes that on first presentation may appear similar, such as bvFTD and FTD phenocopy, potentially reducing the duration of longitudinal follow-up that is traditionally required to ensure the absence of clinical progression. However, a lower NfL may predict a slower, but not necessarily the lack of, progression as reflected in the three patients with probable bvFTD who were ‘false negatives’ in our cohort using the cut-point of 16.38 pg/mL. Thus, NfL may demonstrate greater utility as a blood biomarker for prediction and prognosis, rather than distinguishing etiology or syndrome. Furthermore, it remains to be seen if NfL can be sufficiently sensitive to circumvent the need for extended longitudinal follow-up in clinical practice. This highlights the need to validate other biomarkers that may increase our understanding as to why bvFTD remains such a clinically heterogenous condition.
There are several limitations to our study. One major limitation was our small sample size, which limit the statistical reliability of the study, and also precluded multivariate logistic regression. Thus, the effect of comorbidities on NfL could not be considered, such as cerebrovascular disease. We acknowledge that this was an exploratory study to investigate the clinical utility of NfL in a real-world population. We did not include a healthy control group for comparison. We note that blood NfL has already been validated to distinguish healthy controls from FTD patients in previous larger studies. Our objectives were to both compare assays between Simoa platforms and explore differences in FTD subtypes in clinical populations, noting that healthy controls are not typically referred to a cognitive service.
Although postmortem pathological diagnosis was available in only two patients, the strengths of this study were in the accuracy of clinical diagnosis in all patients, carefully obtained via multidisciplinary consensus conferences and clinical follow-up. We were able to demonstrate a reclassification of diagnosis in between initial and final diagnosis at last review over a mean follow-up period of 3.6 (2.4) years.
In conclusion, plasma NfL appears to demonstrate preliminary diagnostic utility with higher levels in FTD-MND, bvFTD, and svFTD patients. We demonstrated that NfL levels were comparable when tested at different times on different machines. Plasma NfL was significantly higher in the total FTD group compared to the phFTD group but appears limited in distinguishing between phFTD and slow progressors who still harbor neurodegeneration. Larger numbers of patients from all clinical groups are required to strengthen diagnostic utility and to establish cut-points for each syndrome.
ACKNOWLEDGMENTS
D.D. received funding for this project from the Eastern Health foundation (Smarty Grant 2016).
Authors’ disclosures available online (https://www.j-alz.com/manuscript-disclosures/22-0272r2).
SUPPLEMENTARY MATERIAL
[1] The supplementary material is available in the electronic version of this article: https://dx.doi.org/10.3233/JAD-220272.
REFERENCES
[1] | Gaetani L , Blennow K , Calabresi P , Di Filippo M , Parnetti L , Zetterberg H ((2019) ) Neurofilament light chain as a biomarker in neurological disorders. J Neurol Neurosurg Psychiatry 90: , 870–881. |
[2] | Kyndt C (2018) The long and winding road: Journey from first symptom to diagnosis in probable frontotemporal dementia syndromes. International Conference for Frontotemporal Dementia, Sydney, Australia. |
[3] | Rogers K , Coleman H , Brodtmann A , Darby D , Anderson V ((2017) ) Family members’ experience of the pre-diagnostic phase of dementia: A synthesis of qualitative evidence. Int Psychogeriatr 29: , 1425–1437. |
[4] | Bang J , Spina S , Miller BL ((2018) ) Frontotemporal dementia. Lancet 386: , 1672–1682. |
[5] | Piguet O , Hornberger M , Mioshi E , Hodges JR ((2011) ) Behavioural-variant frontotemporal dementia: Diagnosis, clinical staging, and management. Lancet Neurol 10: , 162–172. |
[6] | Burrell JR , Halliday GM , Kril JJ , Ittner LM , Götz J , Kiernan MC , Hodges JR ((2016) ) The frontotemporal dementia-motor neuron disease continuum. Lancet 388: , 919–931. |
[7] | Levin J , Kurz A , Arzberger T , Giese A , Höglinger GU ((2016) ) The differential diagnosis and treatment of atypical parkinsonism. Dtsch Arztebl Int 113: , 61–69. |
[8] | Robinson JL , Yan N , Caswell C , Xie SX , Suh E , Van Deerlin VM , Gibbons G , Irwin DJ , Grossman M , Lee EB , Lee VM , Miller B , Trojanowski JQ ((2020) ) Primary tau pathology, not copathology, correlates with clinical symptoms in PSP and CBD. J Neuropathol Exp Neurol 79: , 296–304. |
[9] | Hodges JR ((2013) ) Alzheimer’s disease and the frontotemporal dementias: Contributions to clinico-pathological studies, diagnosis, and cognitive neuroscience. J Alzheimers Dis 33: (Suppl 1), S211–-S217. |
[10] | Valente ES , Caramelli P , Gambogi LB , Mariano LI , Guimarães HC , Teixeira AL , De Souza LC ((2019) ) Phenocopy syndrome of behavioral variant frontotemporal dementia: A systematic review. Alzheimers Res Ther 11: , 30. |
[11] | Garcin B , Lillo P , Hornberger M , Piguet O , Dawson K , Nestor PJ , Hodges JR ((2009) ) Determinants of survival in behavioral variant frontotemporal dementia. Neurology 73: , 1656–1661. |
[12] | Gossink FT , Dols A , Kerssens CJ , Krudop WA , Kerklaan BJ , Scheltens P , Stek ML , Pijnenburg YA ((2016) ) Psychiatric diagnoses underlying the phenocopy syndrome of behavioural variant frontotemporal dementia. J Neurol Neurosurg Psychiatry 87: , 64–68. |
[13] | Devenney E , Swinn T , Mioshi E , Hornberger M , Dawson KE , Mead S , Rowe JB , Hodges JR ((2018) ) The behavioural variant frontotemporal dementia phenocopy syndrome is a distinct entity - evidence from a longitudinal study. BMC Neurol 18: , 56. |
[14] | Brodtmann A , Cowie T , McLean C , Darby D ((2013) ) Phenocopy or variant: A longitudinal study of very slowly progressive frontotemporal dementia. BMJ Case Rep 2013: , bcr2012008077. |
[15] | Khan BK , Yokoyama JS , Takada LT , Sha SJ , Rutherford NJ , Fong JC , Karydas AM , Wu T , Ketelle RS , Baker MC , Hernandez M-D , Coppola G , Geschwind DH , Rademakers R , Lee SE , Rosen HJ , Rabinovici GD , Seeley WW , Rankin KP , Boxer AL , Miller BL ((2012) ) Atypical, slowly progressive behavioural variant frontotemporal dementia associated with C9ORF72 hexanucleotide expansion. J Neurol Neurosurg Psychiatry 83: , 358–364. |
[16] | Devenney E , Hornberger M , Irish M , Mioshi E , Burrell J , Tan R , Kiernan MC , Hodges JR ((2014) ) Frontotemporal dementia associated with the C9ORF72 mutation: A unique clinical profile. JAMA Neurol 71: , 331–339. |
[17] | Kuhle J , Barro C , Andreasson U , Derfuss T , Lindberg R , Sandelius Å , Liman V , Norgren N , Blennow K , Zetterberg H ((2016) ) Comparison of three analytical platforms for quantification of the neurofilament light chain in blood samples: ELISA, electrochemiluminescence immunoassay and Simoa. Clin Chem Lab Med 54: , 1655–1661. |
[18] | Benussi A , Karikari TK , Ashton N , Gazzina S , Premi E , Benussi L , Ghidoni R , Rodriguez JL , Emersič A , Simrén J , Binetti G , Fostinelli S , Giunta M , Gasparotti R , Zetterberg H , Blennow K , Borroni B ((2020) ) Diagnostic and prognostic value of serum NfL and p-Tau 181 in frontotemporal lobar degeneration. J Neurol Neurosurg Psychiatry 91: , 960–967. |
[19] | Meeter LH , Dopper EG , Jiskoot LC , Sanchez-Valle R , Graff C , Benussi L , Ghidoni R , Pijnenburg YA , Borroni B , Galimberti D , Laforce R Jr , Masellis M , Vandenberghe R , Ber IL , Otto M , van Minkelen R , Papma JM , Rombouts SA , Balasa M , Öijerstedt L , Jelic V , Dick KM , Cash DM , Harding SR , Jorge Cardoso M , Ourselin S , Rossor MN , Padovani A , Scarpini E , Fenoglio C , Tartaglia MC , Lamari F , Barro C , Kuhle J , Rohrer JD , Teunissen CE , van Swieten JC ((2016) )Neurofilament light chain: A biomarker for genetic frontotemporal dementia. Ann Clin Transl Neurol, 3: , 623–636. |
[20] | van der Ende EL , Meeter LH , Poos JM , Panman JL , Jiskoot LC , Dopper EGP , Papma JM , de Jong FJ , Verberk IMW , Teunissen C , Rizopoulos D , Heller C , Convery RS , Moore KM , Bocchetta M , Neason M , Cash DM , Borroni B , Galimberti D , Sanchez-Valle R , Laforce R , Moreno F , Synofzik M , Graff C , Masellis M , Carmela Tartaglia M , Rowe JB , Vandenberghe R , Finger E , Tagliavini F , de Mendonça A , Santana I , Butler C , Ducharme S , Gerhard A , Danek A , Levin J , Otto M , Frisoni GB , Cappa S , Pijnenburg YAL , Rohrer JD , van Swieten JC , Rossor MN , Warren JD , Fox NC , Woollacott IOC , Shafei R , Greaves C , Guerreiro R , Bras J , Thomas DL , Nicholas J , Mead S , van Minkelen R , Barandiaran M , Indakoetxea B , Gabilondo A , Tainta M , de Arriba M , Gorostidi A , Zulaica M , Villanua J , Diaz Z , Borrego-Ecija S , Olives J , Lladó A , Balasa M , Antonell A , Bargallo N , Premi E , Cosseddu M , Gazzina S , Padovani A , Gasparotti R , Archetti S , Black S , Mitchell S , Rogaeva E , Freedman M , Keren R , Tang-Wai D , Öijerstedt L , Andersson C , Jelic V , Thonberg H , Arighi A , Fenoglio C , Scarpini E , Fumagalli G , Cope T , Timberlake C , Rittman T , Shoesmith C , Bartha R , Rademakers R , Wilke C , Karnath H-O , Bender B , Bruffaerts R , Vandamme P , Vandenbulcke M , Ferreira CB , Miltenberger G , Maruta C , Verdelho A , Afonso S , Taipa R , Caroppo P , Di Fede G , Giaccone G , Prioni S , Redaelli V , Rossi G , Tiraboschi P , Duro D , Rosario Almeida M , Castelo-Branco M , João Leitão M , Tabuas-Pereira M , Santiago B , Gauthier S , Schonecker S , Semler E , Anderl-Straub S , Benussi L , Binetti G , Ghidoni R , Pievani M , Lombardi G , Nacmias B , Ferrari C , Bessi V ((2019) ) Serum neurofilament light chain in genetic frontotemporal dementia: A longitudinal, multicentre cohort study. Lancet Neurol 18: , 1103–1111. |
[21] | Steinacker P , Anderl-Straub S , Diehl-Schmid J , Semler E , Uttner I , Von Arnim CAF , Barthel H , Danek A , Fassbender K , Fliessbach K , Foerstl H , Grimmer T , Huppertz HJ , Jahn H , Kassubek J , Kornhuber J , Landwehrmeyer B , Lauer M , Maler JM , Mayer B , Oeckl P , Prudlo J , Schneider A , Volk AE , Wiltfang J , Schroeter ML , Ludolph AC , Otto M ((2018) ) Serum neurofilament light chain in behavioral variant frontotemporal dementia. Neurol 91: , E1390–E1401. |
[22] | Rohrer JD , Woollacott IOC , Dick KM , Brotherhood E , Gordon E , Fellows A , Toombs J , Druyeh R , Cardoso MJ , Ourselin S , Nicholas JM , Norgren N , Mead S , Andreasson U , Blennow K , Schott JM , Fox NC , Warren JD , Zetterberg H ((2016) ) Serum neurofilament light chain protein is a measure of disease intensity in frontotemporal dementia. Neurology 87: , 1329–1336. |
[23] | Wilke C , Preische O , Deuschle C , Roeben B , Apel A , Barro C , Maia L , Maetzler W , Kuhle J , Synofzik M ((2016) ) Neurofilament light chain in FTD is elevated not only in cerebrospinal fluid, but also in serum. J Neurol Neurosurg Psychiatry 87: , 1270. |
[24] | Forgrave LM , Ma M , Best JR , DeMarco ML ((2019) ) The diagnostic performance of neurofilament light chain in CSF and blood for Alzheimer’s disease, frontotemporal dementia, and amyotrophic lateral sclerosis: A systematic review and meta-analysis. Alzheimers Dement (Amst) 11: , 730–743. |
[25] | Katisko K , Cajanus A , Jääskeläinen O , Kontkanen A , Hartikainen P , Korhonen VE , Helisalmi S , Haapasalo A , Koivumaa-Honkanen H , Herukka SK , Remes AM , Solje E ((2020) ) Serum neurofilament light chain is a discriminative biomarker between frontotemporal lobar degeneration and primary psychiatric disorders. J Neurol 267: , 162–167. |
[26] | Silva-Spínola A , Lima M , Leitão MJ , Durães J , Tábuas-Pereira M , Almeida MR , Santana I , Baldeiras I ((2022) ) Serum neurofilament light chain as a surrogate of cognitive decline in sporadic and familial frontotemporal dementia. Eur J Neurol 29: , 36–46. |
[27] | Wilke C , Reich S , van Swieten JC , Borroni B , Sanchez-Valle R , Moreno F , Laforce R , Graff C , Galimberti D , Rowe JB , Masellis M , Tartaglia MC , Finger E , Vandenberghe R , de Mendonça A , Tagliavini F , Santana I , Ducharme S , Butler CR , Gerhard A , Levin J , Danek A , Otto M , Frisoni G , Ghidoni R , Sorbi S , Bocchetta M , Todd E , Kuhle J , Barro C , Rohrer JD , Synofzik M ((2022) ) Stratifying the presymptomatic phase of genetic frontotemporal dementia by serum NfL and pNfH: A longitudinal multicentre study. Ann Neurol 91: , 33–47. |
[28] | Mesulam M , Wicklund A , Johnson N , Rogalski E , Léger GC , Rademaker A , Weintraub S , Bigio EH ((2008) ) Alzheimer and frontotemporal pathology in subsets of primary progressive aphasia. Ann Neurol 63: , 709–719. |
[29] | Villain N , Dubois B ((2019) ) Alzheimer’s disease including focal presentations. Semin Neurol 39: , 213–226. |
[30] | Spinelli EG , Mandelli ML , Miller ZA , Santos-Santos MA , Wilson SM , Agosta F , Grinberg LT , Huang EJ , Trojanowski JQ , Meyer M , Henry ML , Comi G , Rabinovici G , Rosen HJ , Filippi M , Miller BL , Seeley WW , Gorno-Tempini ML ((2017) ) Typical and atypical pathology in primary progressive aphasia variants. Ann Neurol 81: , 430–443. |
[31] | Verde F , Steinacker P , Weishaupt JH , Kassubek J , Oeckl P , Halbgebauer S , Tumani H , von Arnim CAF , Dorst J , Feneberg E , Mayer B , Müller H-P , Gorges M , Rosenbohm A , Volk AE , Silani V , Ludolph AC , Otto M ((2019) ) Neurofilament light chain in serum for the diagnosis of amyotrophic lateral sclerosis. J Neurol Neurosurg Psychiatry 90: , 157–164. |
[32] | Rascovsky K , Grossman M ((2013) ) Clinical diagnostic criteria and classification controversies in frontotemporal lobar degeneration. Int Rev Psychiatry 25: , 145–158. |
[33] | Gorno-Tempini ML , Hillis AE , Weintraub S , Kertesz A , Mendez M , Cappa SF , Ogar JM , Rohrer JD , Black S , Boeve BF , Manes F , Dronkers NF , Vandenberghe R , Rascovsky K , Patterson K , Miller BL , Knopman DS , Hodges JR , Mesulam MM , Grossman M ((2011) ) Classification of primary progressive aphasia and its variants. Neurology 76: , 1006–1014. |
[34] | Kipps CM , Hodges JR , Hornberger M ((2010) ) Nonprogressive behavioural frontotemporal dementia: Recent developments and clinical implications of the ‘bvFTD phenocopy syndrome’. Curr Opin Neurol 23: , 628–632. |
[35] | Siuda J , Fujioka S , Wszolek ZK ((2014) ) Parkinsonian syndrome in familial frontotemporal dementia. Parkinsonism Relat Disord 20: , 957–964. |
[36] | Baizabal-Carvallo JF , Jankovic J ((2016) ) Parkinsonism, movement disorders and genetics in frontotemporal dementia. Nat Rev Neurol 12: , 175–185. |
[37] | Graff-Radford NR , Jones DT ((2019) ) Normal pressure hydrocephalus. Continuum (Minneap Minn) 25: , 165–186. |
[38] | Bräutigam K , Vakis A , Tsitsipanis C ((2019) ) Pathogenesis of idiopathic normal pressure hydrocephalus: A review of knowledge. J Clin Neurosci 61: , 10–13. |
[39] | Mackenzie IRA , Neumann M , Baborie A , Sampathu DM , Du Plessis D , Jaros E , Perry RH , Trojanowski JQ , Mann DMA , Lee VMY ((2011) ) A harmonized classification system for FTLD-TDP pathology. Acta Neuropathol 122: , 111–113. |
[40] | Ulugut Erkoyun H , Groot C , Heilbron R , Nelissen A , van Rossum J , Jutten R , Koene T , van der Flier WM , Wattjes MP , Scheltens P , Ossenkoppele R , Barkhof F , Pijnenburg Y ((2020) ) A clinical-radiological framework of the right temporal variant of frontotemporal dementia. Brain 143: , 2831–2843. |
[41] | Gaiani A , Martinelli I , Bello L , Querin G , Puthenparampil M , Ruggero S , Toffanin E , Cagnin A , Briani C , Pegoraro E , Sorarù G ((2017) ) Diagnostic and prognostic biomarkers in amyotrophic lateral sclerosis: Neurofilament light chain levels in definite subtypes of disease. JAMA Neurol 74: , 525–532. |
[42] | Delaby C , Alcolea D , Carmona-Iragui M , Illán-Gala I , Morenas-Rodríguez E , Barroeta I , Altuna M , Estellés T , Santos-Santos M , Turon-Sans J , Muñoz L , Ribosa-Nogué R , Sala-Matavera I , Sánchez-Saudinos B , Subirana A , Videla L , Benejam B , Sirisi S , Lehmann S , Belbin O , Clarimon J , Blesa R , Pagonabarraga J , Rojas-Garcia R , Fortea J , Lleó A ((2020) ) Differential levels of neurofilament light protein in cerebrospinal fluid in patients with a wide range of neurodegenerative disorders. Sci Rep 10: , 9161. |
[43] | Bright F , Chan G , van Hummel A , Ittner LM , Ke YD ((2021) ) TDP-43 and inflammation: Implications for amyotrophic lateral sclerosis and frontotemporal dementia. Int J Mol Sci 22: , 7781. |
[44] | Bevan-Jones WR , Cope TE , Jones PS , Kaalund SS , Passamonti L , Allinson K , Green O , Hong YT , Fryer TD , Arnold R , Coles JP , Aigbirhio FI , Larner AJ , Patterson K , O’Brien JT , Rowe JB ((2020) ) Neuroinflammation and protein aggregation co-localize across the frontotemporal dementia spectrum. Brain 143: , 1010–1026. |
[45] | Seeley WW , Bauer AM , Miller BL , Gorno-Tempini ML , Kramer JH , Weiner M , Rosen HJ ((2005) ) The natural history of temporal variant frontotemporal dementia. Neurology 64: , 1384–1390. |
[46] | Matías-Guiu JA , Gómez-Pinedo U , Forero L , Pytel V , Cano F , Moreno-Ramos T , Cabrera-Martín MN , Matías-Guiu J , González-Rosa JJ ((2019) ) Plasma neurofilament light chain in primary progressive aphasia and related disorders: Clinical significance and metabolic correlates. J Alzheimers Dis 72: , 773–782. |
[47] | Rojas JC , Karydas A , Bang J , Tsai RM , Blennow K , Liman V , Kramer JH , Rosen H , Miller BL , Zetterberg H , Boxer AL ((2016) ) Plasma neurofilament light chain predicts progression in progressive supranuclear palsy. Ann Clin Transl Neurol 3: , 216–225. |
[48] | Chouliaras L , Thomas A , Malpetti M , Donaghy P , Kane J , Mak E , Savulich G , Prats-Sedano MA , Heslegrave AJ , Zetterberg H , Su L , Rowe JB , O’Brien JT ((2022) ) Differential levels of plasma biomarkers of neurodegeneration in Lewy body dementia, Alzheimer’s disease, frontotemporal dementia and progressive supranuclear palsy. J Neurol Neurosurg Psychiatry 93: , 651–658. |
[49] | Josephs KA ((2006) ) Clinicopathological and imaging correlates of progressive aphasia and apraxia of speech. Brain 129: , 1385–1398. |
[50] | Al Shweiki MHDR , Steinacker P , Oeckl P , Hengerer B , Danek A , Fassbender K , Diehl-Schmid J , Jahn H , Anderl-Straub S , Ludolph AC , Schönfeldt-Lecuona C , Otto M ((2019) ) Neurofilament light chain as a blood biomarker to differentiate psychiatric disorders from behavioural variant frontotemporal dementia. J Psychiatric Res 113: , 137–140. |


