
Diagnostic Accuracy of the Swedish Version of the Rowland Universal Dementia Assessment Scale (RUDAS-S) for Multicultural Cognitive Screening in Swedish Memory Clinics
Abstract
Background:
The number of people with a migration background and dementia is increasing in Europe. All patients with suspected dementia have the right to an appropriate cognitive assessment and correct diagnosis for optimal treatment and support. Rowland Universal Dementia Assessment Scale (RUDAS) cognitive screening instrument is less affected by language, culture, and educational background, and adapted for use in multicultural populations.
Objective:
To compare the diagnostic accuracy of RUDAS-S to the Swedish version of Mini-Mental State Examination (MMSE-SR) for detecting dementia in a multicultural group of outpatients in Swedish memory clinics.
Methods:
We tested 123 outpatients (36 nonnative Swedish), in 4 memory clinics in Southern Sweden with RUDAS-S to supplement the usual cognitive assessment.
Results:
RUDAS-S had moderate to good diagnostic performance for detecting dementia in a multicultural population in Sweden, with an area under the receiver operating characteristic curve (AUC) of 0.81. At a cutoff score <25 its sensitivity was 0.92, specificity 0.60, and accuracy 76%. The AUC for the MMSE-SR was 0.79. At a cutoff score <23 its sensitivity was 0.65, specificity 0.81, and accuracy 73%.
Conclusion:
RUDAS-S is at least as accurate as MMSE-SR for detecting dementia in memory clinics in Sweden and can be used for all patients undergoing a cognitive assessment, irrespective of their cultural, language, and educational background. However, there is a need for other cross-cultural cognitive tests to complement RUDAS-S to extend cognitive examination.
INTRODUCTION
Worldwide, every third second, there is a new case of dementia. More than 131 million people are expected to live with dementia in 2050 [1]. An increase in the number of older immigrants in Europe is also expected, which means an expected increased number of people with dementia in this group [2–4]. In 2021, 20% of Sweden’s population was registered with another country of birth and most of this group are from countries outside of Europe [5]. The top 15 countries were Syria, Iraq, Finland, Poland, Iran, Somalia, Afghanistan, former Yugoslavia, Bosnia and Herzegovina, Turkey, Germany, Eritrea, India, Thailand, and Norway [5]. Thus, the need for valid methods for the assessment of cognitive function in people with diverse backgrounds is becoming increasingly important [6].
Challenges
Dementia is a clinical diagnosis, and the assessment includes physical, neurological, and psychiatric examinations, laboratory tests of blood and cerebrospinal fluid, brain imaging, cognitive tests, and interviews of relatives [7]. There are challenges for early and reliable diagnosis in people with a migration background. These challenges may be due to, for example, language barriers, cultural differences, and the use of conventional cognitive tests [4, 8]. Most neuropsychological tests used during the cognitive assessment are developed in western populations. These tests are influenced by culture, language, (quality of) education, and literacy [9–12].
The most widely used cognitive screening instrument in Europe, the Mini-Mental State Examination (MMSE) [13], was developed in USA and is widely used in the European context [14]. MMSE is reliable and valid for testing cognition [13], but test results are influenced by age and education [15], language, and cultural background [16] and is therefore less suitable for use in multicultural populations.
Today, several neuropsychological tests have been studied in culturally, educationally, and linguistically diverse populations in Europe, for example the Rowland Universal Dementia Assessment Scale (RUDAS) [17], the European Cross-Cultural Neuropsychological Test Battery (CNTB) [18, 19], and the Multicultural Cognitive Examination (MCE) [20]. However, there is still a lack of cross-culturally validated cognitive screening tests in Europe [6].
Possibilities
RUDAS [21], developed in Australia, is an efficient test with strong dementia psychometric properties, which was specifically developed for use with people from diverse linguistic and cultural backgrounds [22]. The test is considered to have good accuracy for detecting dementia in various socioeconomic and educational settings, even for those without any formal education [16, 22]. The test can be used in different languages without any adjustment or changes in the test [16, 21]. Since 2017, RUDAS has been recommended in Sweden for cognitive assessment of patients with a mother tongue other than Swedish, or shorter schooling [7]. The RUDAS test results are less affected by language, culture, and education than several other conventional cognitive screening instruments used to detect dementia [16]. The RUDAS is validated in populations from several high-, low-, and middle-income countries, with various languages, cultures, and educational backgrounds [16, 23, 24].
Aim
Patients with a migration background are at risk of misdiagnosis [3, 25–27]. Underdiagnosis, overdiagnosis, or misdiagnosis of dementia can lead to consequences for the patient and their relatives. Development and availability of cross-cultural cognitive screening instruments as well as awareness and knowledge in cross-cultural assessment are desirable and necessary [6].
The aim of the present study was to compare the Swedish version of RUDAS (RUDAS-S) and MMSE-SR test scores and their diagnostics accuracy in nonnative Swedish (NNS), and native Swedish (NS) patients, in Swedish memory clinics.
MATERIALS AND METHODS
Study participants and procedure
Clinical data and test results were collected from outpatients in 4 hospital-based memory clinics, Hässleholm, Malmö, Ystad, and Ängelholm in Southern Sweden. All patients referred to the memory clinics during the period 2018–2019 to assess their cognitive impairment were invited to participate in the study through an informative letter that was sent to them with the invitation to the planned clinical visit. Referrals were mainly from primary care but also in some cases from psychiatric and other specialist clinics. Participating clinics started at different timepoints depending on what their clinic allowed and had agreed on recruiting about 30 patients each. No exclusion criteria for participation were formulated for the study so that everyone who could and wanted to join, had the opportunity to participate in the study. Translated study information and consent forms were available to patients who had not mastered reading in Swedish. The translations were made by translation agencies. Oral and written study information was given to the patients at the visit. The patients were included in the study after written consent.
Formal interpreters were available to all NNS patients on a need’s basis. All interpreters came from the procured interpreting agency. The majority of NNS patients in the study were assessed with an interpreter but 12 patients were not, due to their ability to speak Swedish or preferring help from a relative. Of these 12 patients, 4 originated from another Nordic country, 5 from a non-Nordic European country, one from an Asian country, and 2 from a South American country (Table 1).
Table 1
Country of birth, World Bank Group’s country classification, years in Sweden and use of interpreter in the study
| Country of birth | World Bank Group’s country classification | Years in Sweden | Interpreter | |
| 1 | Belarus | Upper middle income | 25 | Yes |
| 2 | Bosnia | Upper middle income | 22 | No |
| 3 | Bosnia | Upper middle income | 24 | No |
| 4 | Bosnia | Upper middle income | 25 | Yes |
| 5 | Bosnia | Upper middle income | 23 | Yes |
| 6 | Brazil | Upper middle income | 10 | No |
| 7 | Cameroon | Lower middle income | 1 | Yes |
| 8 | Chile | High income | 35 | No |
| 9 | Chile | High income | 42 | Yes |
| 10 | Colombia | Upper middle income | 26 | Yes |
| 11 | Denmark | High income | 53 | No |
| 12 | Denmark | High income | 33 | No |
| 13 | Denmark | High income | – | No |
| 14 | Eritrea | Low income | 35 | Yes |
| 15 | Finland | High income | – | No |
| 16 | Former Yugoslavia | Upper middle income | 22 | Yes |
| 17 | Former Yugoslavia | Upper middle income | 55 | No |
| 18 | Iran | Lower middle income | 33 | Yes |
| 19 | Iran | Lower middle income | 34 | Yes |
| 20 | Iran | Lower middle income | 30 | Yes |
| 21 | Iraq | Upper middle income | 8 | Yes |
| 22 | Iraq | Upper middle income | – | Yes |
| 23 | Kosovo | Upper middle income | 25 | Yes |
| 24 | Kosovo | Upper middle income | 19 | Yes |
| 25 | Kosovo | Upper middle income | 27 | Yes |
| 26 | Lebanon | Upper middle income | 14 | Yes |
| 27 | Macedonia | Upper middle income | 47 | Yes |
| 28 | Norway | High income | – | No |
| 29 | Palestine | Lower middle income | 30 | Yes |
| 30 | Poland | High income | 29 | No |
| 31 | Poland | High income | 30 | No |
| 32 | Poland | High income | 23 | Yes |
| 33 | Poland | High income | 50 | Yes |
| 34 | Taiwan | Upper middle income | 52 | Yes |
| 35 | Thailand | Upper middle income | 18 | Yes |
| 36 | Thailand | Upper middle income | – | Yes |
The clinical diagnoses in the four participating memory clinics were based on physical, neurological, and psychiatric examinations, laboratory tests of blood, brain imaging, cognitive tests, and interviews with relatives according to the national guidelines and recommendations [7]. The cognitive tests included MMSE and Clock drawing test. Cube copying, cerebrospinal fluid was performed in some but not all patients. In the clinics, the diagnoses were made in a joint diagnosis round where several physicians and other healthcare personnel from the clinics participated.
In the present study, the Swedish version of the MMSE (MMSE-SR) and the Swedish version of the RUDAS (RUDAS-S) were used to assess cognitive impairment. The MMSE, which was used as a reference when assessing the diagnostic accuracy for dementia, gives a total score between 0 and 30 points, and includes orientation, attention and calculation, memory and memory recall, language, and figure copying [13]. The RUDAS gives a total score between 0 and 30 points, and includes memory and memory recall, visuospatial orientation (body orientation), praxis, visuoconstructional drawing, judgment, and language [21].
The Functional Assessment Questionnaire (FAQ) [28] was used to assess instrumental activities of daily living (IADL), with a range of 0 to 30 points. A score of ≥9 points, or dependence in 3 or more activities, was used to indicate impaired IADL. The 20-item Swedish version of the Geriatric Depression Scale (GDS-20) was used to screen for depression using the cutoff ≥6 points for suspected depression [29].
All clinical diagnoses (including MCI) were classified according to the International Classification of Diseases (ICD-10) diagnostic system [30], or specifically expressed in the medical records (e.g., dementia with Lewy bodies) in all the participating multidisciplinary specialist memory clinics.
All care staff at the memory clinics were trained in the administration of the RUDAS-S and interpreter-mediated cognitive assessment by the research group (authors 1 and 2) before the study. The nurses performed all cognitive tests. Tests that were part of the regular investigation were prioritized and performed before the RUDAS-S. Diagnoses were ultimately decided by the responsible physician. MMSE was included in the regular routine examination and was therefore known to the physician, who could also see the RUDAS-S results, but they were not used to interpret them.
Ethics
The present study was approved by the local ethics committee of Lund University (approval Nos. 2016/292 and 2018/109). Documented informed consent was obtained with a signature from all participating patients.
Statistical methods
Demographic and clinical characteristics of patients diagnosed with dementia and other patients were compared using descriptive statistics. To compare group means of continuous variables, a Student t test was used for normally distributed variables and a Mann–Whitney U test for nonnormally distributed variables and variables with uneven scaling properties.
To test the significance of differences in the distribution of categorical variables, a Fisher exact test or Pearson χ2 was used. Spearman correlations were used for correlation analyses (age, years of education, MMSE-SR, RUDAS-S, and FAQ). Binary logistic regression analyses for RUDAS-S and MMSE-SR were conducted to investigate the probability of dementia adjusted by age and years of education. Missing data in years of education were substituted by the use of multiple imputations (specifically, 5 consecutive imputations).
To compare the diagnostic accuracy of the RUDAS-S and MMSE-SR for dementia, receiver operating characteristic (ROC) curve analyses were used using the clinical diagnosis of dementia as the criterion standard. No other covariates were used. An area under the ROC curve (AUC) between 0.9 and 1.0 is considered excellent, and 0.8 to 0.9 Good, 0.7 to 0.8 fair, 0.6 to 0.7 poor, and 0.5 to 0.6 failed [31].
The Clinical Calculator 1 from the Vassar Stats website (www.vassarstats.net/clin1.html) was used to calculate sensitivity, specificity, positive predictive value (PPV), negative predictive value (NPV), likelihood ratio (LR)+ and LR–with 95% confidence interval (CI) at different cutoff points. All other analyses were performed with IBM SPSS Statistics for Windows (version 27; IBM Corp., Armonk, NY, USA). p < 0.05 was considered significant.
RESULTS
Participants
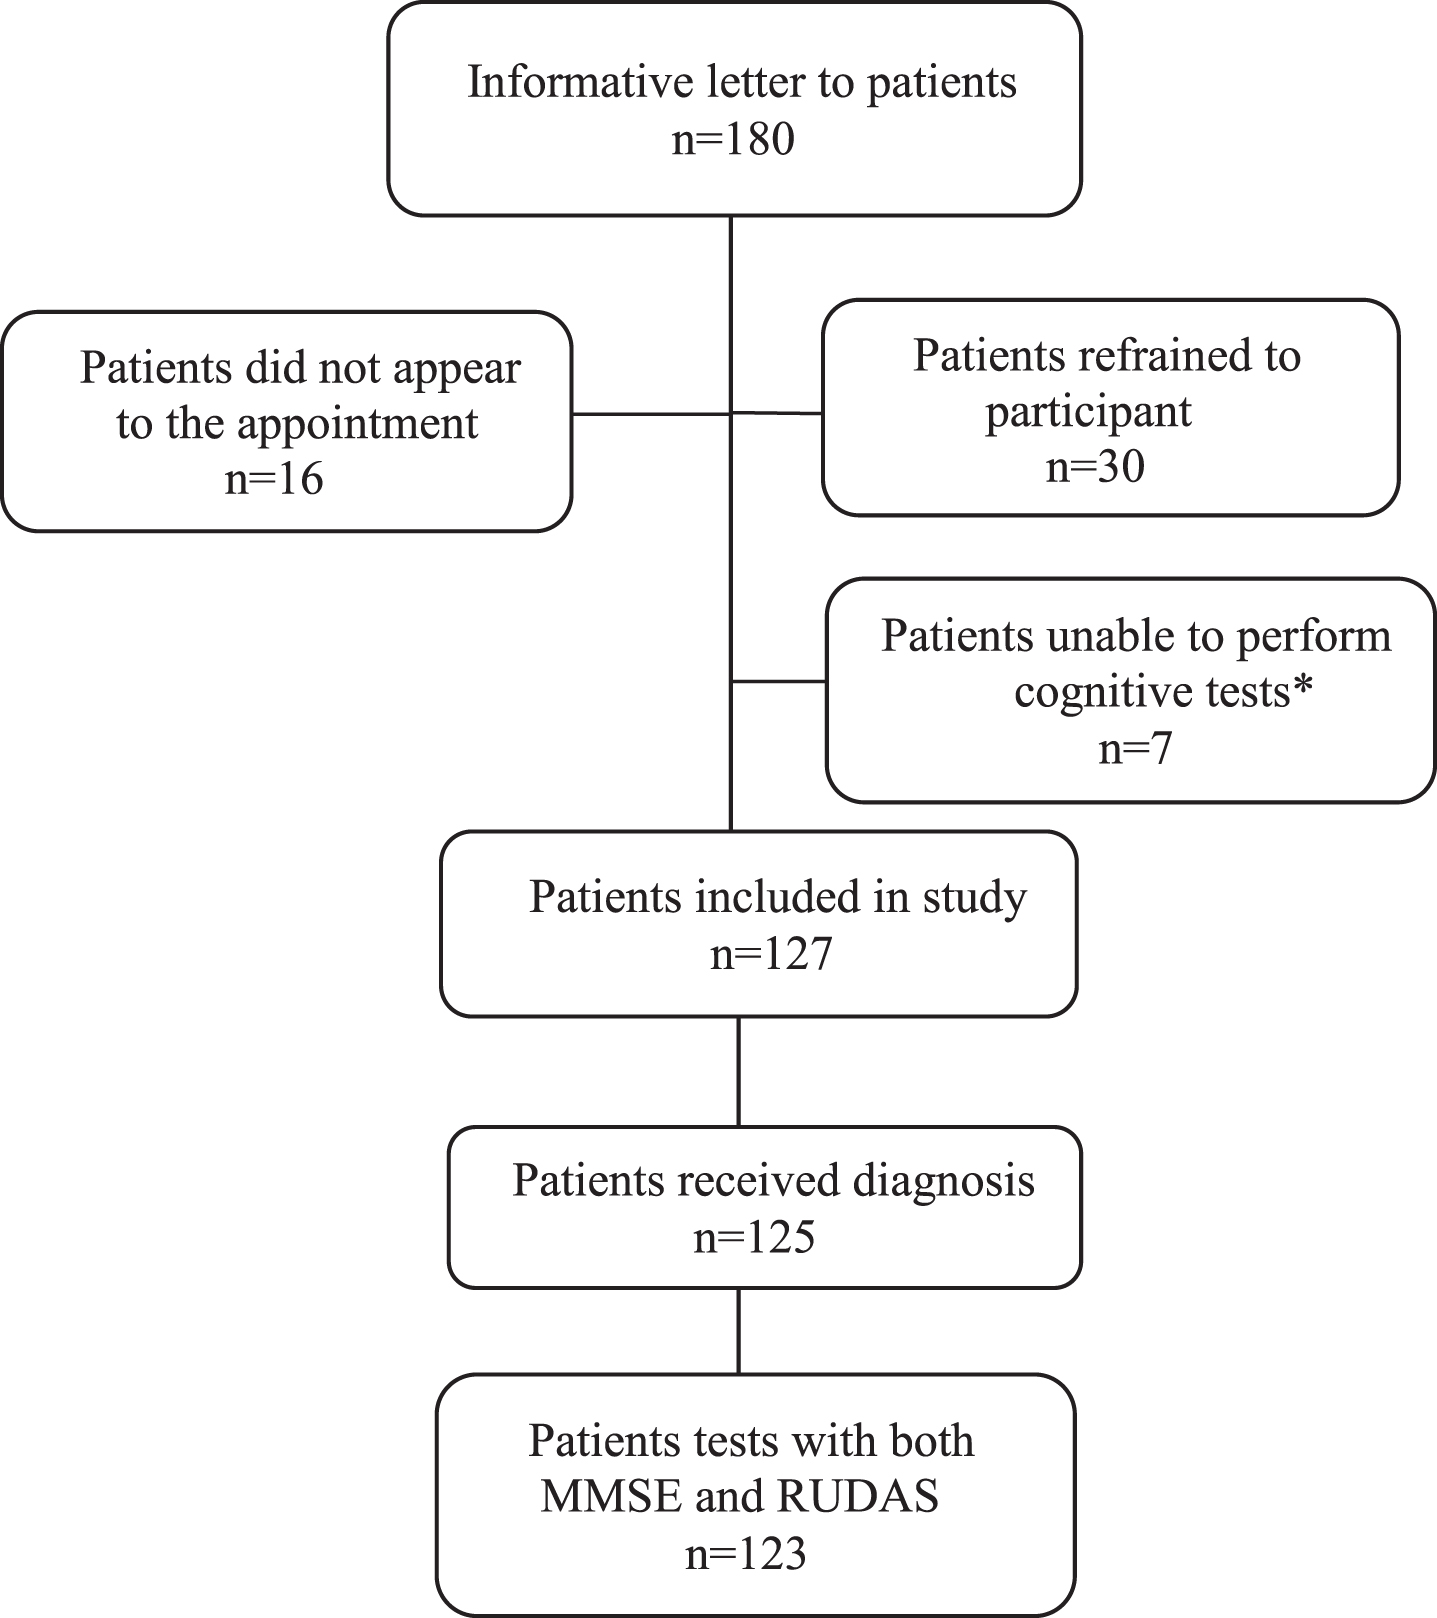
A total of 180 patients received information letters and were invited to participate in the study from the respective clinics. In all, 127 patients were included in the study (Fig. 1). Of these, one did not complete the assessment program, one did not receive a diagnosis until almost 2 years after the assessment, and 2 did not complete both cognitive tests, leaving a final sample of 123 patients for the ROC analyses. Thirty-six (28%) were NNS: 5 originated from another Nordic country, 7 from a Middle Eastern country, 3 from an Asian country, 15 from a non-Nordic European country, 4 from a South American country, and 2 from an African country. The number of years living in Sweden varied between 1–55 years, with a mean of 32 and a median of 27 years (n = 31)(Table 1).
Fig. 1
Flowchart of the participants. *Due to severe cognitive impairment or too advanced disease.
The NNS group was classified by the origin country level socioeconomic position according to the World Bank Group’s country classification. Eleven were classified as high, 19 as upper middle, 5 as lower middle, and 1 as low-income level (Table 1).
Diagnoses
Totally 63 patients were diagnosed with dementia: 15 patients with Alzheimer’s disease, 21 with mixed Alzheimer’s and vascular dementia, 10 with vascular dementia, 2 with Lewy body dementia, 2 with Parkinson’s dementia, and 5 with frontotemporal dementia. Also 8 patients were diagnosed with nonspecific dementia, including one patient with normal-pressure hydrocephalus.
A dementia diagnosis was not given to 62 patients: 13 patients were diagnosed with subjective cognitive impairment (SCI), 35 with mild cognitive impairment (MCI), 3 were diagnosed with depression, 1 with posttraumatic stress disorder (PTSD), 6 with burnout syndrome, 1 with fibromyalgia, and 3 with a neurological disorder: 1 with dysphasia and 2 with parkinsonism.
Demographics/subject characteristics
There were no statistical differences in age comparing NNS and NS patients, or sex (Table 2). NNS patients had significantly fewer years of education (9.2±4.1, range, 1–17 versus 11.2±3.6, range, 6–20, U = 884.5, p = 0.025).
Table 2
Demographic and clinical characteristics of the patient sample
| Characteristic | NNS | NS | p |
| n = 36 | n = 91 | ||
| Age, y (Mean±SD) | 70.5±12.9 | 70.8±12.0 | 0.91a |
| Female (%) | 63.9% | 50.5% | 0.24b |
| Years of education, n = 108 | |||
| Mean±SD | 9.2±4.1 | 11.2±3.6 | 0.025c |
| Min–max | 1–17 | 6–20 | |
| Dementia diagnosis (%) | 21(58.3%) | 42(47.2%) | 0.32b |
| RUDAS-S, n = 123 | |||
| Mean±SD | 22.6±4.7 | 22.6±4.6 | 0.854c |
| Min–max | 15–30 | 12–30 | |
| MMSE-SR, n = 125 | |||
| Mean±SD | 19.1±5.5 | 24.6±5.2 | <0.001c |
| Min–max | 4–29 | 10–30 |
n, number; NNS, nonnative Swedish; NS, native Swedish; RUDAS-S, Swedish version of the Rowland Universal Dementia Assessment Scale; MMSE-SR, Swedish version of the Mini-Mental State Examination. a Student t test; bChi-square test; cMann–Whitney U.
Mean MMSE-SR score was significantly lower in the NNS patients than in the NS patients, but mean RUDAS-S score did not differ between the NNS patients and the NS patients. Scores of FAQ (14.1±8.0 versus 11.6±8.0, U = 747.5, p = 0.197) and GDS (6.0±4.7 versus 5.2±4.1, U = 815.5, p = 0.454) did not differ between the NNS and NS groups (Table 2). The prevalence of dementia diagnoses did not differ between NNS and NS patients (χ2 = 1.27, p = 0.32). The characteristics of the patients with and without a clinical dementia diagnosis are presented in Table 3.
Table 3
Demographic and clinical characteristics of the patient with dementia or other diagnoses
| Characteristic | Dementia | Other diagnoses* | p |
| n = 63 | n = 62 | ||
| Age, y (Mean±SD) | 77.0±6.6 | 64.4±13.2 | <0.001a |
| Female (%) | 57% | 50% | 0.43b |
| Years of education, n = 108 | |||
| Mean±SD | 10.0±3.8 | 11.4±3.8 | 0.05a |
| Min–max | 1–20 | 1–20 | |
| NNS patients (%) | 58% | 42% | 0.26b |
| NS patients (%) | 47% | 53% | |
| RUDAS-S, n = 123 | |||
| Mean±SD | 20.2±3.9 | 25.0±3.9 | <0.001c |
| Min–max | 12–28 | 15–30 | |
| MMSE-SR, n = 125 | <0.001c | ||
| Mean±SD | 19.9±6.1 | 25.9±4.0 | |
| Min–max | 4–30 | 16–30 | |
| FAQ, n = 114 | |||
| Mean±SD | 16.2±7.4 | 9.1±7.1 | <0.001c |
| Min–max | 0–29 | 0–28 | |
| GDS, n = 110 | |||
| Mean±SD | 4.4±3.4 | 5.9±4.5 | 0.090c |
| Min–max | 0–17 | 0–17 |
n, number; NNS, nonnative Swedish; NS, native Swedish; RUDAS-S, Swedish version of the Rowland Universal Dementia Assessment Scale; MMSE-SR, Swedish version of the Mini-Mental State Examination; FAQ, Functional Assessment Questionnaire; GDS, Geriatric Depression Scale. aStudent t test; bChi-square test; cMann–Whitney U. *SCI, MCI, posttraumatic stress disorder, burnout syndrome, fibromyalgia, and dysphasia, CVI with parkinsonism.
FAQ data were available for 94% of the NNS patients and 83% of the NS patients. As expected, significantly higher FAQ scores were found in the group with dementia (U = 753, p < 0.001). The prevalence of depression (GDS-20 ≥6 points) was higher in the group with other diagnoses than in those with dementia (46% versus 18%; Fisher’s exact test, p = 0.004). When we excluded patients with depression, burnout, and PTSD (n = 9) from the analysis, the difference remained significant (40% versus 18%; Fisher’s exact test, p = 0.018).
Scores for the RUDAS-S and the MMSE-SR were significantly lower in the group with dementia than the group with other diagnoses (Table 3).
Correlation
There was a significant correlation between the RUDAS-S and MMSE-SR scores (rs = 0.59, p < 0.001) when combining the 2 groups. There was also a significant correlation between the RUDAS-S score and age (rs = –0.45, p < 0.001), between the MMSE-SR score and age (rs = –0.28, p = 0.001), RUDAS-S score and years of education (rs = 0.22, p = 0.023), MMSE-SR score and years of education (rs = 0.46, p < 0.001), and between age and years of education (rs = –0.32, p = 0.001). A significant correlation was also identified between MMSE-SR and FAQ scores (rs = –0.48, p≤0.001), and for RUDAS-S and FAQ scores (rs = –0.41, p≤0.001).
Logistic regression
Logistic regression analyses for RUDAS-S and MMSE-SR are presented in Tables 4 and 5. In these regression models, the probability of a dementia diagnosis was, beside the RUDAS-S and MMSE-SR, only significantly affected by age.
Table 4
Logistic regression analysis for the diagnosis of dementia; RUDAS-S (n = 123)
| Variable | PE | SE | p | OR (95% CI) |
| RUDAS-S | –0.23 | 0.063 | <0.001 | 0.79 (0.70–0.90) |
| Age | 0.10 | 0.029 | <0.001 | 1.11 (1.05–1.17) |
| Years of education | –0.02 | 0.062 | 0.79 | 0.98 (0.87–1.11) |
RUDAS-S, Swedish version of Rowland Universal Dementia Assessment Scale; PE, parameter estimate; SE, standard error; OR, odds ratio; CI, confidence interval.
Table 5
Logistic regression analysis for the diagnosis of dementia; MMSE-SR (n = 125)
| Variable | PE | SE | p | OR (95% CI) |
| MMSE-SR | –0.24 | 0.055 | <0.001 | 0.79 (0.71–0.88) |
| Age | 0.13 | 0.030 | <0.001 | 1.14 (1.07–1.20) |
| Years of education | 0.072 | 0.067 | 0.28 | 1.07(0.94–1.23) |
MMSE-SR, Swedish version of Mini-Mental State Examination; PE, parameter estimate; SE, standard error; OR, odds ratio; CI, confidence interval.
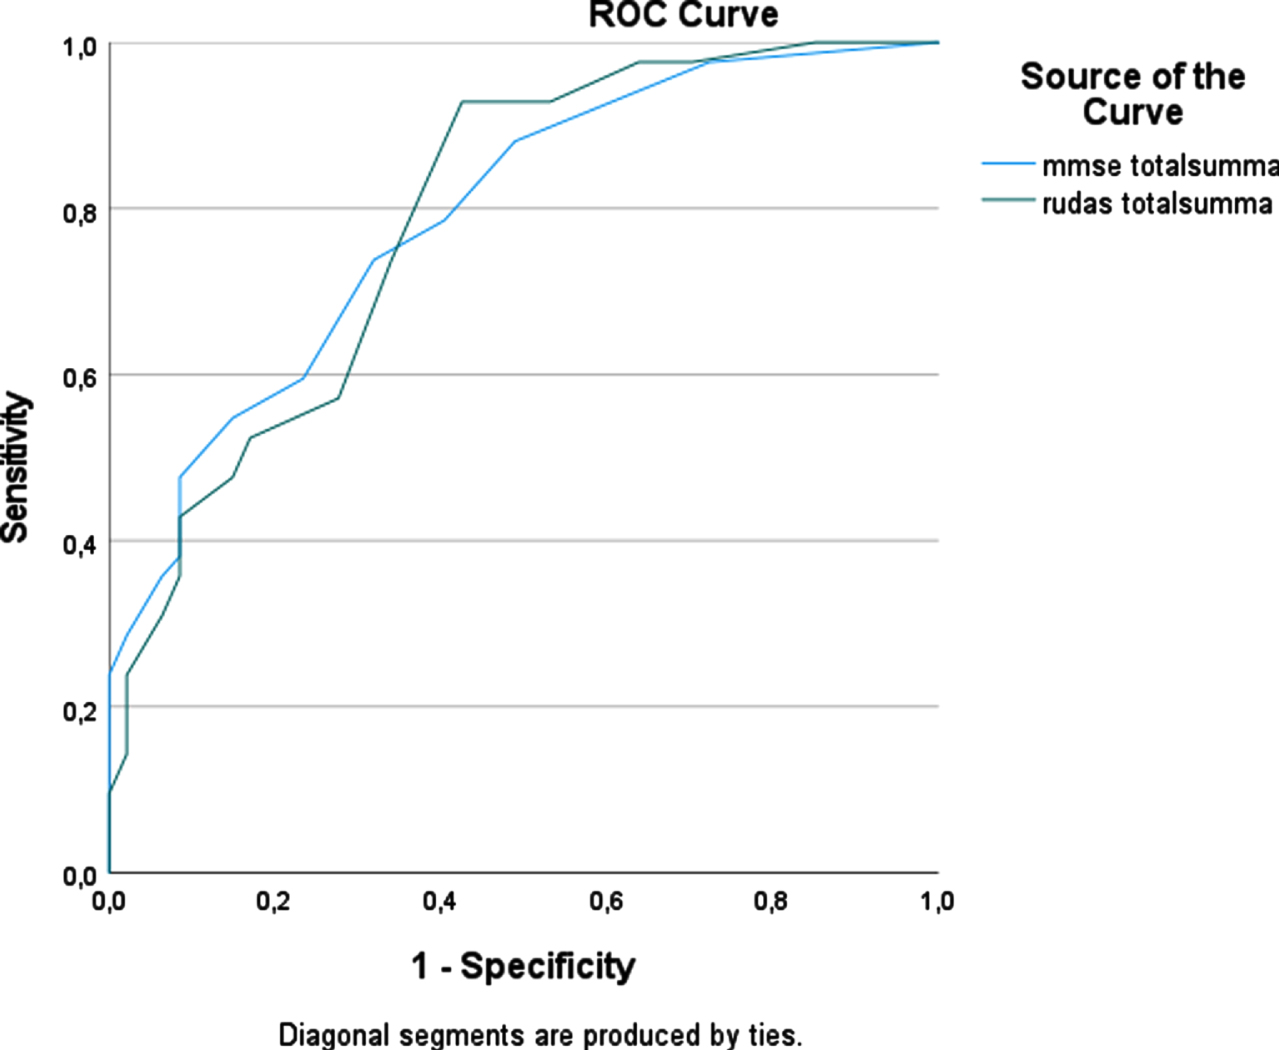
To compare the accuracy of diagnostic tests for dementia, ROC curve analyses were used (Fig. 2). The AUC for the RUDAS-S was 0.81 (95% CI 0.73–0.88) and for the MMSE-SR 0.79 (95% CI 0.71–0.87), which indicates that both tests could discriminate with good accuracy between groups of dementia patients and other patients. ROC curve analyses were also used for the NNS and NS groups separately. In the NNS group the AUC for RUDAS-S was 0.86 (95% CI 0.72–0.99) and for the MMSE-SR was 0.84 (95% CI 0.71–0.97) (Fig. 3). In the NS group the AUC for RUDAS-S was 0.79 (95% CI 0.70–0.88) and for the MMSE-SR was 0.79 (95% CI 0.70–0.88) (Fig. 4). AUC for age alone predicting dementia was 0.79 (95% CI 0.71–0.87).
Fig. 2
ROC curve for the RUDAS-S and the MMSE-SR (n = 123) for detecting dementia.
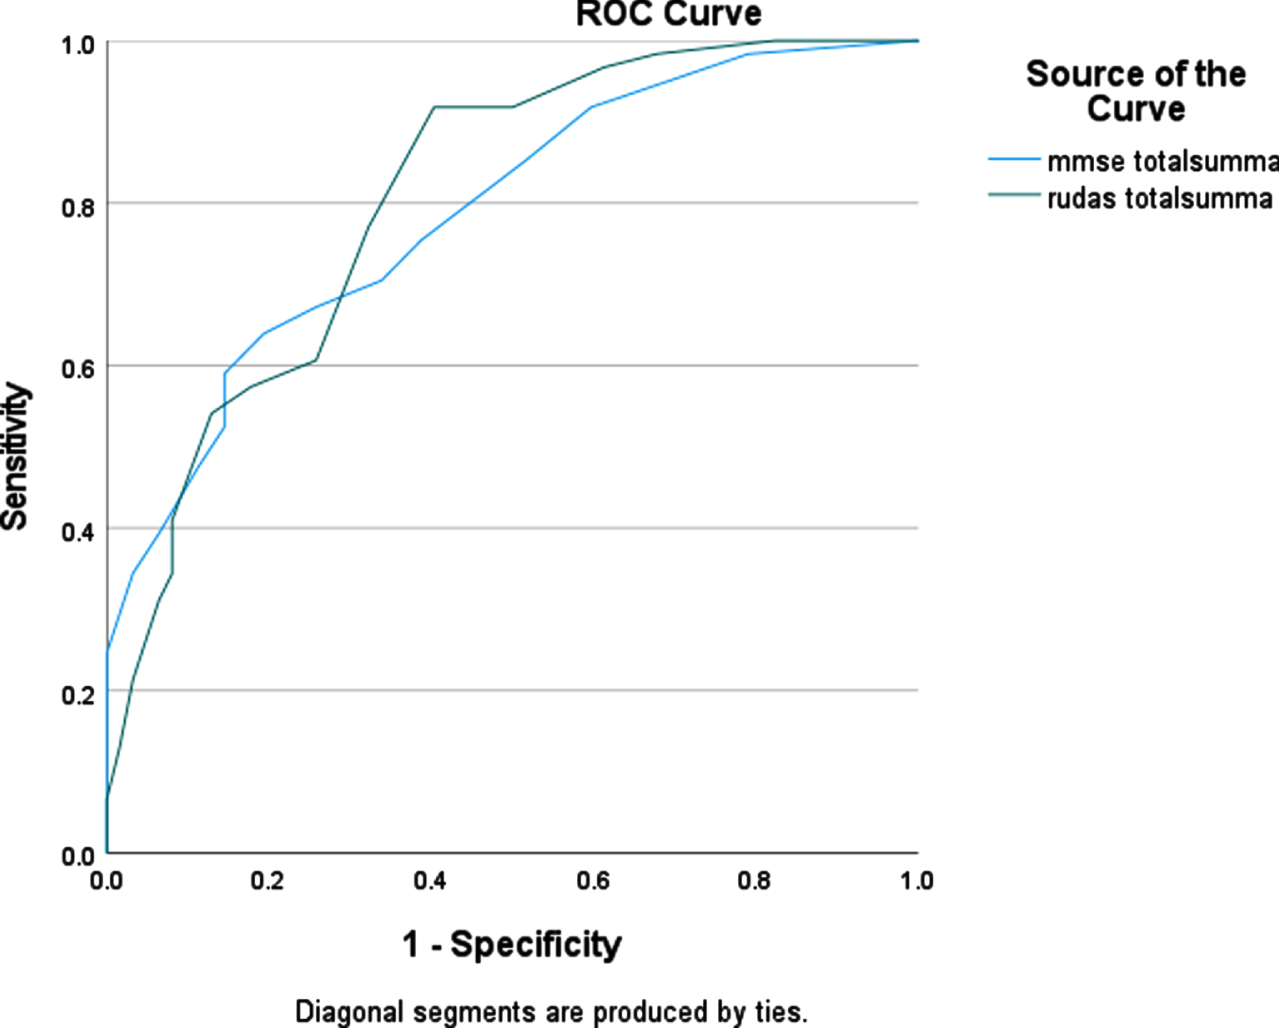
Fig. 3
ROC curve for the RUDAS-S and the MMSE-SR for detecting dementia in the NNS groups (n = 34).
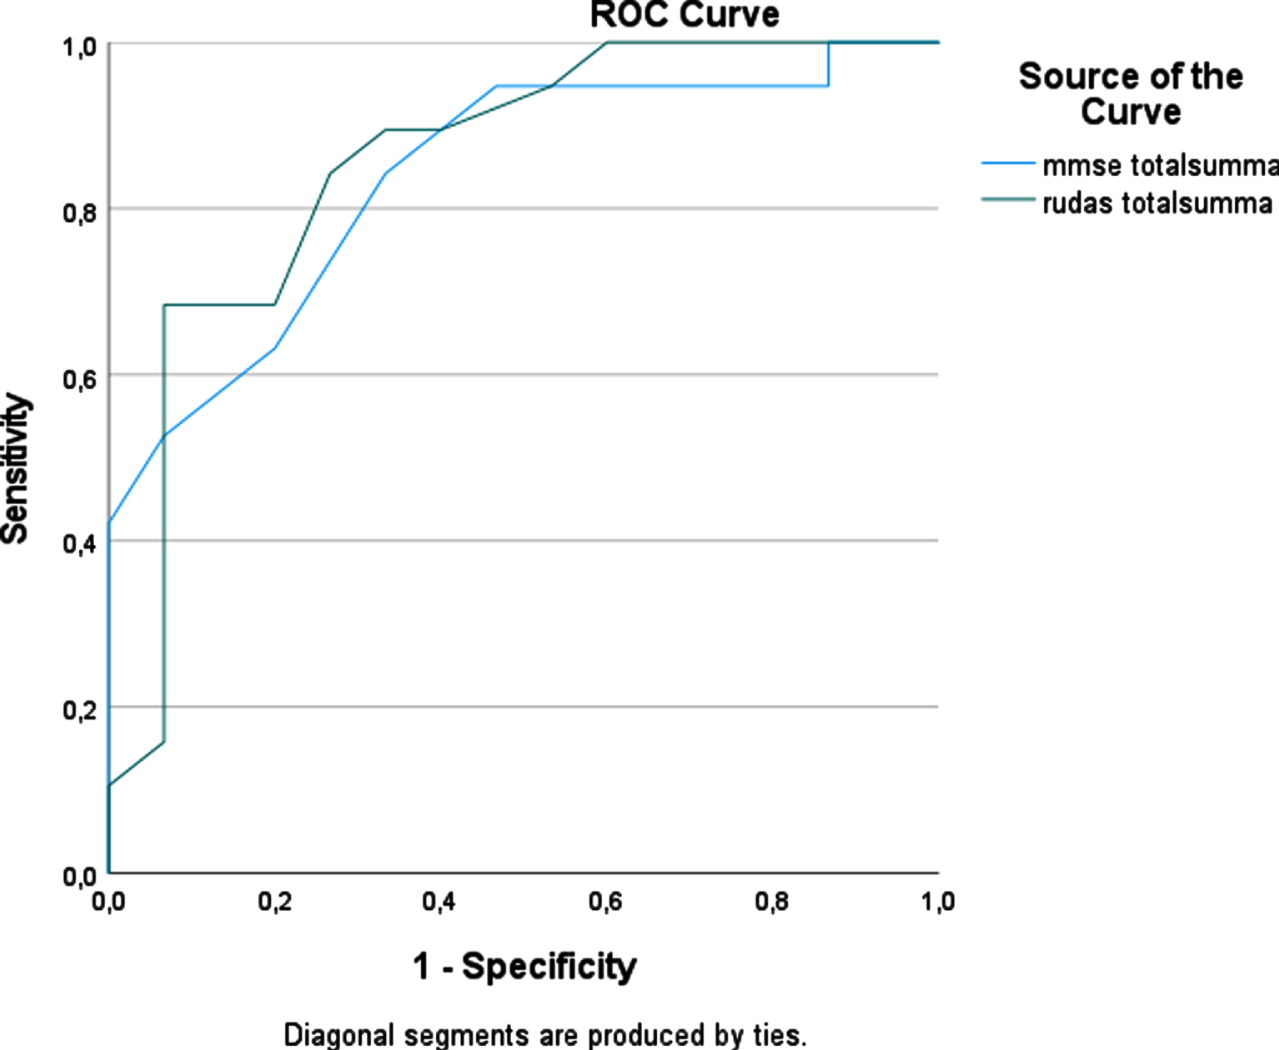
Fig. 4
ROC curve for the RUDAS-S and the MMSE-SR for detecting dementia in the NS groups (n = 89).
At the optimal cutoff (<25) with the highest accuracy, RUDAS-S correctly classified 76% of the patients. At the optimal cutoff (<23), the MMSE-SR correctly classified 73% of the patients. At these cutoff scores, sensitivity and NPV were higher for the RUDAS-S. In Tables 6 and 7, the diagnostic accuracy of the RUDAS-S and MMSE-SR is presented at different cutoff scores.
Table 6
Diagnostic accuracy of the RUDAS-S at different cutoff scores (n = 123)
| Cutoff score | Sensitivity | Specificity | PPV | NPV | LR+ | LR– | A* % |
| (95% CI) | (95% CI) | (95% CI) | (95% CI) | (95% CI) | (95% CI) | ||
| <22/30 | 0.57 | 0.82 | 0.76 | 0.66 | 3.18 | 0.51 | 70 |
| (0.44–0.70) | (0.70–0.90) | (0.61–0.87) | (0.54–0.76) | (1.85–5.46) | (0.37–0.71) | ||
| <23/30 | 0.61 | 0.74 | 0.70 | 0.66 | 2.31 | 0.52 | 67 |
| (0.47–0.73) | (0.61–0.84) | (0.55–0.81) | (0.53–0.76) | (1.48–3.61) | (0.37–0.73) | ||
| <24/30 | 0.77 | 0.68 | 0.70 | 0.75 | 2.35 | 0.33 | 72 |
| (0.64–0.86) | (0.55–0.79) | (0.58–0.80) | (0.61–0.85) | (1.58–3.50) | (0.21–0.53) | ||
| <25/30† | 0.92 | 0.60 | 0.69 | 0.88 | 2.24 | 0.14 | 76 |
| (0.81–0.97) | (0.46–0.72) | (0.58–0.79) | (0.74–0.96) | (1.57–3.20) | (0.06–0.31) | ||
| <26/30 | 0.90 | 0.50 | 0.64 | 0.84 | 1.77 | 0.19 | 70 |
| (0.79–0.96) | (0.37–0.63) | (0.53–0.74) | (0.67–0.93) | (1.28–2.45) | (0.09–0.41) |
CI, confidence interval; PPV, positive predictive values; NPV, negative predictive values; LR+, positive likelihood ratio = Sensitivity/(1-Specificity); LR–, negative likelihood ratio = (1- Sensitivity)/Specificity. *Accuracy (LR+ and LR–weighted for prevalence), †optimal cutoff value.
Table 7
Diagnostic accuracy of the MMSE-SR at different cutoff scores (n = 125)
| Cutoff score | Sensitivity | Specificity | PPV | NPV | LR+ | LR– | A* % |
| (95% CI) | (95% CI) | (95% CI) | (95% CI) | (95% CI) | (95% CI) | ||
| <22/30 | 0.60 | 0.85 | 0.81 | 0.68 | 4.22 | 0.87 | 73 |
| (0.47–0.72) | (0.74–0.93) | (0.66–0.90) | (0.56–0.78) | (2.31–7.72) | (0.34–0.66) | ||
| <23/30† | 0.65 | 0.81 | 0.77 | 0.69 | 3.42 | 0.44 | 73 |
| (0.52–0.76) | (0.68–0.89) | (0.63–0.87) | (0.57–0.79) | (2.03–5.74) | (0.31–0.63) | ||
| <24/30 | 0.68 | 0.74 | 0.73 | 0.70 | 2.69 | 0.43 | 71 |
| (0.55–0.79) | (0.61–0.84) | (0.60–0.83) | (0.57–0.80) | (1.72–4.20) | (0.30–0.64) | ||
| <25/30 | 0.71 | 0.66 | 0.68 | 0.69 | 2.14 | 0.44 | 69 |
| (0.58–0.82) | (0.53–0.77) | (0.55–0.79) | (0.56–0.80) | (1.45–3.16) | (0.29–0.65) | ||
| <26/30 | 0.76 | 0.61 | 0.67 | 0.72 | 2.00 | 0.39 | 69 |
| (0.64–0.86) | (0.48–0.73) | (0.54–0.77) | (0.57–0.83) | (1.39–2.88) | (0.25–0.61) |
CI, Confidence Interval; PPV, positive predictive values; NPV, negative predictive values; LR+, positive likelihood ratio = Sensitivity/(1-Specificity); LR–, negative likelihood ratio = (1- Sensitivity)/Specificity. *Accuracy (LR+ and LR–weighted for prevalence), †optimal cutoff value.
In analyses excluding patients with MCI from the “other diagnoses group,” the AUC increased to 0.93 for RUDAS-S and to 0.84 for the MMSE-SR. At the optimal cutoff scores, sensitivity and specificity increased to 0.92 and 0.85, LR+ to 6.57, LR–to 0.15 for the RUDAS-S. For MMSE-SR sensitivity decreased to 0.60 and specificity increased to 0.88, with LR+ 6.00 and LR–0.20.
DISCUSSION
In this study, we examined the diagnostic accuracy of RUDAS-S, in a group of outpatients with cultural, educational, and linguistic diversity in memory clinics in the south of Sweden. The result indicates that RUDAS-S had moderate to good diagnostic performance for detecting dementia in our multicultural population.
Worldwide, the MMSE is the most used screening instrument for dementia. Therefore, most RUDAS validation studies compare RUDAS with the MMSE [16]. As found in previous studies [32–36], we confirmed a high correlation between the RUDAS-S and MMSE-SR scores (r = 0.59). However, NNS patients had lower MMSE-SR scores than NS patients regardless of diagnosis. This finding is consistent with a Swedish registry-based study, which found NNS patients with dementia had lower MMSE-SR scores than NS patients [37] and confirms earlier studies showing that the MMSE is influenced by factors such as language, culture, and educational background [9, 16, 38]. By contrast, RUDAS-S scores did not differ between NNS and NS patients, neither in the dementia group nor in the group with other diagnoses. An illustrating case from our study was an NNS patient with 8 years of education, who had an MMSE-SR score of 4 and a RUDAS-S score of 20.
Of 125 included patients who received a diagnosis, two had not performed RUDAS-S. The calculations in group comparisons were not affected by this.
To compare the diagnostic properties of the RUDAS-S and MMSE-SR, ROC curve analyses were performed. AUC was considered good for both the RUDAS-S (0.81) and MMSE-SR (0.79). These results are comparable with results from a recent systematic review and meta-analysis that found a pooled AUC for the RUDAS of 0.89 [16].
Other RUDAS validating studies in high-income countries in mono- or multicultural clinical samples have shown a higher AUC for RUDAS; 0.92 [36], 0.93 [17], and 0.90 [39]. However, validation studies in low- and middle-income countries report somewhat similar AUC values as found in our study; Thailand’s AUC for RUDAS was 0.81 [34], Lebanon’s AUC for RUDAS 0.84 [40], and Brazil’s AUC for RUDAS 0.87 [41]. Nielsen et al. [17] explain the lower AUC for these studies to be associated with the lower levels of education, which does not apply in our study because the mean years of education for patients with dementia was 10.0±3.8years.
The lower AUC in the present study is most likely associated with the different traditions for diagnosing dementia across countries and memory clinics. For example, using a descriptive cognitive diagnosis without grading of the cognitive deficit at the first visit with the physician. Dementia diagnoses are often determined after longer follow-up. Furthermore, the diagnoses were due to longstanding tradition based on MMSE-SR rather than RUDAS-S results. Other validation studies of cognitive instruments compared their test results between dementia and healthy control groups. The comparison group in the present study comprised individuals with MCI, which diminished the cognitive difference between the studied groups. This might explain the lower AUC compared with other studies. When patients with a diagnosis of MCI were excluded from the group “Other diagnoses,” the AUC increased to 0.93 for RUDAS-S and 0.84 for MMSE-SR.
Nielsen and Jørgensen [16] reported in their meta-analysis that about 60% of the studies had a cutoff score of 23/24. Based on results of sensitivity, specificity, and accuracy in the present study, the optimal cutoff score for RUDAS-S was <25. This result was the same as in a cross-European memory clinic study that also included patients from Southern Sweden [17]. At a cutoff <25, we found the RUDAS-S to have a sensitivity of 0.92, a specificity of 0.60, and an accuracy of 76% (Table 6). Excluding patients with MCI from the analyses did not affect sensitivity, but increased specificity to 0.86, LR+ to 6.57, LR–to 0.15 and accuracy to 90%. When the group “other diagnoses” (not dementia) was purified as much as possible, there was a better balance between sensitivity and specificity and a higher accuracy. This could be due to the fact that MCI patients are in the borderland between dementia andnon-dementia.
For a useful cognitive screening test, higher sensitivity is prioritized together with a high accuracy. The high sensitivity indicates that RUDAS-S is a valuable cognitive screening instrument for detecting dementia. Due to lower specificity, clinicians should be aware of a fairly high rate of false positives.
Strengths and weaknesses
The present study is the first to validate the RUDAS-S in Sweden. The study was performed in daily clinical practice in 4 specialized memory clinics. To be inclusive and reflect real life, no exclusion criteria were formulated. The study included patients with different mother tongues and cultural backgrounds. This means that our study shows a spread of ethnicities, representative of the most common foreign-born groups in Sweden.
The study reflects the reality of patients in memory clinic settings. In general, the number of foreign-born patients who are referred for a cognitive assessment is smaller than expected. The proportion of NNS in the study was lower than NS but higher than the proportion of NNS in the general Swedish population. Foreign born patients seek care for memory disorders to a lesser extent than native born patients [8], which may indicate a need to increase knowledge about dementia and cognitive assessment in the group of foreign-born patients. Another advantage was that the included groups (NNS and NS), were demographically similar except for years of education, although this difference was not large. Before and during the study, the health professionals received training and supervision in the administration of the RUDAS-S and interpreter-mediated cognitive assessment. This may have been important for the tests to be carried out equally and for the results to be interpreted more coherently.
The study also has some limitations that should be considered. The study was of a cross-sectional cohort without longitudinal follow-up to support the accuracy of the clinical dementia diagnosis used as a criterion standard. The memory clinics in the study were accustomed to using the MMSE-SR and results from the MMSE-SR used to reach the dementia diagnosis were used as the criterion standard in the study. This may have inflated the psychometric properties for the MMSE-SR because of the circular argumentation. It would have been useful to use an independent measurement to evaluate the level of cognitive impairment such as the clinical dementia rating scale [42]. Another alternative would have been to examine the diagnostic accuracy of RUDAS-S for detecting dementia without comparing it to MMSE-SR.
It can also be discussed whether the test results were affected by prioritizing testing with MMSE-SR over RUDAS-S, and if there were possible practice effects for MMSE-SR since most participants were tested with MMSE before being referred to specialist clinics. Still there were differences in MMSE-SR scores between NNS and NS patients
In this study, we compared test results and test properties in patients diagnosed with dementia and those with another diagnosis. Other studies often compared their study material results with results from healthy controls. On the one hand, this may also have been desirable here because we found that the AUC increased when the MCI group was excluded from those without dementia. On the other hand, our study design may better reflect clinical reality, whereas more “pure” case-control studies artificially may inflate diagnostic accuracy.
However, it should be noted that the diagnostic process was not blinded as MMSE-SR was part of clinical routine. To improve clinical diagnostics, it would have been optimal for two independent physicians to make the diagnosis, however, some of the participating clinics have a system with a special diagnostic round where several physicians and other staff participate, and diagnoses are made in consensus. We believe that this improves the quality of the distinction between no dementia and different levels of cognitive disability, SCI, MCI, dementia.
The study is based on reality and reflects the patients seeking care for cognitive impairment. In our study most of NNS patients were from upper-middle income and high-income countries. It would have been interesting to have a more even distribution of patients in the different groups of economic classification, since it is known that people from low-income countries do not seek help for cognitive impairment to the expected extent [26].
In summary, the present study showed that RUDAS-S, with an AUC of 0.81, had moderate to good diagnostic performance for detecting dementia in a multicultural population in Sweden. At a cutoff score <25 the sensitivity was 0.92, the specificity 0.60, and the accuracy 76%. The low specificity could represent a challenge if RUDAS-S was applied for screening in a normal population or case-finding in primary care where the prevalence of dementia can be low. In the memory clinic setting, RUDAS-S should not be used as a standalone measure of cognitive function to detect dementia. Promising cross-cultural cognitive tools to support the RUDAS-S include extended cognitive screening with the MCE and neuropsychological testing with the CNTB, which have both been validated in ethnic minority and majority populations across several European countries. Against the background of increasing age and following cognitive deficits, and a growing proportion of immigrants in Sweden and other European countries, several valid cross-cultural cognitive tests are considered important. The RUDAS-S is a valuable cognitive screening instrument in clinicalpractice.
Conclusion
The RUDAS-S was at least as accurate as the MMSE-SR in detecting dementia in a multicultural outpatient memory clinic patient sample in Sweden and the RUDAS-S can be used validly with all patients undergoing a cognitive assessment, irrespective of their cultural, language, and educational background. However, there is a need for other cross-cultural cognitive tests to complement the RUDAS-S for more extended cognitive examination, especially for assessing patients with nonnative language and cultural backgrounds.
ACKNOWLEDGMENTS
The study was supported by the Swedish federal government under the ALF agreement, and by the Kockska foundation and Vinnova (grant number 2021-02680).
Authors’ disclosures available online (https://www.j-alz.com/manuscript-disclosures/22-0233r2).
REFERENCES
[1] | Prince MJ , Wimo A , Guerchet MM , Ali GC , Wu Y-T , Prina M (2015) World Alzheimer Report 2015. The Global Impact of Dementia: An Analysis of Prevalence, Incidence, Cost and Trends, Alzheimer’s Disease International, London. |
[2] | Canevelli M , Lacorte E , Cova I , Zaccaria V , Valletta M , Raganato R , Bruno G , Bargagli AM , Pomati S , Pantoni L , Vancore N ((2019) ) Estimating dementia cases amongst migrants living in Europe. Eur J Neurol 26: , 1191–1199. |
[3] | Nielsen TR , Antelius E , Storstein Spilker R , Torkpoor R , Toresson H , Plejert C ((2015) ) Dementia care for people from ethnic minorities: A Nordic perspective. Int J Geriatr Psychiatry 20: , 217–222. |
[4] | Georges J , Nielsen TR , Plejert C , Rauf M , Lahav D , Jaakson S , Kaur R , Herz M , Parveen S , Golan-Shemesh D , Smits C , Gove D (2018) The Development of Inter-Cultural Care and Support for People with Dementia from Minority Ethnic Groups, Alzheimer Europe, Luxembourg. |
[5] | Statistics Sweden (2022) Foreign-born by Country of birth, sex and year of immigration 31 December 2021. https://scb.se/en/finding-statistics/statistics-by-subject-area/population/population-composition/population-statistics/ Last updated February 22, 2022, Accessed on March 1, 2022. |
[6] | Franzen S , Papma JM , Van den Berg E , Nielsen TR ((2021) ) Cross-cultural neuropsychological assessment in the European Union: A Delphi expert study. Arch Clin Neuropsychol 36: , 815–830. |
[7] | National Board of Health and Welfare (2017) National Guidelines for Care in Cases of Dementia - Support for Governing and Management, The National Board of Health and Welfare, Stockholm. |
[8] | Gove D , Nielsen RT , Smits C , Plejert C , Rauf M A , Parveen S , Jaakson S , Golan-Shemesh D , Lahav D , Kaur R , Herz MK , Monsees J , Thyrian JR , Georges J ((2021) ) The challenges of achieving timely diagnosis and culturally appropriate care of people with dementia from minority ethnic groups in Europe. Int J Geriatr Psychiatry 36: , 1823–1828. |
[9] | Ardila A ((2005) ) Cultural values underlying psychometric cognitive testing. Neuropsychol Rev 15: , 185–195. |
[10] | Ardila A , Bertolucci PH , Braga LW , Castro-Caldas A , Judd T , Kosmidis MH , Matute E , Nitrini R , Ostrosky-Solis F , Rosselli M ((2010) ) Illiteracy: The neuropsychology of cognition without reading. Arch Clin Neuropsychol 25: , 689–712. |
[11] | Nielsen TR , Jørgensen K ((2013) ) Visuoconstructional abilities in cognitively healthy illiterate Turkish immigrants: A quantitative and qualitative investigation. Clin Neuropsychol 27: , 681–692. |
[12] | Nielsen TR , Waldemar G ((2016) ) Knowledge and perceptions of dementia and Alzheimer’s disease in four ethnic groups in Copenhagen, Denmark. Int J Geriatr Psychiatry 31: , 222–230. |
[13] | Folstein MF , Folstein SE , McHugh PR ((1975) ) “Mini-mental state”. A practical method for grading the cognitive state of patients for the clinician. J Psychiatr Res 12: , 189–198. |
[14] | Nielsen TR , Vogel A , Riepe MW , de Mendonca A , Rodriguez G , Nobili F , Gade A , Waldemar G ((2011) ) Assessment of dementia in ethnic minority patients in Europe: A European Alzheimer’s Disease Consortium survey. Int Psychogeriatr 23: , 86–95. |
[15] | Crum M , Anthony J , Bassett S , Folstein MF ((1993) ) Population-based norms for the Mini-Mental State Examination by age and educational level. JAMA 269: , 2386–2391. |
[16] | Nielsen TR , Jørgensen K ((2020) ) Cross-cultural dementia screening using the Rowland Universal Dementia Assessment Scale: A systematic review and meta-analysis. Int Psychogeriatr 32: , 1031–1044. |
[17] | Nielsen TR , Segers K , Vanderaspoilden V , Bekkhus-Wetterberg P , Hanevold Bjørkløf G , Beinhoff U , Minthon L , Pissiota A , Tsolaki M , Gkioka M , Waldemar G ((2019) ) Validation of the Rowland Universal Dementia Assessment Scale (RUDAS) in a multicultural sample across five Western European countries: Diagnostic accuracy and normative data. Int Psychogeriatr 31: , 287–296. |
[18] | Nielsen TR , Segers K , Vanderaspoilden V , Bekkhus-Wetterberg P , Minthon L , Pissiota A , Hanevold Bjørkløf G , Beinhoff U , Tsolaki M , Gkioka M , Waldemar G ((2018) ) Performance of middle-aged and elderly European minority and majority populations on a Cross-Cultural Neuropsychological Test Battery (CNTB). Clin Neuropsychol 32: , 1411–1430. |
[19] | Nielsen TR , Segers K , Vanderaspoilden V , Beinhoff U , Minthon L , Pissiota A , Bekkhus-Wetterberg P , Hanevold Bjørkløf G , Tsolaki M , Gkioka M , Waldemar G ((2019) ) Validation of a European Cross-Cultural Neuropsychological Test Battery (CNTB) for evaluation of dementia. Int J Geriatr Psychiatry 34: , 144–152. |
[20] | Nielsen TR , Segers K , Vanderaspoilden V , Beinhoff U , Minthon L , Pissiota A , Bekkhus-Wetterberg P , Hanevold Bjørkløf G , Tsolaki M , Gkioka M , Waldemar G ((2019) ) Validation of a brief Multicultural Cognitive Examination (MCE) for evaluation of dementia. Int J Geriatr Psychiatry 34: , 982–989. |
[21] | Storey JE , Rowland JT , Basic D , Conforti DA , Dickson HG ((2004) ) The Rowland Universal Dementia Assessment Scale (RUDAS): A multicultural cognitive assessment scale. Int Psychogeriatr 16: , 13–31. |
[22] | Komalasari R , Chang HCR , Traynor V ((2019) ) A review of the Rowland Universal Dementia Assessment Scale. Dementia 18: , 3143–3158. |
[23] | Kleist I , Noahsen P , Gerdal O , Riis J , Andersen S ((2021) ) Diagnosing dementia in the Arctic: Translating tools and developing and validating an algorithm for assessment of impaired cognitive function in Greenland Inuit. Int J Circumpolar Health 80: , 1948247. |
[24] | Daniel B , Agenagnew L , Workicho A , Abera M ((2022) ) Validation of the Rowlands Universal Dementia Assessment Scale (RUDAS) to detect major neurocognitive disorder among elderly people in Ethiopia, 2020. PLoS One 17: , e0262483. |
[25] | Diaz E , Kumar BN , Engedal K ((2015) ) Immigrant patients with dementia and memory impairment in primary health care in Norway: A national registry study. Dement Geriatr Cogn Disord 39: , 321–331. |
[26] | Nielsen TR , Vogel A , Phung TK , Gade A , Waldemar G ((2011) ) Over- and under-diagnosis of dementia in ethnic minorities: A nationwide register-based study. Int J Geriatr Psychiatry 26: , 1128–1135. |
[27] | Nielsen TR , Andersen BB , Kastrup M , Phung TK , Waldemar G ((2011) ) Quality of dementia diagnostic evaluation for ethnic minority patients: A nationwide study. Dement Geriatr Cogn Disord 31: , 388–396. |
[28] | Pfeffer RI , Kurosaki TT , Harrah CH Jr , Chance JM , Filos S ((1982) ) Measurement of functional activities in older adults in the community. J Gerontol 37: , 323–329. |
[29] | Gottfries GG , Noltorp S , Nørgaard N ((1997) ) Experience with a Swedish version of the Geriatric Depression Scale in primary care centres. Int J Geriatr Psychiatry 12: , 1029–1034. |
[30] | World Health Organization (1992) The ICD-10 Classification of Mental and Behavioural Disorders: Clinical Descriptions and Diagnostic Guidelines, World Health Organization, Geneva. |
[31] | Metz CE ((1978) ) Basic principles of ROC analysis. Semin Nucl Med 8: , 283–298. |
[32] | Ayan G , Afacan C , Poyraz BC , Bilgic O , Avci S , Yavuzer H , Yuruyen M , Erdincler DS , Ayan B , Doventas A ((2019) ) Reliability and validity of Rowland Universal Dementia Assessment Scale in Turkish population. Am J Alzheimers Dis Other Demen 34: , 34–40. |
[33] | Custodio N , Montesinos R , Lira D , Herrera-Perez E , Chavez K , Hernandez-Córdova G , Cuenca J , Gamboa C , Metcalf T ((2019) ) Validation of the RUDAS in patients with a middle-level education in Lima, Peru. Am J Alzheimers Dis Other Demen 34: , 513–522. |
[34] | Limpawattana P , Tiamkao S , Sawanyawisuth K , Thinkhamrop B ((2012) ) Can Rowland Universal Dementia Assessment Scale (RUDAS) replace Mini-mental State Examination (MMSE) for dementia screening in a Thai geriatric outpatient setting? Am J Alzheimers Dis Other Demen 27: , 254–259. |
[35] | Nielsen TR , Andersen BB , Gottrup H , Lutzhoft JH , Hogh P , Waldemar G ((2013) ) Validation of the Rowland Universal Dementia Assessment Scale for multicultural screening in Danish memory clinics. Dement Geriatr Cogn Disord 36: , 354–362. |
[36] | Rowland JT , Basic D , Storey JE , Conforti DA ((2006) ) The Rowland Universal Dementia Assessment Scale (RUDAS) and the Folstein MMSE in a multicultural cohort of elderly persons. Int Psychogeriatr 18: , 111–120. |
[37] | Lindgren E , Sörenson J , Wattmo C , Kåreholt I , Nägga K ((2021) ) Differences in dementia care between Swedish-born andforeign-born from countries with different country levelsocioeconomic position: A nationwide register-based study. JAlzheimer Dis 84: , 1363–1371. |
[38] | Naqvi RM , Haider S , Tomlinson G , Alibhai S ((2015) ) Cognitive assessments in multicultural populations using the Rowland Universal Dementia Assessment Scale: A systematic review and meta-analysis. CMAJ 187: , E169–E175. |
[39] | Mateos-Alvarez R , Ramos-Rios R , López Morinigo JD ((2017) ) Comparative analysis between the MMSE and the RUDAS for dementia screening in low educated people in a Spanish psychogeriatric clinic. Eur J Psychiatry 31: , 119–126. |
[40] | Chaaya M , Phung TKT , El Asmar K , Atweh S , Ghusn H , Khoury RM , Prince M , Nielsen TR , Waldemar G ((2016) ) Validation of the Arabic Rowland Universal Dementia Assessment Scale (A-RUDAS) in elderly with mild and moderate dementia. Aging Ment Health 20: , 880–887. |
[41] | de Araujo NB , Nielsen TR , Engedal K , Barca ML , Coutinho ES , Laks J ((2018) ) Diagnosing dementia in lower educated older persons: Validation of Brazilian Portuguese version of the Rowland Universal Dementia Assessment Scale (RUDAS). Braz J Psychiatry 40: , 264–269. |
[42] | Morris JC ((1997) ) Clinical dementia rating: A reliable and valid diagnostic and staging measure for dementia of the Alzheimer type. Int Psychogeriatr 9: , 173–176. |

