
Novel Invisible Spectral Flicker Induces 40 Hz Neural Entrainment with Similar Spatial Distribution as 40 Hz Stroboscopic Light
Abstract
Background:
Exposure to 40 Hz stroboscopic light, for one hour a day, has previously been published as a potential treatment option for Alzheimer’s disease in animal models. However, exposure for an hour a day to 40 Hz stroboscopic light can be strenuous and examining other types of 40 Hz inducing stimuli is paramount if chronic treatment is wanted.
Objective:
A core assumption behind ensuring a therapeutic outcome is that the visual stimuli can induce 40 Hz gamma entrainment. Here, we examine whether a specific visual stimulus, 40 Hz invisible spectral flicker (ISF), can induce gamma entrainment and how it differs from both continuous light (CON) and 40 Hz stroboscopic light (STROBE).
Methods:
The study included non-simultaneous EEG-fMRI neuroimaging of 13 young healthy volunteers during light exposure. Each light condition (i.e., CON, ISF, or STROBE) was active for 30 seconds followed immediately by the next.
Results:
Entrainment of 40 Hz neural activity were significantly higher signal-to-noise ratio during exposure to ISF (mean: 3.03, 95% CI 2.07 to 3.99) and STROBE (mean: 12.04, 95% CI 10.18 to 13.87) compared to CON. Additionally STROBE had a higher entrainment than ISF (mean: 9.01, 95% CI 7.16 to 12.14).
Conclusion:
This study presents a novel method of 40 Hz entrainment using ISF. This enables the possibility of future randomized placebo-controlled clinical trials with acceptable double blinding due to the essentially imperceivable flicker, which is expected to substantially reduce discomfort compared to interventions with stroboscopic flicker.
INTRODUCTION
The number of patients suffering from Alzheimer’s disease (AD) increases with an aging population [1]. Unfortunately, there is currently no disease modifying treatment available [2], causing the doctors and patients to solely rely on symptomatic treatment.
Patients with AD have an accumulation of amyloid-β (Aβ) and tau protein in the neural tissue. Therefore, it is considered that a treatment, which reduces the accumulation of these proteins, may be a potential treatment for AD. Indeed, many potential drugs have been tested for reduction of Aβ and tau protein [3]. Recent studies have demonstrated that it is possible to reduce the amount of Aβ and tau by inducing neural oscillations at 40 Hz [4–6].
This has been done non-invasively by exposing mouse models of AD to 40 Hz stroboscopic light. Induction of 40 Hz entrainment by exposure to flickering light is also possible in humans [7, 8]. However, to our knowledge, repeated measures of 40 Hz flickering lights in longer periods of minutes to hours of exposure have only been tested in few studies [9–11].
Exposure to 40 Hz stroboscopic light is, however, expected to be strenuous to look at, especially with a proposed exposure time of 60 min per day [4]. This study is therefore working with a novel form of light called invisible spectral flicker (ISF) [12]. The type of ISF used in this study alternates between two spectrally different compositions of light that renders the flickering invisible to the observer while creating a perceived color of white light similar to continuous light. The imperceptible flicker characteristic of the ISF equates it with bright light therapy which is already acknowledged as a treatment with high tolerability for different psychiatric disorders [13] and dementia [14]. The ISF at 40 Hz will be compared to 40 Hz stroboscopic light and continuous non-flickering light. The immediate effect will be evaluated using electroencephalography (EEG) and functional magnetic resonance imaging (fMRI). The aim is to estimate the immediate effect on neuronal activity by exposure to 40 Hz ISF. The use of EEG will help determine the neurophysiological response with high temporal acuity; however, EEG lacks spatial resolution especially in subcortical structures [15]. Therefore the study has added the use of blood oxygen level dependent (BOLD) fMRI to investigate subcortical changes as a result of exposure, as BOLD signal has been seen to follow gamma activity in other studies [16–21].
MATERIALS AND METHODS
Participants
Young healthy volunteers were recruited through personal contact or bulletins at local educational facilities. It was estimated that 10–15 participants would be a sufficient sample size for explorative analysis in this study. Eligibility of participants was based on the following in- and exclusion criteria, inclusion criteria: Age > 18 years and no use of prescription medication (contraceptives were allowed). Exclusion criteria: Claustrophobia, metal implants, pacemaker or cochlear implants, pregnancy, breastfeeding, and psychiatric disorders.
Light paradigm and conditions
This study had three different conditions of light (Fig. 1) all from the same purpose-built light source (OptoCeutics ApS). The first condition was a control condition of non-flickering continuous light (CON). The second condition was 40 Hz ISF (ISF). The third condition was 40 Hz stroboscopic light (STROBE). All light conditions had a matching correlated color temperature of 3191 K, CIE 1931 chromaticity coordinates of (x,y) = (0.410, 0.376), and a Duv (Delta uv) value less than 0.01, and thus within the range of white light. All light conditions were brightness matched at an average of 150 lux per second at the level of the eye, verified by a handheld lux-meter (MK350 LED Meter, URPtek, Taiwan).
Fig. 1
Experimental design. A) Normalized spectral irradiance of the different light conditions used, top panel: non-flickering light (CON), middle panel: 40 Hz ISF, lower panel: 40 Hz stroboscopic light. B) Normalized spectral irradiance of the 1st and 2nd half cycle of the different conditions. C) Color temperature of the three light conditions used. D) Illustration of the AB and ABC paradigms.
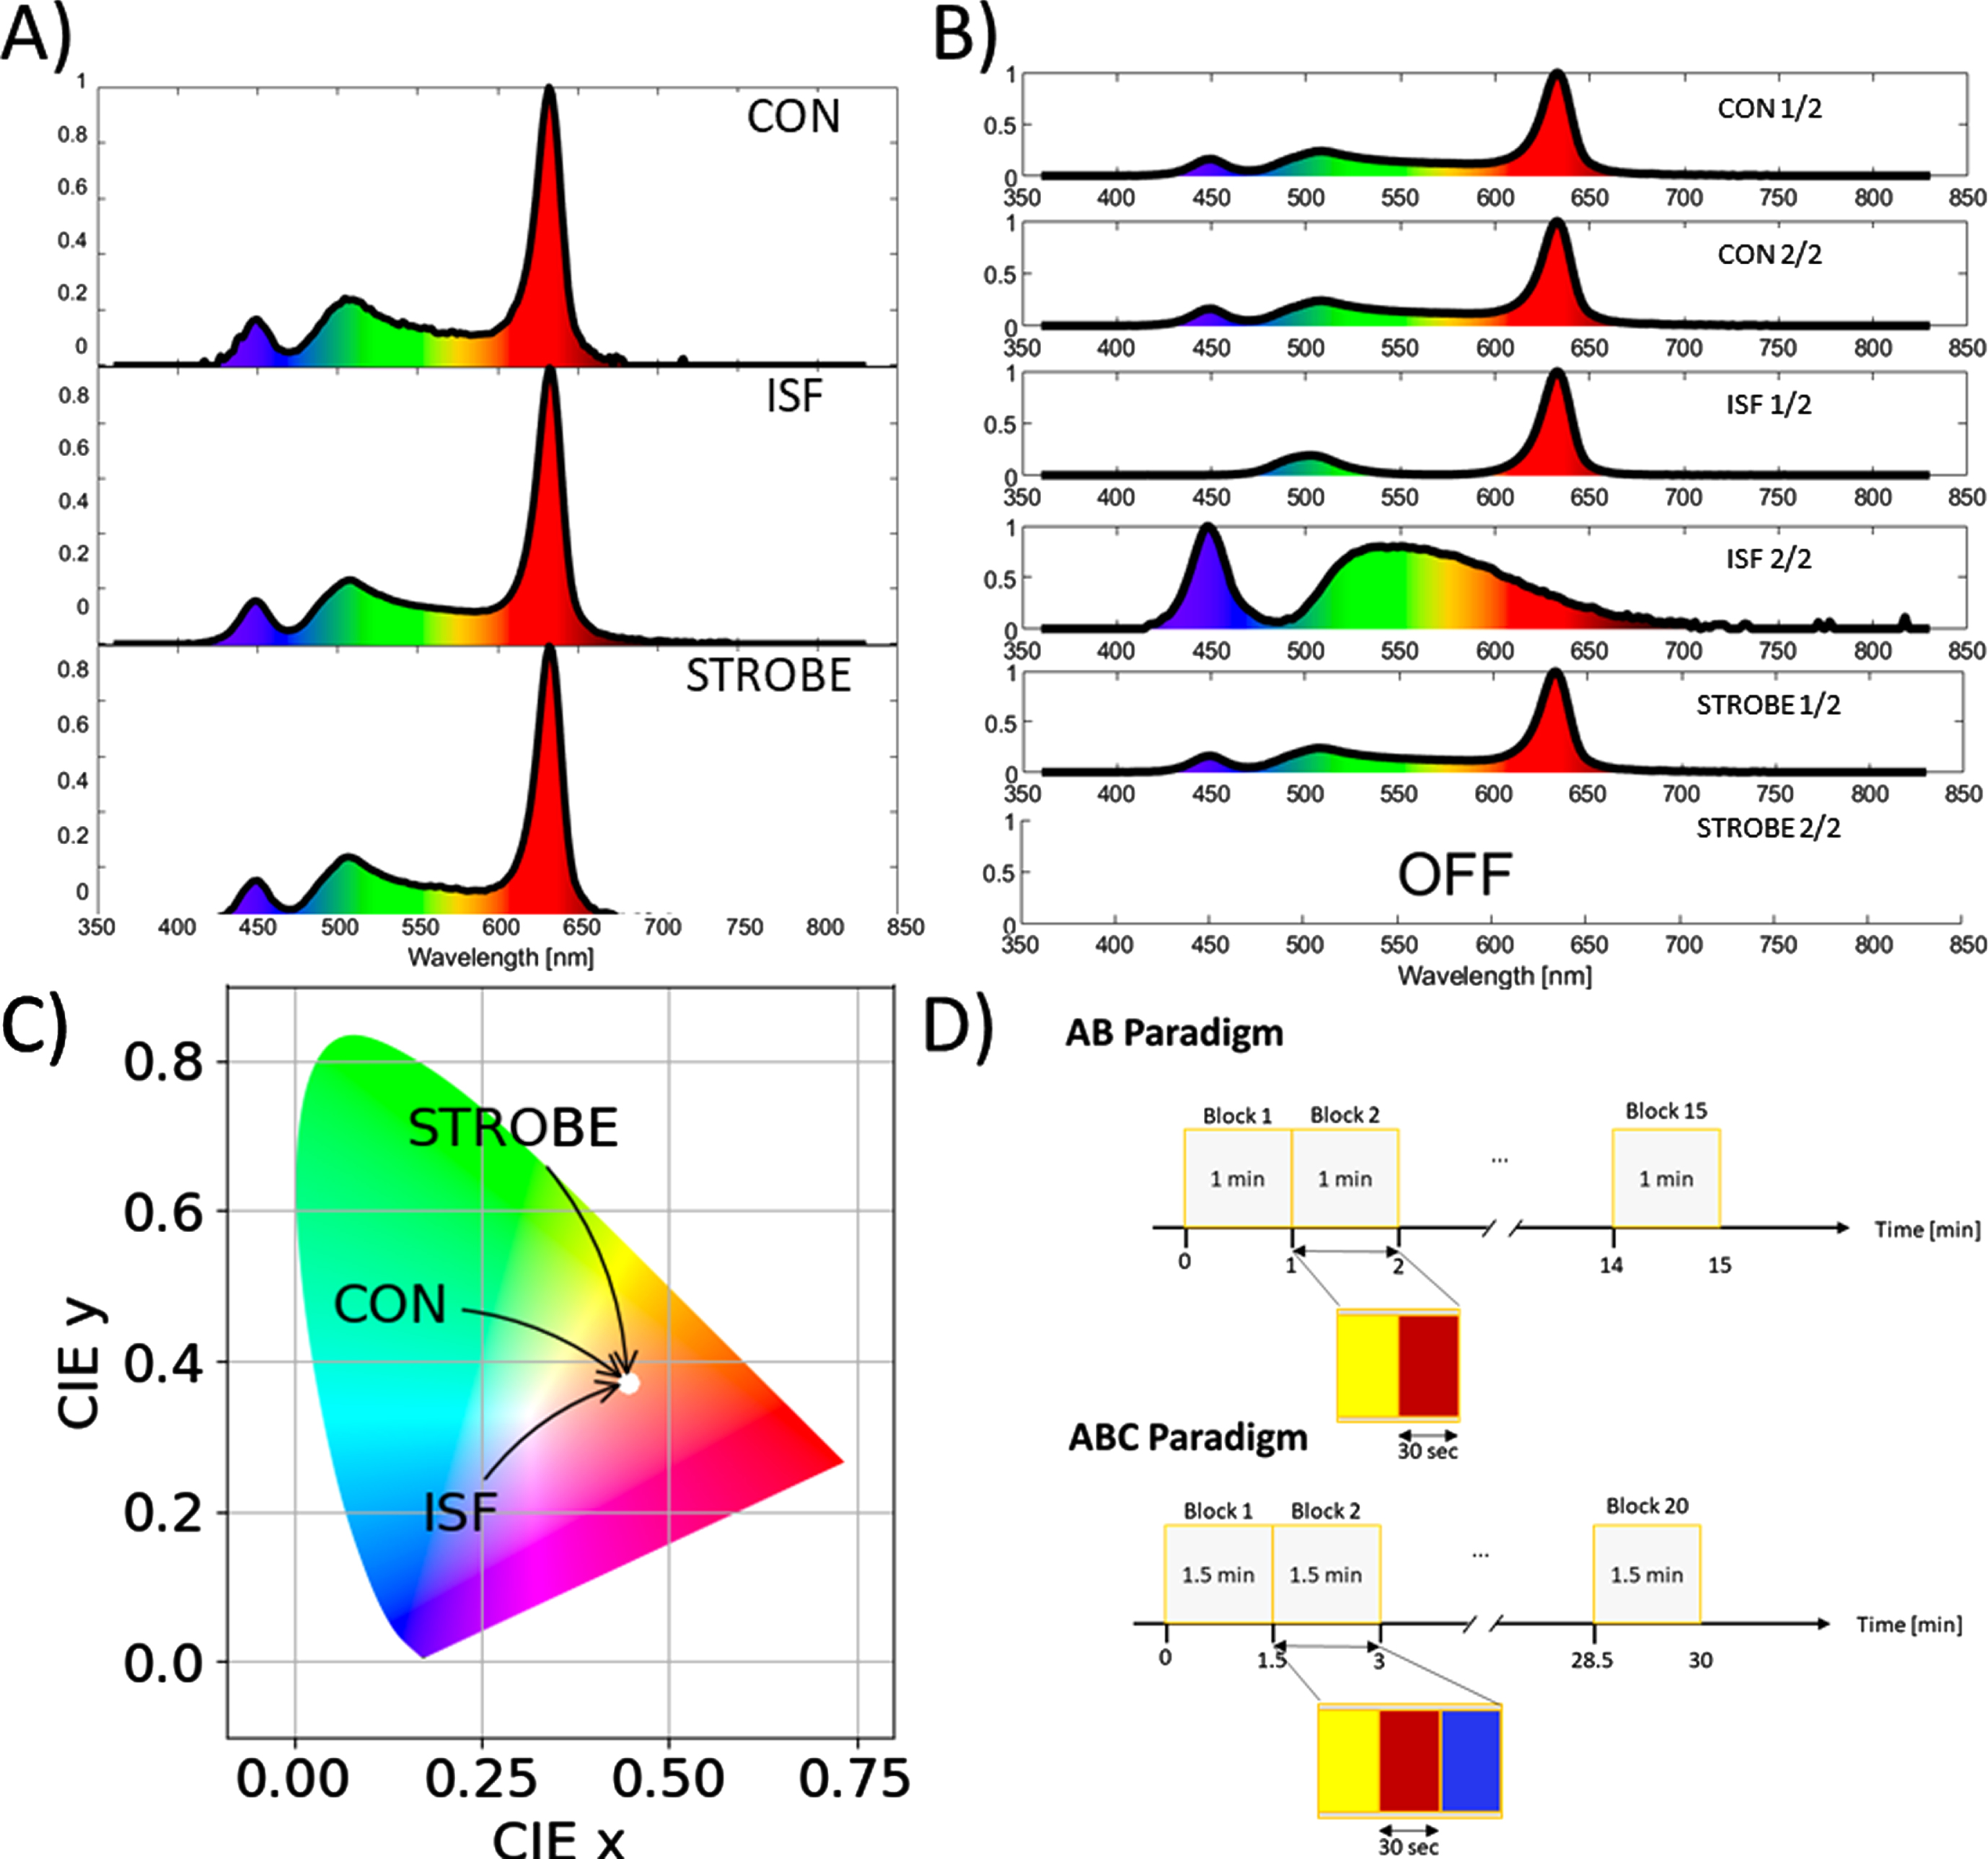
Two paradigms of exposure to the light were completed. In both paradigms, each condition was active for 30 s followed immediately by the next condition with no interval between conditions (Fig. 1D). The first paradigm was an AB paradigm comparing a condition A (CON) and a condition B (ISF), with 15 repetitions of each condition for a total of 15 min. The second paradigm included all three conditions (CON, ISF, and STROBE), in an ABC paradigm. Here, each condition was repeated 20 times for a total of 30 min. To reduce carry-over effects from the prior condition, the order of conditions in each block was randomized for the individual participant. For the fMRI recordings, a control paradigm was added, which tested no light versus continuous non-flickering light with four repetitions for each for a total of 4 min.
Electroencephalography
EEG was recorded in a designated room shielded from external electrical interference with lights turned off and blackout curtains drawn, resulting in low background illuminance below 5 lux. EEG was recorded with 26 electrodes arranged according to the international 10–20 system plus a dipolar EOG sensor and a bipolar electrocardiogram (ECG) corresponding to II. Sampling rate was 1000 Hz. During the recording, the participants sat in a comfortable chair 70 cm from the light source. The participants were instructed to refrain from voluntary movements and direct their gaze directly at the light source as much as possible. If the conductor of the experiment observed gaze deviation, the participant would be reminded to direct their gaze at the light source.
Functional magnetic resonance imaging
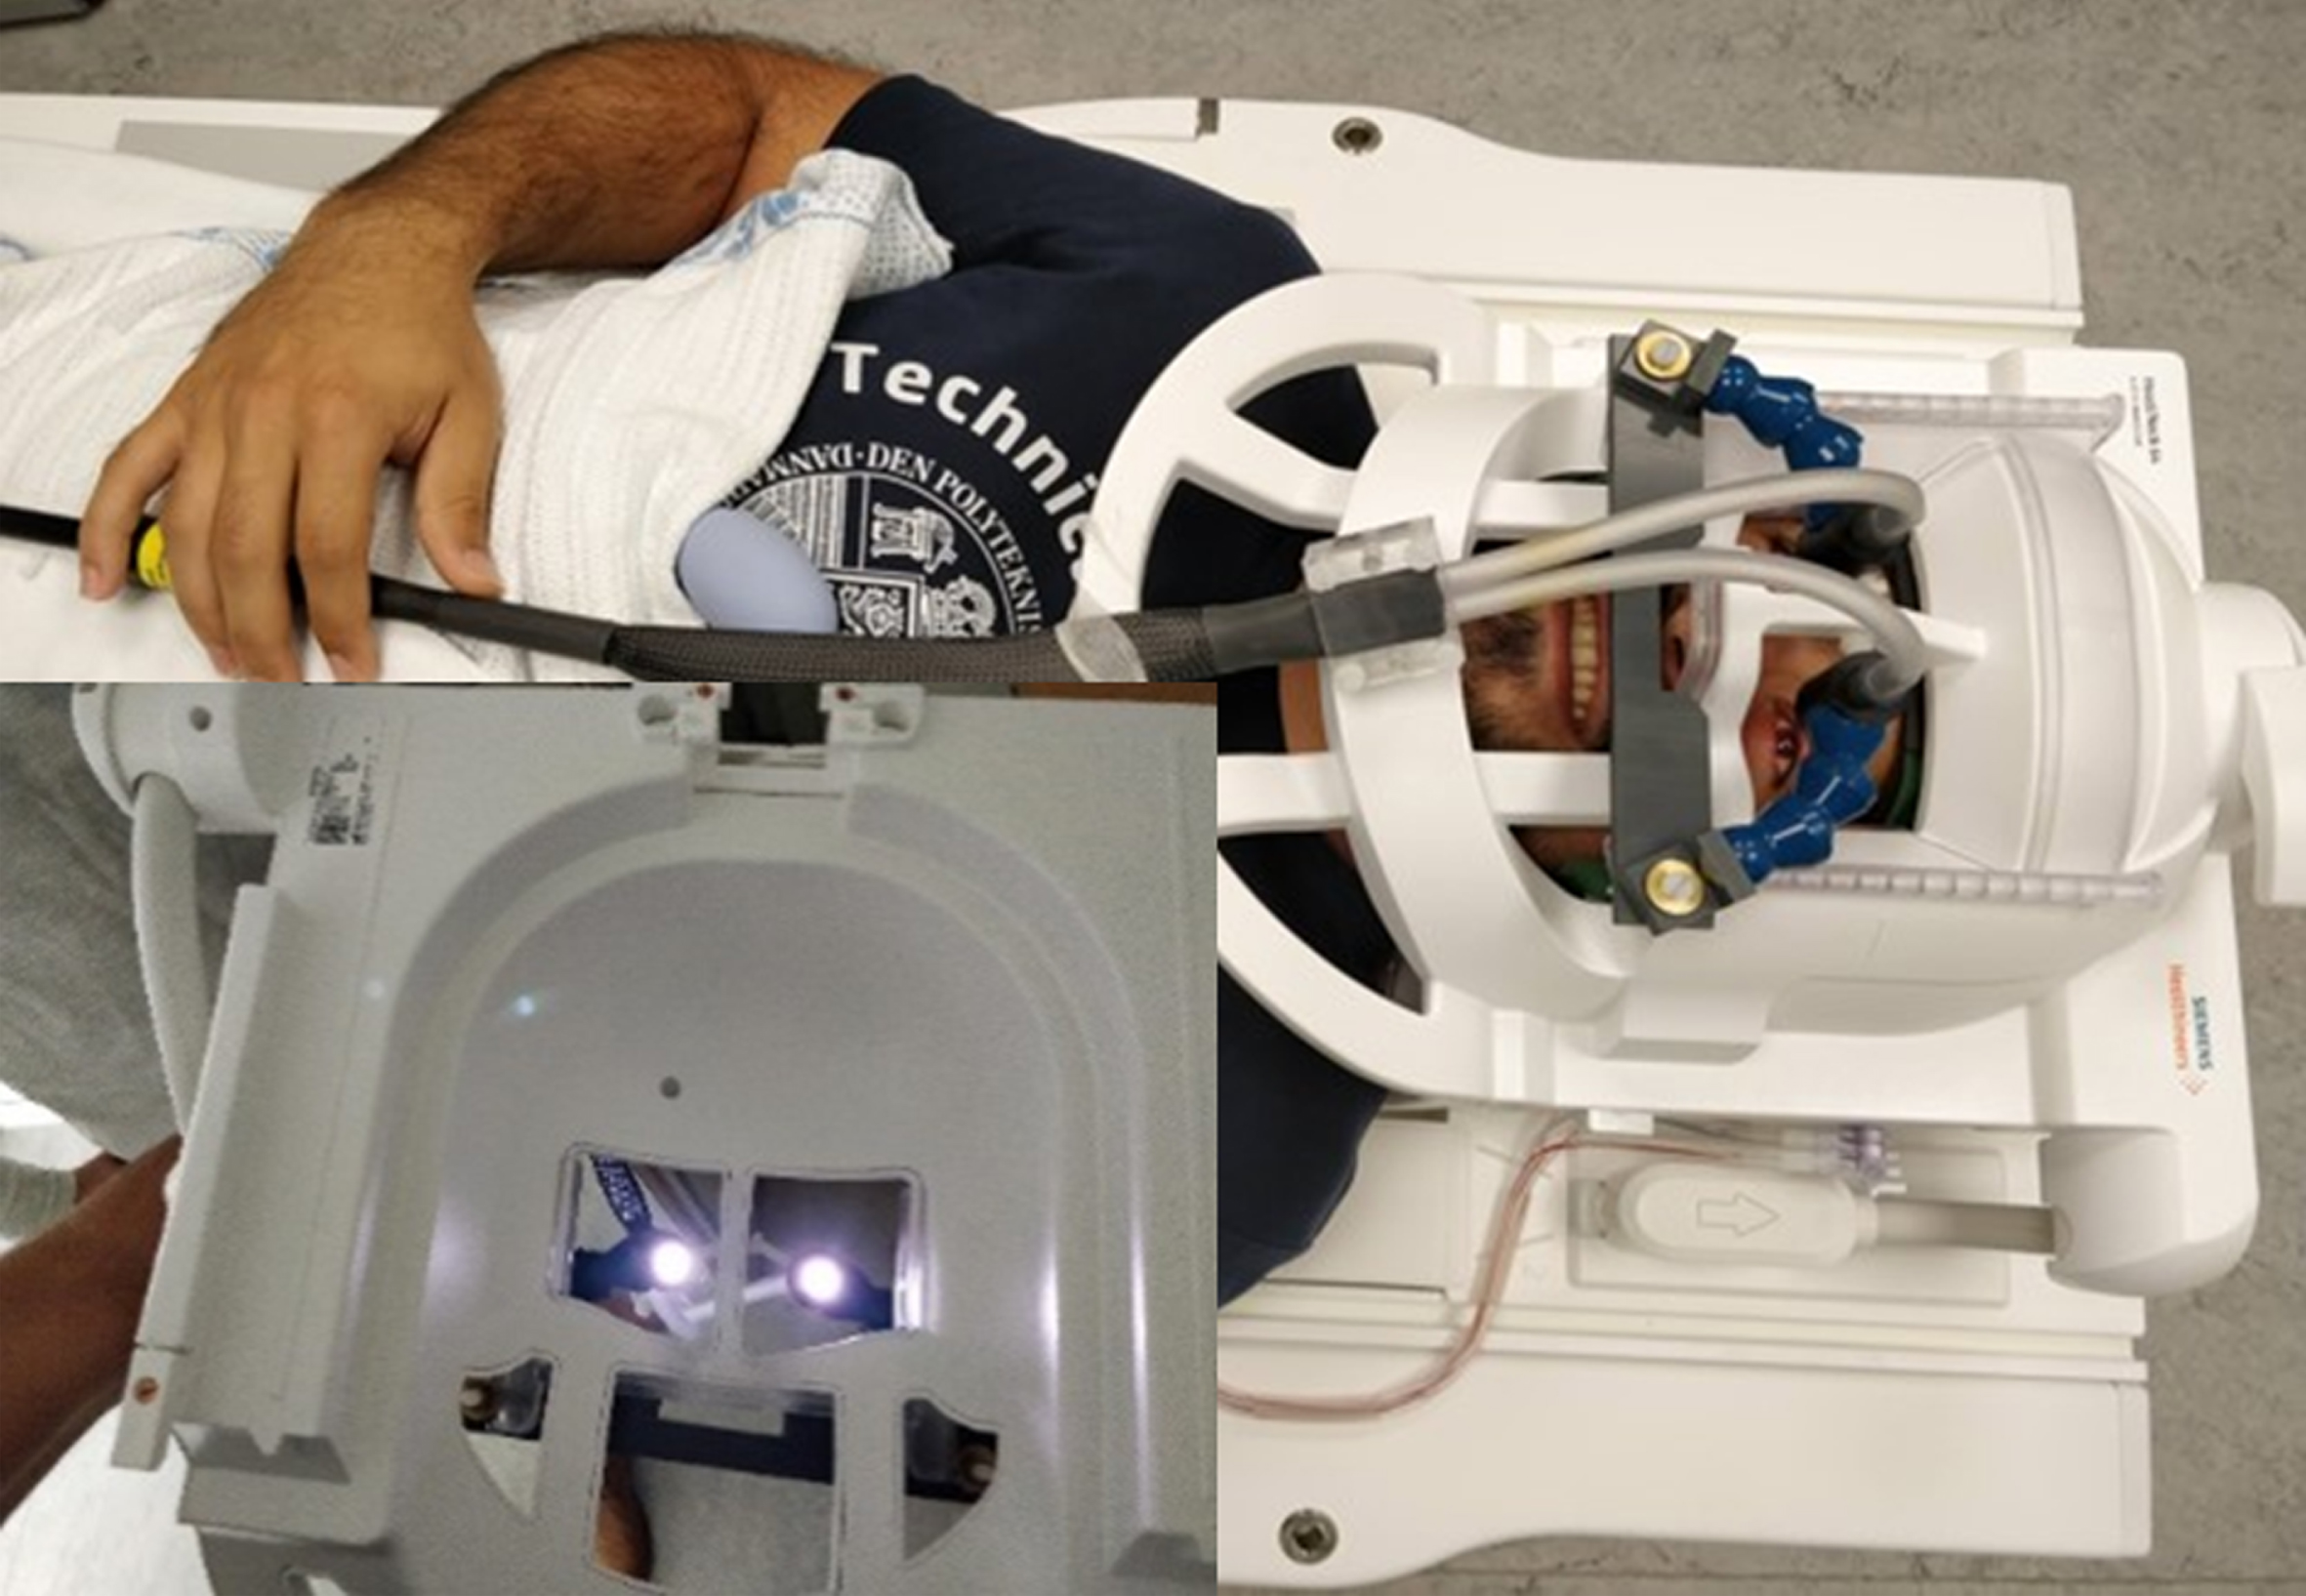
Each participant underwent an MRI examination on a 3T MR scanner (Siemens MAGNETOM Vida) with a 64-channel receive head coil. Light was projected to the scanner by a fiber optic cable, which was divided into a cable for each eye (Fig. 2). The fiber optic cable was positioned 5 cm from the medial corner of the eye resulting in the same light intensity at the level of the eye as during the EEG. High resolution anatomical T1 weighted MPRAGE images were acquired for reference with the following parameters: Slice thickness (ST) 0.9 mm, Field of view (FOV) 230 mm, Repetition time (TR) 2000 ms, Echo time (TE) 2.41 ms, Flip Angle (FA) 9 deg, and Acceleration Mode (AM) GRAPPA. Functional BOLD echo planar images were acquired for both the AB, ABC, and the control paradigms with the following parameters: ST 3.0 mm, FOV 192 mm, TR 1200 ms, TE 30.00 ms, FA 66 deg, AM SMS, and Slice order; interleaved within each multi slice block.
Fig. 2
Experimental setup in the MR scanner. Fiber optic cables projected light to the eyes of the subject within the MR scanner. Each fiber optic cable was positioned 5 cm from the medial corner of each eye to achieve equal light intensity at the level of the eyes to that used in the EEG setup.
Data analysis
Electroencephalography
Raw EEG recordings were manually pre-processed to identify bad channels, containing significant 50 Hz interference or no EEG related signals, and artefacts [22]. Analysis of the EEG recordings was done using MNE-Python [23]. Data was down sampled to 250 Hz, a zero-phase finite impulse response (FIR) high-pass filter with a hamming window and cutoff frequency at 1 Hz was applied along with a 50 Hz notch filter (zero phase FIR Notch filter at 50 Hz, hamming window and transition of 0.5 Hz), to reduced line noise. Data was then re-referenced using the reference electrode standardization technique (REST) in order to approximate a zero reference for each electrode [24].
The EEG recordings was then divided into epochs according to the conditions (non-flickering continuous light, 40 Hz ISF or 40 Hz stroboscopic light). Epochs containing artefacts were rejected from further analysis, and bad channels were interpolated using spherical splines [25]. The first and last 1 second of each stimulation epoch were rejected to avoid risk of synchronization inaccuracies. Power spectral density (PSD) was calculated using the Welch method with a 10-s window, 50% overlap, and zero padded to achieve a resolution of 0.05 Hz [26]. The signal to noise ratio for entrainment (SNR) were calculated as the ratio between the 40 Hz peak and the average power of the nearest frequencies located 2 Hz from the target frequency (40 Hz) as described [26, 27].
Functional magnetic resonance imaging
fMRI data were pre-processed using the SPM12 extension to MATLAB (MathWorks, Inc., Natick, MA USA). The fMRI volumes were realigned to the first volume of each series, and the slice-timing corrected. The volumes were then co-registered to the anatomical T1W MPRAGE and normalized to standard space (MNI) [28, 29]. Finally, the volumes were smoothed by an 8 mm Gaussian kernel. The initial fMRI data analysis was done by both a conventional mass-univariate approach [30] followed by a multi-variate pattern analysis (MVPA) [31, 32] seeking to decode stimulation conditions from the fMRI signal. Statistical significance for the mass univariate approach was determined by topological inference, corrected for the Benjamini-Hochberg false discovery rate [33].
The Python3 toolboxes, scikit-learn and ni-learn (v 0.8.1) [34, 35] were used for the MVPA to create a support vector classifier (SVC) for binary classification of the treatment conditions as previously demonstrated by [36]. The ABC paradigm was reduced to a two-class problem by excluding one condition per binary classification. To take into account the hemodynamic delay, the labels were shifted by 4 TRs corresponding to 4.8 s, and furthermore 4 TRs were discarded (two at the start and two at the end of each block) to eliminate potential transient effects. The model was trained and tested using cross-validation (CV) both within subjects and between subjects. As the conditions were balanced, the performance was evaluated by the prediction accuracy within and between subjects by leaving out 1/k of the data for within subject and an entire subject for between subjects. Significance of the accuracy was determined by random permutation tests [37,38] where labels were shuffled randomly to form an empirical null distribution of the accuracy. For details regarding the MVPA, See Supplementary Table 1.
Statistical analysis
A linear mixed effect model was applied to the EEG data to test significant difference in SNR peak of ISF compared to CON in the AB paradigm and ISF and STROBE compared to CON in the ABC paradigm. Both models included condition as a fixed effect and block and subject as a random effect. Higher-order interaction terms were insignificant except for interaction between condition and subject, and this term was thus kept in the reduced model. Tukey’s adjustment was used to control the family-wise error rate (FWER) at the α= 0.05 level for pairwise comparisons, and the Kenward-Roger approximation was used to estimate the degrees of freedom. Statistical tests were conducted in RStudio (R-4.0.4) [39] using lme4 (v. 1.1-27.1) [40] to model the data and lmerTest (v 3.1-3) [41].
Ethics
All participants in this study were able and provided an informed consent following thorough verbal and written information of the project. The project was approved be the local ethics committee (identification number: SJ-781).
RESULTS
In total, 13 participants were recruited, of these four females, and the median age was 25 years (range 21–41, mean 28). None of the participants had any history of systemic disease or disease of the central nervous system. All participants completed both EEG recording and MRI.
The 40 Hz ISF clearly induced 40 Hz neural oscillations compared to non-flickering light in both the AB (mean: 3.03, 95% confidence interval (CI) 2.07 to 3.99, p = 1.68835e–5) and the ABC paradigm (mean: 3.03, 95% confidence interval (CI) 1.17 to 4.08, p = 0.0012), most prominent in the posterior electrodes closest to the visual cortex (Figs. 3 and 4). When comparing the 40 Hz ISF to the 40 Hz stroboscopic light, the 40 Hz stroboscopic light induces a higher amplitude of 40 Hz neural oscillations than the 40 Hz ISF (mean: 9.01, 95% confidence interval (CI) 7.16 to 12.14, p = 7.0166e–14), but with a similar spatial distribution mostly prominent in the posterior electrodes near the visual cortex. Additionally, when comparing non-flickering light with 40 Hz stroboscopic light in the ABC paradigm, the 40 Hz stroboscopic light gives a significantly higher SNR value (mean: 12.04, 95% confidence interval (CI) 10.18 to 13.87, p = 2.9023e–11). The conditions did not significantly affect the rate of blinking or the heart rate (see Supplementary Figure 1).
Fig. 3
40 Hz neural activity from the AB paradigm. A) Shows the PSD for both continuous non-flickering light (CON) and 40 Hz ISF (ISF). The lower panel is zoomed in to more accurately represents frequencies around 40 Hz. B) Boxplot of signal-to-noise ratios (SNR) for both conditions. C) Topographical distribution of 40 Hz activity during exposure to continuous non-flickering light. D) As C, but for exposure to 40 Hz ISF. Note the difference in color bar to better visualize the spatial distributions of the induced 40 Hz neural activity.
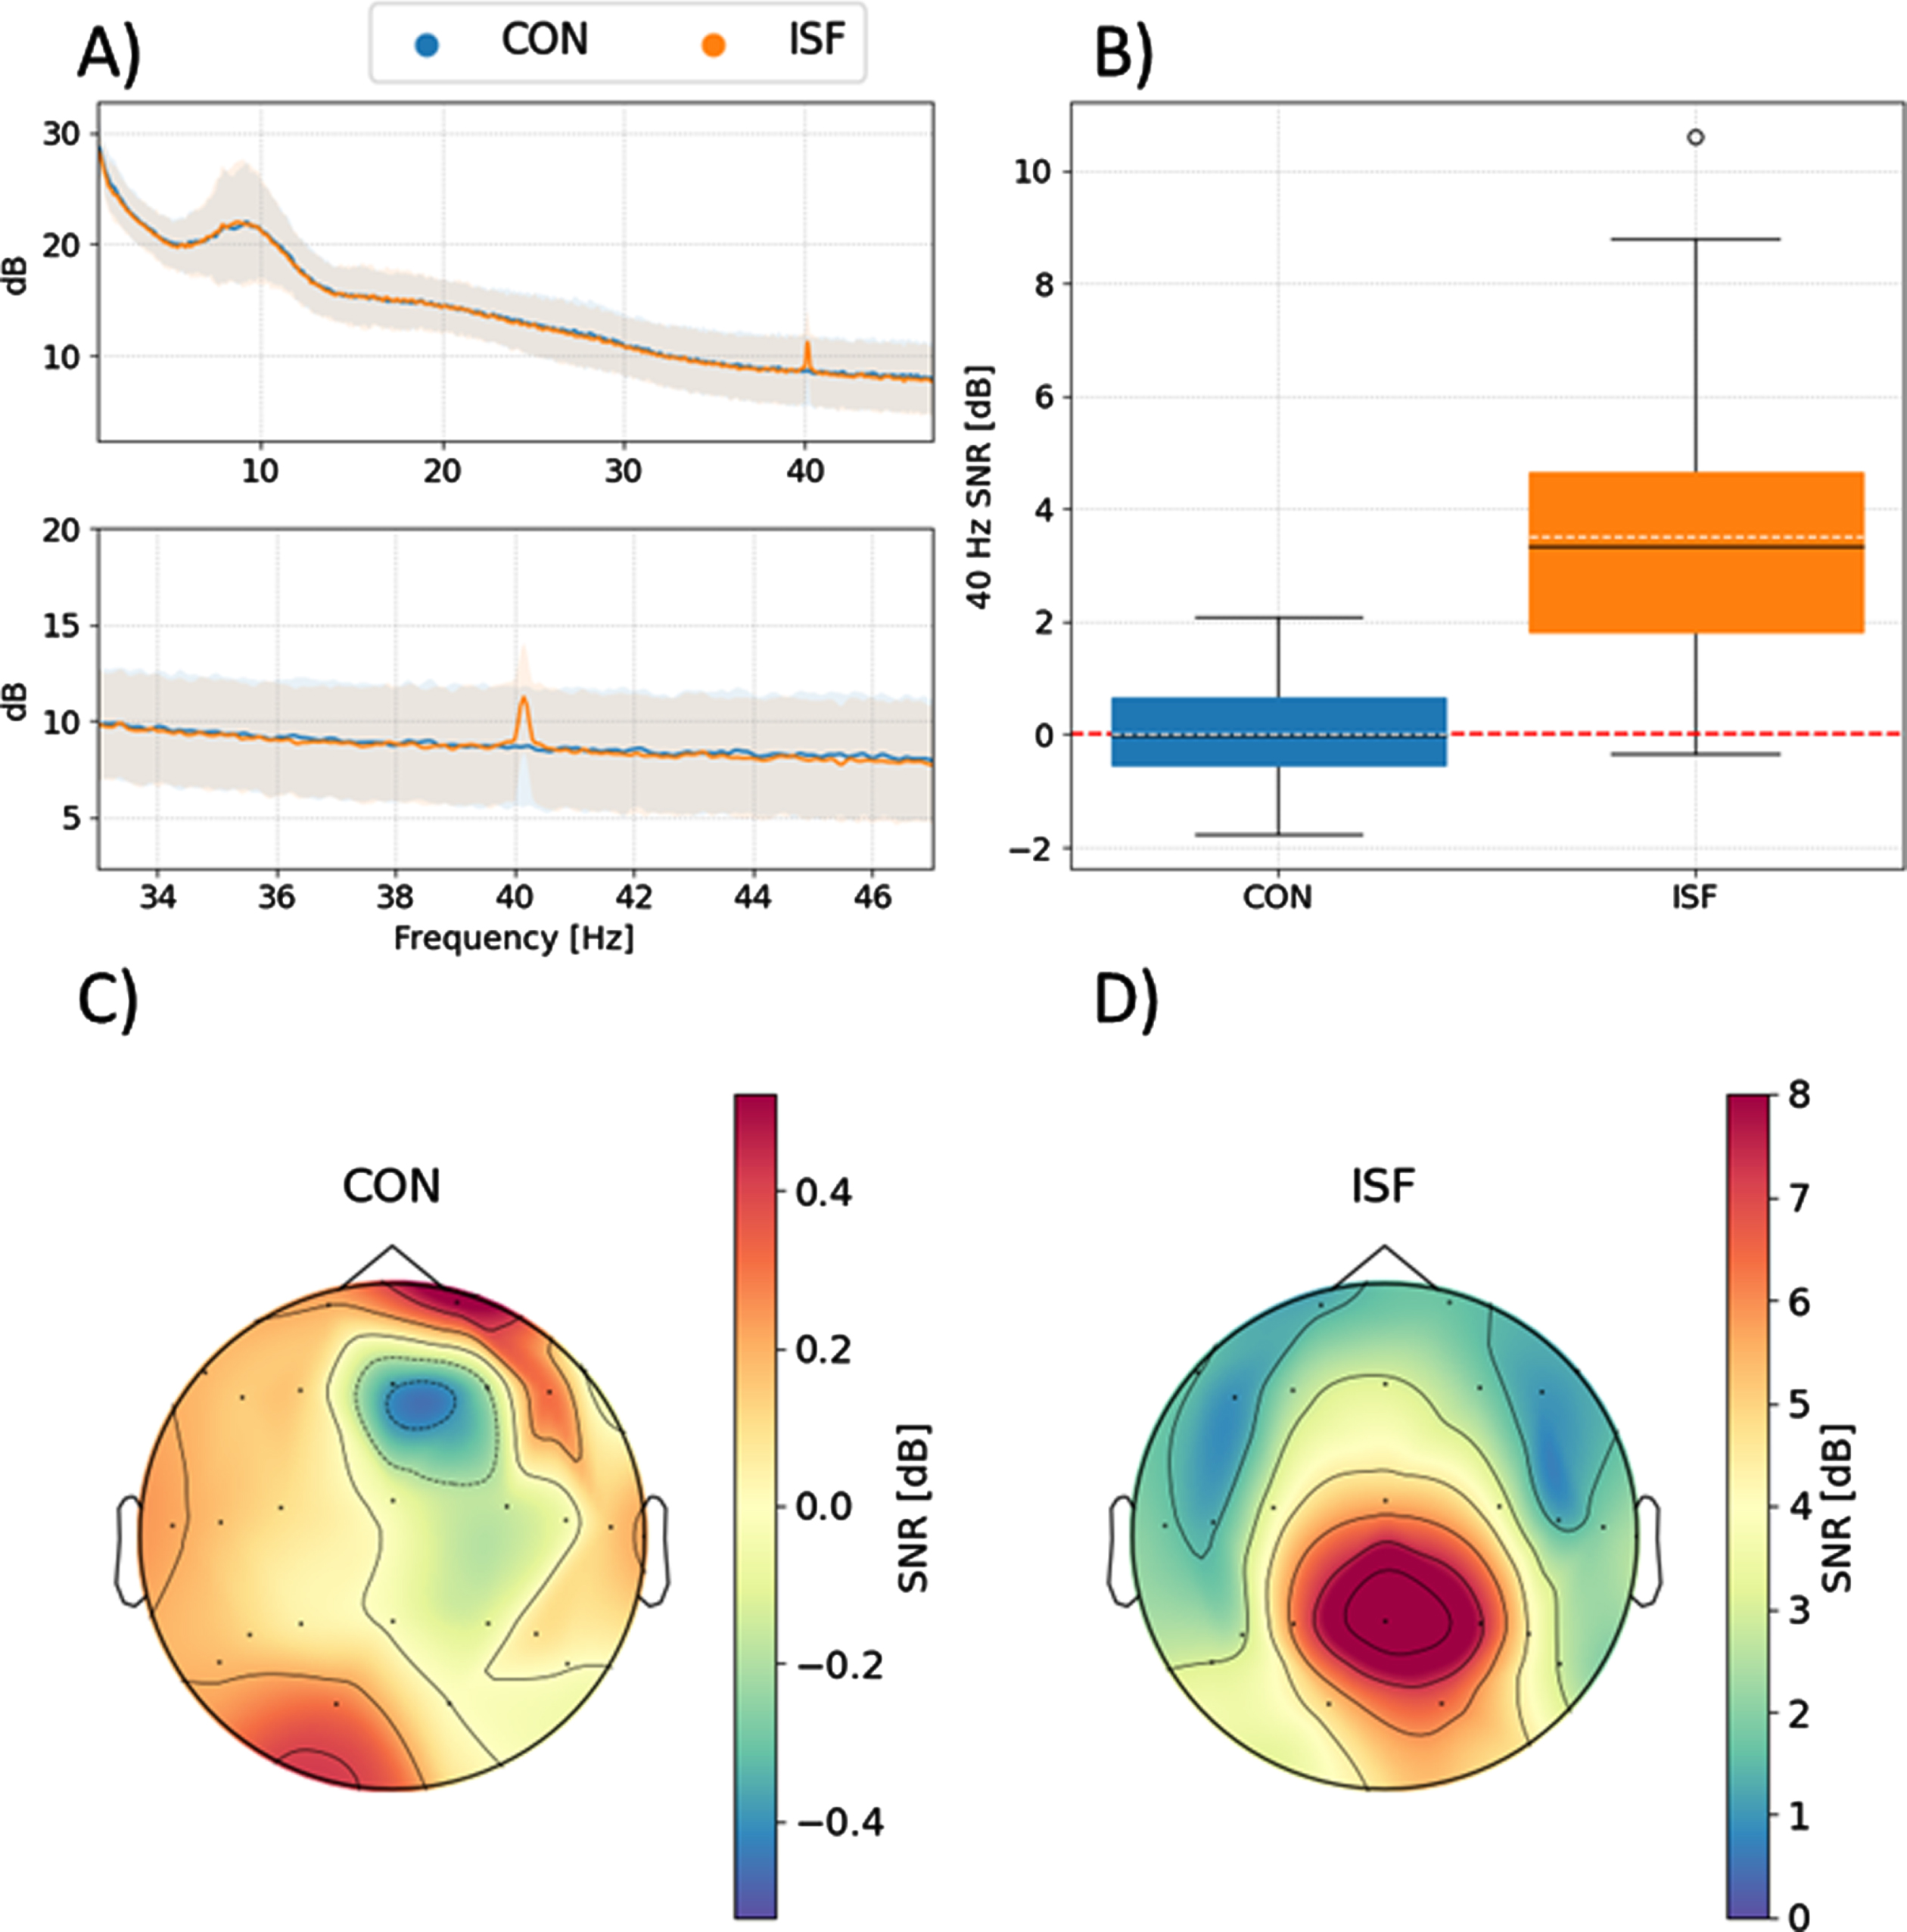
Fig. 4
40 Hz neural activity from the ABC paradigm. A) Shows the PSD for both continuous non-flickering light (CON), 40 Hz ISF (ISF), and 40 Hz stroboscopic light. The lower panel is zoomed in to more accurately represent frequencies around 40 Hz. B) Boxplot of signal-to-noise ratios for all three conditions. C) Topographical distribution of 40 Hz activity during exposure to continuous non-flickering light. D) As C, but for exposure to 40 Hz ISF. E) As C and D, but for 40 Hz stroboscopic light. Note the difference in color bar to better visualize the spatial distributions of the induced 40 Hz neural activity.

Traditional mass-univariate pattern analysis was the initial approach for analysis of the MRI data. As expected, this method did not identify any significant differences between the BOLD signal of the different conditions of light. However, as expected, clear difference in dominant regions of the visual system was observed when comparing no light versus non-flickering light in the control paradigm (see Supplementary Figure 2).
To further identify and characterize potential difference between the fMRI responses to the stimulation conditions an MVPA approach was applied. MVPA was able to discriminate significantly between the different conditions, however not with a high degree of accuracy (Fig. 5). The best accuracies were, not surprisingly, achieved for the control paradigm (accuracy = 93.6%, p = 0.0058). While the accuracy was higher, and reached statistical significance, in the comparison of 40 Hz stroboscopic light and non-flickering continuous light (accuracy = 77.2%, p = 0.011) than in the comparison of 40 Hz ISF and non-flickering continuous light (accuracy = 60.3, p = 0.17).
Fig. 5
Confusion matrices of the multivariate pattern analysis of within-subject comparison with 1000 permutations. A) AB paradigm comparing non-flickering continuous light to 40 Hz ISF. B) ABC paradigm comparing non-flickering continuous light to 40 Hz ISF. C) ABC paradigm comparing non-flickering continuous light to 40 Hz Stroboscopic light. D) Control paradigm testing no light stimulus against non-flickering lights.
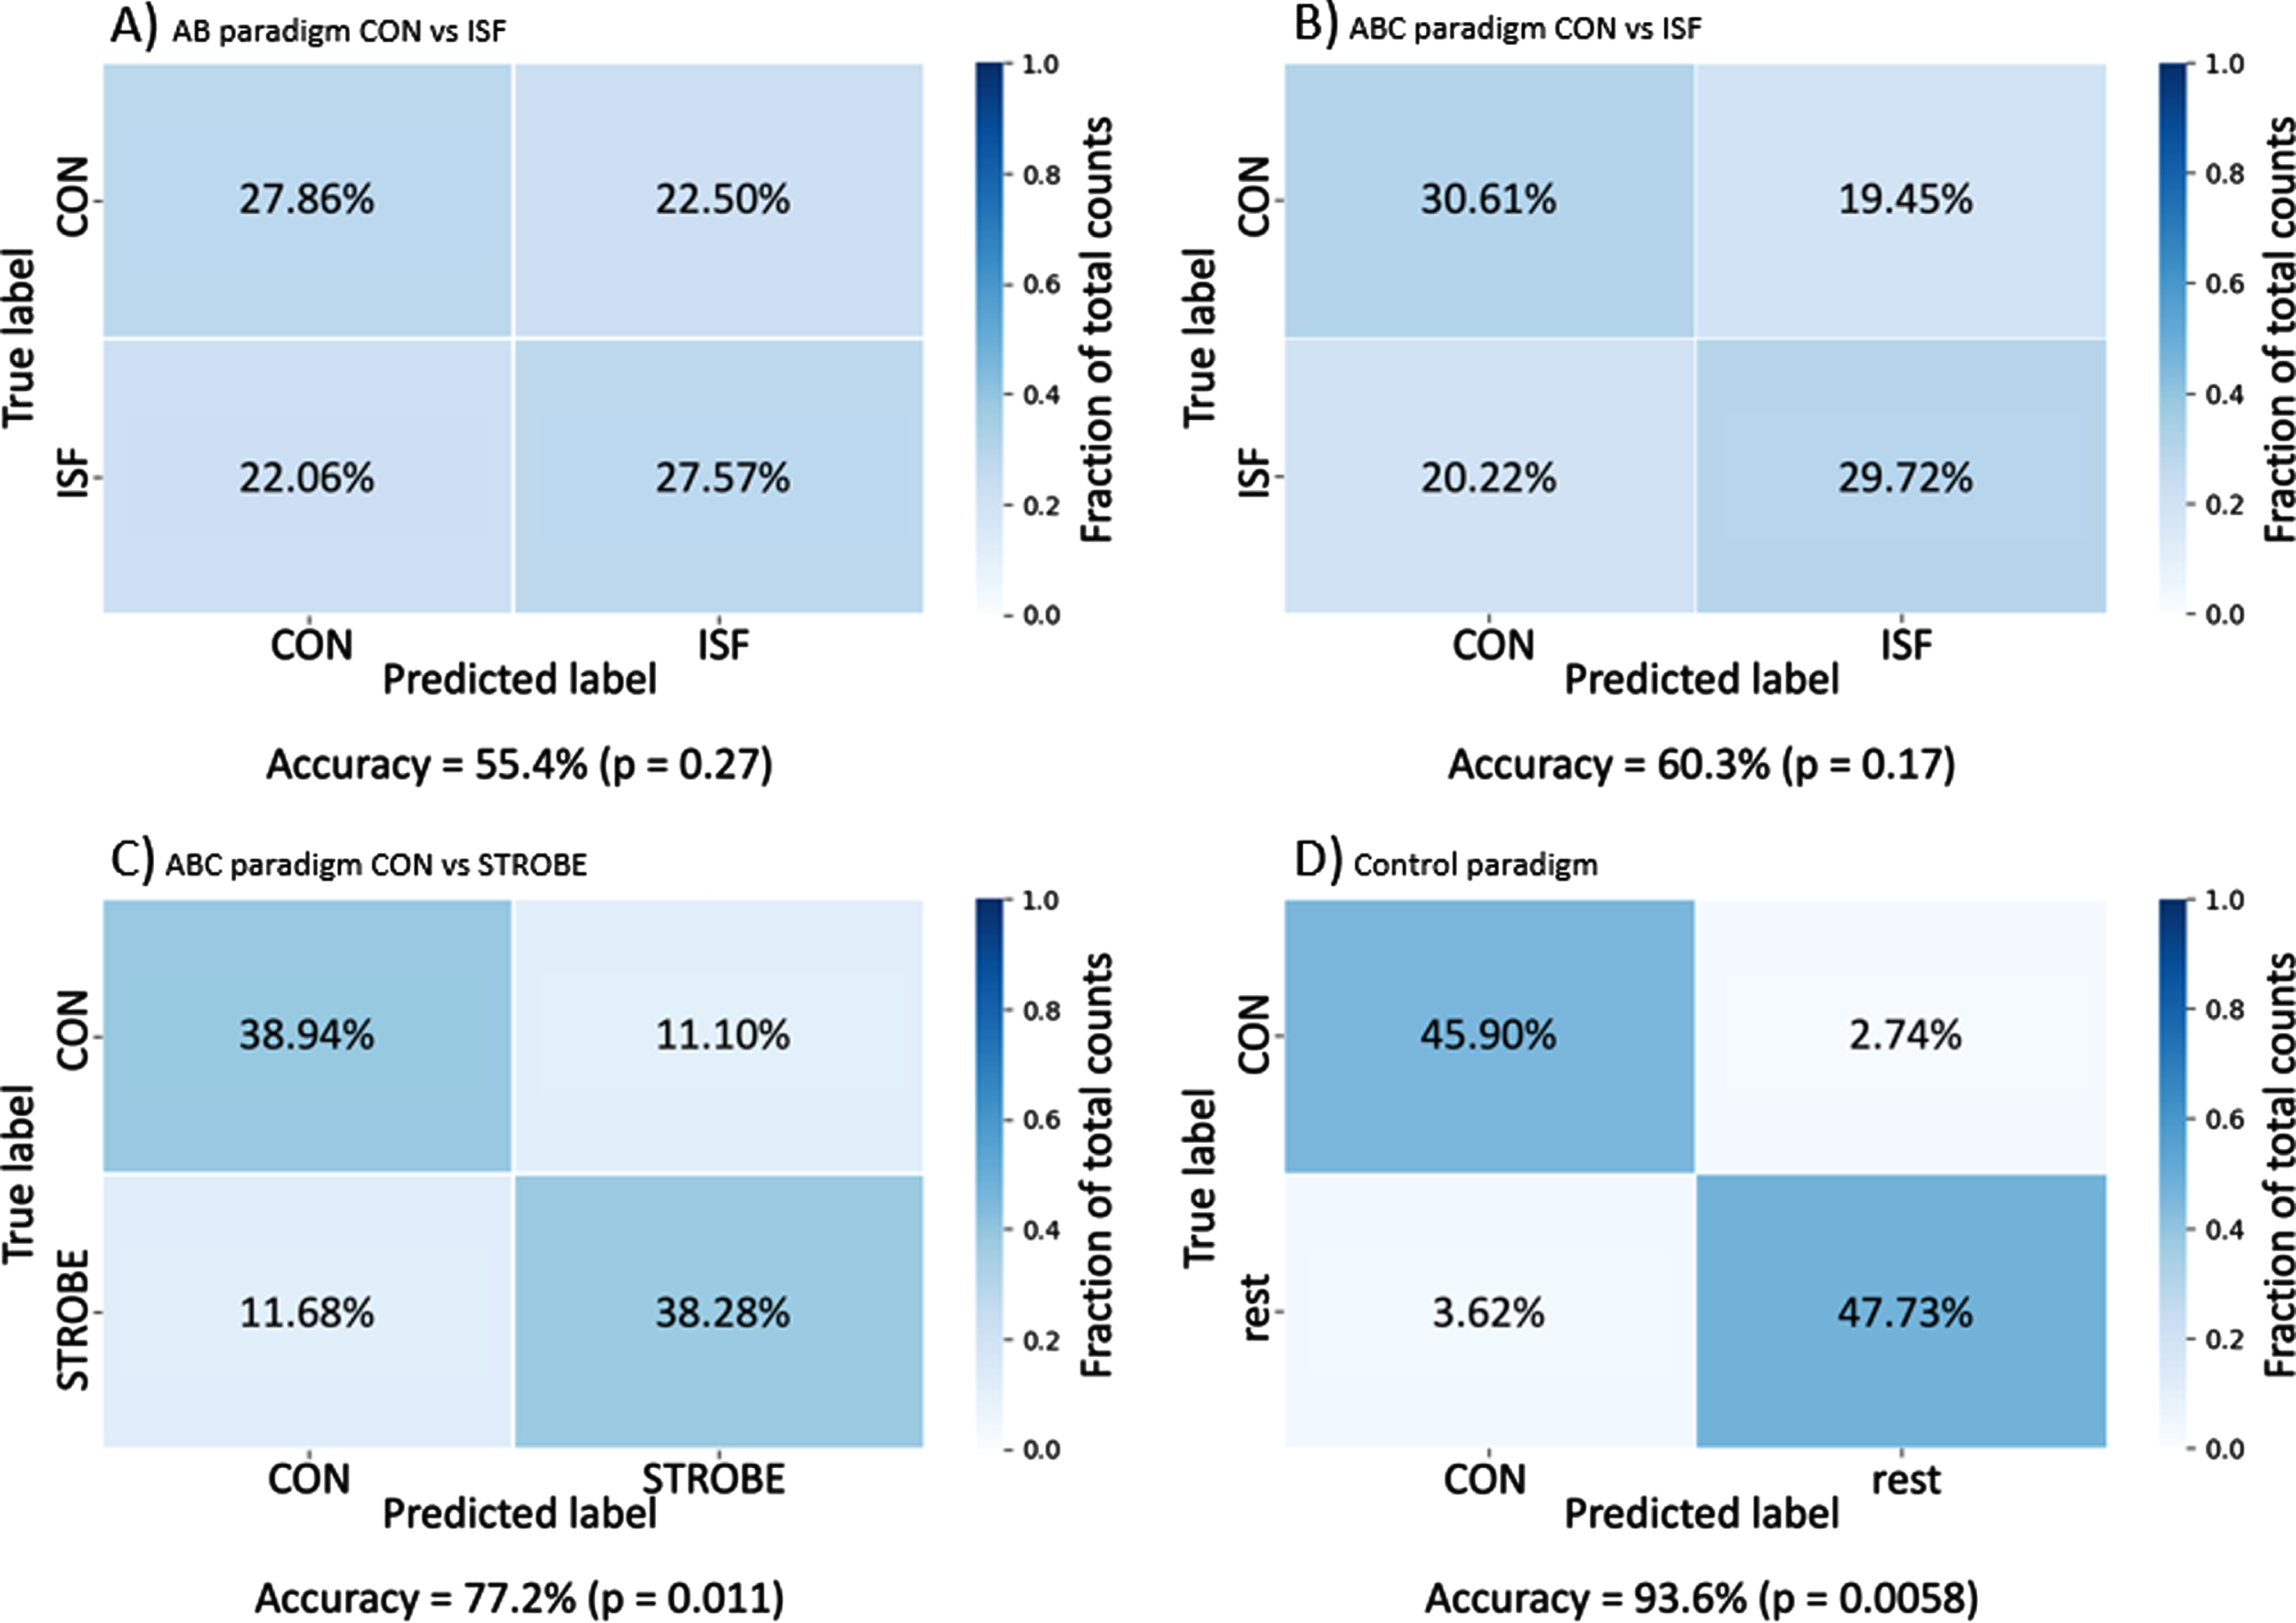
The difference in accuracy may be attributed to the difference in peak light intensity between the 40 Hz stroboscopic light and the other conditions. For the AB paradigm, the accuracy was slightly lower (accuracy 55.4%, p = 0.27) than in the ABC paradigm, perhaps due to the lower number of samples in the AB paradigm and thus a smaller data set for the classifier to learn from. Additional results from the between subjects comparison can be seen in Supplementary Figure 3.
DISCUSSION
Clinical trials testing non-invasive entrainment of 40 Hz neural oscillations with light are still limited, and all used 40 Hz stroboscopic light as the intervention and either no intervention [9] or non-flickering light as the control [10, 11]. The current study aimed to investigate the immediate effect of exposure to novel 40 Hz ISF in order to test whether 40 Hz ISF can generate 40 Hz entrainment similar to 40 Hz stroboscopic light. The effect was measured using EEG which showed 40 Hz entrainment during exposure to both 40 HZ ISF and 40 Hz stroboscopic light compared to non-flickering light. While the power of the immediate evoked response to ISF is far below that of stroboscopic light, it remains unclear whether the immediate power of the response determines the subsequent response or whether the spatial distribution, time above a certain (yet unknown) threshold, or other possible markers of effect are of most importance to the proposed neuroprotective effect[4–6, 42]. Other studies suggest that the spatial distribution of the evoked 40 Hz response is more important than the absolute power [5, 10].
A plausible explanation for the higher SNR during 40 Hz stroboscopic light than 40 Hz ISF may be the intensity of the light. In the current study, the intensity was matched at average intensity per second rather than peak light intensity. Furthermore, the 40 Hz entrainment in response to the 40 Hz stroboscopic light was high in comparison to other studies using various measures of entrainment amplitude [8, 10, 43, 44].
Traditional mass univariate analysis of the BOLD fMRI imaging only revealed subtle differences in the spatial distribution of BOLD signal between the different non-flickering light and neither 40 Hz ISF nor 40 Hz stroboscopic light, none of which were statistically significant. This is surprising as the BOLD signal has previously been shown to follow the same spatial distribution as the EEG when investigating steady state visually evoked potential (SSVEPs) responses [19] though most studies with frequencies above 30 Hz [20]. One explanation may be that the three conditions in this study stimulate the visual system through the same pathways as they are all isoluminant at average over time and have the same color temperature [45]; other studies using SSVEP used a no-light condition as control [19, 20]. Other studies using task-related gamma activity found BOLD signal to co-localize with the gamma activity; however, task related trials involve more complex neural processing than crude driven induced gamma to an external driver as in SSVEP and in this study. Another explanation may be that it the temporal smoothing induced by the hemodynamic response renders high frequency content impossible to observe directly using BOLD fMRI [46]. As the mass univariate analysis was not able to determine if any subcortical structures were affected by the 40 Hz entrainment in the ISF and STROBE conditions, a multivariate pattern analysis was applied.
In contrast to the mass univariate analysis, the more complex multivariate pattern analysis was able to predict the condition with some degree of accuracy. The multivariate pattern analysis on the other hand uses BOLD signal from all voxels to generate a prediction model. This prediction model may be affected by other derived effects of the conditions such as discomfort, eye strain, movement, etc., and as such, it will remain unclear whether the prediction model was based on BOLD signal directly related to the condition or derived effects such as the afore mentioned factors.
The physiological purpose of gamma activity has been a mystery for many years [47], but there seems to be a consensus that gamma activity is related to interneurons [42, 48], especially the parvalbumin positive interneurons [49, 50]. Rodent studies have found increased cognitive performance during induced gamma [51, 52], along with emerging evidence of a neuroprotective effect of daily induced gamma [4–6].
The relatively small number of participants and the fact that all participants were young and healthy limit the conclusions that can be drawn from this study. Although previous studies have determined that age does not significantly affect the 40 Hz gamma response [44] to stroboscopic light, it seems reasonable that patients with AD have a similar response as the visual acuity is not affected in patients with AD [53] and trials have found 40 Hz response to 40 Hz stroboscopic flicker in patients with AD [9, 10].
Despite the limited sample size, this study clearly indicates that significant entrainment of 40 Hz EEG activity is possible using 40 Hz ISF. It may be suggested that an increased sample size may have increased the sensitivity in the analysis of the fMRI BOLD images; however, based on the distribution of the individual observation this is unlikely.
The introduction of 40 Hz ISF may enable future clinical trials to have a true placebo intervention blinded for both the participants and the researchers. In addition, we propose that 40 Hz ISF is less strenuous to use and might as a result increase the adherence in future clinical trials. Unfortunately, this latter hypothesis is not tested in the current study and needs testing in future studies.
Conclusion
In conclusion, this study presents a novel method of non-invasive induction of 40 Hz neural oscillations with ISF. This enables the possibility of future randomized placebo-controlled clinical trials with acceptable double blinding due to the essentially imperceivable flicker. Finally, it is strongly anticipated that the level of discomfort is lower for 40 Hz ISF compared to 40 Hz stroboscopic light. However, this latter anticipation deserves more rigorous testing in future studies.
ACKNOWLEDGMENTS
The authors would like to acknowledge Martin Thorning-Schmidt for the help with creation of light spectra along with professor emeritus Carsten Erik Thomsen and MR technician Reza Aghasi for help with the setup of MR sequences.
Authors’ disclosures available online (https://www.j-alz.com/manuscript-disclosures/22-0081r1).
SUPPLEMENTARY MATERIAL
[1] The supplementary material is available in the electronic version of this article: https://dx.doi.org/10.3233/JAD-220081.
REFERENCES
[1] | GBD 2016 Dementia Collaborators ((2019) ) Global, regional, and national burden of Alzheimer’s disease and other dementias, 1990-2016: A systematic analysis for the Global Burden of Disease Study 2016. Lancet Neurol 18: , 88–106. |
[2] | Long JM , Holtzman DM ((2019) ) Alzheimer disease: An update on pathobiology and treatment strategies. Cell 179: , 312–339. |
[3] | Congdon EE , Sigurdsson EM ((2018) ) Tau-targeting therapies for Alzheimer disease. Nat Rev Neurol 14: , 399–415. |
[4] | Iaccarino HF , Singer AC , Martorell AJ , Rudenko A , Gao F , Gillingham TZ , Mathys H , Seo J , Kritskiy O , Abdurrob F , Adaikkan C , Canter RG , Rueda R , Brown EN , Boyden ES , Tsai L-H ((2016) ) Gamma frequency entrainment attenuates amyloid load and modifies microglia. Nature 540: , 230–235. |
[5] | Martorell AJ , Paulson AL , Suk H-J , Abdurrob F , Drummond GT , Guan W , Young JZ , Kim DN-W , Kritskiy O , Barker SJ , Mangena V , Prince SM , Brown EN , Chung K , Boyden ES , Singer AC , Tsai L-H ((2019) ) Multi-sensory gamma stimulation ameliorates Alzheimer’s-associated pathology and improves cognition. Cell 177: , 256–271.e22. |
[6] | Adaikkan C , Middleton SJ , Marco A , Pao P-C , Mathys H , Kim DN-W , Gao F , Young JZ , Suk H-J , Boyden ES , McHugh TJ , Tsai L-H ((2019) ) Gamma entrainment binds higher-order brain regions and offers neuroprotection. Neuron 102: , 929–943.e8. |
[7] | Herrmann CS ((2001) ) Human EEG responses to 1-100 Hz flicker: Resonance phenomena in visual cortex and their potential correlation to cognitive phenomena. Exp Brain Res 137: , 346–353. |
[8] | Jones M , McDermott B , Oliveira BL , O’Brien A , Coogan D , Lang M , Moriarty N , Dowd E , Quinlan L , Mc Ginley B , Dunne E , Newell D , Porter E , Elahi MA , O’ Halloran M , Shahzad A ((2019) ) Gamma band light stimulation in human case studies: Groundwork for potential Alzheimer’s disease treatment. J Alzheimers Dis 70: , 171–185. |
[9] | Ismail R , Hansen AK , Parbo P , Brændgaard H , Gottrup H , Brooks DJ , Borghammer P ((2018) ) The effect of 40-Hz light therapy on amyloid load in patients with prodromal and clinical Alzheimer’s disease. Int J Alzheimers Dis 2018: , 6852303. |
[10] | Chan D , Suk H-J , Jackson B , Milman NP , Stark D , Klerman EB , Kitchener E , Avalos VSF , Banerjee A , Beach SD , Blanchard J , Stearns C , Boes A , Uitermarkt B , Gander P , Howard M , Sternberg EJ , Nieto-Castanon A , Anteraper S , Whitfield-Gabrieli S , Brown EN , Boyden ES , Dickerson B , Tsai L-H ((2021) ) 40Hz sensory stimulation induces gamma entrainment and affects brain structure, sleep and cognition in patients with Alzheimer’s dementia. medRxiv, 2021.03.01.21252717. |
[11] | Cimenser A , Hempel E , Travers T , Strozewski N , Martin K , Malchano Z , Hajós M ((2021) ) Sensory-evoked 40-Hz gamma oscillation improves sleep and daily living activities in Alzheimer’s disease patients. Front Syst Neurosci 15: , 746859. |
[12] | Carstensen MS , Lindén J , Nguyen NM , Hansen HE , Feijóo Carrillo GM , Hansen LS , Corell DD , Broeng J , Kriegsfeld LJ , Petersen PM ((2020) ) 40 Hz invisible spectral flicker and its potential use in Alzheimer’s light therapy treatment. In Mechanisms of Photobiomodulation Therapy XV, HamblinMR, CarrollJD, AranyP, eds. SPIE, San Francisco, p. 20. |
[13] | Terman M , Terman JS ((2005) ) Light therapy for seasonal and nonseasonal depression: Efficacy, protocol, safety, and side effects. CNS Spectr 10: , 647–663. |
[14] | Liu C-R , Liou YM , Jou J-H ((2021) ) Pilot study of the effects of bright ambient therapy on dementia symptoms and cognitive function. Front Psychol 12: , 782160. |
[15] | Menon V , Crottaz-Herbette S ((2005) ) Combined EEG and fMRI studies of human brain function. Int Rev Neurobiol 66: , 291–321. |
[16] | Lachaux J-P , Fonlupt P , Kahane P , Minotti L , Hoffmann D , Bertrand O , Baciu M ((2007) ) Relationship between task-related gamma oscillations and BOLD signal: New insights from combined fMRI and intracranial EEG. Hum Brain Mapp 28: , 1368–1375. |
[17] | Leicht G , Björklund J , Vauth S , Mußmann M , Haaf M , Steinmann S , Rauh J , Mulert C ((2021) ) Gamma-band synchronisation in a frontotemporal auditory information processing network. Neuroimage 239: , 118307. |
[18] | Mulert C , Leicht G , Hepp P , Kirsch V , Karch S , Pogarell O , Reiser M , Hegerl U , Jäger L , Moller HJ , McCarley RW ((2010) ) Single-trial coupling of the gamma-band response and the corresponding BOLD signal. Neuroimage 49: , 2238–2247. |
[19] | Bayram A , Bayraktaroglu Z , Karahan E , Erdogan B , Bilgic B , Özker M , Kasikci I , Duru AD , Ademoglu A , Öztürk C , Arikan K , Tarhan N , Demiralp T ((2011) ) Simultaneous EEG/fMRI analysis of the resonance phenomena in steady-state visual evoked responses. Clin EEG Neurosci 42: , 98–106. |
[20] | Emir UE , Bayraktaroglu Z , Ozturk C , Ademoglu A , Demiralp T ((2008) ) Changes in BOLD transients with visual stimuli across 1–44Hz. Neurosci Lett 436: , 185–188. |
[21] | Murta T , Chaudhary UJ , Tierney TM , Dias A , Leite M , Carmichael DW , Figueiredo P , Lemieux L ((2017) ) Phase–amplitude coupling and the BOLD signal: A simultaneous intracranial EEG (icEEG) - fMRI study in humans performing a finger-tapping task. NeuroImage 146: , 438–451. |
[22] | Stern JM , Engel J ((2013) ) Atlas of EEG patterns chapter 4, Wolters Kluwer Lippincott Williams & Wilkins, Philadelphia. |
[23] | Gramfort A ((2013) ) MEG and EEG data analysis with MNE-Python. Front Neurosci 7: , 267. |
[24] | Yao D ((2001) ) A method to standardize a reference of scalp EEG recordings to a point at infinity. Physiol Meas 22: , 693–711. |
[25] | Perrin F , Pernier J , Bertrand O , Echallier JF ((1989) ) Spherical splines for scalp potential and current density mapping. Electroencephalogr Clin Neurophysiol 72: , 184–187. |
[26] | Meigen T , Bach M ((1999) ) On the statistical significance of electrophysiological steady-state responses. Doc Ophthalmol Adv Ophthalmol 98: , 207–232. |
[27] | Norcia AM , Appelbaum LG , Ales JM , Cottereau BR , Rossion B ((2015) ) The steady-state visual evoked potential in vision research: A review. J Vis 15: , 4. |
[28] | Ashburner J , Friston KJ ((2005) ) Unified segmentation. Neuroimage 26: , 839–851. |
[29] | Evans AC , Collins DL , Mills SR , Brown ED , Kelly RL , Peters TM ((1993) ) 3D statistical neuroanatomical models from 305 MRI volumes. In 1993 IEEE Conference Record Nuclear Science Symposium and Medical Imaging Conference IEEE, San Francisco, CA, USA, pp. 1813–1817. |
[30] | ((2007) ), Statistical Parametric Mapping, Elsevier. |
[31] | Rivolta D , Woolgar A , Palermo R , Butko M , Schmalzl L , Williams MA ((2014) ) Multi-voxel pattern analysis (MVPA) reveals abnormal fMRI activity in both the “core” and “extended” face network in congenital prosopagnosia. Front Hum Neurosci 8: , 925. |
[32] | Haxby JV , Gobbini MI , Furey ML , Ishai A , Schouten JL , Pietrini P ((2001) ) Distributed and overlapping representations of faces and objects in ventral temporal cortex. Science 293: , 2425–2430. |
[33] | Benjamini Y , Hochberg Y ((1995) ) Controlling the false discovery rate: A practical and powerful approach to multiple testing. J R Stat Soc Ser B Methodol 57: , 289–300. |
[34] | Pedregosa F , Varoquaux G , Gramfort A , Michel V , Thirion B , Grisel O , Blondel M , Prettenhofer P , Weiss R , Dubourg V , Vanderplas J , Passos A , Cournapeau D , Brucher M , Perrot M , Duchesnay É ((2011) ) Scikit-learn: Machine learning in Python. J Mach Learn Res 12: , 2825–2830. |
[35] | Abraham A , Pedregosa F , Eickenberg M , Gervais P , Mueller A , Kossaifi J , Gramfort A , Thirion B , Varoquaux G ((2014) ) Machine learning for neuroimaging with scikit-learn. Front Neuroinformatics 8: , 14. |
[36] | Laconte S , Strother S , Cherkassky V , Anderson J , Hu X ((2005) ) Support vector machines for temporal classification of block design fMRI data. Neuroimage 26: , 317–329. |
[37] | Ojala M , Garriga GC ((2009) ) Permutation tests for studying classifier performance. In 2009 Ninth IEEE International Conference on Data Mining IEEE, Miami Beach, FL, USA, pp. 908–913. |
[38] | Nichols TE , Holmes AP ((2002) ) Nonparametric permutation tests for functional neuroimaging: A primer with examples. Hum Brain Mapp 15: , 1–25. |
[39] | RStudio Team ((2015) ) RStudio: Integrated Development Environment for R, Boston MA. |
[40] | Bates D , Mächler M , Bolker B , Walker S ((2015) ) Fitting Linear Mixed-Effects Models Using lme4. J Stat Softw 67: , 1–48. |
[41] | Kuznetsova A , Brockhoff PB , Christensen RHB ((2017) ) lmerTest Package: Tests in linear mixed effects models. J Stat Softw 82: , 1–26. |
[42] | Adaikkan C , Tsai L-H ((2020) ) Gamma entrainment: Impact on neurocircuits, glia, and therapeutic opportunities. Trends Neurosci 43: , 24–41. |
[43] | Suzuki Y , Minami T , Nakauchi S ((2019) ) Pupil constriction in the glare illusion modulates the steady-state visual evoked potentials. Neuroscience 416: , 221–228. |
[44] | Zibrandtsen IC , Agger M , Kjaer TW ((2020) ) Gamma entrainment in a large retrospective cohort: Implications for photic stimulation therapy for Alzheimer’s disease. J Alzheimers Dis 75: , 1181–1190. |
[45] | Vialatte F-B , Maurice M , Dauwels J , Cichocki A ((2010) ) Steady-state visually evoked potentials: Focus on essential paradigms and future perspectives. Prog Neurobiol 90: , 418–438. |
[46] | Josephs O , Henson RNA ((1999) ) Event-related functional magnetic resonance imaging: Modelling, inference and optimization. Philos Trans R Soc Lond B Biol Sci 354: , 1215–1228. |
[47] | Sohal VS ((2016) ) How close are we to understanding what (if anything) oscillations do in cortical circuits? J Neurosci 36: , 10489–10495. |
[48] | Buzsáki G , Wang X-J ((2012) ) Mechanisms of gamma oscillations. Annu Rev Neurosci 35: , 203–225. |
[49] | Cardin JA , Carlén M , Meletis K , Knoblich U , Zhang F , Deisseroth K , Tsai L-H , Moore CI ((2009) ) Driving fast-spiking cells induces gamma rhythm and controls sensory responses. Nature 459: , 663–667. |
[50] | Sohal VS , Zhang F , Yizhar O , Deisseroth K ((2009) ) Parvalbumin neurons and gamma rhythms enhance cortical circuit performance. Nature 459: , 698–702. |
[51] | Siegle JH , Pritchett DL , Moore CI ((2014) ) Gamma-range synchronization of fast-spiking interneurons can enhance detection of tactile stimuli. Nat Neurosci 17: , 1371–1379. |
[52] | Kim H , Ährlund-Richter S , Wang X , Deisseroth K , Carlén M ((2016) ) Prefrontal parvalbumin neurons in control of attention. Cell 164: , 208–218. |
[53] | Rizzo M ((2000) ) Vision and cognition in Alzheimer’s disease. Neuropsychologia 38: , 1157–1169. |


