
Plasma Glial Fibrillary Acidic Protein Levels Differ Along the Spectra of Amyloid Burden and Clinical Disease Stage
[Journal of Alzheimer’s Disease 78(1), 2020, 265-276, DOI 10.3233/JAD-200755]
https://content.iospress.com/articles/journal-of-alzheimers-disease/jad200755
After publication of the article, the authors were alerted to a minor error with the amyloid PET SUVR-to-Centiloids conversion equation for the subset of participants scanned with the Pittsburgh Compound B tracer. The error involved the constant term in the conversion equation (not the multiplier). The authors quickly re-analyzed the relevant data and here below note the changes to some of the statistical outcomes in the study. There were no changes warranting updated interpretations/discussion points.
In the Abstract: Results section on p. 265, the bold text has changed from the original publication:
Results: In both cohorts, plasma GFAP increased linearly with Aβ-PET CLs in clinically normal older adults. In Cohort 2, which included participants with more severe clinical dysfunction and Aβ-PET burden, the association between Aβ and GFAP became curvilinear (inverted U-shape; quadratic model R2 change = .158, p = .01), and Aβ-PET interacted with CDR-SB (R2 change = .169, p = .006): older adults with intermediate functional impairment (CDR-SB=0.5-4.0) showed a weak (negative) association between Aβ-PET CLs and plasma GFAP, while older adults with dementia (CDR-SB > 4.0) showed a strong, negative association of higher Aβ-PET CLs with lower plasma GFAP.
In the METHODS: Amyloid PET Imaging section on p. 267-268, the bold text has changed from the original publication:
Amyloid PET Imaging
Cortical Aβ deposition was defined by PET completed with either 11C-Pittsburgh compound B (PiB; N = 22 [60%] of Cohort 2 participants) or 18F-florbetapir (N = 50 [100%] of Cohort 1, N = 15 [40%] of Cohort 2). Standardized uptake value ratios (SUVR) were calculated and then converted to the Centiloids (CLs) scale to harmonize data across the two tracers [22]. The Centiloids conversion is used to calibrate Aβ-PET measurements acquired with different tracers and analytic pipelines to a common scale. A value of 100 CLs corresponds with the average degree of Aβ deposition observed on PET imaging in patients diagnosed with mild-moderate Alzheimer’s dementia, while a value of 0 CLs corresponds to mean uptake in healthy young controls devoid of Aβ pathology [22]. We used continuous CL values for regression analyses, but report Aβ-PET positivity frequencies based on processing pipeline- and tracer-specific thresholds: PiB SUVR > 1.21 (8.6 CLs); florbetapir SUVR > 1.11 (22.5 CLs). See Supplemental Methods for more details.
In the RESULTS: Cohort Demographics section on p. 268-269, the bold text has changed from the original publication:
Cohort Demographics
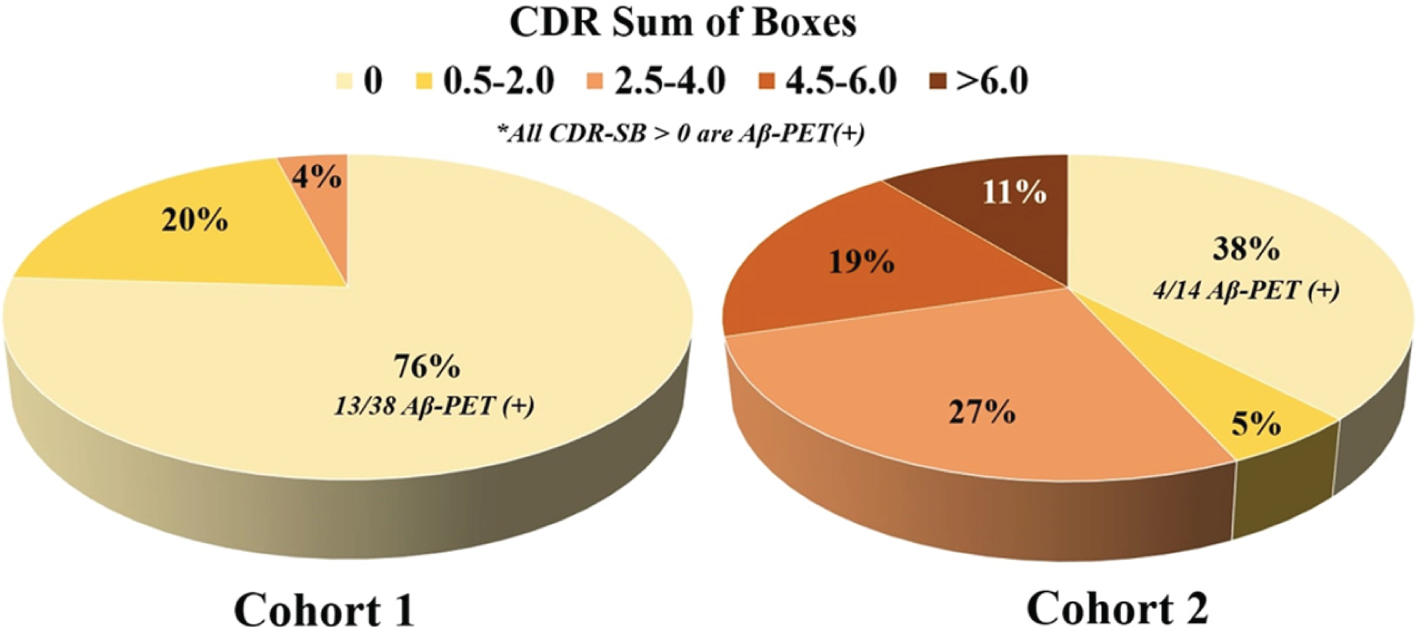
Participant characteristics stratified by study cohort are summarized in Table 1. There were no statistically significant differences between cohorts in age, sex, education, race, or frequency of APOE e4 carriers. As expected based on inclusion of more MCI and dementia participants, Cohort 2 had higher average Aβ-PET CLs (64.9 vs. 36.6 CLs, p = .004), was more likely to be Aβ-PET positive (73%vs. 50%, p = .03), had worse global cognition (Mini Mental State Examination; median score 27 vs. 29, p < .001), and had higher CDR-SB scores (Figure 1; p < .001). Plasma GFAP was not significantly associated with plasma NfL after controlling for age and sex in Cohort 1 (β=0.175, p = .19) but showed a significant positive association in Cohort 2 (β=0.584, p < .001). There was no significant difference in plasma GFAP concentrations between APOE e4 carriers and non-carriers in either Cohort 1 (t = 0.978, p = .33) or Cohort 2 (t = –1.078, p = .29).
Figure 1
Clinical disease stage breakdown of Cohort 1 and Cohort 2.
In the RESULTS: A β-PET Association with Plasma GFAP section on p.269, the bold text has changed from the original publication:
Aβ-PET Association with Plasma GFAP
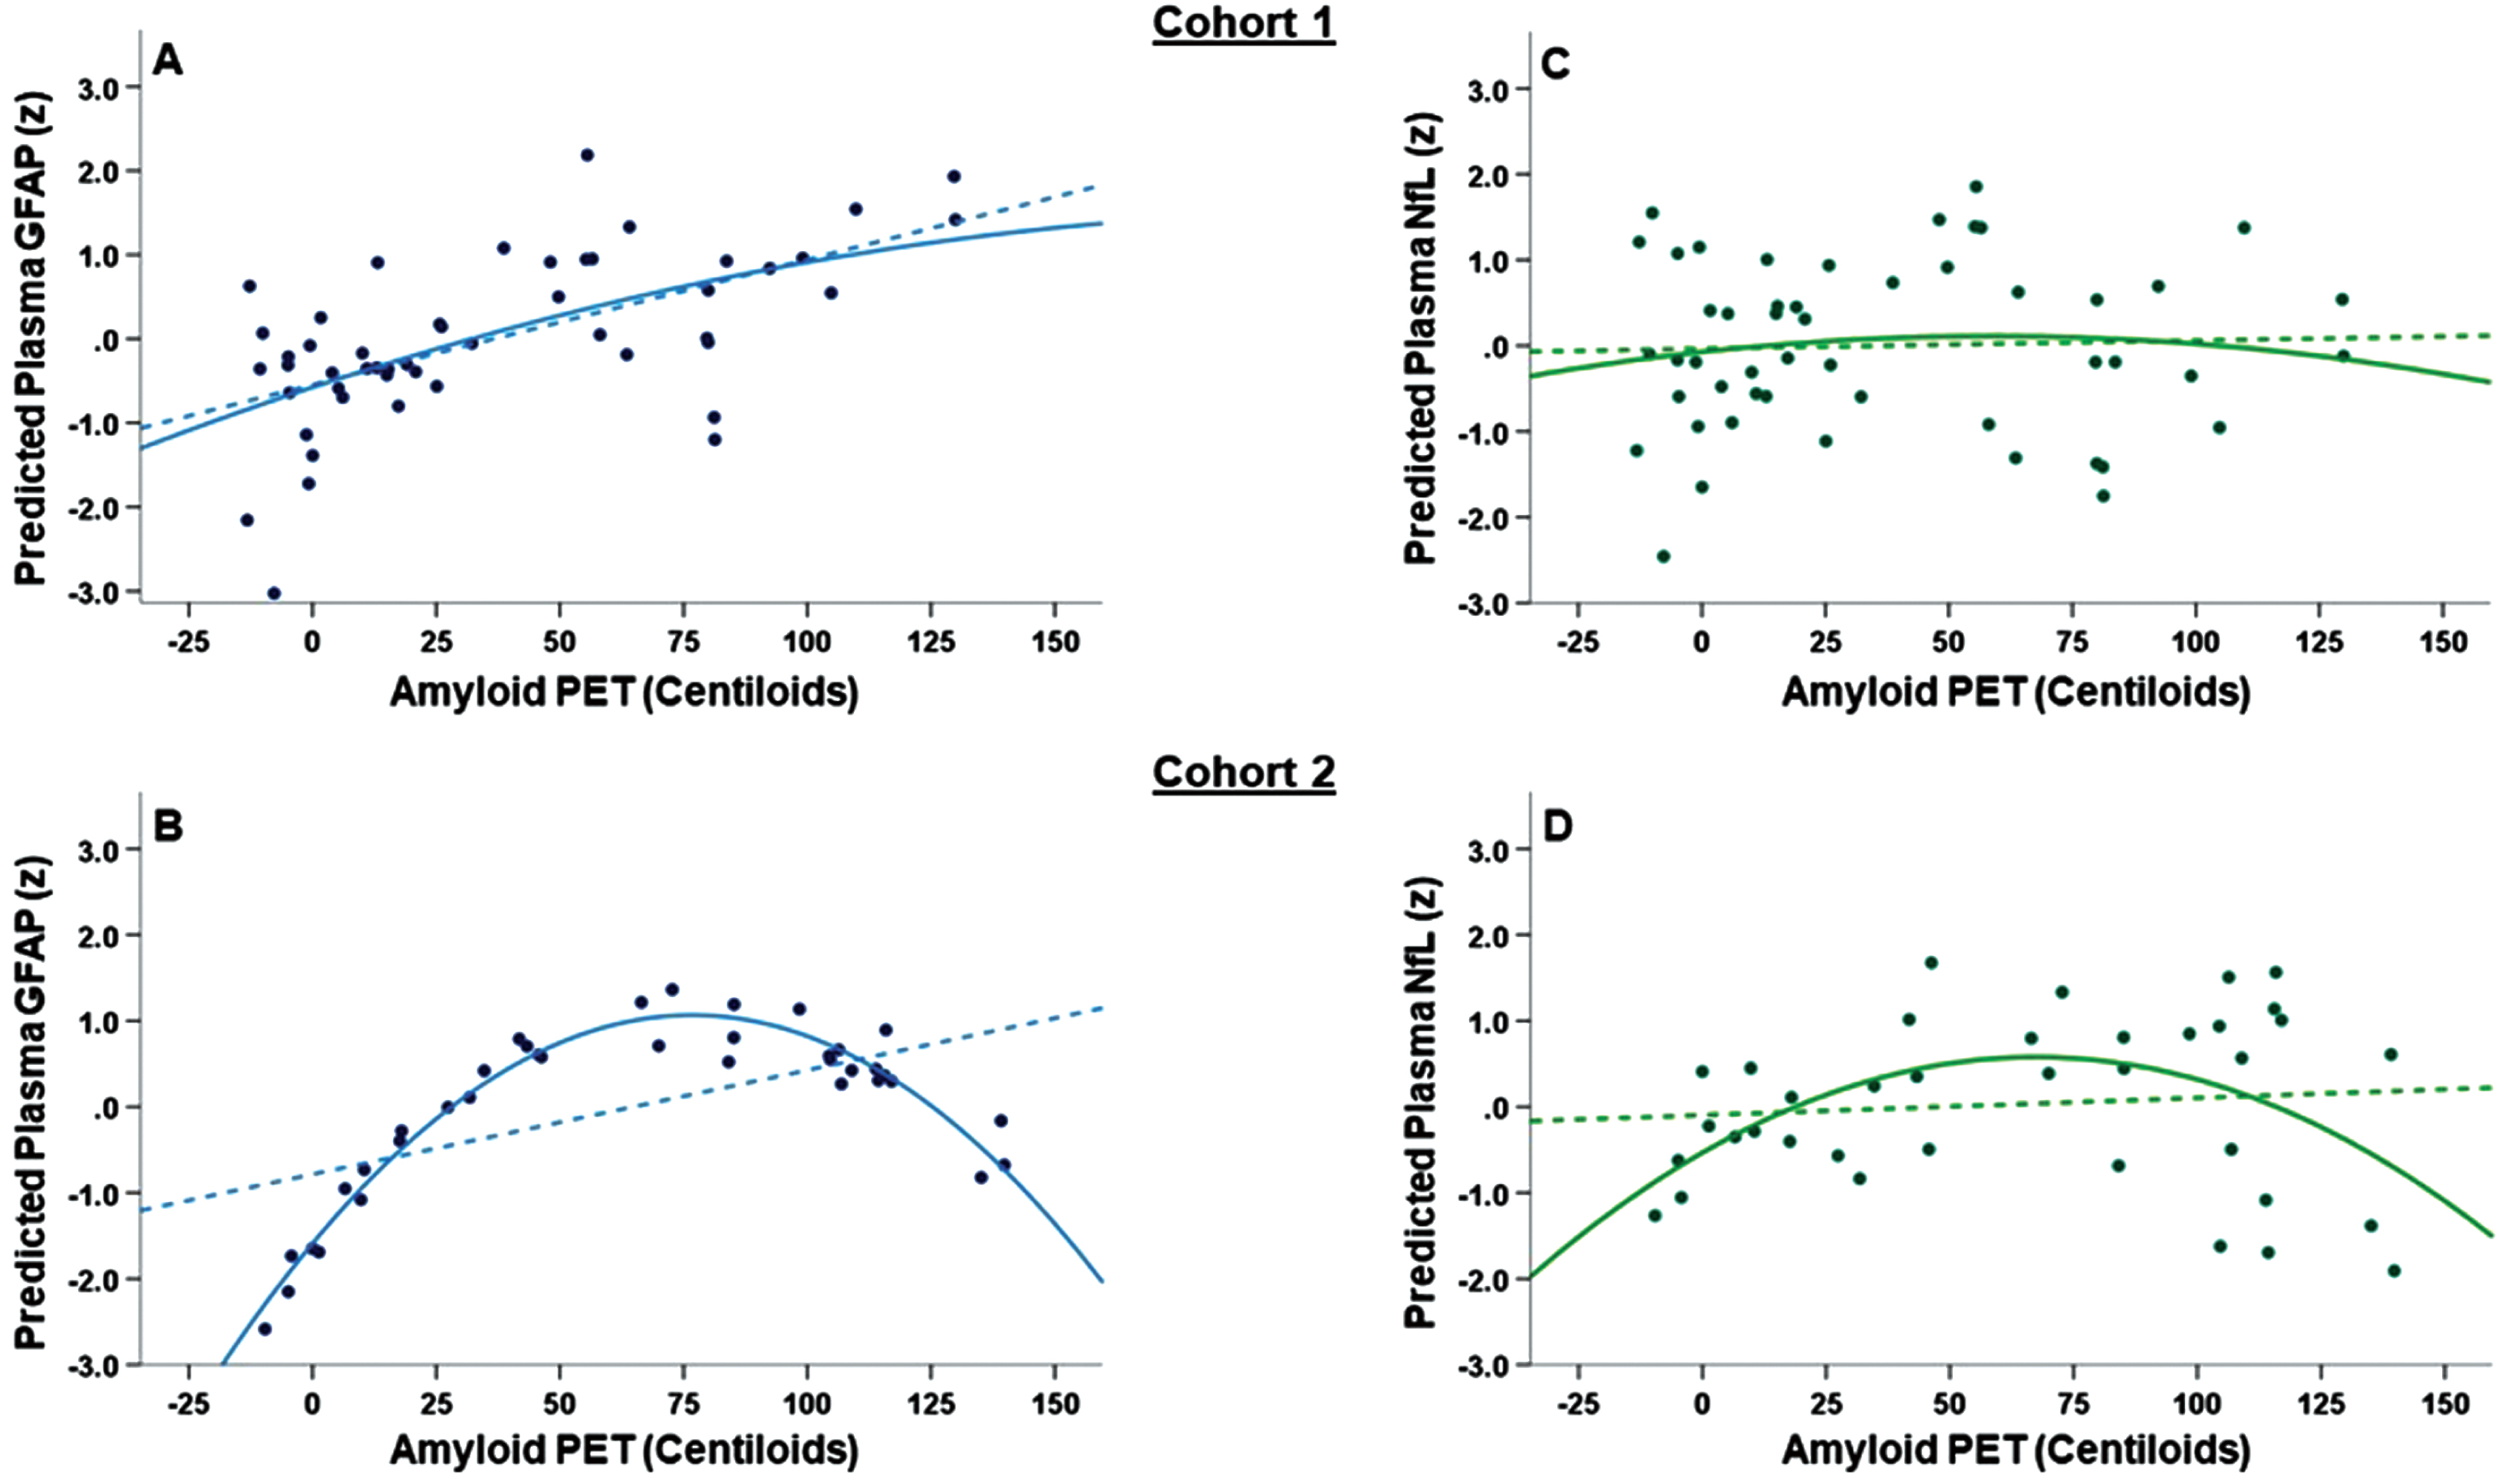
In Cohort 1, higher Aβ-PET CLs was associated with higher plasma GFAP (β=0.324, p = .01), with a slightly stronger effect seen when controlling for APOE e4 carrier status (β=0.417, p = .005). Including the quadratic Aβ-PET CLs term did not improve model fit (quadratic model R2 change = .002, p = .75 Figure 2A). In Cohort 2, there was a statistically significant, negative curvilinear association between Aβ-PET CLs and plasma GFAP (Figure 2B). Including the quadratic Aβ-PET CLs term improved model fit (quadratic model R2 change = .158, p = .0 1) with both the linear (p = .004) and quadratic (p = .01) Aβ-PET CLs effects remaining statistically significant. The Cohort 2 scatterplot showed that plasma GFAP increased until around 75 CLs before plateauing and then decreasing beyond 100 CLs. Associations remained statistically significant when additionally controlling for APOE e4 carrier status and plasma NfL concentration. For completeness, we also evaluated the Aβ-PET CLs x plasma NfL and Aβ-PET CLs x APOE status interactions on plasma GFAP. There was no significant Aβ-PET CLs x plasma NfL (Cohort 1: R2 change = .042, p = .10; Cohort 2: R2 change = .002, p = .73) or Aβ-PET CLs x APOE (Cohort 1: R2 change = .006, p = .54; Cohort 2: R2 change = .002, p = .81) association with plasma GFAP.
Figure 2
(A-D): Main effect of A β -PET CLs on plasma GFAP (A-B) and plasma NfL (C-D) concentrations. All figures show standardized model-predicted plasma biomarker concentrations on the Y-axis and both linear (dashed lines) and quadratic (solid lines) associations with amyloid PET (measured in Centiloids; CLs). For plasma GFAP, Cohort 1 (A) showed a linear association between higher Aβ-PET CLs and higher plasma GFAP while Cohort 2 (B) showed a curvilinear association. Cohort 2 notably differed from Cohort 1 in the range of clinical disease stage (see Figure 1). There were no statistically significant associations between Aβ-PET CLs and plasma NfL in either Cohort 1 (C) or Cohort 2 (D).
In the RESULTS: A β-PET Association with Plasma NfL section on p. 269-270, the bold text has changed from the original publication:
Aβ-PET Association with Plasma NfL
In contrast, we did not observe a significant linear or nonlinear association between Aβ-PET CLs and plasma NfL in either Cohort 1 (linear β=0.035, p = .78, quadratic R2 change = .008, p = .48; Figure 2C) or Cohort 2 (linear β=0.215, p = .25, quadratic R2 change = .055, p = .16; Figure 2D).
In the RESULTS: Interactions of A β-PET and CDR-SB section on p. 270-271, the bold text has changed from the original publication:
Interactions of Aβ-PET and CDR-SB
Given the observed nonlinear association between Aβ-PET CLs and plasma GFAP in Cohort 2, we investigated whether this was related to clinical disease stage by testing the Aβ-PET CLs x CDR-SB interaction effect on plasma GFAP. In Cohort 2 there was a statistically significant Aβ-PET CLs x CDR-SB interaction on plasma GFAP (R2 change = .169, p = .00 6; Figure 3B), which remained after controlling for APOE e4 carrier status (R2 change = .204, p = .003). Cohort 2 participants with CDR-SB=0 showed a strong, positive association of higher Aβ-PET CLs with higher plasma GFAP (linear model R2 = .472), while Cohort 2 participants with CDR-SB > 4.0 showed a strong, negative association of higher Aβ-PET CL with lower plasma GFAP (linear model R2 = .395). Cohort 2 participants with intermediate CDR-SB=0.5-4.0 showed a weak (negative) association between Aβ-PET CL and plasma GFAP (linear model R2 = .090). The interaction did not reach statistical significance in Cohort 1 (R2 change = .023, p = .23) but showed similar directionality (Figure 3A). Cohort 1 participants with CDR-SB=0 showed a positive association of higher Aβ-PET CLs with higher plasma GFAP (linear model R2 = .090) while participants with CDR-SB=0.5-4.0 showed little-to-no meaningful association (linear model R2 < .000). Controlling for plasma NfL somewhat attenuated the Aβ-PET CL x CDR-SB interaction on plasma GFAP in Cohort 2 (R2 change = .061, p = .05).
Figure 3
(A-D): Interaction between A β -PET and CDR-SB on plasma GFAP (A-B) and NfL (C-D) concentrations. All figures show standardized model-predicted plasma biomarker concentrations on the Y-axis. In both Cohort 1 (A) and Cohort 2 (B), higher Aβ-PET signal (measured in Centiloids; CLs) was associated with higher plasma GFAP in cases with CDR-SB=0 (yellow line) but not CDR-SB=0.5-4.0 (orange line). For cases in the dementia range (CDR-SB>4.0, red line, Cohort 2 only), higher Aβ-PET CLs was associated with lower plasma GFAP. The Aβ-PET CLs x CDR-SB interaction was statistically significant only in Cohort 2 for plasma GFAP. These associations largely were not observed for plasma NfL (C and D) except for an apparent association of higher Aβ-PET CLs with higher plasma NfL in Cohort 2 cases with CDR-SB=0 (Pearson’s r = .40).
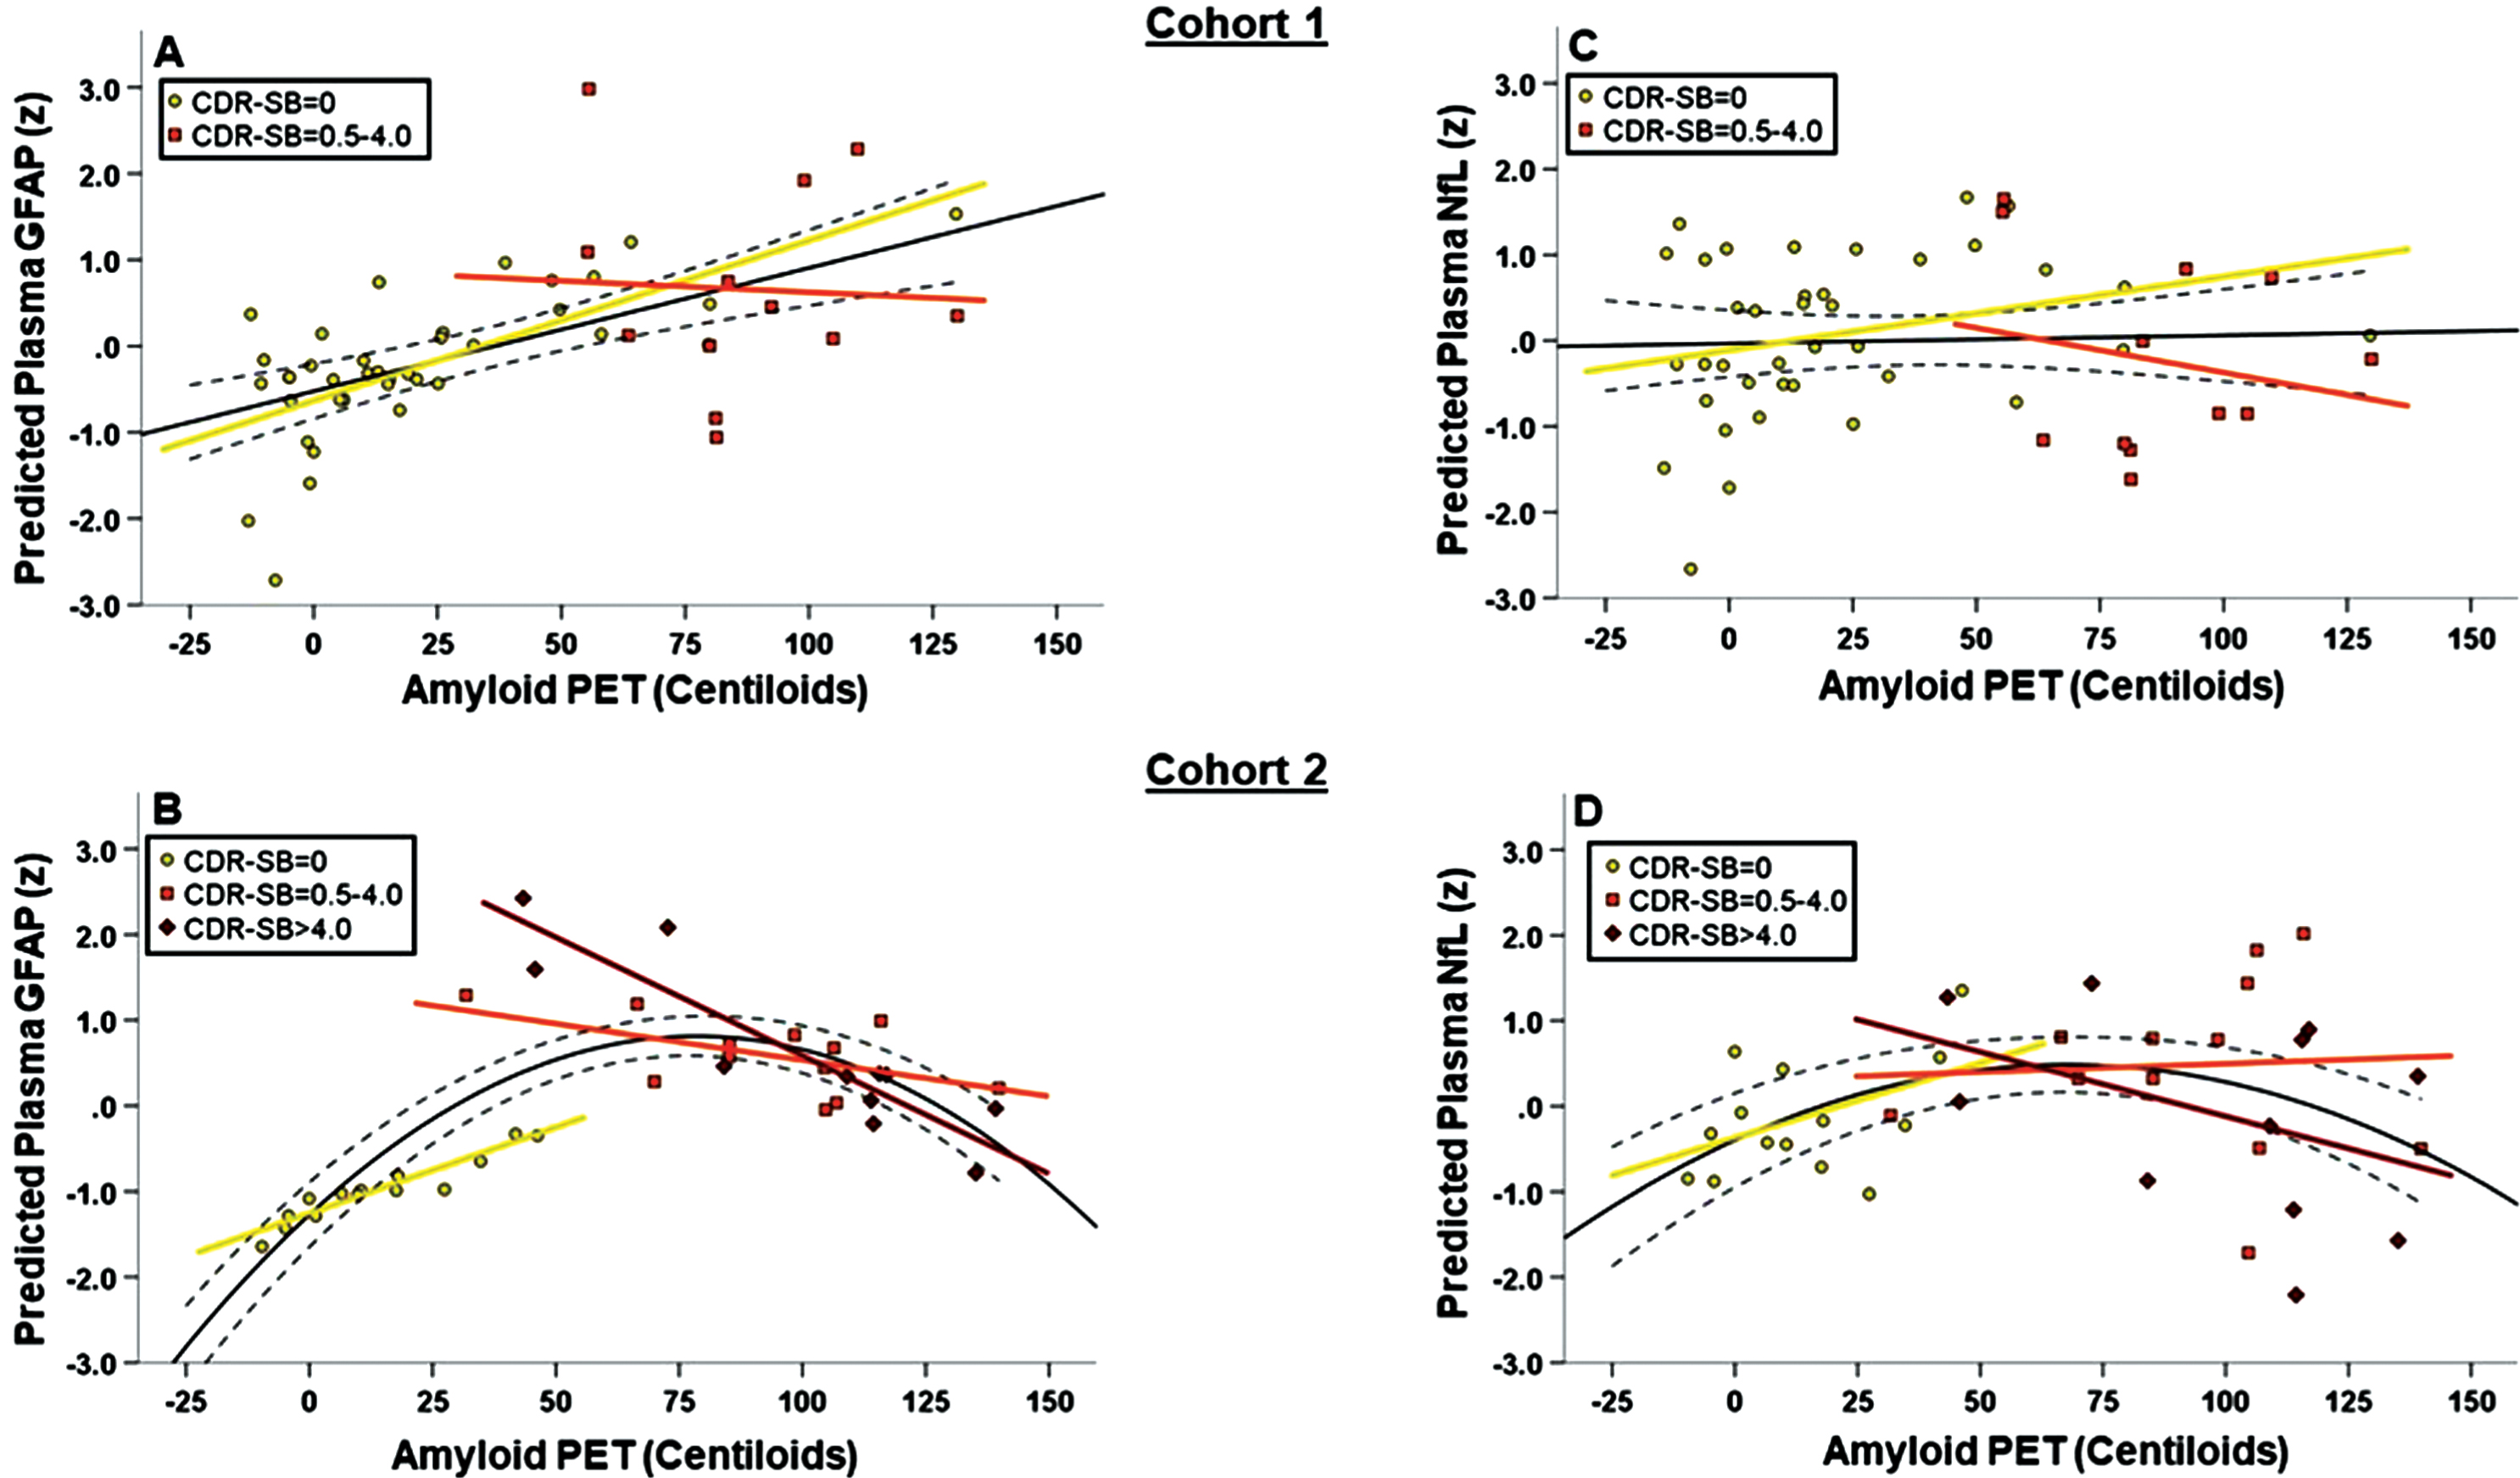
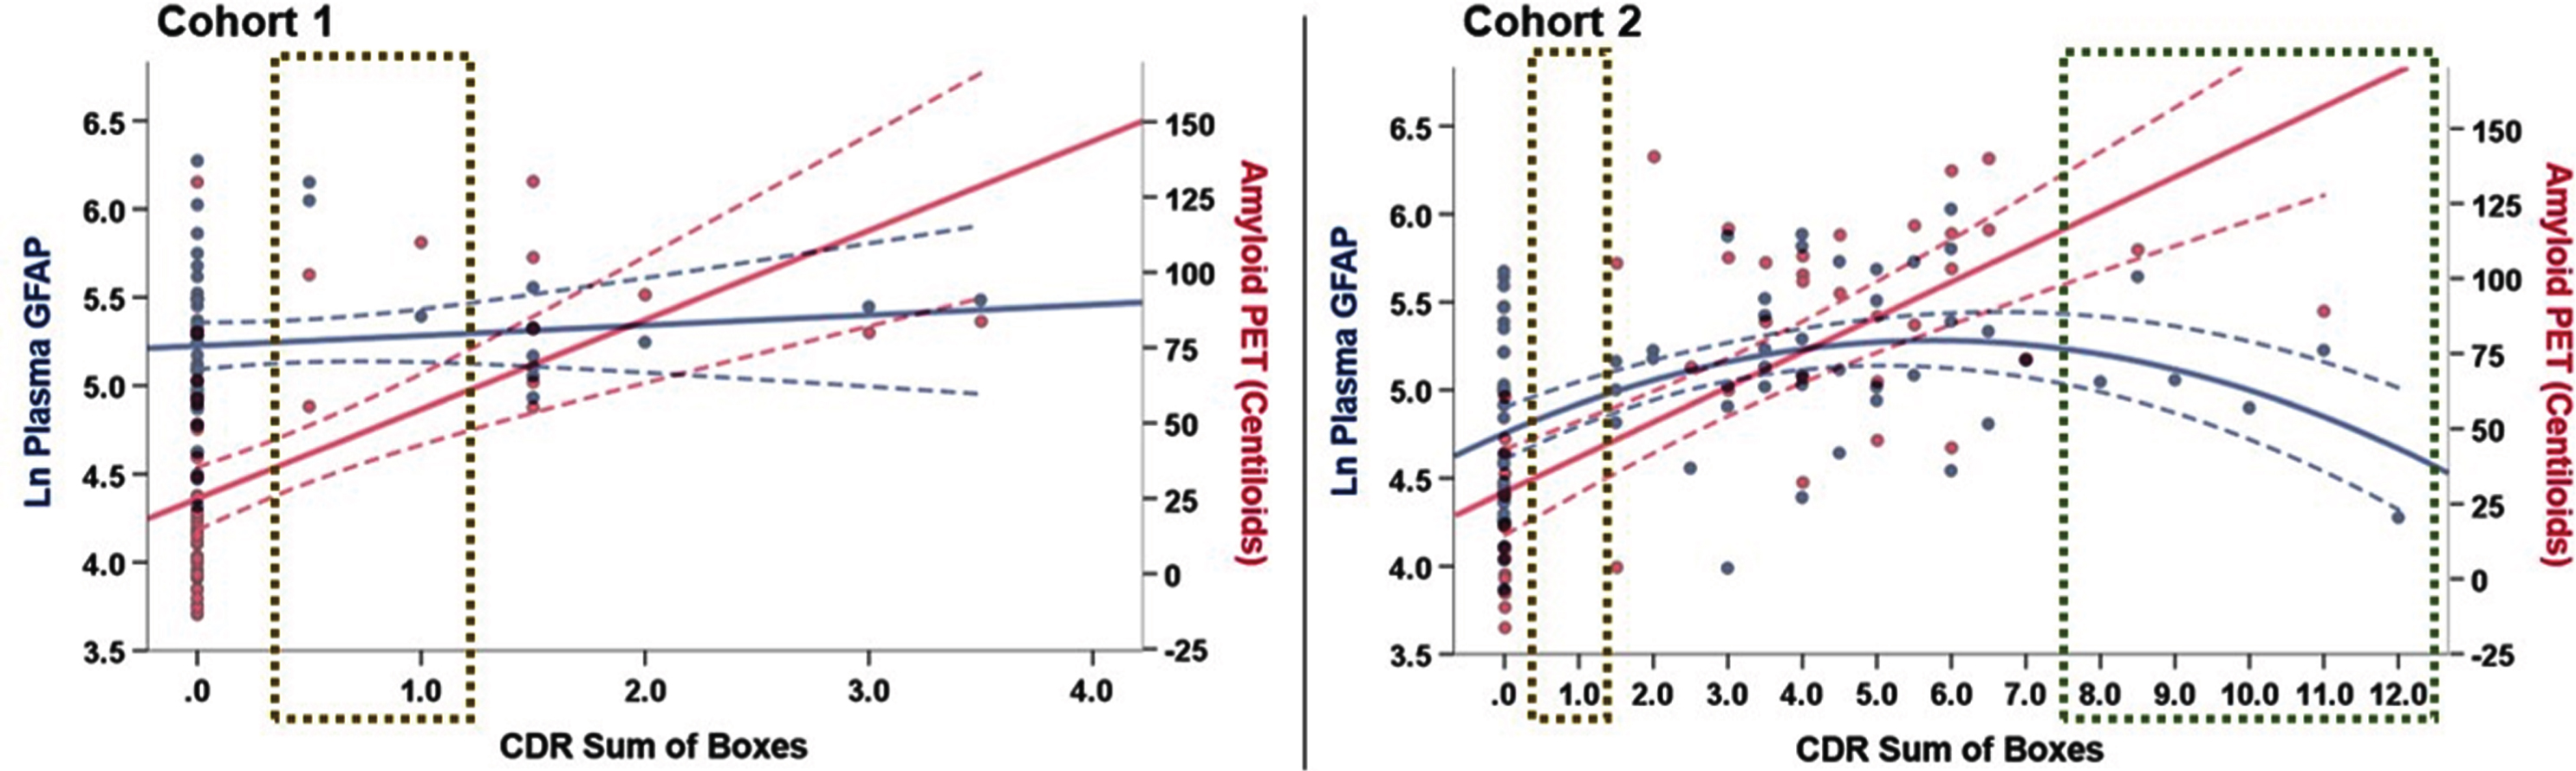
Again, in contrast, there was no significant Aβ-PET CLs x CDR-SB interaction on plasma NfL in either Cohort 1 (R2 change = .005, p = .59; Figure 3C) or Cohort 2 (R2 change = .069, p = .12; Figure 3D; see also Supplementary Figure 1). Exploratory decomposition of the interaction terms suggested Aβ-PET CLs may be positively associated with plasma NfL in Cohort 2 participants with CDR-SB=0 (Pearson’s r = .35). We plotted Aβ-PET CLs and plasma GFAP as a function of CDR-SB score in both Cohort 1 and Cohort 2 to help visualize potential divergence of these biomarkers across the functional spectrum. Regression analyses controlling for age and sex supported a positive, linear association between Aβ-PET CLs and CDR-SB (Cohort 1 linear model R2 = .367, p < .001; Cohort 2 linear model R2 = .557, p < .001) and curvilinear association between plasma GFAP and CDR-SB across a wider clinical disease spectrum (Cohort 2, linear model R2 = .112, quadratic model R2 = .246; R2 change p = .001; Figure 4).
In the RESULTS: Sex as a Biologic Variable section on p. 271, the bold text has changed from the original publication:
Figure 4
Plots depicting plasma GFAP (blue) and A β -PET (red) as a function of CDR-SB score. In Cohort 1, plasma GFAP was not significantly associated with CDR-SB after controlling for age and sex (β=.189, p = .16). In Cohort 2, we observed potential divergence of plasma GFAP and Aβ-PET in the in older adults with CDR-SB>8.0, though the Aβ-PET data in this CDR-SB range largely was extrapolated (green box). Cohorts notably differed in representation of older adults with CDR-SB>4.0 (N = 0 in Cohort 1) and in the mildest clinical disease stage (CDR-SB=0.5-1.0; gold boxes). NOTE: An additional 38 older adults from Cohort 2 with available plasma GFAP and CDR-SB (without Aβ-PET scan) were included in this plot to better represent the spectrum of clinical disease stage, particularly in the dementia range (total N = 75, age = 71.9±9.1 years old, 52%female,17.2±3.0 years of education, 91.5%white).
Sex as a Biologic Variable
There was no significant main effect of sex on plasma GFAP, controlling for age, in either Cohort 1 (β=0.123, p = .32) or Cohort 2 (β=0.121, p = .49). There also was no significant Aβ-PET CLs x Sex interaction on plasma GFAP in either Cohort 1 (R2 change = .001, p = .77) or Cohort 2 (R2 change = .059, p = .21; Supplemental Figure 2). We found a trend towards statistical significance for a nonlinear Aβ-GFAP association in Cohort 2 females (R2 change = .147, p = .11).
The four figures are reprinted below with minor alterations to the accurate amyloid-PET Centiloid values, along with updated figure captions where needed.


