
Coping in Mid- to Late Life and Risk of Mild Cognitive Impairment Subtypes and Dementia: A JPHC Saku Mental Health Study
Abstract
Background:
The relationship between coping in mid- to late life and cognitive functions remains unclear.
Objective:
To investigate the relationship between habitual coping behaviors of a large Japanese population in their mid- to late-lives and their risk of cognitive decline 15 years later.
Methods:
Overall 1,299 participants were assessed for coping behaviors (in 2000) and cognition (2014–2015). We used the Stress and Coping Inventory to assess the frequency of six coping behaviors (i.e., consulting, planning, positive reappraisal, avoidance, fantasizing, and self-blame). Logistic regression analyses were conducted to examine odds ratios (ORs) for the diagnosis of mild cognitive impairment (MCI), MCI subtypes (single- and multiple-domain MCI), and dementia for coping behaviors.
Results:
Among the eligible 1,015 participants (72.6 [SD = 5.5] years old in 2014–2015), the numbers for cognitively normal, single-domain MCI, multiple-domain MCI, and dementia were 650 (64.0%), 116 (11.4%), 213 (21.0%), and 36 (3.5%), respectively. Among the six coping behaviors, avoidant coping was significantly associated with noticeable cognitive decline (multiple-domain MCI and dementia). This association remained significant after adjusting for sex, age, education, diagnosis of current major depressive disorder, past history of ischemic heart disease, diabetes, regular alcohol consumption, and smoking (OR = 2.52, 95% CI = 1.23 to 5.15). No significant association with other coping behaviors was found.
Conclusion:
Avoidant coping in mid- and late life is associated with cognitive decline among older people.
INTRODUCTION
The number of individuals with dementia and cognitive impairment is rapidly increasing due to global aging. Researchers have been pursuing the way to treat dementia, but there is still no approved pharmacological intervention to reverse cognitive decline. Thus, emphasis has been placed on reducing cognitive disorders’ modifiable risks such as smoking, excessive alcohol consumption, physical inactivity, and infrequent social contact [1]. Recently, stress has been implicated as a potential mechanism of neurodegenerative pathology [2]. Regarding epidemiological studies, current meta-analysis suggests that posttraumatic stress disorder is a risk of cognitive decline [3]. Coping behaviors could also regulate psychological stress [4], which has been widely studied as affecting cognitive functions [5–7]. For example, appropriate coping can protect against stress-related neurodegeneration [8, 9]. Conversely, continuous maladaptive coping could result in functional brain network alternation and structural changes such as nerve cell damage [10, 11]. In this way, a coping strategy that modifies both lifestyle and stress-related neuronal changes may affect the risk of cognitive decline [5].
As of the time of this research, only a small number of studies have shown the effect of coping on long-term cognitive prognosis, and they have done so only in particular populations such as younger adults [12]. These effects include multiple sclerosis [13] and schizophrenia [14]. Although these studies showed that excessive use of avoidant and effortful coping predicted future cognitive decline and was associated with reappraisal and religious coping with better cognitive function [12, 13], the focus of these previous studies was not cognitive decline in later life. Moreover, the short-term associations may suggest the opposite of the causal relationship between coping and cognitive functions [15]. As far as we know, no studies have investigated the influence of coping on the development of cognitive decline among older people. Particularly, multiple-domain MCI has a greater impact on older people’s QOL and creates a higher risk of dementia than single-domain MCI [16]. Therefore, using a large population cohort, we investigated the relationship between older adults’ coping behaviors in their mid- to late-lives and the risk of MCI subtypes and dementia.
METHODS
Study design, setting, and participants
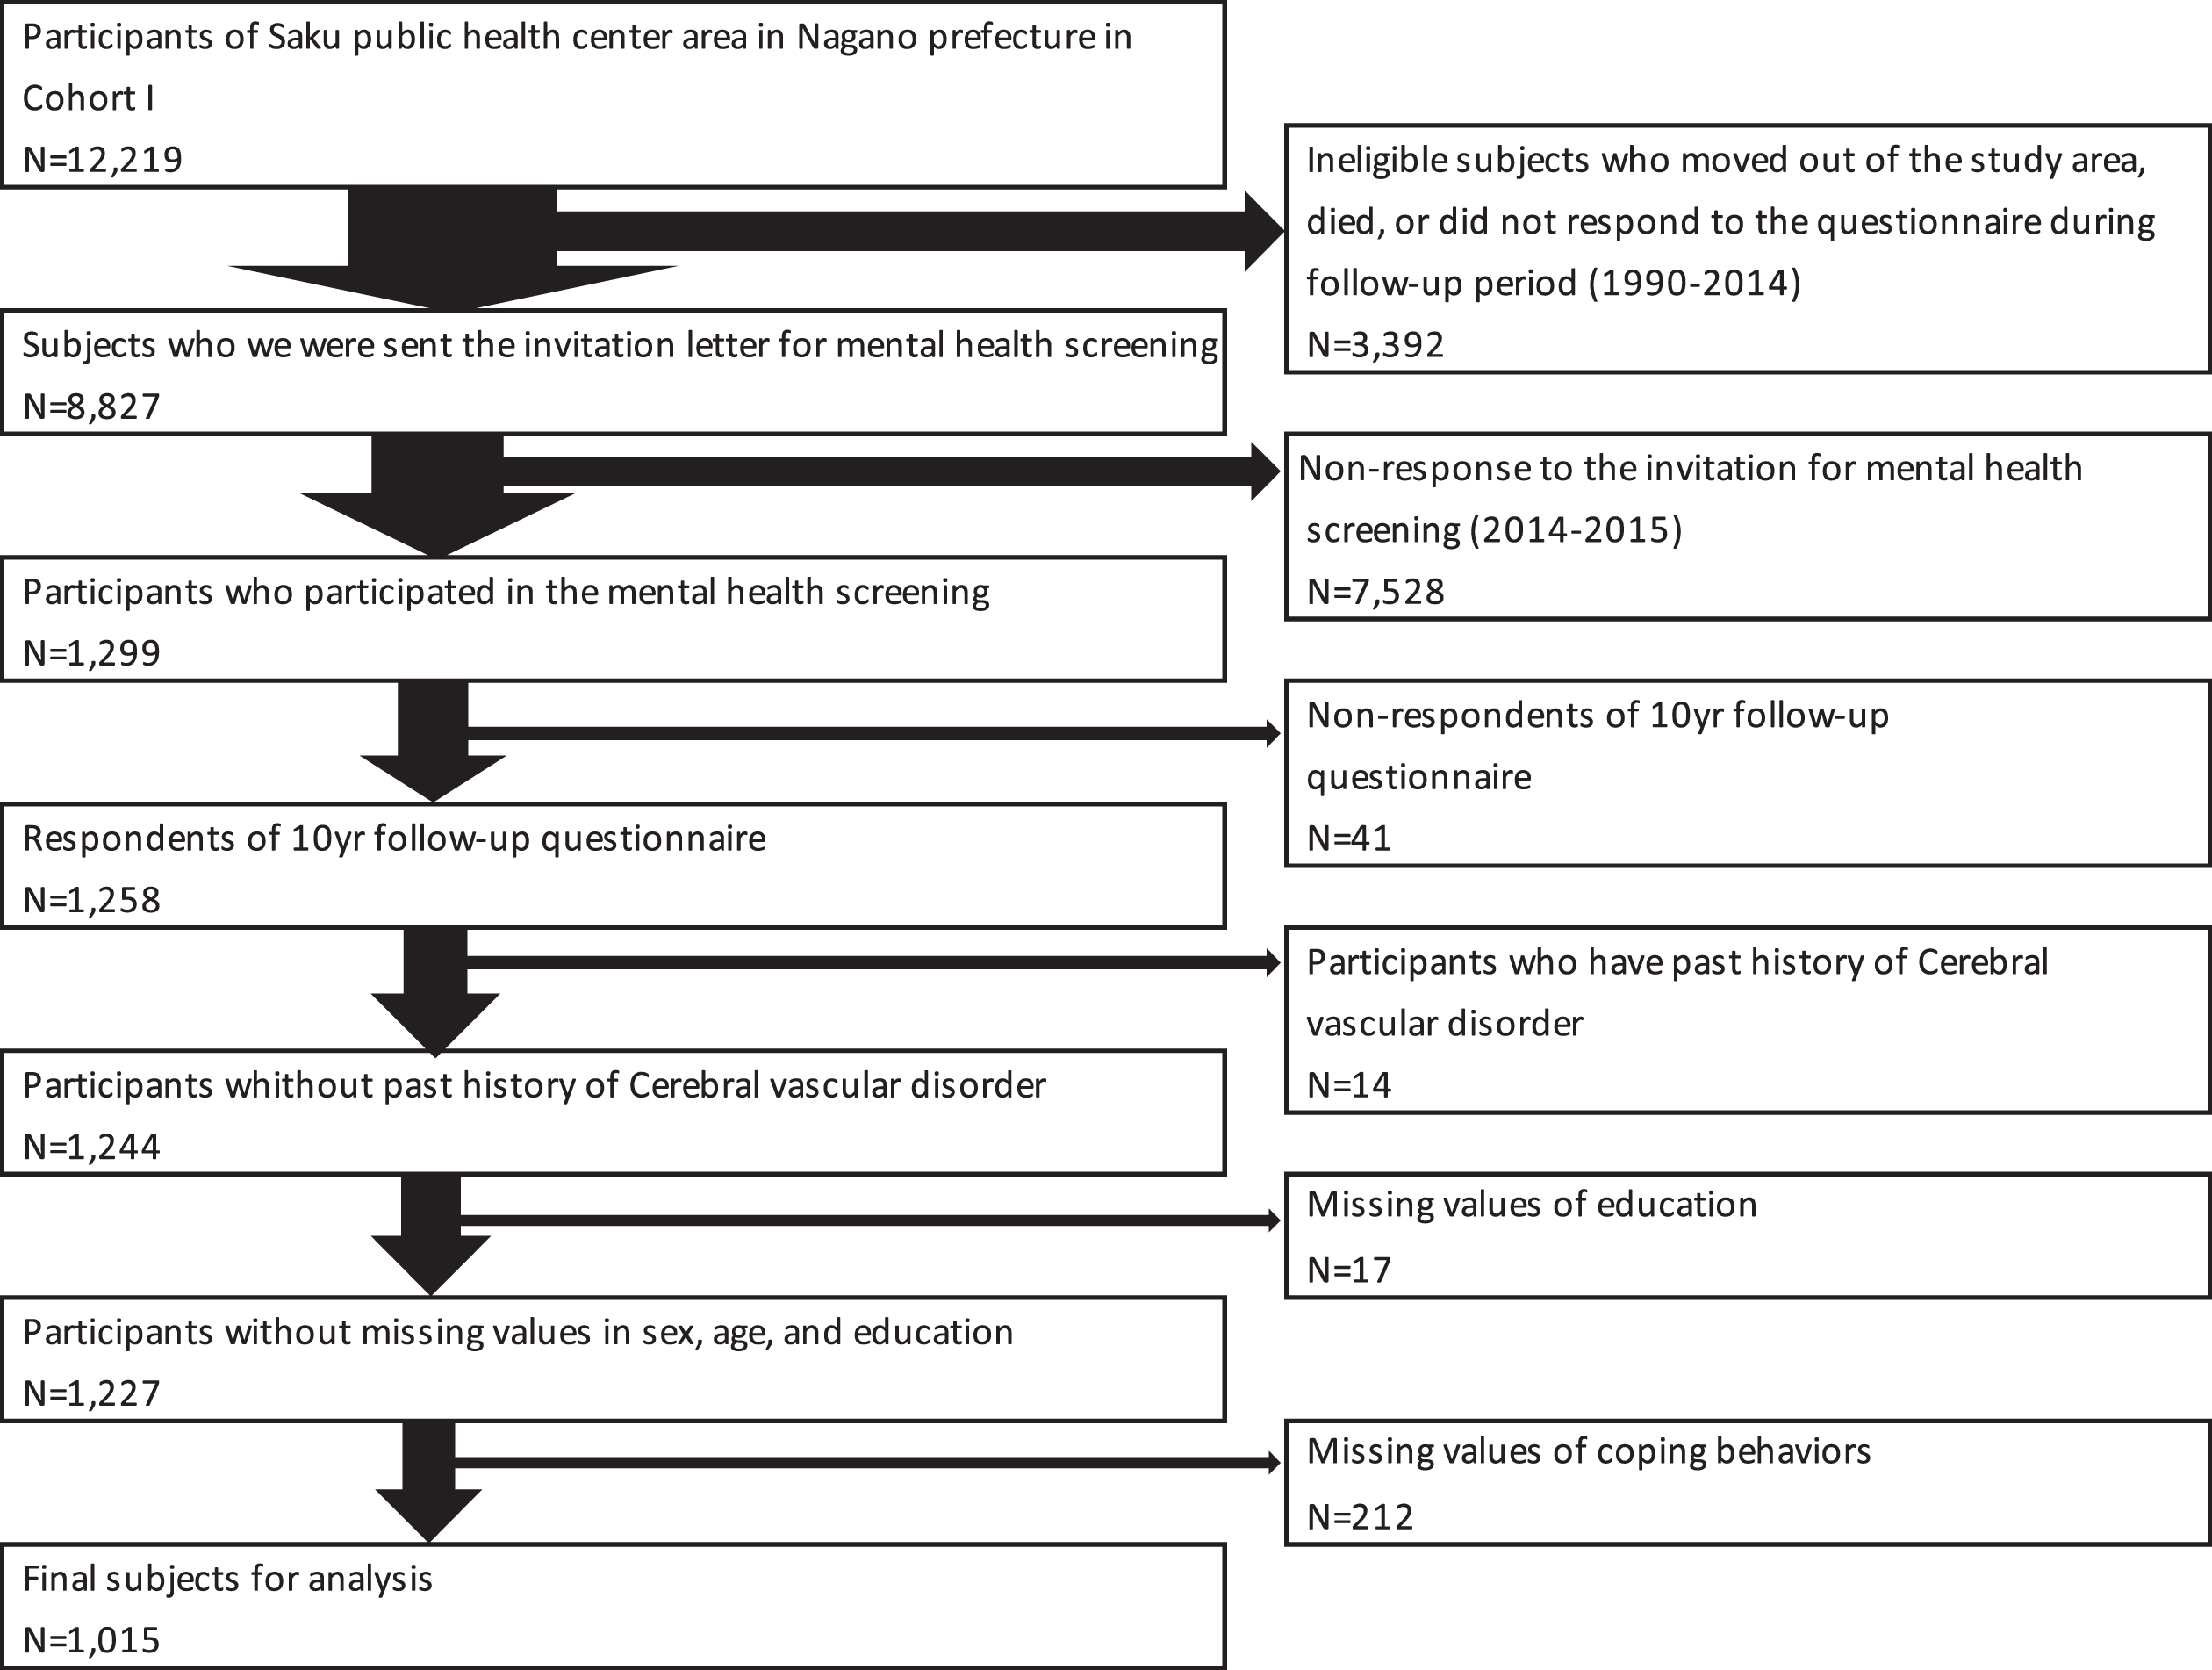
This study, which began in 1990–1993, was conducted as a subgroup of the Japan Public Health Center-based Prospective (JPHC) study. A total of 140,420 participants (68,722 men and 71,698 women) were longitudinally studied to explore the evolution of multi-illness risk factors in mid-life [17]. Participants who were 40–59 years old in 1990 and 40–69 years old in 1993 were surveyed using a questionnaire at baseline and at 5- to 10-year follow-ups (response rate 74% –81%). The present study’s population comprised 12,219 (6,172 men and 6,047 women) residents in the Saku Public Health Center catchment area (Nagano Prefecture) (Fig. 1). A questionnaire survey on coping, physical complications, and lifestyle information, including smoking status, drinking status, and living arrangements, was conducted in 2000 (10-year follow-up survey). This is the starting point of the present study. We sent an invitation letter for this mental health screening to 8,827 participants in 2014–2015 after excluding those who subsequently moved out of the study area, died, or did not respond to the questionnaires after 1990. Of the 1,299 who responded, 41 people who did not participate in the survey in 2000 (starting point; 10-year follow-up survey) were excluded. Thus, we were able to obtain the data of 1,258 participants. In 2014–2015 we interviewed them on the history of their formal education. We excluded participants with a history of stroke (ischemic stroke, hemorrhagic stroke, and subarachnoid hemorrhage) (n = 14) in the 2000 survey because individuals with cerebral vascular disorder may already have some cognitive impairment at the baseline. After excluding those with missing education values (n = 17) and coping behavior (n = 212), the final analysis was performed on 1,015 participants.
Fig. 1
Derivation of the analytic sample.
All participants provided written informed consent at the time of the mental health screening survey in 2014–2015, in accordance with the Declaration of Helsinki. If the participants were unable to understand the research because of cognitive decline, we obtained consent from their substitutes, such as family members or caregivers. The Institutional Review Board of the National Cancer Center, Japan and Keio University School of Medicine approved the study. We used the STROBE case-control checklist when writing our report [18].
Coping assessments
A coping inventory was used at the starting point in 2000 to assess how participants cope with difficult problems. We used the validated Japanese version of the Stress and Coping Inventory [19]. The Stress and Coping Inventory measures coping with responses to stresses with 25 items, of which we selected six questions, two for each of the three extracted factors, with a factor loadings value of 0.5 or higher. This subset of coping questionnaires has previously been used as the main exposure in prospective studies on outcomes such as cardiovascular disease, suicide, and cancer in the JPHC study [20–22]. The inventory was constructed to assess six coping behaviors: consulting, planning, positive reappraisal, avoidance, fantasizing, and self-blame. Such coping behaviors were assessed through the questions. Participants responded to the question, “How do you handle various problems and events that you experience daily?” by indicating the extent to which they used the following six specific coping behaviors: (1) consult with someone (consulting); (2) make a plan and carry it out (planning); (3) endeavor to find the positive side of the situation (positive reappraisal); (4) avoid the problem or event and do something else (avoidance); (5) hope or fantasize about being able to change the problem (fantasizing); and (6) blame and criticize oneself (self-blame). Each of the responses consisted of five options (hardly ever, occasionally, sometimes, often and fairly often). Coping behaviors were subsequently converted into binary variables in accordance with a previous publication [21]. Answers belonging two categories, fairly often or often, corresponded to participants who regularly adopted such particular behaviors. Conversely, responses belonging to the three categories of sometimes, occasionally, or hardly ever indicated that the participant did not regularly use a particular behavior to solve daily problems. The scores for each coping strategy (1 = often or fairly often and 0 = sometimes, occasionally, or hardly ever) were summed up two broad coping strategies to assess the effect of coping strategies (approach-oriented: consulting, planning, and positive reappraisal; avoidance-oriented: avoidance, fantasizing, and self-blame).
Mental assessment
In 2014–2015, experienced neuropsychologists performed mental health screening and assessment of cognitive functions. We conducted four tests to assess participants’ mental health. First, the Mini-Mental State Examination (MMSE), which is used extensively in clinical and research settings to measure cognitive impairment [23]. Second, the Wechsler Memory Scale Revised (WMS-R) logical memory I/II subtest [24], which was designed to measure verbal episodic memory. Third, the clock drawing test [25], which is used to assess several cognitive functions such as spatial dysfunction and executive functions. Finally, the Clinical Dementia Rating (CDR) Scale [26], which is a comprehensive scale used to quantify the severity of dementia’s symptoms. In addition, we used the Center for Epidemiologic Studies Depression Scale (CES-D) [27], and the Patient Health Questionnaire-9 (PHQ-9) [28] to assess the participants’ depressive symptoms. Moreover, educational background and education year were assessed through the questionnaire prior to mental health screening. Obtained data were confirmed at the screening in 2014–2015.
All participants were categorized as cognitively normal, with MCI, or with dementia according to the criteria used in the Japan Alzheimer’s Disease Neuroimaging Initiative project [29]. Particularly, mild MCI was defined as amnestic MCI, which was originally presented by Petersen et al [30]. Participants who were categorized into those with MCI were further categorized into two sub-categories: single-domain MCI (i.e., participants who showed only memory impairment manifested by the logical memory subset test) and multiple-domain MCI (i.e., participants who showed either a decline in the clock drawing test or CDR≥0.5 in at least one of the categories of orientation, judgment and problem solving, community affairs, home and hobbies, and personal care in addition to memory impairment) [31]. We defined multiple-domain MCI as one of the cutoffs for cognitive decline. This is because multiple-domain MCI has a higher risk of conversion to dementia than single-domain MCI [16]. Memory impairment was assessed based on whether the participant’s score was below the education-adjusted cut-off level in the WMS-R Logical Memory II subtest (i.e., the score for education for 0–9 years was 2, for 10–15 years was 4, and for > 15 years was 8). The MMSE cut-off point for dementia was 23.
Finally, a trained psychiatrist, blinded to the results of the coping inventory questionnaire, determined the final diagnosis by combining the neuropsychological assessment and the scales of depressive symptoms with a clinical interview. The psychiatrist diagnosed dementia, MCI, and major depressive disorder in accordance with the Diagnostic and Statistical Manual of Mental Disorders, 4th Edition’s criteria [32].
Statistical analysis
We used the chi-square test or Fisher’s exact test for categorical variables and t-test for continuous variables to compare the participants’ characteristics by coping behavior. For the main result, we conducted logistic regression analyses to calculate odds ratios (ORs). We used 95% confidence intervals (CIs) for total MCI and dementia (reference was set as cognitively healthy) for each coping behavior. Furthermore, we calculated the OR and 95% CI for the total multiple-domain MCI and dementia (reference was set as normal and single-domain MCI) for each coping behavior. We used the subjective frequency of each coping behavior, examined the p-value for trends in the frequency and odds of cognitive decline, and then applied the binary variables. In calculating each OR and 95% CI, each coping behavior was examined individually on the original five categories of hardly ever, occasionally, sometimes, often and fairly often and then mutually adjusted in binary variables. The linear trend for five categories was assessed by assigning ordinal values to each coping category as continuous values. First, we performed logistic regression models adjusted for sex, age (years), and education (junior high school, high school, and college/other) (Model 1). We made further adjustments to diagnose the current major depressive disorder, past history of ischemic heart disease (ischemic heart disease or angina), diabetes mellitus, alcohol consumption (regular, not regular), and smoking (current, past/never) (Model 2). We made such adjustments because these diseases or disorders are known to be risk factors for dementia [1]. We categorized current smokers and regular alcohol consumers in 2000 as having smoking and drinking habits, respectively. Regular alcohol consumption refers to consuming alcohol one day per week or more. We then examined Spearman’s rank correlation coefficients (cut-off value: |r|>0.3) to confirm multi-collinearity among covariates.
Additionally, we summed the number of approach-oriented (consulting, planning, and positive reappraisal) and avoidance-oriented (avoidance, fantasizing, and self-blame) coping behaviors each participant used and applied those numbers to calculate the odds of cognitive decline using logistic regression analysis. To examine the difference in the effect of coping according to age, we also stratified the participants’ age (50–59 and 60-70) at the time of coping assessment and calculated the p-value for interaction by age and coping style. We excluded participants with missing values for each variable from the analysis. Moreover, we performed sensitivity analysis using the same logistic models, excluding participants diagnosed with major depressive disorders. They were excluded because they could be classified as participants with pseudo-dementia. Furthermore, we compared the demographic factors in 2000 of those who participated in the 2014-2015 survey and those who did not. All p-values were two-sided, and statistical significance was set at a p-value less than 0.05 except for the p-values of the Hosmer-Lemeshow test, which were above 0.05 for all the logistic regression analyses. We conducted all statistical analyses using SPSS version 24 (IBM Corp., Armonk, NY, USA).
Data availability
The principal author has full access to the data used in the analyses of the manuscript. Qualifying researchers may request access to a minimal dataset if they comply with certain requirements. Please follow the instructions provided at https://epi.ncc.go.jp/en/jphc/805/8155.html.
RESULTS
Of the 1,015 participants eligible for analysis, 42.9% (n = 435) were men. The mean age in 2000 (starting point) was 57.5 (standard deviation [SD] = 5.4) years (ranging from 50–70 years). A total of 85 (8.4%) out of 1,015 participants were diagnosed with major depressive disorder. The number of participants categorized as cognitively healthy, with single-domain MCI, with multiple-domain MCI, and with dementia in the 2014–2015 survey were 650 (64.0%), 116 (11.4%), 213 (21.0%), and 36 (3.5%), respectively. Tables 1A and 1B present the participants’ characteristics according to specific coping behaviors (n = 1,015). The proportion of single-domain MCI was higher in the utilizers of planning coping (p < 0.01) and the non-utilizers of fantasizing coping (p = 0.048). Meanwhile, the proportion of dementia was lower in the utilizers of consult coping (p = 0.048).
Table 1A
Characteristics according to coping behaviors (n = 1,015)
| Coping behavior | Consulting | Planning | Positive reappraisal | ||||||
| Yes | No | p | Yes | No | p | Yes | No | p | |
| Sample size, n (%) | 96 (9.5) | 919(90.5) | 295(29.1) | 720(70.9) | 276(27.2) | 739(72.8) | |||
| Basic Information from 2014-2015 survey | |||||||||
| Men, n (%) | 25 (26.0) | 410(44.6) | <0.01 | 138(46.8) | 297(41.3) | 0.11 | 109(39.5) | 326(44.1) | 0.19 |
| Age(mean years±SD) | 71.6±5.0 | 72.7±5.5 | 0.043 | 73.1±5.3 | 72.4±5.5 | 0.27 | 72.8±5.4 | 72.5±5.5 | 0.72 |
| Education, n (%) | |||||||||
| Junior high school | 24 (25.0) | 242(26.3) | 0.02 | 61 (20.7) | 205(28.5) | <0.01 | 58 (21.0) | 208(28.1) | <0.01 |
| High school | 45 (46.9) | 524(57.0) | 166(56.3) | 403(56.0) | 151(54.7) | 418(56.6) | |||
| College/others | 27 (28.1) | 153(16.6) | 68 (23.1) | 112(15.6) | 67 (24.3) | 113(15.3) | |||
| Questionnaire survey in 2000 | |||||||||
| Complications, n (%) | |||||||||
| Angina | 0 (0) | 11 (1.2) | 0.28 | 5 (1.7) | 6 (0.8) | 0.23 | 3 (1.1) | 8 (1.1) | 1.00 |
| IHD | 0 (0) | 9 (1.0) | 0.33 | 2 (0.7) | 7 (1.0) | 0.65 | 3 (1.1) | 6 (0.8) | 0.68 |
| Diabetes mellitus | 2 (2.1) | 27 (2.9) | 0.63 | 5 (1.7) | 24 (3.3) | 0.16 | 5 (1.8) | 24 (3.2) | 0.22 |
| Drinking status n (%) | |||||||||
| Current | 55 (57.3) | 522(56.8) | 0.60 | 179(60.7) | 398(55.3) | 0.45 | 159(57.6) | 418(56.6) | 0.90 |
| Past | 2 (2.1) | 8 (0.9) | 3 (1.0) | 7 (1.0) | 3 (1.1) | 7 (0.9) | |||
| Never | 39 (40.6) | 384(41.8) | 112(38.0) | 311(43.2) | 112(40.6) | 311(42.1) | |||
| Smoking status, n (%) | |||||||||
| Current | 12 (12.5) | 154 (16.8) | 0.20 | 54 (18.3) | 112(15.6) | 0.47 | 46 (16.7) | 120(16.2) | 0.63 |
| Past | 10 (10.4) | 152 (16.5) | 50 (16.9) | 112(15.6) | 39 (14.1) | 123(16.6) | |||
| Never | 74 (77.1) | 611(66.5) | 191(64.7) | 494(68.6) | 191(69.2) | 494(66.8) | |||
| Living arrangements, n (%) | |||||||||
| With spouse | 83 (86.5) | 799(86.9) | 0.89 | 258(87.5) | 624(86.7) | 0.74 | 239(86.6) | 643(87.0) | 0.86 |
| With children | 54 (56.3) | 515(56.0) | 0.97 | 151(51.2) | 418(58.1) | 0.045 | 145(52.5) | 424(57.4) | 0.17 |
| With parents | 31 (32.3) | 241(26.2) | 0.20 | 71 (24.1) | 201(27.9) | 0.21 | 74 (26.8) | 198(26.8) | 1.00 |
| Living alone | 3 (3.1) | 24 (2.6) | 0.77 | 9 (3.1) | 18 (2.5) | 0.62 | 13 (4.7) | 14 (1.9) | 0.013 |
| Mental health screening from 2014-2015 | |||||||||
| CES-D (mean±SD) | 6.2±5.7 | 6.3±6.1 | 0.34 | 5.4±5.6 | 6.7±6.2 | 0.16 | 5.1±5.4 | 6.8±6.2 | <0.01 |
| PHQ-9 (mean±SD) | 2.5±2.7 | 2.5±2.8 | 0.69 | 2.2±2.4 | 2.7±3.0 | <0.01 | 2.1±2.3 | 2.7±3.0 | <0.01 |
| MMSE (mean±SD) | 28.2±1.6 | 27.7±2.2 | <0.01 | 27.8±2.2 | 27.7±2.1 | 0.82 | 27.8±2.1 | 27.7±2.2 | 0.91 |
| MDD, n (%) | 8 (8.3) | 77 (8.4) | 0.99 | 16 (5.4) | 69 (9.6) | 0.03 | 15(5.4) | 70(9.5) | 0.04 |
| Cognitive function diagnosis, n (%) | statdiagnosis, n (%)ding1 | ||||||||
| Normal | 65 (67.7) | 585(63.7) | 0.43 | 180(61.0) | 470(65.3) | 0.20 | 182(65.9) | 468(63.3) | 0.44 |
| MCI | 31 (32.3) | 298(32.4) | 0.98 | 107(36.3) | 222(30.8) | 0.09 | 86 (31.2) | 243(32.9) | 0.60 |
| Single-domain MCI | 10 (10.4) | 106(11.5) | 0.74 | 47 (15.9) | 69 (9.6) | <0.01 | 38 (13.8) | 78 (10.6) | 0.15 |
| Multiple-domain MCI | 21 (21.9) | 192(20.9) | 0.82 | 60 (20.3) | 153(21.3) | 0.75 | 48 (17.4) | 165(22.3) | 0.09 |
| Dementia | 0 (0) | 36 (3.9) | 0.048 | 8 (2.7) | 28 (3.9) | 0.36 | 8 (2.9) | 28 (3.8) | 0.50 |
IHD, Ischemic heart disease; SD, standard deviation; MMSE, Mini-Mental State Examination; CES-D, Center for Epidemiologic Studies Depression Scale; PHQ-9, Patient Health Questionnaire-9; MDD, major depressive disorder; Normal, cognitively normal; MCI, mild cognitive impairment, *p < 0.05 is shown in bold.
Table 1B
Characteristics according to coping behaviors (n = 1,015)
| Coping behavior | Avoidance | Fantasizing | Self-blame | ||||||
| Yes | No | p | Yes | No | p | Yes | No | p | |
| Sample size, n (%) | 39 (3.8) | 976(96.2) | 83 (8.2) | 932(91.8) | 49 (4.8) | 966(95.2) | |||
| Basic Information from 2014-2015 survey | |||||||||
| Men, n (%) | 14 (35.9) | 421(43.1) | 0.37 | 28 (33.7) | 407(43.7) | 0.08 | 21 (42.9) | 414(42.9) | 1.00 |
| Age(mean years±SD) | 72.2±5.3 | 72.6±5.5 | 0.71 | 73.2±5.4 | 72.5±5.5 | 0.86 | 74.4±5.9 | 72.5±5.4 | 0.28 |
| Education, n (%) | |||||||||
| Junior high school | 7 (17.9) | 259(26.5) | 0.41 | 27 (32.5) | 239(25.6) | 0.29 | 16 (32.7) | 250(25.9) | 0.53 |
| High school | 23 (59.0) | 546(55.9) | 45 (54.2) | 524(56.2) | 24 (49.0) | 545(56.4) | |||
| College/others | 9 (23.1) | 171(17.5) | 11 (13.3) | 169(18.1) | 9(18.4) | 171(17.7) | |||
| Questionnaire survey in 2000 | |||||||||
| Complications, n (%) | |||||||||
| Angina | 0 (0) | 11 (1.1) | 0.51 | 0 (0) | 11 (1.2) | 0.32 | 1 (2.0) | 10 (1.0) | 0.51 |
| IHD | 0 (0) | 9 (0.9) | 0.55 | 1 (1.2) | 8 (0.9) | 0.75 | 0 (0) | 9 (0.9) | 0.50 |
| Diabetes mellitus | 0 (0) | 29 (3.0) | 0.28 | 3 (3.6) | 26 (2.8) | 0.67 | 1 (2.0) | 28 (2.9) | 0.73 |
| Drinking status, n (%) | |||||||||
| Current | 19 (48.7) | 558(57.2) | 0.16 | 36 (43.4) | 541(58.0) | 0.04 | 24 (49.0) | 553(57.2) | 0.56 |
| Past | 1 (2.6) | 9 (0.9) | 2 (2.4) | 8 (0.9) | 1 (2.0) | 9 (0.9) | |||
| Never | 18 (46.2) | 405(41.5) | 44 (53.0) | 379(40.7) | 24(49.0) | 399(41.3) | |||
| Smoking status, n (%) | |||||||||
| Current | 6 (15.4) | 160(16.4) | 0.99 | 13 (15.7) | 153(16.4) | 0.71 | 8 (16.3) | 158(16.4) | 0.88 |
| Past | 6 (15.4) | 156(16.0) | 10 (12.0) | 152(16.3) | 6 (12.2) | 156(16.1) | |||
| Never | 27 (69.2) | 658(67.4) | 60 (72.3) | 625(67.1) | 35 (71.4) | 650(67.3) | |||
| Living arrangements, n (%) | |||||||||
| With spouse | 36 (92.3) | 846(86.7) | 0.31 | 65 (78.3) | 817(87.7) | 0.02 | 40(81.6) | 842(87.2) | 0.26 |
| With children | 22 (56.4) | 547(56.0) | 0.96 | 41 (49.4) | 528(56.7) | 0.20 | 27(55.1) | 542(56.1) | 0.89 |
| With parents | 9 (23.1) | 263(26.9) | 0.59 | 18 (21.7) | 254(27.3) | 0.27 | 8(16.3) | 264(27.3) | 0.09 |
| Living alone | 2 (5.1) | 25 (2.6) | 0.33 | 6 (7.2) | 21 (2.3) | <0.01 | 1 (2.0) | 26 (2.7) | 0.78 |
| Mental health screening from 2014-2015 | |||||||||
| CES-D (mean±SD) | 8.0±7.4 | 6.2±6.0 | 0.13 | 8.8±7.7 | 6.1±5.9 | <0.01 | 10.9±6.3 | 6.1±6.0 | 0.70 |
| PHQ-9 (mean±SD) | 4.2±3.6 | 2.5±2.8 | <0.01 | 3.7±3.3 | 2.4±2.8 | <0.01 | 3.9±3.1 | 2.5±2.8 | 0.07 |
| MMSE (mean±SD) | 27.4±2.3 | 27.7±2.1 | 0.35 | 27.7±2.2 | 27.7±2.1 | 0.74 | 27.4±2.3 | 27.7±2.1 | 0.89 |
| MDD, n (%) | 5 (12.8) | 80 (8.2) | 0.31 | 19 (22.9) | 66 (7.1) | <0.01 | 11(22.4) | 74(7.7) | <0.01 |
| Cognitive function diagnosis, n (%) | statdiagnosis, n (%)ding2 | ||||||||
| Normal | 22 (56.4) | 628(64.3) | 0.31 | 58 (69.9) | 592(63.5) | 0.25 | 29 (59.2) | 621(64.3) | 0.47 |
| MCI | 15 (38.5) | 314(32.2) | 0.41 | 21 (25.3) | 308(33.0) | 0.15 | 18 (36.7) | 311(32.2) | 0.51 |
| Single-domain MCI | 2 (5.1) | 114(11.7) | 0.21 | 4 (4.8) | 112(12.0) | 0.048 | 4 (8.2) | 112(11.6) | 0.46 |
| Multiple-domain MCI | 13 (33.3) | 200(20.5) | 0.053 | 17 (20.5) | 196(21.0) | 0.91 | 14 (28.6) | 199(20.6) | 0.18 |
| Dementia | 2 (5.1) | 34 (3.5) | 0.59 | 4 (4.8) | 32 (3.4) | 0.51 | 2 (4.1) | 34 (3.5) | 0.84 |
IHD, Ischemic heart disease; SD, standard deviation; MMSE, Mini-Mental State Examination; CES-D, Center for Epidemiologic Studies Depression Scale; PHQ-9, Patient Health Questionnaire-9; MDD, major depressive disorder; Normal, cognitively normal; MCI, mild cognitive impairment, *p < 0.05 is shown in bold.
Moreover, an attrition analysis that assesses differences in sociodemographic factors and coping at the 2000 assessment between participants who did and did not participate in the 2014-2015 assessment is shown in Supplementary Table 4. The participants were younger, less likely to have diabetes mellitus, and fewer were smokers than non-participants. In addition, participants applied more planning and positive reappraisal to their coping behaviors (Supplementary Table 4).
Tables 2A and 2B show the association between the frequency of coping behavior and cognitive decline evaluated in the multiple logistic regression models using original five categories. Further, and each coping behavior was analyzed individually. Both tables show statistically significant increases in the ORs of cognitive decline combined with MCI and dementia (Table 2A) and cognitive decline combined with multiple-domain MCI and dementia (Table 2B) in participants who responded “often” regarding avoidance coping behavior; however, point estimates for ORs were lower for cognitive decline combined with MCI and dementia (3.36 versus 2.22 in Model 2). There was a statistically significant trend that more frequent use of avoidant coping behavior was associated with increased odds of cognitive decline combined with multiple-domain MCI and dementia (Table 2B) (p = 0.04 for Model 2). There was no such significant trend for the other five coping behaviors (i.e., consulting, planning, positive reappraisal, fantasizing, and self-blame).
Table 2A
Odds ratio and 95% confidence intervals for MCI and dementia with cognitive healthy as reference values according to the original scale of coping behaviors (n = 1015)
| Model 1† | Model 2‡ | Model 1† | Model 2‡ | Model 1† | Model 2‡ | ||||||||||
| Number (case/all) | OR (95% CI) | p for trend | OR (95% CI) | p for trend | Number (case/all) | OR (95% CI) | p for trend | OR (95% CI) | p for trend | Number (case/all) | OR (95% CI) | p for trend | OR (95% CI) | p for trend | |
| Consulting someone (Scale) | Planning (Scale) | Positive reappraisal (Scale) | |||||||||||||
| Total (n = 1,015) | |||||||||||||||
| Hardly ever | 83/213 | 1.00 | 0.89 | 1.00 | 0.84 | 60/177 | 1.00 | 0.44 | 1.00 | 0.39 | 42/127 | 1.00 | 0.72 | 1.00 | 0.69 |
| (Reference) | (Reference) | (Reference) | (Reference) | (Reference) | (Reference) | ||||||||||
| Occasionally | 158/425 | 1.05 (0.74-1.49) | 1.05 (0.74-1.50) | 98/275 | 1.11 (0.74-1.67) | 1.10 (0.73-1.65) | 92/259 | 1.24 (0.78-1.97) | 1.23 (0.78-1.96) | ||||||
| Sometimes | 93/281 | 0.97 (0.66-1.42) | 0.95 (0.65-1.40) | 92/268 | 1.06 (0.70-1.60) | 1.06 (0.70-1.60) | 137/353 | 1.32 (0.85-2.04) | 1.30 (0.84-2.02) | ||||||
| Often | 23/79 | 0.84 (0.47-1.50) | 0.84 (0.47-1.50) | 102/258 | 1.27 (0.84-1.92) | 1.28 (0.85-1.94) | 75/233 | 1.03 (0.64-1.65) | 1.02 (0.64-1.65) | ||||||
| Fairly often | 8/17 | 1.64 (0.59-4.53) | 1.62 (0.58-4.51) | 13/37 | 0.97 (0.45-2.09) | 0.98 (0.45-2.10) | 19/43 | 1.60 (0.77-3.30) | 1.63 (0.79-3.37) | ||||||
| 50-59 y (n = 660) | |||||||||||||||
| Hardly ever | 41/119 | 1.00 | 0.68 | 1.00 | 0.67 | 34/115 | 1.00 | 0.85 | 1.00 | 0.87 | 25/81 | 1.00 | 0.96 | 1.00 | 0.91 |
| (Reference) | (Reference) | (Reference) | (Reference) | (Reference) | (Reference) | ||||||||||
| Occasionally | 71/261 | 0.80 (0.50-1.29) | 0.81 (0.50-1.31) | 60/184 | 1.16 (0.69-1.93) | 1.17 (0.70-1.95) | 58/187 | 1.07 (0.60-1.90) | 1.09 (0.61-1.94) | ||||||
| Sometimes | 63/208 | 0.93 (0.57-1.52) | 0.93 (0.57-1.52) | 47/181 | 0.84 (0.49-1.43) | 0.85 (0.50-1.45) | 66/221 | 0.99 (0.56-1.74) | 1.02 (0.58-1.80) | ||||||
| Often | 19/63 | 0.96 (0.49-1.90) | 0.97 (0.49-1.91) | 50/156 | 1.13 (0.66-1.93) | 1.15 (0.67-1.97) | 37/146 | 0.82 (0.44-1.52) | 0.84 (0.45-1.56) | ||||||
| Fairly often | 4/9 | 1.75 (0.43-7.01) | 1.81 (0.45-7.27) | 7/24 | 0.85 (0.32-2.26) | 0.82 (0.30-2.20) | 12/25 | 2.08 (0.82-5.29) | 2.15 (0.84-5.50) | ||||||
| 60-70 y (n = 355) | |||||||||||||||
| Hardly ever | 42/94 | 1.00 | 0.58 | 1.00 | 0.47 | 26/62 | 1.00 | 0.14 | 1.00 | 0.14 | 17/46 | 1.00 | 0.59 | 1.00 | 0.61 |
| (Reference) | (Reference) | (Reference) | (Reference) | (Reference) | (Reference) | ||||||||||
| Occasionally | 87/164 | 1.54 (0.91-2.59) | 1.52 (0.90-2.59) | 38/91 | 1.07 (0.55-2.09) | 1.02 (0.51-2.02) | 34/72 | 1.64 (0.76-3.54) | 1.58 (0.73-3.44) | ||||||
| Sometimes | 30/73 | 0.97 (0.52-1.84) | 0.92 (0.48-1.76) | 45/87 | 1.60 (0.82-3.15) | 1.55 (0.79-3.07) | 71/132 | 2.16 (1.07-4.38) | 2.04 (1.004-4.15) | ||||||
| Often | 4/16 | 0.45 (0.13-1.52) | 0.42 (0.12-1.46) | 52/102 | 1.54 (0.80-2.97) | 1.50 (0.78-2.91) | 38/87 | 1.49 (0.70-3.16) | 1.45 (0.68-3.08) | ||||||
| Fairly often | 4/8 | 1.61 (0.37-6.99) | 1.52 (0.34-6.75) | 6/13 | 1.20 (0.35-4.16) | 1.26 (0.36-4.38) | 7/18 | 1.09 (0.35-3.43) | 1.11 (0.35-3.50) | ||||||
| p for interaction by age group* | 0.53 | 0.58 | 0.058 | 0.07 | 0.18 | 0.20 | |||||||||
| Avoidance (Scale) | Fantasizing (Scale) | Self-blame (Scale) | |||||||||||||
| Total (n = 1,015) | |||||||||||||||
| Hardly ever | 151/420 | 1.00 | 0.40 | 1.00 | 0.41 | 112/319 | 1.00 | 0.73 | 1.00 | 0.89 | 137/368 | 1.00 | 0.999 | 1.00 | 0.82 |
| (Reference) | (Reference) | (Reference) | (Reference) | (Reference) | (Reference) | ||||||||||
| Occasionally | 136/383 | 1.05 (0.78-1.42) | 1.05 (0.78-1.41) | 132/375 | 1.06 (0.77-1.46) | 1.05 (0.76-1.46) | 141/412 | 0.97 (0.71-1.31) | 0.94 (0.69-1.28) | ||||||
| Sometimes | 61/173 | 1.08 (0.74-1.59) | 1.08 (0.73-1.58) | 96/238 | 1.36 (0.95-1.94) | 1.35 (0.94-1.93) | 67/186 | 1.00 (0.69-1.46) | 0.98 (0.67-1.44) | ||||||
| Often | 16/31 | 2.25 (1.06-4.79) | 2.22 (1.04-4.75) | 20/63 | 0.87 (0.48-1.57) | 0.80 (0.43-1.46) | 18/40 | 1.24 (0.63-2.43) | 1.18 (0.60-2.33) | ||||||
| Fairly often | 1/8 | 0.26 (0.03-2.17) | 0.27 (0.03-2.28) | 5/20 | 0.63 (0.22-1.81) | 0.59 (0.20-1.71) | 2/9 | 0.47 (0.09-2.41) | 0.40 (0.08-2.08) | ||||||
| 50-59 y (n = 660) | |||||||||||||||
| Hardly ever | 74/256 | 1.00 | 0.49 | 1.00 | 0.48 | 57/201 | 1.00 | 0.24 | 1.00 | 0.28 | 61/224 | 1.00 | 0.32 | 1.00 | 0.34 |
| (Reference) | (Reference) | (Reference) | (Reference) | (Reference) | (Reference) | ||||||||||
| Occasionally | 80/258 | 1.16 (0.79-1.71) | 1.17 (0.79-1.72) | 69/251 | 0.97 (0.64-1.48) | 0.96 (0.63-1.47) | 93/299 | 1.26 (0.85-1.86) | 1.26 (0.85-1.86) | ||||||
| Sometimes | 34/120 | 1.04 (0.63-1.69) | 1.04 (0.63-1.70) | 58/158 | 1.50 (0.95-2.36) | 1.48 (0.94-2.34) | 37/113 | 1.42 (0.86-2.34) | 1.43 (0.87-2.37) | ||||||
| Often | 10/21 | 2.54 (1.01-6.37) | 2.53 (1.01-6.36) | 11/40 | 0.97 (0.45-2.08) | 0.92 (0.43-2.01) | 7/18 | 1.72 (0.63-4.70) | 1.70 (0.62-4.68) | ||||||
| Fairly often | 0/5 | 0.00 | 0.00 | 3/10 | 1.26 (0.31-5.09) | 1.20 (0.29-4.92) | 0/6 | 0.00 | 0.00 | ||||||
| 60-70 y (n = 355) | |||||||||||||||
| Hardly ever | 77/164 | 1.00 | 0.47 | 1.00 | 0.52 | 55/118 | 1.00 | 0.45 | 1.00 | 0.34 | 76/144 | 1.00 | 0.33 | 1.00 | 0.15 |
| (Reference) | (Reference) | (Reference) | (Reference) | (Reference) | (Reference) | ||||||||||
| Occasionally | 56/125 | 0.96 (0.60-1.55) | 0.95 (0.58-1.53) | 63/124 | 1.23 (0.74-2.06) | 1.25 (0.74-2.11) | 48/113 | 0.67 (0.40-1.10) | 0.59 (0.35-1.00) | ||||||
| Sometimes | 27/53 | 1.30 (0.69-2.45) | 1.26 (0.66-2.41) | 38/80 | 1.14 (0.64-2.03) | 1.12 (0.62-2.02) | 30/73 | 0.65 (0.36-1.15) | 0.58 (0.32-1.04) | ||||||
| Often | 6/10 | 1.83 (0.49-6.84) | 1.75 (0.47-6.55) | 9/23 | 0.77 (0.30-1.97) | 0.65 (0.25-1.72) | 11/22 | 0.89 (0.36-2.20) | 0.77 (0.30-1.95) | 0.82 | |||||
| Fairly often | 1/3 | 0.55 (0.05-6.37) | 0.61 (0.05-7.00) | 2/10 | 0.35 (0.07-1.73) | 0.33 (0.07-1.71) | 2/3 | 1.70 (0.15-19.92) | 1.06 (0.09-12.59) | ||||||
| p for interaction by age group* | 0.26 | 0.27 | 0.96 | 0.96 | 0.94 | 0.96 | |||||||||
Each coping behavior was independently analyzed. The p-values of the Hosmer-Lemeshow test were above 0.05 for all the analyses. Model 1. Adjusted for sex, age, and education. Model 2. Adjusted for sex, age, education, depression, ischemic heart disease, diabetes mellitus, regular alcohol consumption, and smoking habit.
Table 2B
Odds ratio and 95% confidence intervals for multiple-domain MCI and dementia with cognitively healthy and single-domain MCI as reference values according to the original scale of coping behaviors (n = 1015)
| Model 1† | Model 2‡ | Model 1† | Model 2‡ | Model 1† | Model 2‡ | ||||||||||
| Number | OR | p for | OR | p for | Number | OR | p for | OR | p for | Number | OR | p for | OR | p for | |
| (case/all) | (95% CI) | trend | (95% CI) | trend | (case/all) | (95% CI) | trend | (95% CI) | trend | (case/all) | (95% CI) | trend | (95% CI) | trend | |
| Consulting someone (Scale) | Planning (Scale) | Positive reappraisal (Scale) | |||||||||||||
| Total (n = 1,015) | |||||||||||||||
| Hardly ever | 57/213 | 1.00 | 0.89 | 1.00 | 0.93 | 48/177 | 1.00 | 0.50 | 1.00 | 0.58 | 28/127 | 1.00 | 0.91 | 1.00 | 0.87 |
| (Reference) | (Reference) | (Reference) | (Reference) | (Reference) | (Reference) | ||||||||||
| Occasionally | 108/425 | 1.06 (0.72-1.56) | 1.07 (0.72-1.58) | 67/275 | 0.91 (0.58-1.42) | 0.90 (0.59-1.42) | 63/259 | 1.32 (0.78-2.23) | 1.32 (0.78-2.24) | ||||||
| Sometimes | 63/281 | 1.05 (0.68-1.61) | 1.04 (0.67-1.61) | 66/268 | 0.97 (0.62-1.52) | 0.97 (0.62-1.52) | 102/353 | 1.50 (0.92-2.46) | 1.48 (0.90-2.43) | ||||||
| Often | 16/79 | 0.97 (0.50-1.87) | 0.98 (0.51-1.90) | 61/258 | 0.89 (0.56-1.41) | 0.92 (0.58-1.45) | 42/233 | 0.86 (0.50-1.50) | 0.87 (0.50-1.52) | ||||||
| Fairly often | 5/17 | 1.21 (0.39-3.73) | 1.16 (0.37-3.66) | 7/37 | 0.64 (0.26-1.58) | 0.64 (0.26-1.60) | 14/43 | 1.98 (0.90-4.35) | 2.04 (0.93-4.50) | ||||||
| 50-59 y (n = 660) | |||||||||||||||
| Hardly ever | 30/119 | 1.00 | 0.95 | 1.00 | 0.997 | 27/115 | 1.00 | 0.12 | 1.00 | 0.14 | 16/81 | 1.00 | 0.60 | 1.00 | 0.55 |
| (Reference) | (Reference) | (Reference) | (Reference) | (Reference) | (Reference) | ||||||||||
| Occasionally | 46/261 | 0.74 (0.43-1.27) | 0.77 (0.45-1.33) | 42/184 | 0.99 (0.56-1.75) | 1.00 (0.57-1.77) | 37/187 | 1.16 (0.59-2.29) | 1.23 (0.62-2.43) | ||||||
| Sometimes | 38/208 | 0.81 (0.46-1.41) | 0.83 (0.47-1.45) | 29/181 | 0.67 (0.37-1.23) | 0.68 (0.37-1.26) | 45/221 | 1.19 (0.62-2.30) | 1.26 (0.65-2.46) | ||||||
| Often | 13/63 | 1.02 (0.47-2.20) | 1.04 (0.48-2.25) | 27/156 | 0.74 (0.40-1.37) | 0.77 (0.41-1.43) | 22/146 | 0.88 (0.42-1.85) | 0.93 (0.44-1.95) | ||||||
| Fairly often | 2/9 | 0.93 (0.18-4.91) | 1.01 (0.19-5.39) | 4/24 | 0.56 (0.17-1.83) | 0.52 (0.16-1.72) | 9/25 | 2.63 (0.95-7.25) | 2.73 (0.98-7.62) | ||||||
| 60-70 y (n = 355) | |||||||||||||||
| Hardly ever | 27/94 | 1.00 | 0.76 | 1.00 | 0.83 | 21/62 | 1.00 | 0.48 | 1.00 | 0.46 | 12/46 | 1.00 | 0.67 | 1.00 | 0.71 |
| (Reference) | (Reference) | (Reference) | (Reference) | (Reference) | (Reference) | ||||||||||
| Occasionally | 62/164 | 1.53 (0.87-2.69) | 1.57 (0.89-2.79) | 25/91 | 0.76 (0.37-1.56) | 0.75 (0.36-1.56) | 26/72 | 1.62 (0.71-3.70) | 1.59 (0.69-3.69) | ||||||
| Sometimes | 25/73 | 1.45 (0.73-2.86) | 1.42 (0.71-2.84) | 37/87 | 1.53 (0.76-3.08) | 1.50 (0.74-3.04) | 57/132 | 2.04 (0.96-4.34) | 1.98 (0.92-4.25) | ||||||
| Often | 3/16 | 0.56 (0.14-2.16) | 0.56 (0.14-2.22) | 34/102 | 1.11 (0.56-2.20) | 1.10 (0.55-2.22) | 20/87 | 0.87 (0.38-2.02) | 0.87 (0.37-2.04) | ||||||
| Fairly often | 1.53 (0.33-7.12) | 1.43 (0.28-7.26) | 3/13 | 0.75 (0.18-3.13) | 0.80 (0.19-3.38) | 5/18 | 1.32 (0.38-4.57) | 1.35 (0.39-4.73) | |||||||
| p for interaction by age group* | 0.58 | 0.68 | 0.21 | 0.23 | 0.98 | 0.94 | |||||||||
| Model 1† | Model 2‡ | Model 1† | Model 2‡ | Model 1† | Model 2‡ | ||||||||||
| Number | OR | p for | OR | p for | Number | OR | p for | OR | p for | Number | OR | p for | OR | p for | |
| (case/all) | (95% CI) | trend | (95% CI) | trend | (case/all) | (95% CI) | trend | (95% CI) | trend | (case/all) | (95% CI) | trend | (95% CI) | trend | |
| Avoidance (Scale) | Fantasizing (Scale) | Self-blame (Scale) | |||||||||||||
| Total (n = 1,015) | |||||||||||||||
| Hardly ever | 99/420 | 1.00 | 0.03 | 1.00 | 0.04 | 68/319 | 1.00 | 0.19 | 1.00 | 0.34 | 89/368 | 1.00 | 0.43 | 1.00 | 0.74 |
| (Reference) | (Reference) | (Reference) | (Reference) | (Reference) | (Reference) | ||||||||||
| Occasionally | 89/383 | 1.07 (0.76-1.50) | 1.04 (0.74-1.47) | 96/375 | 1.32 (0.91-1.90) | 1.29 (0.89-1.86) | 97/412 | 1.06 (0.75-1.49) | 1.01 (0.72-1.43) | ||||||
| Sometimes | 46/173 | 1.37 (0.89-2.09) | 1.34 (0.88-2.06) | 64/238 | 1.47 (0.98-2.20) | 1.45 (0.96-2.18) | 47/186 | 1.13 (0.74-1.72) | 1.07 (0.69-1.64) | ||||||
| Often | 14/31 | 3.54 (1.63-7.68) | 3.36 (1.54-7.34) | 16/63 | 1.19 (0.62-2.28) | 1.00 (0.51-1.97) | 15/40 | 1.69 (0.83-3.44) | 1.51 (0.73-3.11) | ||||||
| Fairly often | 1/8 | 0.45 (0.05-3.97) | 0.50 (0.06-4.33) | 5/20 | 1.21 (0.41-3.58) | 1.09 (0.36-3.27) | 1/9 | 0.33 (0.04-2.87) | 0.26 (0.03-2.32) | ||||||
| 50-59 y (n = 660) | |||||||||||||||
| Hardly ever | 48/256 | 1.00 | 0.18 | 1.00 | 0.18 | 31/201 | 1.00 | 0.08 | 1.00 | 0.11 | 36/224 | 1.00 | 0.15 | 1.00 | 0.19 |
| (Reference) | (Reference) | (Reference) | (Reference) | (Reference) | (Reference) | ||||||||||
| Occasionally | 50/258 | 1.16 (0.74-1.83) | 1.16 (0.74-1.84) | 53/251 | 1.51 (0.92-2.49) | 1.49 (0.90-2.46) | 64/299 | 1.53 (0.96-2.43) | 1.54 (0.96-2.45) | ||||||
| Sometimes | 23/120 | 1.18 (0.67-2.09) | 1.18 (0.66-2.09) | 34/158 | 1.58 (0.91-2.74) | 1.58 (0.91-2.76) | 24/113 | 1.63 (0.90-2.93) | 1.62 (0.89-2.95) | ||||||
| Often | 8/21 | 3.45 (1.31-9.13) | 3.37 (1.27-8.97) | 8/40 | 1.40 (0.58-3.39) | 1.30 (0.53-3.18) | 5/18 | 2.14 (0.70-6.59) | 2.04 (0.65-6.34) | ||||||
| Fairly often | 0/5 | 0.00 | 0.00 | 3/10 | 3.06 (0.74-12.70) | 2.82 (0.67-11.91) | 0/6 | 0.00 | 0.00 | ||||||
| 60-70 y (n = 355) | |||||||||||||||
| Hardly ever | 51/164 | 1.00 | 0.06 | 1.00 | 0.10 | 37/118 | 1.00 | 0.99 | 1.00 | 0.71 | 53/144 | 1.00 | 0.79 | 1.00 | 0.41 |
| (Reference) | (Reference) | (Reference) | (Reference) | (Reference) | (Reference) | ||||||||||
| Occasionally | 39/125 | 0.96 (0.57-1.60) | 0.92 (0.54-1.55) | 43/124 | 1.10 (0.63-1.90) | 1.10 (0.63-1.93) | 33/113 | 0.67 (0.39-1.15) | 0.59 (0.34-1.03) | ||||||
| Sometimes | 23/53 | 1.73 (0.90-3.33) | 1.61 (0.82-3.14) | 30/80 | 1.31 (0.71-2.41) | 1.25 (0.67-2.32) | 23/73 | 0.79 (0.43-1.46) | 0.69 (0.37-1.29) | ||||||
| Often | 6/10 | 3.89 (1.02-14.79) | 3.46 (0.90-13.320) | 8/23 | 0.97 (0.37-2.57) | 0.76 (0.27-2.10) | 10/22 | 1.35 (0.54-3.41) | 1.10 (0.42-2.89) | ||||||
| Fairly often | 1/3 | 0.83 (0.07-9.62) | 0.93 (0.08-10.73) | 2/10 | 0.48 (0.09-2.50) | 0.45 (0.08-2.41) | 1/3 | 0.58 (0.05-6.92) | 0.41 (0.03-5.30) | ||||||
| p for interaction by age group* | 0.42 | 0.49 | 0.65 | 0.60 | 0.64 | 0.53 | |||||||||
Each coping behavior was independently analyzed. The p-values of the Hosmer-Lemeshow test were above 0.05 for all the analyses. Model 1. Adjusted for sex, age, and education. Model 2. Adjusted for sex, age, education, depression, ischemic heart disease, diabetes mellitus, regular alcohol consumption, and smoking habit.
Tables 3A and 3B present the association between coping behavior and cognitive decline evaluated in the multiple logistic regression models. In this analysis, the use of each coping behavior was converted in a dichotomous manner, and all coping behaviors were mutually adjusted. Overall, there was no significant difference in the ORs according to coping behaviors in each adjusted model concerning cognitive decline combined with MCI and dementia (Table 3A). Conversely, the use of avoidant coping had higher odds of cognitive decline combined with multiple-domain MCI and dementia after adjusting for sex, age, and years of education (OR = 2.54, 95% CI = 1.25 to 5.18) (Table 3B). This significance was maintained in Model 2 (OR = 2.52, 95% CI = 1.23 to 5.15). The five coping behaviors (i.e., consulting, planning, positive reappraisal, fantasizing, and self-blame) showed no significant association with any cognitive decline. This includes MCI and dementia as well as multiple-domain MCI and dementia. The interaction between age and coping behaviors was examined in the converted dichotomous scale. The results are presented in Table 3A and 3B, respectively. There was no significant interaction between age and any of the investigated coping behaviors. However, the use of positive reappraisal had significantly reduced odds of cognitive decline combined with multiple-domain MCI and dementia in a subgroup of participants who were aged 60 to 70 at the time of coping assessment (OR = 0.50, 95% CI = 0.27 to 0.91 in Model 2).
Table 3A
Odds ratio and 95% confidence intervals for MCI and dementia with cognitively healthy as the reference values according to coping behaviors by age group (50-59 years and 60-70 years) (n = 1,015)
| Model 1† | Model 2‡ | ||||||||
| Total (n = 1015) | Number | OR (95% CI) | p for interaction by age group* | OR (95% CI) | p for interaction by age group* | ||||
| Occurrence of MCI and dementia with cognitively healthy as reference value | |||||||||
| Coping behaviors (Case/Non-case) | |||||||||
| Consulting someone (31/65) | 96 | 0.94 | (0.58- | 1.52) | 0.24 | 0.95 | (0.59- | 1.54) | 0.21 |
| Planning (115/180) | 295 | 1.27 | (0.92- | 1.74) | 0.32 | 1.29 | (0.93- | 1.77) | 0.35 |
| Positive reappraisal (94/182) | 276 | 0.82 | (0.59- | 1.15) | 0.90 | 0.83 | (0.60- | 1.17) | 0.91 |
| Avoidance (17/22) | 39 | 1.64 | (0.83- | 3.25) | 0.93 | 1.65 | (0.83- | 3.27) | 0.93 |
| Fantasizing (25/58) | 83 | 0.72 | (0.43- | 1.22) | 0.41 | 0.67 | (0.39- | 1.14) | 0.39 |
| Self-blame (20/29) | 49 | 1.13 | (0.61- | 2.12) | 0.60 | 1.08 | (0.58- | 2.04) | 0.62 |
| 50-59 y (n = 660) | |||||||||
| Consulting someone (23/49) | 72 | 1.16 | (0.66- | 2.03) | 1.17 | (0.66- | 2.05) | ||
| Planning (57/123) | 180 | 1.13 | (0.74- | 1.72) | 1.14 | (0.75- | 1.74) | ||
| Positive reappraisal (49/122) | 171 | 0.87 | (0.56- | 1.34) | 0.87 | (0.56- | 1.34) | ||
| Avoidance (10/16) | 26 | 1.70 | (0.73- | 3.98) | 1.71 | (0.73- | 4.00) | ||
| Fantasizing (14/36) | 50 | 0.92 | (0.47- | 1.81) | 0.89 | (0.45- | 1.76) | ||
| Self-blame (7/17) | 24 | 0.88 | (0.34- | 2.26) | 0.85 | (0.33- | 2.19) | ||
| 60-70 y (n = 355) | |||||||||
| Consulting someone (8/16) | 24 | 0.64 | (0.26- | 1.60) | 0.62 | (0.24- | 1.56) | ||
| Planning (58/57) | 115 | 1.41 | (0.85- | 2.33) | 1.41 | (0.85- | 2.35) | ||
| Positive reappraisal (45/60) | 105 | 0.75 | (0.44- | 1.28) | 0.79 | (0.46- | 1.35) | ||
| Avoidance (7/6) | 13 | 1.66 | (0.52- | 5.34) | 1.66 | (0.52- | 5.35) | ||
| Fantasizing (11/22) | 33 | 0.57 | (0.25- | 1.31) | 0.50 | (0.21- | 1.18) | ||
| Self-blame (13/12) | 25 | 1.43 | (0.60- | 3.43) | 1.31 | (0.54- | 3.18) | ||
Coping behaviors were dichotomized into yes or no; hardly ever, occasionally, and sometimes as “no” and often and fairly often as “yes.” Each coping behavior was mutually adjusted. The p-values of the Hosmer-Lemeshow test were above 0.05 for all the analyses. † Model 1. Adjusted for sex, age, and education; ‡ Model 2. Adjusted for sex, age, education, depression, ischemic heart disease, diabetes mellitus, regular alcohol consumption, and smoking habit. OR, odds ratio; CI, confidence interval. Significance is shown in bold.
Table 3B
Odds ratio and 95% confidence intervals for multiple-domain MCI and dementia with cognitively healthy and single-domain MCI as the references value according to coping behaviors by age group (50-59 years and 60-70 years) (n = 1015)
| Model 1† | Model 2‡ | ||||||||
| Total (n = 1015) | Number | OR (95% CI) | p for interaction by age group* | OR (95% CI) | p for interaction by age group* | ||||
| Occurrence of multiple-domain MCI and dementia with cognitively healthy and single-domain MCI as reference value | |||||||||
| Coping behaviors (Case/Non-case) | |||||||||
| Consulting someone (21/75) | 96 | 0.98 | (0.57- | 1.69) | 0.28 | 0.99 | (0.57- | 1.72) | 0.22 |
| Planning (68/227) | 295 | 1.03 | (0.71- | 1.48) | 0.50 | 1.05 | (0.73- | 1.51) | 0.54 |
| Positive reappraisal (56/220) | 276 | 0.69 | (0.47- | 1.02) | 0.21 | 0.72 | (0.49- | 1.06) | 0.22 |
| Avoidance (15/24) | 39 | 2.54 | (1.25- | 5.18) | 0.81 | 2.52 | (1.23- | 5.15) | 0.82 |
| Fantasizing (21/62) | 83 | 0.98 | (0.56- | 1.74) | 0.40 | 0.85 | (0.48- | 1.54) | 0.34 |
| Self-blame (16/33) | 49 | 1.23 | (0.63- | 2.41) | 0.63 | 1.14 | (0.58- | 2.26) | 0.64 |
| 50-59 y (n = 660) | |||||||||
| Consulting someone (15/57) | 72 | 1.26 | (0.65- | 2.43) | 1.26 | (0.65- | 2.44) | ||
| Planning (31/149) | 180 | 0.79 | (0.47- | 1.31) | 0.80 | (0.48- | 1.35) | ||
| Positive reappraisal (31/140) | 171 | 0.95 | (0.57- | 1.59) | 0.95 | (0.57- | 1.59) | ||
| Avoidance (8/18) | 26 | 2.30 | (0.93- | 5.71) | 2.31 | (0.92- | 5.77) | ||
| Fantasizing (11/39) | 50 | 1.26 | (0.60- | 2.65) | 1.18 | (0.55- | 2.52) | ||
| Self-blame (5/19) | 24 | 0.86 | (0.29- | 2.52) | 0.80 | (0.27- | 2.38) | ||
| 60-70 y (n = 355) | |||||||||
| Consulting someone (6/18) | 24 | 0.65 | (0.24- | 1.80) | 0.65 | (0.23- | 1.84) | ||
| Planning (37/78) | 115 | 1.32 | (0.77- | 2.27) | 1.32 | (0.77- | 2.27) | ||
| Positive reappraisal (25/80) | 105 | 0.47 | (0.26- | 0.85) | 0.50 | (0.27- | 0.91) | ||
| Avoidance (7/6) | 13 | 3.52 | (1.06- | 11.68) | 3.39 | (1.02- | 11.31) | ||
| Fantasizing (10/23) | 33 | 0.78 | (0.32- | 1.87) | 0.65 | (0.26- | 1.62) | ||
| Self-blame (11/14) | 25 | 1.68 | (0.69- | 4.10) | 1.52 | (0.61- | 3.80) | ||
Coping behaviors were dichotomized into yes or no; hardly ever, occasionally, and sometimes as “no” and often and fairly often as “yes.” Each coping behavior was mutually adjusted. The p-values of the Hosmer-Lemeshow test were above 0.05 for all the analyses. † Model 1. Adjusted for sex, age, and education; ‡ Model 2. Adjusted for sex, age, education, depression, ischemic heart disease, diabetes mellitus, regular alcohol consumption, and smoking habit. OR, odds ratio; CI = confidence interval. Significance is shown in bold.
Additionally, to evaluate robustness excluding the effects of depression, we also conducted sensitivity analysis of the participants’ sub-groups excluding depression (Supplementary Table 2). Avoidance coping was also associated with higher odds of the combination of multiple-domain MCI and dementia in model 2 (OR = 2.37, 95% CI = 1.09 to 5.15) after excluding individuals diagnosed with a major depressive disorder (n = 85, 8.4%). There was no significant difference in ORs according to the other coping behaviors and cognitive decline (Supplementary Table 2).
Supplementary Table 3 presents the odds ratios and 95% confidence intervals for cognitive impairment according to coping strategies. There were no significant differences in the ORs according to coping strategies and cognitive decline.
DISCUSSION
This study was meaningful in that to the best of our knowledge, this is the first study to investigate whether coping behavior is associated with future cognitive decline in older people from among the general population in a cohort study that is validated over a relatively long period. Furthermore, the strength of this study is that we examined and categorized the types of cognitive decline in a detailed and structured manner. In this study, frequent use of avoidant coping behavior of people in their mid- and later-lives was associated with increased odds of cognitive decline. This includes multiple-domain MCI as an MCI subtype and dementia, regardless of other lifestyle factors. Frequent use of avoidant coping was also associated with higher odds of multiple-domain MCI and dementia in the subgroup that excluded individuals with major depressive disorder.
Avoidant-oriented coping is a cognitive and emotional activity away from threat and disengagement from goal attainment [33]. The latter has been considered a mediating factor of psychiatric disorders such as depression, post-traumatic stress disorder, and alcohol dependency in many studies, including meta-analytic reviews [34, 35]. Additionally, some cross-sectional studies have reported that cognitive functions, such as autobiographical memory retrieval, are associated with avoidance [36]. In one of the few longitudinal studies, avoidant coping had a negative effect on cognitive functions of people with multiple sclerosis after three years [13]. Several perspectives can explain these effects of avoidant coping on cognition. First, avoidant coping modifies the acute response to extreme stress which is may damage to the structure and function of the brain such as by damaging the hippocampus [5]. Second, studies have also reported the influence of avoidant coping in the functional network alteration of specific brain regions [9, 37]. Interestingly, even in clinical settings, excessive use of avoidance causes ruminative thinking, which is an uncontrollable negative thought of self. It likewise causes the dysregulation of the meta-memory system [38]. These facts suggest that habitual or excessive use of avoidant coping alters the mechanism of the brain. Also, avoidance may increase the risk of dementia by affecting their lifestyle such as social isolation or cognitive inactivity. Therefore, it may be plausible that continuous avoidant coping behavior affect long-term cognitive prognosis through a multifaceted mechanism.
Other coping behaviors reported in previous studies were effortful [12], reappraisal, and religious coping [13, 14]. Notably, we found reduced odds of cognitive decline (multiple-domain MCI plus dementia) in participants who used positive reappraisal in the subgroup aged 60-70 at the time of coping assessment. As we did not find any significant interaction between age and coping behavior, it may be chance or even reverse causation. However, one study of younger adults with a long follow-up period reported that effortful coping, which differs from avoidance, was associated with future cognitive decline [12]. The possibility remains the magnitude of the effect of coping behaviors differs by age, which also warrants further study.
The approach-oriented strategies (corresponding to consulting, planning, and positive reappraisal coping in this research) are another common coping framework. These strategies are oriented toward the threats and are generally seen as more adaptive than avoidance coping [12]. The present study did not observe any significant difference between approach oriented-coping and cognitive decline in adjusted models. This non-significance may be explained by the inverse causal bias or the differences in age. Moreover, adaptive coping strategies have been reported to have less effect on psychopathology than maladaptive coping strategies [39], which suggests the possibility that future studies with larger sample sizes might be able to detect a significant effect.
Coping and perceived stress are the opposite sides of the same coin. Perceived stress itself has been regarded as a risk factor for neurodegenerative diseases, including dementia [2]. In observational studies, perceived stress has been associated with an increased risk of cognitive decline [40, 41], and this association has been confirmed in meta-analyses [42, 43]. Our results highlight coping that may mediate stress and cognitive function and provide a perspective that complements the context of these previous studies.
We defined multiple-domain MCI as one of the cutoffs for cognitive decline. Although MCI is sometimes regarded as a pre-stage of dementia, it is difficult to distinguish it from normal or pathological and clinical dementia. Reversing from MCI to a normal diagnosis by standardized criteria was fairly common among the participants (about 16% per year) [44]. Moreover, the early MCI group included a large proportion of false-positive diagnostic errors [45]. Against this background, a more comprehensive typology of MCI was proposed classifying individuals according to the extent of their deficits (single- versus multiple-domain) [31]. From the MCI subtypes, multiple-domain MCI has been reported to have a higher risk of conversion to dementia than single-domain MCI [16]. Thus, we defined multiple-domain MCI as one of the cutoffs for cognitive decline.
This study has several limitations. First, we have no baseline comparison for determining that there was cognitive decline, which means we could not remove the possibility that some of our participants already had cognitive decline at that time, especially mild cognitive decline. According to a previous study, the age-stratified prevalence of amnestic MCI under the age of 65 is 1.03 to 5% and not necessarily age-dependent [46]. As stated in the results, the percentages of participants who were categorized into single-domain MCI, multiple-domain MCI, and dementia in our study were 11.4%, 21.0%, and 3.5%, respectively. We believe that we can safely assume that a certain number of participants experienced cognitive decline during the follow-up period. In addition to the lack of data on cognitive function at the start of the study, it is also important to note that we did not collect information regarding the participants’ neurological condition other than stroke, for example, Parkinson’s disease, which is also relatively common (1% of the population above 60 years) [47] and is related to cognitive decline. In addition, we noted that the characteristics at the 10-year follow-up questionnaire of participants and non-participants in the current survey were slightly different (Supplementary Table 4). Moreover, the severity of dementia included in this study was relatively mild and might not represent the whole population with dementia. The prevalence of dementia in this study was 3.5%. According to a meta-analysis, the prevalence of dementia in Japan ranges from 2.9 to 12.5% in older people [48]. Considering that the participants were required to visit the survey center, those who already had dementia or had physical disabilities might not have been able to participate. However, we consider it unlikely that those who could not participate in the study due to life-restricting functional decline would have vastly different risk profiles from participants with mild cognitive decline, considering the progressive nature of the illness. As for the assessment of coping behaviors in 2000, out of the 219 cases who did not complete the Stress and Coping Inventory, 12.8% (n = 28) were diagnosed with dementia in 2014-2015. Such value is more than three times the 3.5% of the eligible participants. This makes us suspect that the incompletion of questionnaire itself might reflect lower cognitive ability such as executive function and can be a potential risk factor of future cognitive decline, which warrants further study. Third, the answering method is subjective and may deviate from an objective coping style. Although coping shows moderate temporal and cross-situational stability [49], it may reflect some situational variability. Last, as we did not measure coping during the 2014–2015 survey, there is a possibility that change of coping style over time had some effect on cognitive function.
In conclusion, our study indicated that avoidant coping behavior in midlife, but not others, is associated with increased risk of noticeable cognitive decline in later life. Unlike personality traits, coping behavior is regarded as a relatively modifiable factor through interventions. Considering the current success of expanded indication and diversification of psychotherapy such as CBT, our results might be able to present the hypothesis that coping could be a potential target of psychological intervention to prevent future cognitive decline. Further investigation with more detailed observational studies or intervention studies is warranted to confirm and generalize the findings. Considering the increasing social and economic burden of dementia in aging countries, preventing cognitive decline is crucial. Our findings provide a rationale for further examination of the effect of coping in the prevention of cognitive decline and as a possible target of psychological intervention.
ACKNOWLEDGMENTS
The cohort study was originally supported by the National Cancer Center Research and Development Fund. This study was supported by the SENSHIN Medical Research Foundation. The funding agency had no role in the design and conduct of the study, data collection, data management, analysis, interpretation of the data, review or approval of the manuscript, or decision to submit the manuscript for publication. The authors would like to thank Y. Miyasaka for providing technical assistance.
Authors’ disclosures available online (https://www.j-alz.com/manuscript-disclosures/21-5712r2).
SUPPLEMENTARY MATERIAL
[1] The supplementary material is available in the electronic version of this article: https://dx.doi.org/10.3233/JAD-215712.
REFERENCES
[1] | Livingston G , Huntley J , Sommerlad A , Ames D , Ballard C , Banerjee S , Brayne C , Burns A , Cohen-Mansfield J , Cooper C , Costafreda SG , Dias A , Fox N , Gitlin LN , Howard R , Kales HC , Kivimäki M , Larson EB , Ogunniyi A , Orgeta V , Ritchie K , Rockwood K , Sampson EL , Samus Q , Schneider LS , Selbæk G , Teri L , Mukadam N ((2020) ) Dementia prevention, intervention, and care: 2020 report of the Lancet Commission. Lancet 396: , 413–446. |
[2] | Peña-Bautista C , Casas-Fernández E , Vento M , Baquero M , Cháfer-Pericás C ((2020) ) Stress and neurodegeneration. Clin Chim Acta Int J Clin Chem 503: , 163–168. |
[3] | Günak MM , Billings J , Carratu E , Marchant NL , Favarato G , Orgeta V ((2020) ) Post-traumatic stress disorder as a risk factor for dementia: Systematic review and meta-analysis. Br J Psychiatry 217: , 600–608. |
[4] | Luby J , Belden A , Botteron K , Marrus N , Harms MP , Babb C , Nishino T , Barch D ((2013) ) The effects of poverty on childhood brain development: The mediating effect of caregiving and stressful life events. JAMA Pediatr 167: , 1135–1142. |
[5] | Kline SA , Mega MS ((2020) ) Stress-induced neurodegeneration: The potential for coping as neuroprotective therapy. Am J Alzheimers Dis Other Demen 35: , 1533317520960873. |
[6] | Wilson RS , Evans DA , Bienias JL , Mendes de Leon CF , Schneider JA , Bennett DA ((2003) ) Proneness to psychological distress is associated with risk of Alzheimer’s disease. Neurology 61: , 1479–1485. |
[7] | McEwen BS , Bowles NP , Gray JD , Hill MN , Hunter RG , Karatsoreos IN , Nasca C ((2015) ) Mechanisms of stress in the brain. Nat Neurosci 18: , 1353–1363. |
[8] | McEwen BS ((1998) ) Protective and damaging effects of stress mediators. N Engl J Med 338: , 171–179. |
[9] | Paban V , Deshayes C , Ferrer M-H , Weill A , Alescio-Lautier B ((2018) ) Resting brain functional networks and trait coping. Brain Connect 8: , 475–486. |
[10] | Olff M , Langeland W , Gersons BPR ((2005) ) Effects of appraisal and coping on the neuroendocrine response to extreme stress. Neurosci Biobehav Rev 29: , 457–467. |
[11] | Andreotti C , Root JC , Ahles TA , McEwen BS , Compas BE ((2015) ) Cancer, coping, and cognition: A model for the role of stress reactivity in cancer-related cognitive decline. Psychooncology 24: , 617–623. |
[12] | Albanese E , Matthews KA , Zhang J , Jacobs DR , Whitmer RA , Wadley VG , Yaffe K , Sidney S , Launer LJ ((2016) ) Hostile attitudes and effortful coping in young adulthood predict cognition 25 years later. Neurology 86: , 1227–1234. |
[13] | Ukueberuwa DM , Arnett PA ((2014) ) Evaluating the role of coping style as a moderator of fatigue and risk for future cognitive impairment in multiple sclerosis. J Int Neuropsychol Soc JINS 20: , 751–755. |
[14] | Hogarty GE , Flesher S , Ulrich R , Carter M , Greenwald D , Pogue-Geile M , Kechavan M , Cooley S , DiBarry AL , Garrett A , Parepally H , Zoretich R ((2004) ) Cognitive enhancement therapy for schizophrenia: Effects of a 2-year randomized trial on cognition and behavior. Arch Gen Psychiatry 61: , 866–876. |
[15] | Snyder K , Barry M , Plona Z , Ho A , Zhang X-Y , Valentino RJ ((2015) ) The impact of social stress during adolescence or adulthood and coping strategy on cognitive function of female rats. Behav Brain Res 286: , 175–183. |
[16] | Gainotti G , Quaranta D , Vita MG , Marra C ((2014) ) Neuropsychological predictors of conversion from mild cognitive impairment to Alzheimer’s disease. J Alzheimers Dis 38: , 481–495. |
[17] | Tsugane S , Sawada N ((2014) ) The JPHC study: Design and some findings on the typical Japanese diet. Jpn J Clin Oncol 44: , 777–782. |
[18] | von Elm E , Altman DG , Egger M , Pocock SJ , Gøtzsche PC , Vandenbroucke JP , STROBE Initiative ((2008) ) The Strengthening the Reporting of Observational Studies in Epidemiology (STROBE) statement: Guidelines for reporting observational studies. J Clin Epidemiol 61: , 344–349. |
[19] | Fukunishi I , Nakagawa T , Nakagawa H , Sone Y , Kaji N , Hosaka T , Rahe RH ((1995) ) Validity and reliability of the Japanese version of the Stress and Coping Inventory. Psychiatry Clin Neurosci 49: , 195–199. |
[20] | Svensson T , Inoue M , Sawada N , Charvat H , Iwasaki M , Sasazuki S , Shimazu T , Yamaji T , Kawamura N , Shibuya K , Mimura M , Tsugane S , for the JPHC Study Group ((2016) ) Coping strategies and risk of cardiovascular disease incidence and mortality: The Japan Public Health Center-based prospective Study. Eur Heart J 37: , 890–899. |
[21] | Svensson T , Inoue M , Charvat H , Sawada N , Iwasaki M , Sasazuki S , Shimazu T , Yamaji T , Ikeda A , Kawamura N , Mimura M , Tsugane S , Japan Public Health Center-based Prospective Study Group ((2014) ) Coping behaviors and suicide in the middle-aged and older Japanese general population: The Japan Public Health Center-based Prospective Study. Ann Epidemiol 24: , 199–205. |
[22] | Svensson T , Inoue M , Sawada N , Charvat H , Iwasaki M , Sasazuki S , Shimazu T , Yamaji T , Kawamura N , Shibuya K , Mimura M , Tsugane S , JPHC Study group ((2016) ) Coping strategies and cancer incidence and mortality: The Japan Public Health Center-based prospective study. Cancer Epidemiol 40: , 126–133. |
[23] | Folstein MF , Folstein SE , McHugh PR ((1975) ) “Mini-mental state”. A practical method for grading the cognitive state of patients for the clinician. J Psychiatr Res 12: , 189–198. |
[24] | Elwood RW ((1991) ) The Wechsler Memory Scale-Revised: Psychometric characteristics and clinical application. Neuropsychol Rev 2: , 179–201. |
[25] | Agrell B , Dehlin O ((2012) ) The clock-drawing test. 1998. Age Ageing 41 Suppl 3: , iii41–45. |
[26] | Hughes CP , Berg L , Danziger WL , Coben LA , Martin RL ((1982) ) A new clinical scale for the staging of dementia. Br J Psychiatry J Ment Sci 140: , 566–572. |
[27] | Radloff LS ((1977) ) The CES-D Scale: A self-report depression scale for research in the general population. Appl Psychol Meas 1: , 385–401. |
[28] | Kroenke K , Spitzer RL , Williams JB ((2001) ) The PHQ-9: Validity of a brief depression severity measure. J Gen Intern Med 16: , 606–613. |
[29] | Fujishima M , Kawaguchi A , Maikusa N , Kuwano R , Iwatsubo T , Matsuda H , Japanese Alzheimer’s Disease Neuroimaging Initiative (ADNI), Japanese Alzheimer’s Disease Neuroimaging Initiative (J-ADNI) ((2017) ) Sample size estimation for Alzheimer’s disease trials from Japanese ADNI Serial Magnetic Resonance Imaging. J Alzheimers Dis 56: , 75–88. |
[30] | Petersen RC , Smith GE , Waring SC , Ivnik RJ , Tangalos EG , Kokmen E ((1999) ) Mild cognitive impairment: Clinical characterization and outcome. Arch Neurol 56: , 303–308. |
[31] | Petersen RC , Doody R , Kurz A , Mohs RC , Morris JC , Rabins PV , Ritchie K , Rossor M , Thal L , Winblad B ((2001) ) Current concepts in mild cognitive impairment. Arch Neurol 58: , 1985–1992. |
[32] | American Psychiatric Association (2000) Diagnostic and Statistical Manual of Mental Disorders, Fourth Edition. Washington, DC. |
[33] | Roth S , Cohen LJ ((1986) ) Approach, avoidance, and coping with stress. Am Psychol 41: , 813–819. |
[34] | Suls J , Fletcher B ((1985) ) The relative efficacy of avoidant and nonavoidant coping strategies: A meta-analysis. Health Psychol 4: , 249–288. |
[35] | Penley JA , Tomaka J , Wiebe JS ((2002) ) The association of coping to physical and psychological health outcomes: A meta-analytic review. J Behav Med 25: , 551–603. |
[36] | Ganly TJ , Salmon K , McDowall J ((2017) ) Is remembering less specifically part of an avoidant coping style? Associations between memory specificity, avoidant coping, and stress. Cogn Emot 31: , 1419–1430. |
[37] | Santarnecchi E , Sprugnoli G , Tatti E , Mencarelli L , Neri F , Momi D , Di Lorenzo G , Pascual-Leone A , Rossi S , Rossi A ((2018) ) Brain functional connectivity correlates of coping styles. Cogn Affect Behav Neurosci 18: , 495–508. |
[38] | Mohr DC , Goodkin DE , Nelson S , Cox D , Weiner M ((2002) ) Moderating effects of coping on the relationship between stress and the development of new brain lesions in multiple sclerosis. Psychosom Med 64: , 803–809. |
[39] | Krkovic K , Clamor A , Lincoln TM ((2018) ) Emotion regulation as a predictor of the endocrine, autonomic, affective, and symptomatic stress response and recovery. Psychoneuroendocrinology 94: , 112–120. |
[40] | Chen Y , Liang Y , Zhang W , Crawford JC , Sakel KL , Dong X ((2019) ) Perceived stress and cognitive decline in Chinese-American older adults. J Am Geriatr Soc 67: , S519–S524. |
[41] | Zotcheva E , Bergh S , Selbæk G , Krokstad S , Håberg AK , Strand BH , Ernstsen L ((2018) ) Midlife physical activity, psychologicaldistress, and dementia risk: The HUNT Study.. J Alzheimers Dis 66: , 825–833. |
[42] | Stuart KE , Padgett C ((2020) ) A systematic review of the association between psychological stress and dementia risk in humans. J Alzheimers Dis 78: , 335–352. |
[43] | Franks KH , Bransby L , Saling MM , Pase MP ((2021) ) Association of stress with risk of dementia and mild cognitive impairment: A systematic review and meta-analysis. J Alzheimers Dis 82: , 1573–1590. |
[44] | Koepsell TD , Monsell SE ((2012) ) Reversion from mild cognitive impairment to normal or near-normal cognition: Risk factors and prognosis. Neurology 79: , 1591–1598. |
[45] | Edmonds EC , McDonald CR , Marshall A , Thomas KR , Eppig J , Weigand AJ , Delano-Wood L , Galasko DR , Salmon DP , Bondi MW , Alzheimer’s Disease Neuroimaging Initiative ((2019) ) Early versus late MCI: Improved MCI staging using a neuropsychological approach. Alzheimers Dement 15: , 699–708. |
[46] | Ward A , Arrighi HM , Michels S , Cedarbaum JM ((2012) ) Mild cognitive impairment: Disparity of incidence and prevalence estimates. Alzheimers Dement 8: , 14–21. |
[47] | Tysnes O-B , Storstein A ((2017) ) Epidemiology of Parkinson’s disease. J Neural Transm 124: , 901–905. |
[48] | Okamura H , Ishii S , Ishii T , Eboshida A ((2013) ) Prevalence of dementia in Japan: A systematic review. Dement Geriatr Cogn Disord 36: , 111–118. |
[49] | Moos RH , Brennan PL , Schutte KK , Moos BS ((2006) ) Older adults’ coping with negative life events: Common processes of managing health, interpersonal, and financial/work stressors. Int J Aging Hum Dev 62: , 39–59. |


