
Visually Identified Tau 18F-MK6240 PET Patterns in Symptomatic Alzheimer’s Disease
Abstract
Background:
In Alzheimer’s disease, heterogeneity has been observed in the postmortem distribution of tau neurofibrillary tangles. Visualizing the topography of tau in vivo may facilitate clinical trials and clinical practice.
Objective:
This study aimed to investigate whether tau distribution patterns that are limited to mesial temporal lobe (MTL)/limbic regions, and those that spare MTL regions, can be visually identified using 18F-MK6240, and whether these patterns are associated with different demographic and cognitive profiles.
Methods:
Tau 18F-MK6240 PET images of 151 amyloid-β positive participants with mild cognitive impairment (MCI) and dementia were visually rated as: tau negative, limbic predominant (LP), MTL-sparing, and Typical by two readers. Groups were evaluated for differences in age, APOE ɛ4 carriage, hippocampal volumes, and cognition (MMSE, composite memory and non-memory scores). Voxel-wise contrasts were also performed.
Results:
Visual rating resulted in 59.6% classified as Typical, 17.9% as MTL-sparing, 9.9% LP, and 12.6% as tau negative. Intra-rater and inter-rater reliability was strong (Cohen’s kappa values of 0.89 and 0.86 respectively). Tracer retention in a “hook”-like distribution on sagittal sequences was observed in the LP and Typical groups. The visually classified MTL-sparing group had lower APOE ɛ4 carriage and relatively preserved hippocampal volumes. Higher MTL tau was associated with greater amnestic cognitive impairment. High cortical tau was associated with greater impairments on non-memory domains of cognition, and individuals with high cortical tau were more likely to have dementia than MCI.
Conclusion:
Tau distribution patterns can be visually identified using 18F-MK6240 PET and are associated with differences in APOE ɛ4 carriage, hippocampal volumes, and cognition.
INTRODUCTION
Alzheimer’s disease (AD) is a progressive neurodegenerative condition characterized by extracellular amyloid-β (Aβ) plaques, intracellular tau neurofibrillary tangles (NFT) and neurodegeneration. In AD, clinical manifestations, patterns of atrophy, and regional glucose hypometabolism are linked to the in vivo regional distribution of tau [1–4].
The spatiotemporal distribution of tau has been considered relatively stereotyped, consistent with the Braak staging system [5, 6]. This classification system describes six stages of tau deposition, with initial deposition in trans-entorhinal and entorhinal regions, extending into limbic regions, with later involvement of association cortices [5]. Postmortem studies of individuals with AD have identified patterns of tau distribution that depart from the Braak framework [7, 8]. These include limbic predominant (LP) and hippocampal sparing (HpSp) subtypes [7, 8]. On postmortem analysis, the LP subtype has been characterized by a higher burden of tau in limbic regions with sparing of the cortex, and the HpSp subtype has been characterized by high cortical tau with relative sparing of the hippocampus and limbic regions [7]. This heterogeneity in the distribution of tau has been associated with differences in the presentation of AD, with these studies reporting that individuals with AD who have a LP or HpSp subtype on postmortem differ in their age of symptom onset [7, 8], and rate of cognitive decline [7] relative to individuals with high tau burden in both the MTL and cortex.
18F-Flortaucipir has recently become the first tau PET tracer approved for clinical use in AD [9]. Visualizing the topography of tau in vivo could facilitate clinical trials and clinical practice. A visual read method for 18F-Flortaucipir has identified mesial temporal lobe (MTL) and focal cortical tracer retention patterns associated with AD [10]. However, choroid plexus off-target binding of 18F-Flortaucipir makes interpretation of tracer retention in the hippocampus challenging [11]. Tau tracer 18F-MK6240 has high affinity for tau NFT in AD [12], has a two-fold higher dynamic range for mesial temporal standardized uptake value ratio (SUVR) compared to 18F-Flortaucipir [11], and lacks off-target binding in the choroid plexus above the hippocampus [13]. Thus, we aimed to investigate whether i) tau distribution patterns that are limited to MTL/limbic regions, or that spare MTL regions, could be visually identified using 18F-MK6240; and ii) determine whether these visually classified groups differ in terms of their demographic characteristics, cognitive profiles or APOE genotype.
MATERIALS AND METHODS
Participants (primary analysis)
Participants from the Australian Imaging Biomarkers and Lifestyle (AIBL) study of ageing [14] and the Australian Dementia Network were included if they completed an Aβ and tau 18F-MK6240 PET scan prior to January 2021. Participants were included if they met the following criteria: 1) ≥50 years of age; 2) Aβ positive (Centiloid >25); 3) were fluent in English; 4) had completed at least 7 years of education; 5) did not have any history of neurological or psychiatric disorders, drug or alcohol abuse or dependence, or any other unstable medical condition; and 6) were given a contemporaneous clinical diagnosis of mild cognitive impairment (MCI) or AD dementia, based on their performance on a battery of cognitive assessments that AIBL participants undergo every 12 to 18 months. A multi-disciplinary clinical review panel, blinded to Aβ and tau 18F-MK6240 PET results, determines whether participants meet criteria for a diagnosis of MCI or AD dementia in accordance with international consensus criteria, as previously described [15]. All relevant institutional review boards approved this study. Written informed consent was obtained from all participants.
Neuropsychology assessment
All participants completed the full AIBL neuropsychology assessment battery, as described previously [14]. In this study, the Mini-Mental State Examination (MMSE) total score was used to assess global cognition, and composite scores were used to assess 1) memory and 2) non-memory domains of cognition. The normative sample for neuropsychology assessments used in this study comprised eighty-seven AIBL participants who were deemed cognitively unimpaired (CU) by the multi-disciplinary clinical review panel, based on their neuropsychology assessments [14]. These participants were selected to comprise the normative sample if they had a classification of CU at their baseline visit and at 18-months follow-up, and were negative for Aβ, tau, and neurodegeneration. This normative sample had the following characteristics: 1) 46% male; 2) mean age 68.0±3.7; 3) MMSE ≥28, Clinical Dementia Rating total and sum of boxes = 0; and Geriatric Depression score <5.
The test scores obtained by participants in the primary analysis were standardized using the means and standard deviations of the test scores obtained from the normative sample. These z-scores were averaged across the tests to generate two cognitive composite scores. The composite memory score comprised the participants’ scores from the following tests: the California Verbal Learning Test II (CVLT-II) long delay, the Rey Complex Figure Test (RCFT) long delay, and the Logical Memory (LM) long delay. The composite non-memory score comprised the scores on the following tests: RCFT copy, Boston Naming Test (30 item; BNT), Verbal Fluency (FAS total score), digit span total, digit symbol (coding) and category fluency tasks (animals and boys names total score).
APOE genotyping
APOE genotype was determined from whole blood extracted DNA, as per the previously described methodology [15], and was available for 122/151 participants. APOE ɛ4 was dichotomized into the presence (heterozygous, homozygous) or absence (no copies) of the ɛ4 allele.
Statistical analysis for demographics and cognition
To compare demographic characteristics between groups, one-way between subjects’ analysis of variance (ANOVA) with post-hoc Tukey’s HSD was performed for continuous variables and chi-square tests with pair-wise z-tests for categorical variables. To evaluate the relationship between the visual rating classification and cognitive measures, analysis of covariance (ANCOVA) was performed, where the independent variable was the visual rating classification (fixed factor), and the dependent variable was the cognitive score (MMSE, composite memory or composite non-memory score), adjusted for age and Aβ burden (Centiloid).
Image acquisition
Tau PET imaging involved the intravenous administration of 185 MBq (±10%) 18F-MK6240 with a 20-min acquisition time commencing 90 min post-injection. Aβ PET imaging involved the intravenous administration of 200 MBq (±10%) 18F-NAV4694 with a 20-min acquisition commencing 50 min post-injection. PET scans were acquired on one of two scanners: Philips TF64 PET/CT or a Siemens Biograph mCT. Philips TF64 PET/CT scans (n = 76) were reconstructed using LOR 3D Ramla algorithm and the smoothing parameter was set as sharp. Siemens Biograph mCT scans (n = 75) were reconstructed using an OSEM-3D with 4 iterations and 12 subsets. Low dose CT was obtained for attenuation correction. All participants had a structural 3T MRI on a Siemens Skyra scanner to obtain high-resolution T1 weighted anatomical magnetization-prepared rapid gradient echo (MPRAGE) sequences.
Image analysis
Tau 18F-MK6240 PET scans were spatially normalized into MNI space using a CapAIBL PCA-based approach [16] and scaled using the cerebellar cortex as the reference region (Supplementary Figure 1). A gray matter inclusion mask [17] and a meninges exclusion mask were applied. To generate the meninges mask, 40 Aβ negative CU AIBL participants’ 18F-MK6240 PET scans were visually assessed for the presence of meninges uptake. Mean scans for participants with or without uptake in the meninges (19 versus 21 individuals) were generated, and the meninges mask was generated as the difference between these two mean images. Aβ PET scans were spatially normalized using CapAIBL, and the CapAIBL approach was applied for quantitation [18]. Centiloid >25 defined a positive scan [19]. T1-weighted MR sequences were used to generate hippocampal volumes, using a method previously described [20].
Fig. 1
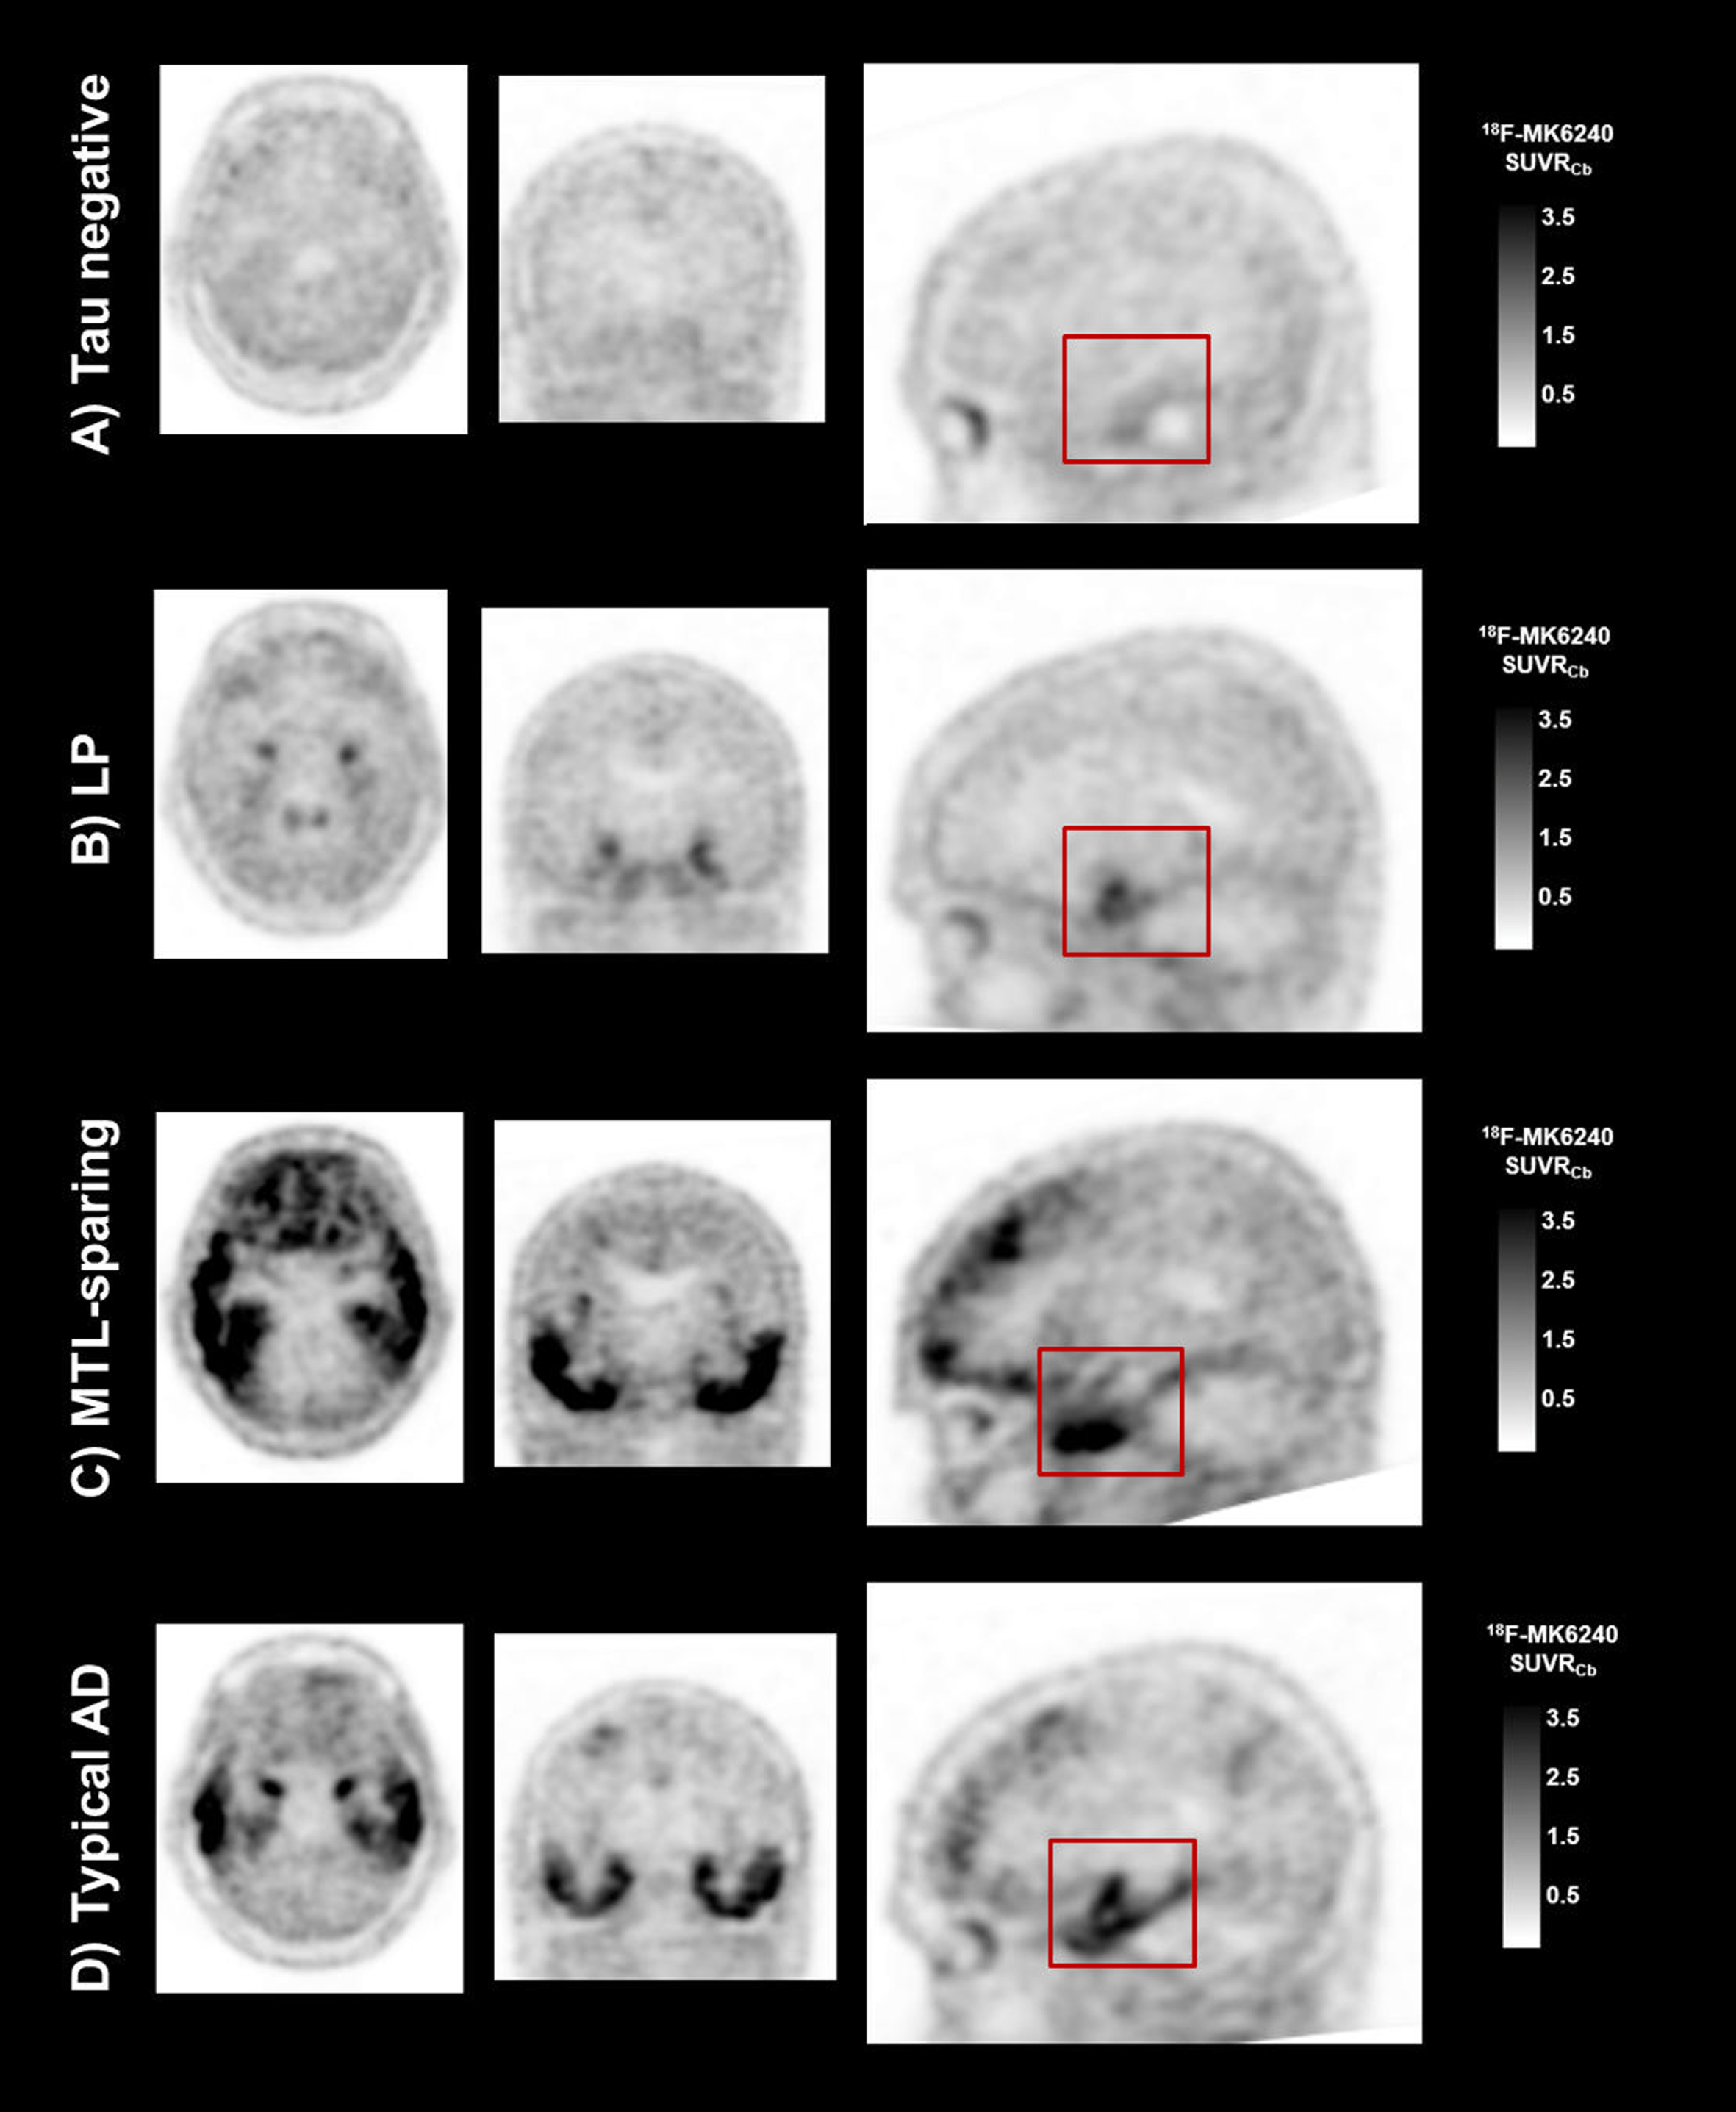
Examples of the four tau 18F-MK6240 PET visual classification categories. Representative tau 18F-MK6240 PET SUVR images for participants classified as A) tau negative; B) LP predominant; C) MTL-sparing; and D) Typical. The red boxes highlight 18F-MK6240 tracer retention in a “hook”-like distribution, observed in the LP and Typical cases, and the relative absence of 18F-MK6240 tracer retention in these structures in the MTL-sparing case, where instead tracer retention is observed in the inferior temporal lobe.
Tau 18F-MK6240 PET visual classification
The visual rating approach to classify the tau 18F-MK6240 scans was established on a set of 30 scans by two readers (SAS, CCR). There were four visual classification categories: 1) tau negative (representing no 18F-MK6240 retention, or 18F-MK6240 retention limited to rhinal and entorhinal regions); 2) limbic predominant (LP) (representing 18F-MK6240 tracer retention in a “hook”-like distribution on sagittal slices in the mesial temporal lobe (MTL), with or without extension into the inferior temporal lobe, and no other cortical retention); 3) mesial temporal lobe sparing (MTL-sparing) (representing cortical 18F-MK6240 tracer retention, with no or minimal tracer retention in a “hook”-like distribution in the MTL); and Typical (representing both MTL and cortical 18F-MK6240 tracer retention) (Fig. 1). A third reader (NK) was trained in this approach. Training comprised receiving a description of these visual classification categories, and completing a training set of 10 scans that included examples from the four categories (blind to participant characteristics). Further details about this method are outlined in the Supplementary Material.
The entire set of scans was then independently rated by two readers (CCR and NK), blind to participant characteristics in MedView (version 12), using a white-black scale, without MR overlay. A color-scale was not utilized. The expert reader (CCR) was a Nuclear Medicine Physician with over 4-years of research experience with 18F-MK6240 PET imaging, who read the entire set of 18F-MK6240 scans 18-months after the initial visual rating approach was established. The second reader (NK) rated the scans twice (9-months apart), with the second read performed blind to the results from the first read. Cohen’s kappa statistic was used to calculate intra- and inter-rater reliability. Where the two readers differed in their responses, the scans were jointly reviewed, and consensus classification determined. The consensus classification was used for all further analyses presented.
Tau 18F-MK6240 voxel-wise analysis
As all the 18F-MK6240 images were in the same standard space, statistical analysis at a voxel-wise level was performed. T-map images were computed, corresponding to voxel-wise relative differences between groups, with a threshold of significance of p < 0.001 (uncorrected for multiple comparisons).
Tau 18F-MK6240 region of interest analysis
ROI analysis was performed. This analysis was not independent to the visual classification, but rather was performed to compare the quantitative burden of 18F-MK6240 in the MTL and cortex across the visually classified groups. Standardized uptake value ratios (SUVR) were generated for three composite ROI: mesial temporal (Me) (comprising the entorhinal cortex, amygdala, hippocampus and parahippocampal gyrus), temporoparietal (Te) (comprising the inferior and middle temporal, fusiform, supramarginal and angular gyri, posterior cingulate/precuneus, superior and inferior parietal, and lateral occipital cortices); and rest of neocortex (R) (comprising the dorsolateral and ventrolateral prefrontal, orbitofrontal cortex, gyrus rectus, superior temporal, and anterior cingulate) [21].
RESULTS
Visually classified groups
Of the 529 AIBL participants who completed an Aβ and a tau 18F-MK6240 PET scan prior to January 2021, 151 met inclusion criteria. Participants’ 18F-MK6240 PET scans were visually classified into four categories: tau negative (12.6%), LP (9.9%), MTL-sparing (17.9%), and Typical (59.6%) (Fig. 2). Strong intra-rater reliability was observed for the second reader, who rated the scans twice over a 9-month period (Cohen’s kappa 0.89, CI 0.82–0.96, p < 0.001). Strong inter-rater reliability was observed for visual rating classification against the expert reader (Cohen’s kappa 0.86, CI 0.78–0.93, p < 0.001). Supplementary Tables 1–4 show the percentage agreement between the two readers for each visual classification category.
Fig. 2
Tau 18F-MK6240 mean images for the visually classified groups. Representative transaxial (top row), coronal (middle row), and sagittal (bottom row) mean tau 18F-MK6240 PET SUVR images for the visually classified groups A) tau negative; B) limbic predominant (LP); C) mesial temporal lobe sparing (MTL-sparing); and D) Typical.
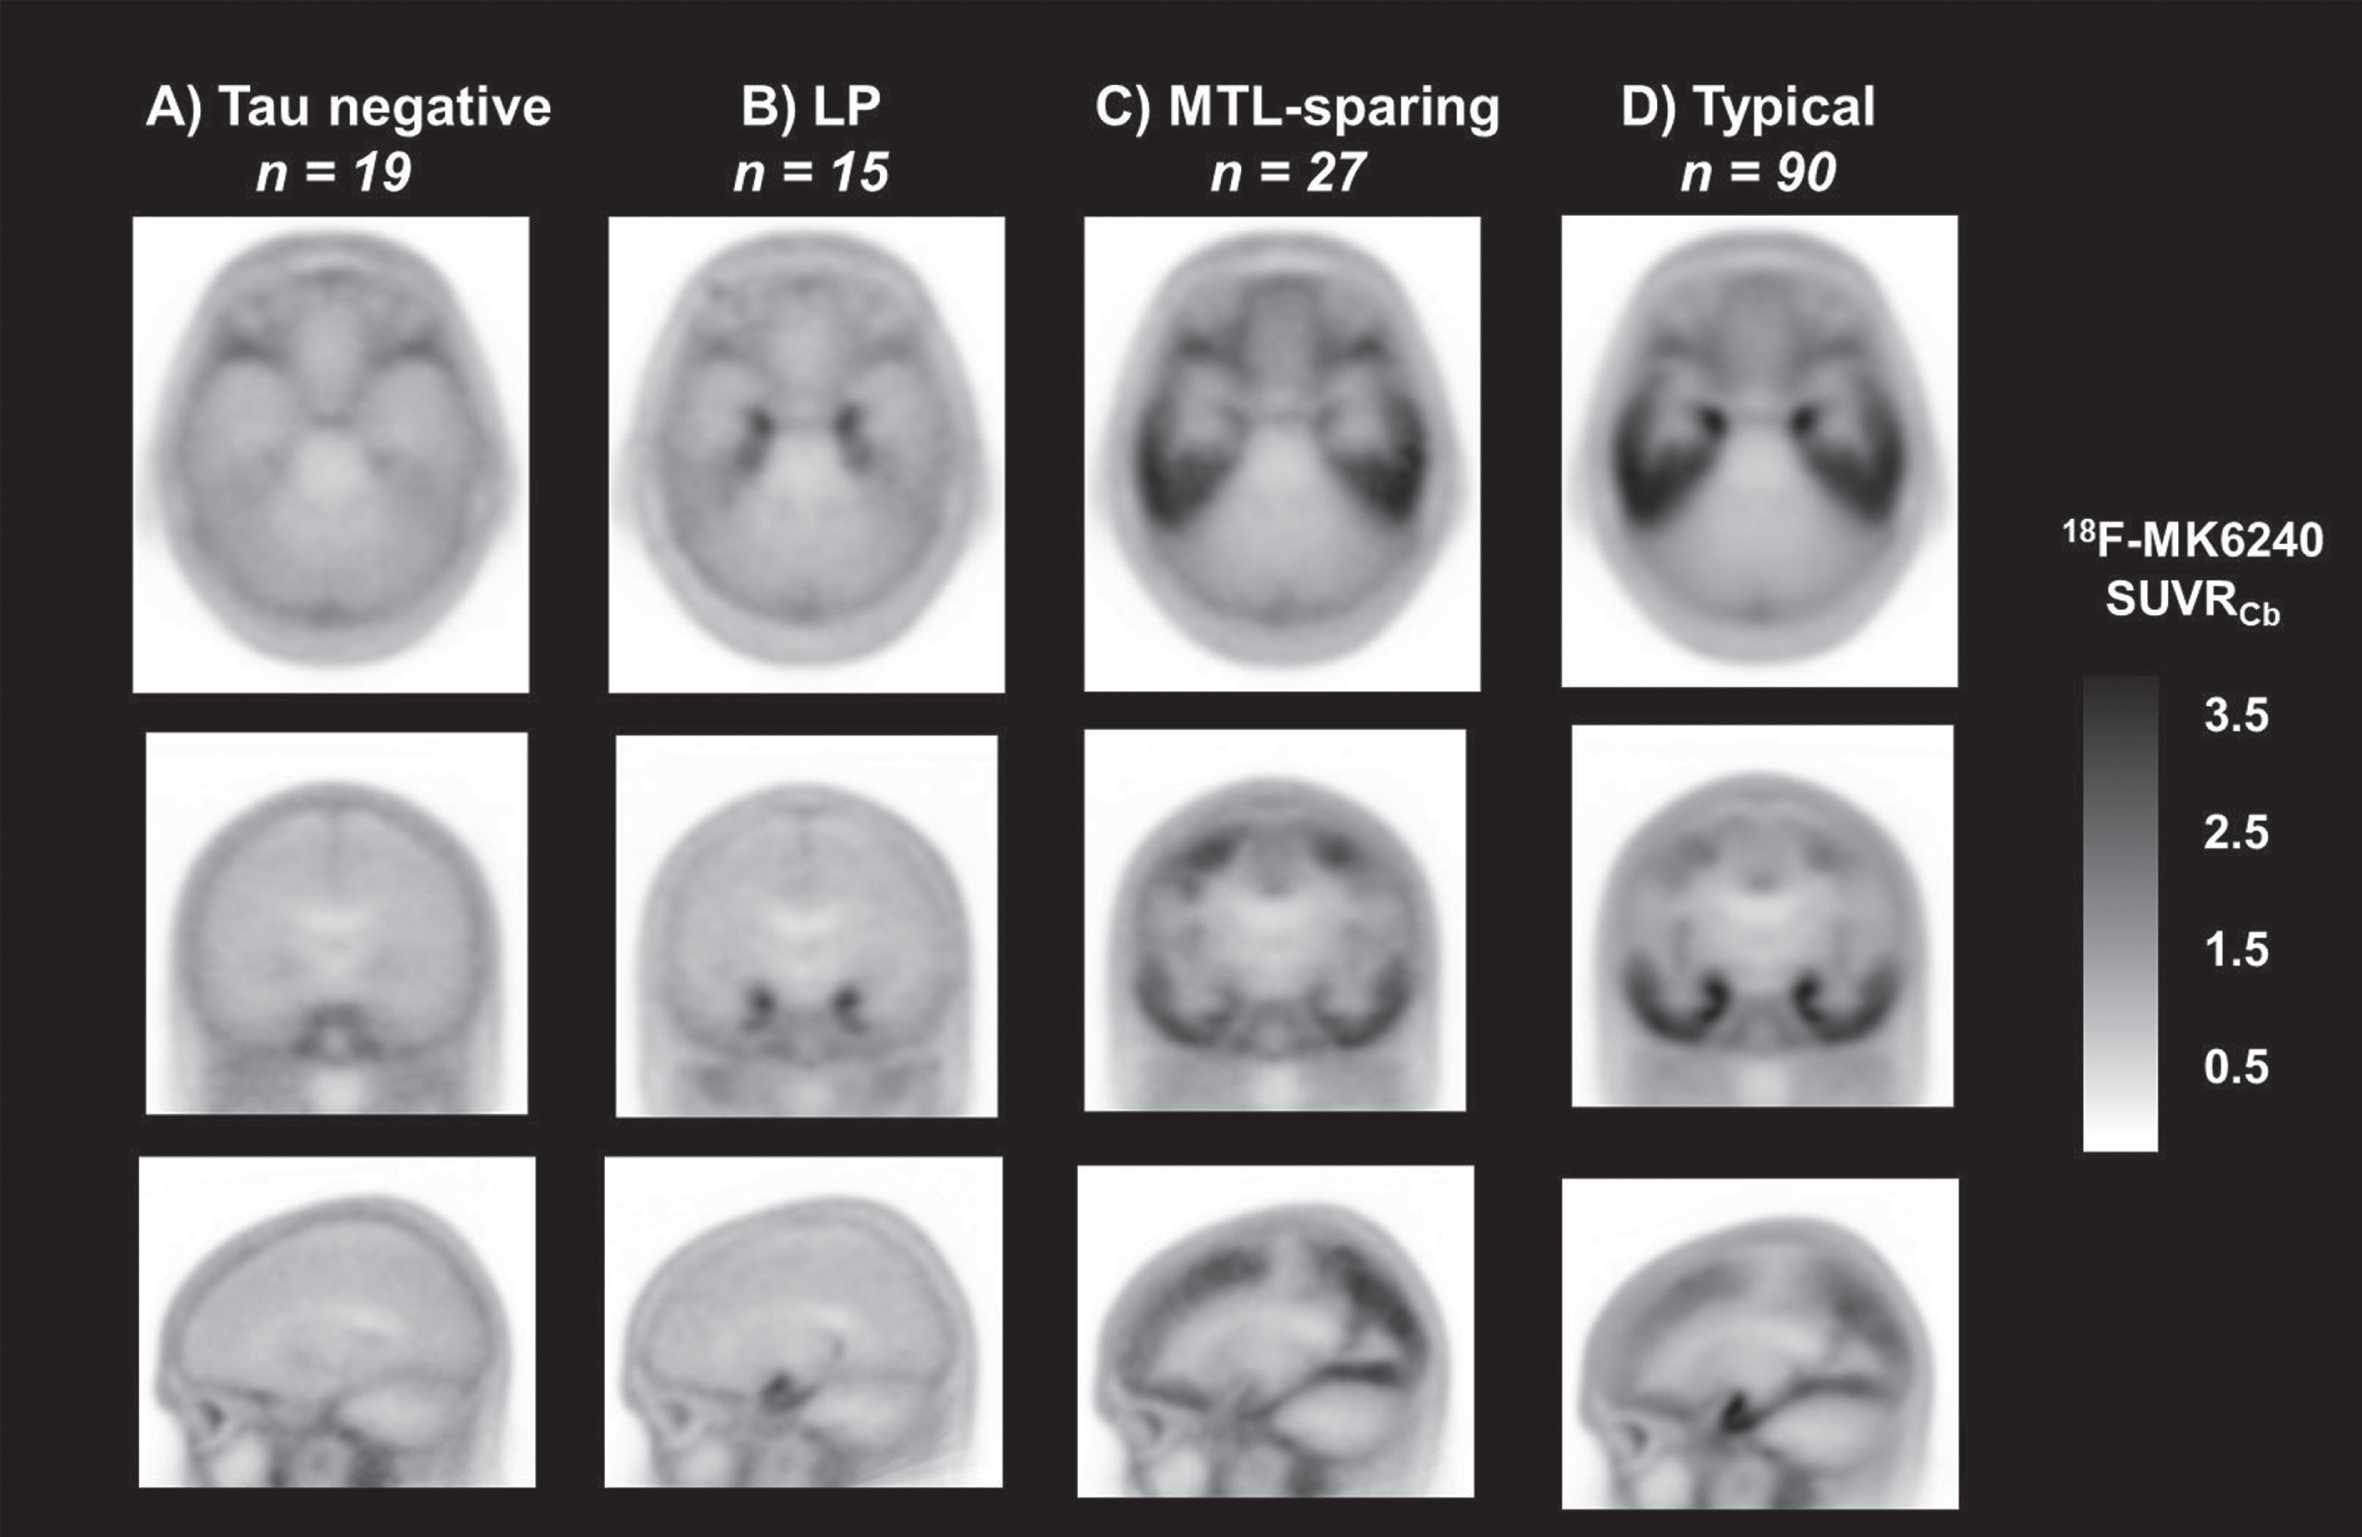
Table 1
Cohort demographics and characteristics
| Overall n = 151 | Tau negative n = 19 | LP n = 15 | MTL-sparing n = 27 | Typical n = 90 | |
| Age (y) | 72.9 (8.0) | 74.3 (6.4) | 75.9 (7.6) | 71.6 (10.6) | 72.5 (7.4) |
| Sex, F (%) | 72 (47.7) | 10 (52.6) | 5 (33.3) | 15 (55.6) | 42 (46.7) |
| Education (y) | 12.2 (3.0) | 12.5 (3.3) | 11.3 (2.6) | 12.6 (3.7) | 12.1 (2.8) |
| APOE ɛ4+ (%)* | 85 (56.3) | 11 (57.9) | 11 (73.3) | 7 (25.9) | 56 (62.2) |
| Centiloid† | 114.1 (41.6) | 62.7 (33.3) | 111.4 (37.5) | 111.7 (46.5) | 126.1 (33.6) |
| HV (cm3)‡ | 2.60 (0.3) | 2.64 (0.4) | 2.56 (0.2) | 2.90 (0.3) | 2.52 (0.3) |
| MCI n (%) | 67 (44.4) | 12 (63.2) | 10 (66.7) | 11 (40.7) | 34 (37.8) |
| Dementia n (%) | 84 (55.6) | 7 (36.8) | 5 (33.3) | 16 (59.3) | 56 (62.2) |
APOE, Apolipoprotein E; HV, hippocampal volume; MCI, mild cognitive impairment; LP, limbic predominant; MTL-sparing, mesial temporal lobe sparing. * APOE genotype was available for 17/19 tau negative, 13/15 LP, 23/27 MTL-sparing, and 69/90 Typical subgroup participants. p < 0.05, MTL-sparing versus LP; p < 0.05 MTL-sparing versus Typical. † p < 0.001, tau negative versus LP; p < 0.001 tau negative versus MTL-sparing; p < 0.001 tau negative versus Typical. ‡ HV was available for 18/19 tau negative, 12/15 LP, 21/27 MTL-sparing, and 84/90 Typical participants. p = 0.02, MTL-sparing versus LP; p < 0.001, MTL-sparing versus AD.
Characteristics of the visually classified groups
The LP group had a lower proportion of females; however, there were no significant differences across the groups in terms of age (at the time of tau 18F-MK6240 scanning), sex, or years of education (Table 1). The MTL-sparing group had a significantly lower APOE ɛ4 prevalence than the tau negative, LP, and Typical groups. While all participants were Aβ positive (Centiloid >25), as per the inclusion criteria, the tau negative group had a significantly lower mean Centiloid value than the LP, MTL-sparing and Typical groups. The LP and Typical groups had significantly smaller hippocampal volumes than the MTL-sparing group. Participants in the tau negative and LP groups were more likely to be classified as having MCI than dementia, while participants in the MTL-sparing and Typical groups were more likely to be classified as having dementia than MCI. However, these differences were not statistically significant.
Visually classified groups and cognition
Two participants (both visually classified as Typical) were outliers based on their low MMSE scores (MMSE of 3 and 8) and were excluded from further analyses of cognition. The MTL-sparing group had significantly lower MMSE scores than the tau negative and LP groups (Fig. 3A). The LP and Typical groups had significantly lower composite memory scores than the tau negative group (Fig. 3B). The Typical group also had significantly lower composite memory scores than the MTL-sparing group (Fig. 3B). The MTL-sparing group had significantly lower composite non-memory scores than the tau negative and LP groups (Fig. 3C).
Fig. 3
Visually classified groups and cognition. Cognitive scores for the visually classified groups (tau negative, limbic predominant [LP], mesial temporal lobe sparing [MTL-sparing], and Typical) as measured by the A) MMSE (where lower scores reflect a greater degree of impairment); B) composite memory score (z-score); and C) composite non-memory score (z-score). *p≤0.05; **p≤0.01; ***p≤0.001.
![Visually classified groups and cognition. Cognitive scores for the visually classified groups (tau negative, limbic predominant [LP], mesial temporal lobe sparing [MTL-sparing], and Typical) as measured by the A) MMSE (where lower scores reflect a greater degree of impairment); B) composite memory score (z-score); and C) composite non-memory score (z-score). *p≤0.05; **p≤0.01; ***p≤0.001.](https://ip.ios.semcs.net:443/media/jad/2022/88-4/jad-88-4-jad215558/jad-88-jad215558-g003.jpg)
Tau 18F-MK6240 voxel-wise analysis
Figure 4A shows voxel-wise relative differences in tau 18F-MK6240 SUVR images between the LP, MTL-sparing, and Typical groups, relative to the tau negative group. The LP group had greater tracer retention in the MTL than the tau negative group. The MTL-sparing and Typical groups had greater tracer retention in cortical regions, including the posterior cingulate, precuneus, inferior temporal, lateral temporal, lateral parietal, lateral occipital, orbitofrontal, and prefrontal cortices than the tau negative group. While both the MTL-sparing and Typical subgroups had greater tracer retention in MTL regions than the tau negative group, the effect was greater for the Typical group.
Fig. 4
Voxel-wise comparisons between visually classified groups. Voxel-wise contrasts between visually classified groups overlaid on a T1 MRI template with a threshold of significance of p < 0.001 (uncorrected for multiple comparisons). T-, tau negative; LP, limbic predominant; MTLsp, mesial temporal lobe sparing.
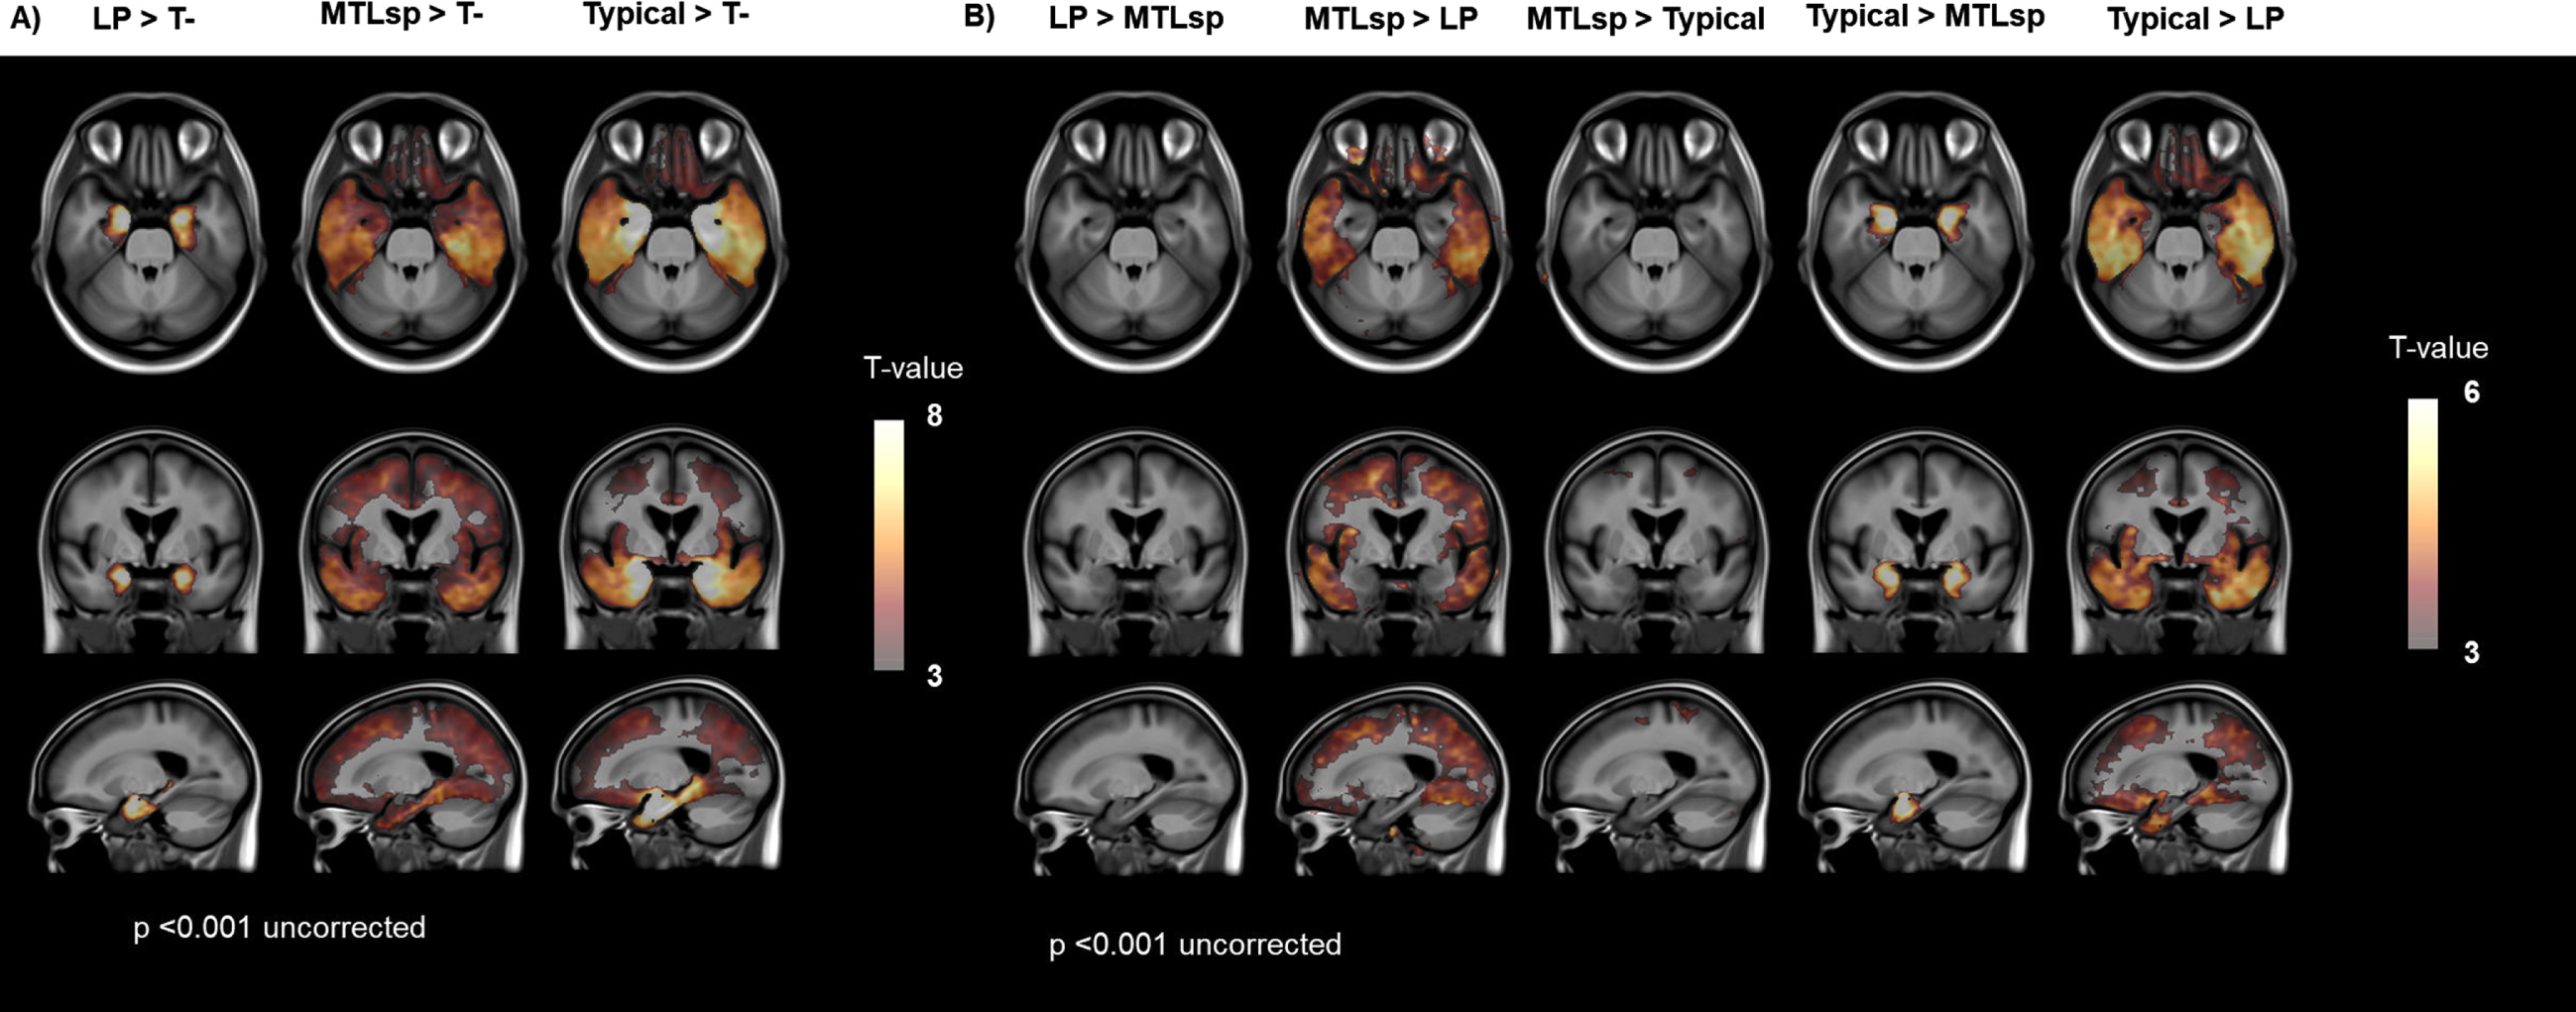
Figure 4B shows voxel-wise relative differences in tau 18F-MK6240 SUVR images between the LP, MTL-sparing and Typical groups. The LP subtype had greater tracer retention in the MTL than the MTL-sparing group (Supplementary Figure 3); however, this was not significant at a threshold of p < 0.001 (uncorrected). The MTL-sparing and Typical groups both had higher cortical tau tracer retention than the LP group. While the MTL-sparing and Typical groups both had high cortical tau, the Typical group had significantly higher tracer retention in the MTL (Supplementary Figure 4). The LP group did not have higher tracer retention in any areas compared to the Typical group (data not shown).
Tau 18F-MK6240 region-of-interest analysis
Tracer retention was quantified in three composite ROI (Me, Te, and R) for the visually classified groups. The tau negative group had low SUVR in all composite ROI (Supplementary Figure 5). The LP group had elevated Me SUVR, but low cortical SUVR (Te and R). The MTL-sparing and Typical groups had similar levels of cortical SUVR. However, the MTL-sparing group had lower Me SUVR than the Typical group.
DISCUSSION
Heterogeneity in the distribution of tau has been linked with differences in the clinical presentation of AD. In clinical settings, visual rating of PET scans is standard practice. In this study, tau 18F-MK6240 PET scans of 151 Aβ positive participants with MCI and dementia were visually classified into four categories: tau negative, LP, MTL-sparing, and Typical. Robust intra- and inter-rater reliability was observed (0.89 and 0.86, respectively). Consensus visual reads resulted in the majority being classified as Typical (60%), 10% LP, and 18% MTL-sparing. Voxel-wise contrasts showed the areas of significant difference across these groups. There were no significant differences between these groups in age or sex. The tau negative group had significantly lower Aβ burden (measured in Centiloids) than all other groups. The MTL-sparing group had significantly lower APOE ɛ4 carriage and relatively preserved hippocampal volumes compared to the LP and Typical groups. The tau negative and LP groups had a higher proportion of participants with MCI than dementia, while the MTL-sparing and Typical groups had a greater proportion of participants with dementia than MCI. The LP and Typical groups were observed to have the most impaired composite memory scores. The MTL-sparing group performed better on memory tasks than the LP and Typical groups but had worse MMSE and composite non-memory scores (which was significantly different when compared to the LP group).
Tau tracer 18F-MK6240 has characteristics favoring its use for the reliable visual inspection of tau in mesial temporal regions. Tracer retention in the MTL adopted a “hook”-like distribution on sagittal slices of tau PET images in the LP and Typical groups due to tracer binding in the parahippocampal gyrus, amygdala and anterior hippocampus (Fig. 1, Supplementary Figure 2). In contrast, the MTL-sparing group had either absent tracer retention in this distribution, or visually much lower intensity binding in this “hook”-like distribution in comparison to the degree of cortical binding. Voxel-wise contrasts showed that the LP group had higher MTL tracer retention than the MTL-sparing group (Supplementary Figure 3), which was not significant at a threshold of p < 0.001 (uncorrected). Additionally, while the MTL-sparing and Typical groups both had high cortical 18F-MK6240 tracer retention, the Typical group had higher tracer retention in the MTL. Region-of-interest analysis performed to quantify 18F-MK6240 tracer retention in the MTL and cortex for the visually classified groups also shows consistent findings (Supplementary Figure 5). These findings suggest that while there is some MTL tau in the MTL-sparing subtype, the MTL region appears spared, relative to the high cortical tracer retention visualized.
While participants in this study were all Aβ ‘positive’ (Centiloid >25), the tau negative group had a significantly lower burden of Aβ than the other groups. As we have reported recently, a moderate burden of Aβ may be necessary for tau to spread into the cortex [22]. The tau negative group may also comprise individuals with cerebral Aβ plaques and comorbid pathology, such as TDP-43, which we cannot account for, but may be contributing toward their clinical presentation sufficiently to warrant a clinical classification of MCI or dementia. The visually classified Typical group in this study had tracer retention in the MTL and cortex, as is observed in late Braak stages [5]. Postmortem analyses in individuals with AD (Braak stage V-VI) have identified LP and HpSp subtypes, classified based on the relative burden of hippocampal and cortical tau NFT observed [7, 8]. Lower NFT counts were observed in the hippocampus in the HpSp subtype, relative to the cortex [7]. The HpSp subtype has been associated with younger age of onset [7, 23], while the LP subtype has been associated with an older age of onset [7]. The HpSp subtype has been associated with relatively preserved hippocampal volumes [7], similar to the MTL-sparing group in this study. Studies that have identified analogous subtypes based on their MRI atrophy patterns found that the HpSp subtype was associated with lower APOE ɛ4 carriage [24, 25], as in this study. However, while The LP and HpSp-sparing subtypes were identified in individuals with Braak stage V–VI on postmortem evaluation, participants classified into LP and MTL-sparing groups in this study did not have this requirement. Participants who may have the HpSp subtype, and atypical AD variants, would fall into the visually classified MTL-sparing group in this study. Thus, these differences limit direct comparison to the subtypes observed at postmortem. Aβ burden has been shown to be reasonable reflection of disease duration [26]. The LP group did not differ significantly from the MTL-sparing and Typical groups in terms of Aβ burden, yet did not have tau in the cortex, beyond the inferior temporal lobe. This group may represent an earlier disease phase, based on the distribution of their tau pathology, supported by the higher frequency of participants with MCI than dementia. Longitudinal analysis would yield further insights into the spatiotemporal trajectory of tau accumulation in this group, and would be crucial in determining whether the tau negative and LP groups are distinct entities, or an earlier phase of AD.
The regional distribution of tau has been linked with the development of neurodegeneration and the clinical manifestations of AD [1–4]. The visually classified groups with high MTL tau (LP and Typical) had the most impaired performance on memory tests, while the visually classified groups with high cortical tau (MTL-sparing and Typical) had the most impaired performance on measures of non-memory cognitive domains. Greater variation in the distribution of 18F-MK6240 tracer retention was observed in the Typical group than the MTL-sparing group. Thus, differences in performance on composite non-memory scores between these two groups should be interpreted in this context.
The visual identification of 18F-MK6240 PET patterns could benefit clinical practice and clinical trials. An AD diagnosis may be under-recognized in individuals with a younger onset, predominant non-amnestic phenotype. These distribution patterns may also be contributing to the variance in cross-sectional and longitudinal studies, where the method to evaluate tau assumes the spatiotemporal distribution of tau is stereotyped. This may also impact the participant selection for clinical trials or results interpretation where 18F-MK6240 PET is used as an outcome measure. For example, an Aβ+ individual with MCI may have focal cortical tracer retention and may temporally be at an early stage of AD but could be considered to have an advanced Braak stage (V–VI). This participant may be excluded from a clinical trial that defines disease severity by Braak staging (corresponding to the participant’s 18F-MK6240 retention pattern), even though they may be early in the AD disease process.
The results in this study should be interpreted in the context of some important limitations. The sample size of this study was modest. The visual classification method was derived on the same sample as was used for the main analysis, as an independent validation dataset was not available. While strong intra- and inter-rater reliability was achieved, the visual classification was only performed by two readers. The tau negative group may comprise a few participants with very low levels of tau confined to the rhinal or entorhinal cortex. Insufficient clinical characterization of atypical AD variants in this cohort limits more detailed evaluation of the relationship between the tau PET distribution pattern and cognition. Future studies should consider that the findings reported in this study would be strengthened by a larger sample size, validation in an independent dataset, having a larger number of readers perform visual reads, and longitudinal analysis to explore how these tau distribution patterns evolve over time. Post-mortem data for 18F-MK6240, and studies exploring genetic and biological mechanisms could enhance our understanding of the potential reasons for these differences in tau distribution patterns.
Conclusion
Tau distribution patterns, including a limbic pattern and a mesial-temporal sparing pattern are visually identifiable in vivo using tau tracer 18F-MK6240. Tracer retention in a “hook”-like distribution on sagittal sequences was observed in the LP and Typical groups. The visually classified MTL-sparing group had lower APOE ɛ4 carriage and relatively preserved hippocampal volumes compared to the LP and Typical groups. High MTL tau was associated with greater amnestic cognitive impairment. High cortical tau was associated with greater impairments on non-memory domains of cognition, and individuals with high cortical tau were more likely to have dementia than MCI. The visual identification of 18F-MK6240 distribution patterns in vivo may benefit clinical practice and clinical trials.
ACKNOWLEDGMENTS
This work was supported by the NHMRC (National Health and Medical Research Council) [grant numbers APP1132604, APP1140853, APP1152623]. NK was supported by a cofunded PhD scholarship from Australian Rotary Health/ Estate of Bartolina Peluso. The data used in the preparation of this article was obtained from the Australian Imaging Biomarkers and Lifestyle flagship study of aging (AIBL), funded by the Commonwealth Scientific and Industrial Research Organization (CSIRO), National Health and Medical Research Council (NHMRC), and participating institutions. AIBL researchers are listed at www.aibl.csiro.au. The authors would like to acknowledge the Brain Research Institute. The authors thank all participants who took part in the study, as well as their families.
Authors’ disclosures available online (https://www.j-alz.com/manuscript-disclosures/21-5558r2).
SUPPLEMENTARY MATERIAL
[1] The supplementary material is available in the electronic version of this article: https://dx.doi.org/10.3233/JAD-215558.
REFERENCES
[1] | Ossenkoppele R , Schonhaut DR , Scholl M , Lockhart SN , Ayakta N , Baker SL , O’Neil JP , Janabi M , Lazaris A , Cantwell A , Vogel J , Santos M , Miller ZA , Bettcher BM , Vossel KA , Kramer JH , Gorno-Tempini ML , Miller BL , Jagust WJ , Rabinovici GD ((2016) ) Tau PET patterns mirror clinical and neuroanatomical variability in Alzheimer’s disease. Brain 139: , 1551–1567. |
[2] | La Joie R , Visani AV , Lesman-Segev OH , Baker SL , Edwards L , Iaccarino L , Soleimani-Meigooni DN , Mellinger T , Janabi M , Miller ZA , Perry DC , Pham J , Strom A , Gorno-Tempini ML , Rosen HJ , Miller BL , Jagust WJ , Rabinovici GD ((2021) ) Association of APOE4 and clinical variability in Alzheimer disease with the pattern of tau- and amyloid-PET. Neurology 96: , e650–e661. |
[3] | Xia C , Makaretz SJ , Caso C , McGinnis S , Gomperts SN , Sepulcre J , Gomez-Isla T , Hyman BT , Schultz A , Vasdev N , Johnson KA , Dickerson BC ((2017) ) Association of in vivo [18F]AV-1451 tau PET imaging results with cortical atrophy and symptoms in typical and atypical Alzheimer disease. JAMA Neurol 74: , 427–436. |
[4] | LaPoint MR , Chhatwal JP , Sepulcre J , Johnson KA , Sperling RA , Schultz AP ((2017) ) The association between tau PET and retrospective cortical thinning in clinically normal elderly. Neuroimage 157: , 612–622. |
[5] | Braak H , Braak E ((1997) ) Frequency of stages of Alzheimer-related lesions in different age categories. Neurobiol Aging 18: , 351–357. |
[6] | Scholl M , Lockhart SN , Schonhaut DR , O’Neil JP , Janabi M , Ossenkoppele R , Baker SL , Vogel JW , Faria J , Schwimmer HD , Rabinovici GD , Jagust WJ ((2016) ) PET imaging of tau deposition in the aging human brain. Neuron 89: , 971–982. |
[7] | Murray ME , Graff-Radford NR , Ross OA , Petersen RC , Duara R , Dickson DW ((2011) ) Neuropathologically defined subtypes of Alzheimer’s disease with distinct clinical characteristics: A retrospective study. Lancet Neurol 10: , 785–796. |
[8] | Jellinger KA ((2012) ) Neuropathological subtypes of Alzheimer’s disease. Acta Neuropathol 123: , 153–154. |
[9] | Jie C , Treyer V , Schibli R , Mu L ((2021) ) Tauvid: The first FDA-approved PET tracer for imaging tau pathology in Alzheimer’s disease. Pharmaceuticals (Basel) 14: , 110. |
[10] | Sonni I , Lesman Segev OH , Baker SL , Iaccarino L , Korman D , Rabinovici GD , Jagust WJ , Landau SM , La Joie R , Alzheimer’s Disease Neuroimaging Initiative ((2020) ) Evaluation of a visual interpretation method for tau-PET with (18)F-flortaucipir. Alzheimers Dement (Amst) 12: , e12133. |
[11] | Gogola A , Minhas DS , Villemagne VL , Cohen AD , Mountz JM , Pascoal TA , Laymon CM , Mason NS , Ikonomovic MD , Mathis CA , Snitz BE , Lopez OL , Klunk WE , Lopresti BJ ((2022) ) Direct comparison of the tau PET tracers 18 F-Flortaucipir and 18 F-MK-6240 in human subjects. J Nucl Med 63: , 108–116. |
[12] | Aguero C , Dhaynaut M , Normandin MD , Amaral AC , Guehl NJ , Neelamegam R , Marquie M , Johnson KA , El Fakhri G , Frosch MP , Gomez-Isla T ((2019) ) Autoradiography validation of novel tau PET tracer [F-18]-MK-6240 on human postmortem brain tissue. Acta Neuropathol Commun 7: , 37. |
[13] | Betthauser TJ , Cody KA , Zammit MD , Murali D , Converse AK , Barnhart TE , Stone CK , Rowley HA , Johnson SC , Christian BT ((2019) ) In vivocharacterization and quantification of neurofibrillary tau PET radioligand (18)F-MK-6240 in humans from Alzheimer disease dementia to young controls. J Nucl Med 60: , 93–99. |
[14] | Ellis KA , Bush AI , Darby D , De Fazio D , Foster J , Hudson P , Lautenschlager NT , Lenzo N , Martins RN , Maruff P , Masters C , Milner A , Pike K , Rowe C , Savage G , Szoeke C , Taddei K , Villemagne V , Woodward M , Ames D ((2009) ) The Australian Imaging, Biomarkers and Lifestyle (AIBL) study of aging: Methodology and baseline characteristics of 1112 individuals recruited for a longitudinal study of Alzheimer’s disease. Int Psychogeriatr 21: , 672–687. |
[15] | Fowler C , Rainey-Smith SR , Bird S , Bomke J , Bourgeat P , Brown BM , Burnham SC , Bush AI , Chadunow C , Collins S , Doecke J , Dore V , Ellis KA , Evered L , Fazlollahi A , Fripp J , Gardener SL , Gibson S , Grenfell R , Harrison E , Head R , Jin L , Kamer A , Lamb F , Lautenschlager NT , Laws SM , Li QX , Lim L , Lim YY , Louey A , Macaulay SL , Mackintosh L , Martins RN , Maruff P , Masters CL , McBride S , Milicic L , Peretti M , Pertile K , Porter T , Radler M , Rembach A , Robertson J , Rodrigues M , Rowe CC , Rumble R , Salvado O , Savage G , Silbert B , Soh M , Sohrabi HR , Taddei K , Taddei T , Thai C , Trounson B , Tyrrell R , Vacher M , Varghese S , Villemagne VL , Weinborn M , Woodward M , Xia Y , Ames D , the AIBL investigators ((2021) ) Fifteen years of the Australian Imaging, Biomarkers and Lifestyle (AIBL) Study: Progress and observations from 2,359 older adults spanning the spectrum from cognitive normality to Alzheimer’s disease. J Alzheimers Dis Rep 5: , 443–468. |
[16] | Dore V , Bourgeat P , Burnham SC , Martins RN , Masters CL , Ames D , Rowe CC , Salvado O , Fripp J , Villemagne VL ((2019) ) Automated reporting of tau PET quantification on the brain surface. Alzheimers Dement 15: , P1269–P1269. |
[17] | Bourgeat P , Villemagne VL , Dore V , Brown B , Macaulay SL , Martins R , Masters CL , Ames D , Ellis K , Rowe CC , Salvado O , Fripp J ((2015) ) Comparison of MR-less PiB SUVR quantification methods. Neurobiol Aging 36: (Suppl 1), S159–S166. |
[18] | Bourgeat P , Dore V , Fripp J , Ames D , Masters CL , Salvado O , Villemagne VL , Rowe CC , AIBL research group ((2018) ) Implementing the centiloid transformation for (11)C-PiB and beta-amyloid (18)F-PET tracers using CapAIBL. Neuroimage 183: , 387–393. |
[19] | Amadoru S , Doré V , McLean CA , Hinton F , Shepherd CE , Halliday GM , Leyton CE , Yates PA , Hodges JR , Masters CL , Villemagne VL , Rowe CC ((2020) ) Comparison of amyloid PET measured in Centiloid units withneuropathological findings in Alzheimer’s disease. Alzheimers Res Ther 12: , 22. |
[20] | Burnham SC , Bourgeat P , Doré V , Savage G , Brown B , Laws S , Maruff P , Salvado O , Ames D , Martins RN , Masters CL , Rowe CC , Villemagne VL ((2016) ) Clinical and cognitive trajectories incognitively healthy elderly individuals with suspectednon-Alzheimer’s disease pathophysiology (SNAP) or Alzheimer’sdisease pathology: A longitudinal study. Lancet Neurol 15: , 1044–1053. |
[21] | Villemagne V , Dore V , Bourgeat P ((2017) ) The Tau MeTeR composites for the generation of continuous and categorical measures of tau deposits in the brain. J Mol Med Ther 1: , 25–32. |
[22] | Doré V , Krishnadas N , Bourgeat P , Huang K , Li S , Burnham S , Masters CL , Fripp J , Villemagne VL , Rowe CC ((2021) ) Relationshipbetween amyloid and tau levels and its impact on tau spreading. Eur J Nucl Med Mol Imaging 48: , 2225–2232. |
[23] | Charil A , Shcherbinin S , Southekal S , Devous MD , Mintun M , Murray ME , Miller BB , Schwarz AJ ((2019) ) Tau subtypes of Alzheimer’s disease determined in vivo using Flortaucipir PET imaging. J Alzheimers Dis 71: , 1037–1048. |
[24] | Ossenkoppele R , Lyoo CH , Sudre CH , van Westen D , Cho H , Ryu YH , Choi JY , Smith R , Strandberg O , Palmqvist S , Westman E , Tsai R , Kramer J , Boxer AL , Gorno-Tempini ML , La Joie R , Miller BL , Rabinovici GD , Hansson O ((2020) ) Distinct tau PET patternsin atrophy-defined subtypes of Alzheimer’s disease. Alzheimers Dement 16: , 335–344. |
[25] | Risacher SL , Anderson WH , Charil A , Castelluccio PF , Shcherbinin S , Saykin AJ , Schwarz AJ ((2017) ) Alzheimer disease brain atrophy subtypes are associated with cognition and rate of decline. Neurology 89: , 2176–2186. |
[26] | Koscik RL , Betthauser TJ , Jonaitis EM , Allison SL , Clark LR , Hermann BP , Cody KA , Engle JW , Barnhart TE , Stone CK , Chin NA , Carlsson CM , Asthana S , Christian BT , Johnson SC ((2020) ) Amyloid duration is associated with preclinical cognitive decline and tau PET. Alzheimers Dement (Amst) 12: , e12007. |


