
Influence of Subject-Specific Effects in Longitudinal Modelling of Cognitive Decline in Alzheimer’s Disease
Abstract
Background:
Accurate longitudinal modelling of cognitive decline is a major goal of Alzheimer’s disease and related dementia (ADRD) research. However, the impact of subject-specific effects is not well characterized and may have implications for data generation and prediction.
Objective:
This study seeks to address the impact of subject-specific effects, which are a less well-characterized aspect of ADRD cognitive decline, as measured by the Alzheimer’s Disease Assessment Scale’s Cognitive Subscale (ADAS-Cog).
Methods:
Prediction errors and biases for the ADAS-Cog subscale were evaluated when using only population-level effects, robust imputation of subject-specific effects using model covariances, and directly known individual-level effects fit during modelling as a natural control. Evaluated models included pre-specified parameterizations for clinical trial simulation, analogous mixed-effects regression models parameterized directly, and random forest ensemble models. Assessment used a meta-database of Alzheimer’s disease studies with validation in simulated synthetic cohorts.
Results:
All models observed increases in variance under imputation leading to increased prediction error. Bias decreased with imputation except under the pre-specified parameterization, which increased in the meta-database, but was attenuated under simulation. Known fitted subject effects gave the best prediction results.
Conclusion:
Subject-specific effects were found to have a profound impact on predicting ADAS-Cog. Reductions in bias suggest imputing random effects assists in calculating results on average, as when simulating clinical trials. However, reduction in error emphasizes population-level effects when attempting to predict outcomes for individuals. Forecasting future observations greatly benefits from using known subject-specific effects.
INTRODUCTION
A prominent goal of Alzheimer’s disease and related dementias (ADRD) research is the accurate modelling of cognitive decline. Reliable prediction of cognitive outcomes aids the design of resource-intensive interventional trials [1–4] and assists treatment and diagnosis of ADRD in clinical settings [5–7]. Significant emphasis has been placed on modelling trajectories of decline using neuropsychological assessments like the Montreal Cognitive Assessment Scale [8, 9], Mini-Mental State Examination (MMSE) [10], and the Alzheimer’s Disease Assessment Scale’s Cognitive Subscale (ADAS-Cog) [11, 12]. These tools excel in relating the cognitive performance demonstrated in the tests directly to clinical and functional outcomes in patients [13, 14]. Identifying the demographic characteristics these cognitive assessments most strongly associate with is central to ADRD research as they help inform how these characteristics relate to longitudinal changes in cognition and, in turn, decline in clinical function [15–17]. This has led to development of statistical models of decline which not only identify factors influencing these outcomes, such as genetic carrier status of the Apolipoprotein E4 (APOE4) allele and its relation to cognitive and functional capacity [18, 19], but can also be used for outcome prediction [20].
For clinical ADRD researchers, a natural follow-up question for these models is appropriate utilization, for example, development of population cohorts or prediction of observations for individuals. As such, method evaluations have become crucial, using a combination of long-running natural history datasets and clinical trials from the literature [21–23] alongside data simulation studies to assess model generalizability across more varied scenarios [24–26]. While novel techniques have demonstrated potential with prediction of ADRD outcomes and highlighted the importance of inclusion of specific demographics [27, 28], some aspects of modelling remain under-investigated. For longitudinal prediction in particular, an especially important but often overlooked component is the role of individual participant-level effects and their impact on estimation of cognitive outcome measures [29]. This can be critical as exact subject-level effects are unique to a specific individual within a given model yet still greatly influence outcome estimation [30, 31].
Overall, the decision of how to address subject-specific effects is largely dependent on the goals of a given study. For some analyses, subject-specific effects are not of direct interest, such as examining the association of the APOE4 allele and AD in a population. Meanwhile in other paradigms such as predicting the course of AD in an individual patient, subject-specific effects are a focus and appropriate modelling of them is key. These decisions and their implications come to the forefront when the subject level effects are unknown and not otherwise available. In general, they must be imputed based on model covariances or suppressed entirely and either practice may not be appropriate depending on whether an investigator is estimating predictions for a population or an individual [32, 33]. Furthermore, generative or predictive models are developed with specific goals but when leveraged outside their original purpose may have unforeseen consequences. For example, pre-specified parameterizations, which have the benefit of accessibility and convenience for clinical researchers who do not have datasets of their own, may behave well under certain assumptions but be severely misrepresentative in scenarios for which they were never intended [34–37]. Understanding the influence of subject-specific effects within certain paradigms can assist researchers when making design decisions in their own models, such as whether to impute or suppress these effects, and direct how to best use calculated predictions of cognitive outcomes.
This study seeks to address this less well-characterized aspect of longitudinal analysis in ADRD cognitive decline as measured by the ADAS-Cog subscale. Three separate model architectures are considered, two built directly from data de novo and a third previously developed by the Critical Path for Alzheimer’s Disease (CPath) coalition using readily available pre-specified parameterizations [21]. Predictive capacity of the models are evaluated for error and bias when both estimating entire trajectory profiles and forecasting future observations in the ADAS-Cog. Three different subject-specific effects designs are considered: completely suppressing these effects and relying solely on population-level parameters, robustly imputing probable effects based on model covariances, and directly relying on known subject-specific effects using previously observed data as a natural, positive control with an expectation of superior prediction performance. Comparing the relative changes in error, variance, and bias between these combinations of model designs can give a better understanding how these components influence outcome prediction and help researchers best choose when and how to use these subject-specific effects in their own research in cognitive decline.
METHODS
Evaluation datasets
Evaluation was initially conducted using a meta-database consisting of 18 Alzheimer’s Disease Cooperative Study (ADCS) trials and the Alzheimer’s Disease Neuroimaging Initiative (ADNI) as first presented by Kennedy et al. [38]. Participants in the meta-database represent the full spectrum of Alzheimer’s disease dementia, ranging from cognitively intact to diagnosed AD as determined by the current clinical criteria at the time of each study. Both clinical trials and observational studies were used with data in six-month increments out to 24 months of evaluation. The outcome of interest was the ADAS-Cog, which evaluates memory, reasoning, orientation, praxis, language, and word finding ability and scored from 0 to 70 errors. Evaluation time in months was the primary explanatory covariate with additional demographic covariates included based on their use in the CPath reference model. These additional covariates consisted of age at study baseline, sex, APOE4 carrier status using number of E4 alleles, and baseline MMSE score. Additional covariates were available within the meta-database, such as Clinical Dementia Rating (CDR), and while tabulated for reference, were not actively used during this analysis as they were not part of the CPath model paradigm. Although this precluded use of covariates in the meta-database known to be associated with cognitive decline, such as disease duration and education, covariates were restricted to those used in the CPath reference parameterization to compare models solely on the basis of subject-specific effects.
Model evaluations were validated using simulation of 500 separate synthetic cohorts each with 400 participants. Simulations were generated out to 60 months at six-month intervals with serial correlations established to test generalizability to more variable ADAS-Cog measures compared to the meta-database. The same covariates described in the meta-database were also used in the synthetic cohorts to orient all models relative to the parameterization of the CPath reference design. Further details on dataset development including generation of baseline covariates and simulation of ADAS-Cog values can be found in the supplemental methods.
Model designs
The CPath model for AD progression was developed using literature reported values and cohort studies to model progression of the ADAS-Cog in natural history or randomized clinical trial settings, and create a framework to generate representative simulation cohorts [21], with an implementation in R using the adsim package, version 3.0 [39]. The model uses the parameterizations from a beta regression (BR) mixed-effects framework to accommodate the bounded 0 to 70 scores of the ADAS-Cog by first normalizing the score to a 0–1 range. Initial ADAS-Cog scores are created using baseline MMSE score with longitudinal trajectories according to baseline age, sex, APOE4 allele count, and baseline MMSE. Development used both summary and patient data to create population-level fixed effect parameters and model covariances to simulate individual-level effects with coefficient values provided in the manuscript and software package. Although originally designed for clinical trial cohort simulation, the CPath implementation has seen utilization as a forecasting tool as the model parameters are convenient and readily available to all ADRD clinical researchers to predict ADAS-Cog scores, even in the absence of their own dataset [16, 20, 40]. This makes it a natural reference model for this type of analysis focusing on subject-specific effects.
To complement the pre-specified CPath parameterization, BR mixed-effects models were developed de novo for the datasets. A BR model was chosen to meet statistical assumptions necessary to appropriately model the 0–70 bounded range of the ADAS-Cog, the same rationale used by the CPath model authors. Selection of model covariates for baseline and longitudinal fixed effects and random effects mirrored those of the CPath model but coefficient and covariance values were generated dynamically from each dataset to provide a comparison point to the pre-defined values presented by Rogers et al. [21]. Use of ad hoc models also created both model covariances for random effects imputation as well as exact random effects to create known subject-specific effects for final observation forecasting of ADAS-Cog measures for modeled individuals.
A final de novo model used mixed-effects random forests (MERF) [41] combining the feature selection aspects of random forests with an extension to include mixed-effects models to accommodate repeated measures in panel data and adjust predictions using subject-specific effects. This provided another ad hoc model potentially used by “big data” ADRD research. This analysis used a modification of the LongituRF package, version 0.9, in R adapted for the current battery of random effect designs. Further information about the CPath model can be found in Rogers et al. [21] and development of the MERF design in Capitaine et al. [41].
As mentioned, selection of explanatory model covariates for this study was based on those parameterizations provided by the CPath reference model. This focused model comparisons solely on differences due to subject-specific effects even if the inclusion of other explanatory covariates could have yielded more accurate predictions in the two de novo models. Additional details about the current model implementations are in the supplemental methods.
Influence of subject-specific effects on ADAS-Cog measures
Evaluation was performed on holdout sets sampled from both the meta-database and the simulated data for two types of ADAS-Cog predictions: whole trajectories for subjects across all time points and forecasting of final observations. Validation holdouts began with 20% of all subjects held out for whole trajectories followed by 20% of final observations of the model building datasets to forecast final observations. Holdout sampling was repeated 200 times for the meta-database and performed once for each of the 500 synthetic cohorts. For each model and prediction type, subject-specific effects were either 1) suppressed with only population-level effects used, 2) robustly imputed using 100 samplings from the random effects covariance parameters, or 3) applied directly based on the de novo BR and MERF model fitted values when forecasting final observations as a positive control with the expectation of highest model performance. The impact on model predictive capacity considered two common evaluation metrics. First was root mean square error (hereafter referred to as error), the mean of the squared difference between the predicted and true values. The other metric was absolute value of the measurement bias (henceforth referred to as bias), the absolute value of the mean difference between predicted and true outcomes. Although related, these metrics evaluate different aspects of prediction. Error is a characteristic of a sample assessing overall accuracy and is largely comprised of random variation. Meanwhile bias is an aspect of an estimator, quantifying its deviation from its expected value (e.g., the mean) and is strongly influenced by non-random or systematic effects. Larger values of both metrics are indicative of poorer model prediction. Comparisons evaluated percent differences in metrics, calculated 95% confidence intervals via 1000-fold bootstrapping, and identified models with improved metrics in at least 90% of the meta-database samplings and synthetic cohorts.
RESULTS
Meta-database dataset
Observed ADAS-Cog scores from the meta-database are summarized at each time point in Table 1A, with participant disposition for the additional demographic covariates shown in Table 1B for the entire cohort as well as by CDR status for reference. Evaluation results of errors and bias for the meta-database across the 200 samplings are presented in Figs. 1 (whole subject trajectories) and 2 (final observation forecasting) with average results reported in Table 2 and percent differences in Table 3. Within models, imputation of subject-specific effects led to increases in error compared to designs using only population-level effects with notably larger percent increases for the CPath model compared to the de novo BR and MERF models. Across models when only using population effects, there was no observable difference in error; however, when imputing subject-specific effects, the CPath model observed increases in error compared to the de novo models for both whole trajectories and final observations. Also, under imputation, error for the MERF models was higher compared to the de novo BR model for both prediction types. As anticipated for the control design, using known subject-specific fitted effects when forecasting led to the least prediction error with smaller error for both de novo BR and MERF models compared to their population-level effects only and robust imputation designs.
Table 1
ADAS-Cog scores in the meta-database cohort by time point (A) along with subject characteristics (B) for the whole cohort and according to CDR dementia status for reference. ADAS-Cog scores, baseline age, and MMSE score shown as mean score±standard deviation with sex and APOE4 carrier status shown as count and percent
| A) ADAS-Cog scores by time point | ||||
| Timepoint | Full meta-database cohort | Cognitively normal (CDR = 0) | Mild cognitive impairment (CDR = 0.5) | AD dementia (CDR ≥1.0) |
| Baseline | 12.9±5.74 (N = 2840) | 6.0±2.95 (N = 525) | 11.7±5.42 (N = 1759) | 23.3±8.21 (N = 556) |
| 6 months | 13.5±6.31 (N = 2563) | 5.7±2.90 (N = 496) | 11.5±5.82 (N = 1451) | 24.5±8.88 (N = 616) |
| 12 months | 14.1±6.98 (N = 2333) | 5.5±2.81 (N = 428) | 11.3±6.18 (N = 1273) | 25.6±9.88 (N = 632) |
| 18 months | 17.5±8.14 (N = 1067) | 6.6±3.22 (N = 26) | 11.5±5.61 (N = 656) | 28.4±11.38 (N = 385) |
| 24 months | 11.6±6.45 (N = 1626) | 5.3±2.94 (N = 438) | 10.4±5.51 (N = 889) | 24.6±11.11 (N = 299) |
| B) ADAS-Cog scores by subject demographics | ||||
| Covariate | Full meta-database cohort [N = 2840] | Cognitively normal (CDR = 0) [N = 525] | Mild cognitive impairment (CDR = 0.5) [N = 1759] | AD dementia (CDR ≥ 1.0) [N = 556] |
| Baseline age | 73.5±7.42 | 73.8±5.80 | 72.7±7.58 | 75.7±8.24 |
| Baseline MMSE | 26.0±2.55 | 29.1±1.15 | 26.7±2.54 | 20.9±3.41 |
| Sex (female) | 1333 [46.9%] | 270 [51.4%] | 761 [43.3%] | 302 [54.3%] |
| Heterozygous APOE4 carriers | 1136 [40.0%] | 138 [26.3%] | 736 [41.8%] | 262 [47.1%] |
| Homozygous APOE4 carriers | 329 [11.6%] | 12 [2.3%] | 212 [12.1%] | 105 [18.9%] |
CDR, Clinical Dementia Rating; MMSE, Mini-Mental State Examination.
Fig. 1
Error (A) and bias (B) for each of the models predicting whole subject trajectories for each of the 200 meta-database samplings. Error bars for root mean square error presented as mean and standard deviation while error bars for bias represent median and interquartile range. CPath, Critical Path for Alzheimer’s Disease; BR, beta regression; MERF, mixed-effects random forest; PLE, population-level effects; SSE, subject-specific effects.
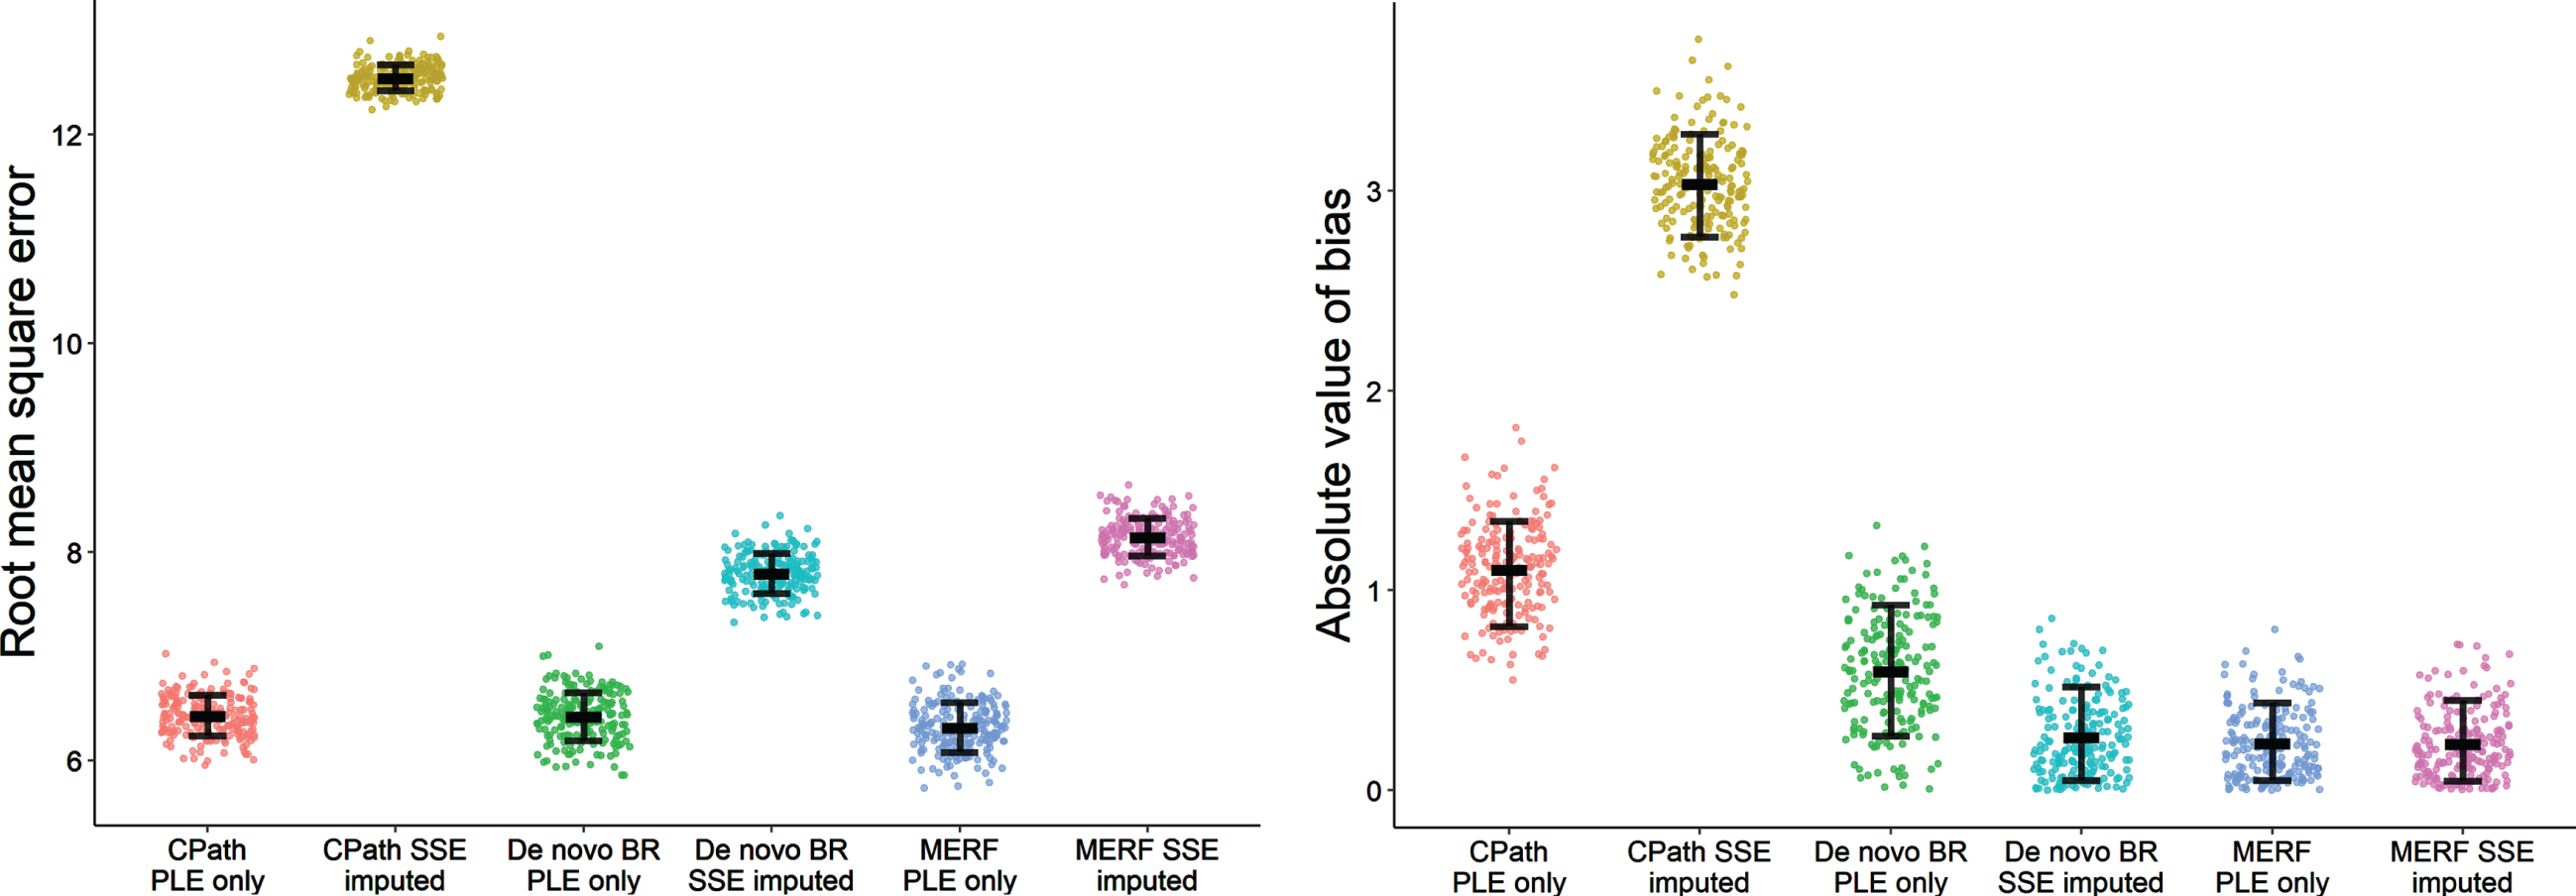
Fig. 2
Error (A) and bias (B) for each of the models forecasting final observations of the holdout sets for each of the 200 meta-database samplings. Error bars for root mean square error presented as mean and standard deviation while error bars for bias represent median and interquartile range. CPath, Critical Path for Alzheimer’s Disease; BR, beta regression; MERF, mixed-effects random forest; PLE, population-level effects; SSE, subject-specific effects.
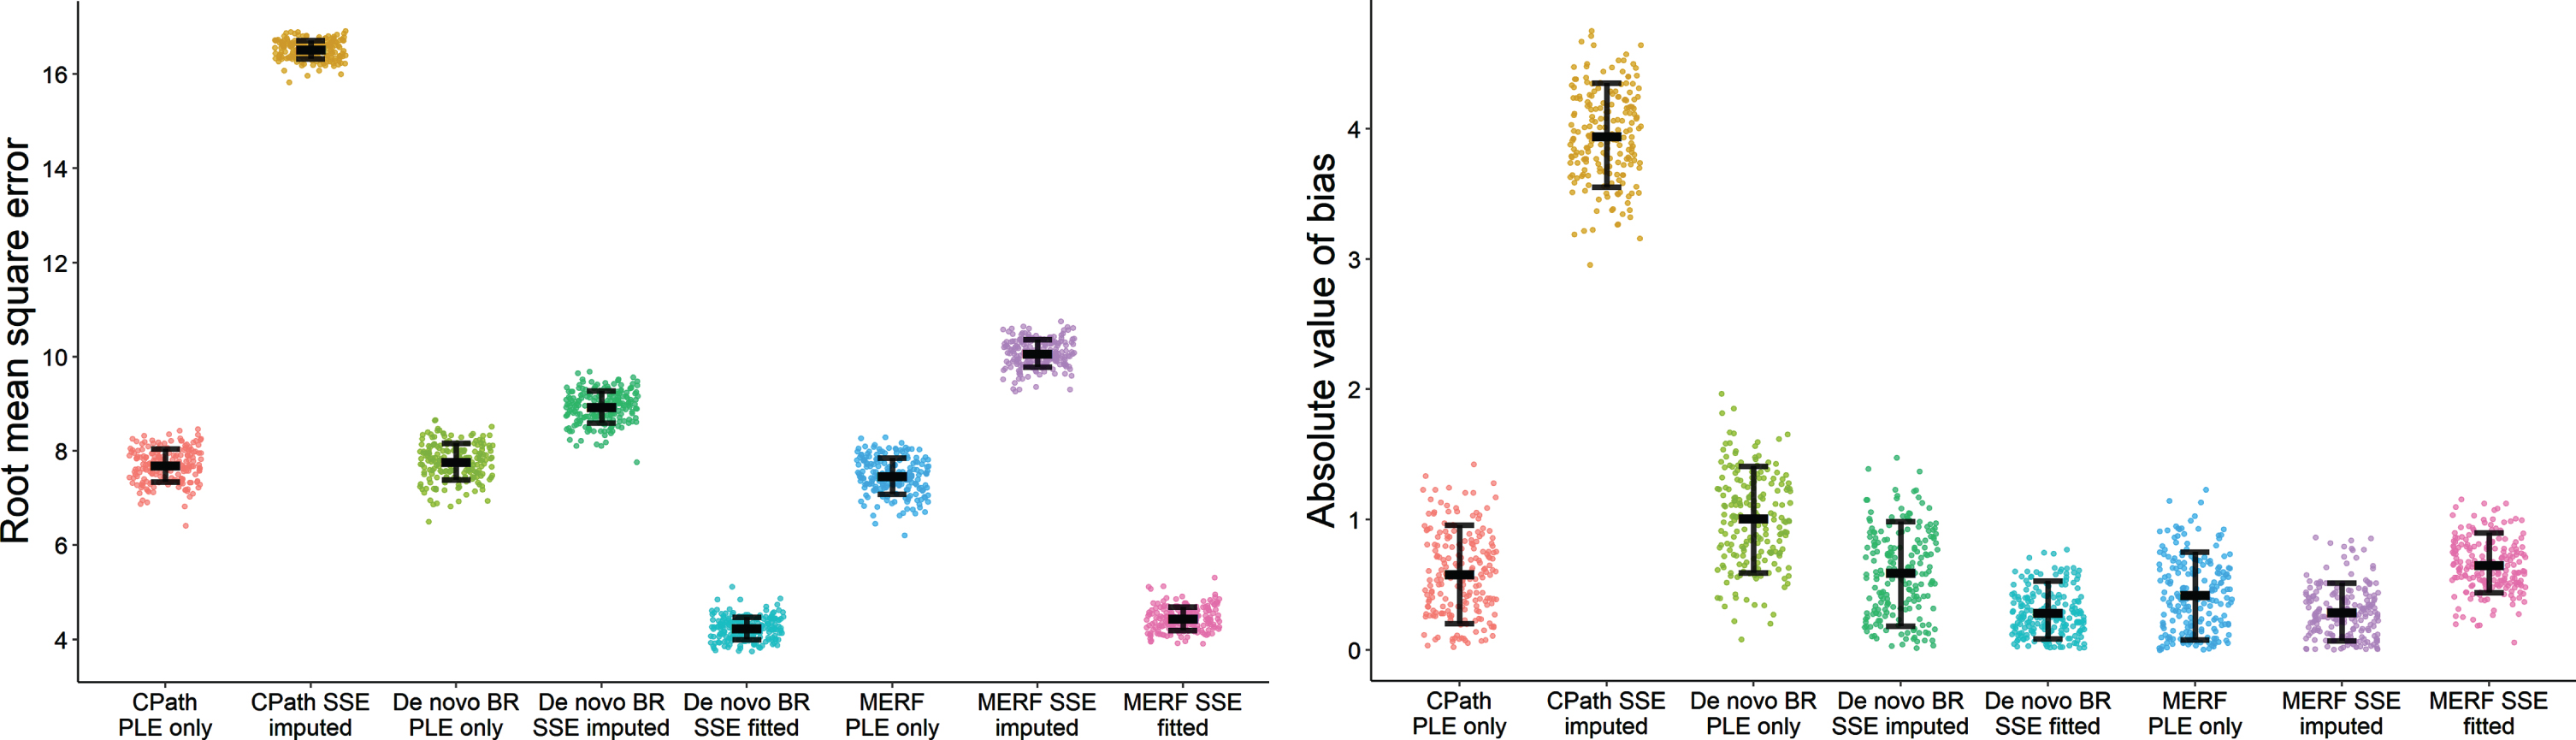
Table 2
Results for the 24-month meta-database for error (A presented as mean±standard deviation) and bias (B presented as median±interquartile range) across the 200 sampling imputations used to build the two de novo models comparing subject-specific effects designs for whole subject trajectories and final observation forecasts
| A) Root mean square error | ||||
| Prediction type | Subject-specific | CPath | De novo | De novo |
| effects design | parameterization | BR model | MERF model | |
| Whole subject trajectories | Population effects only | 6.43±0.196 | 6.42±0.232 | 6.32±0.239 |
| Imputed subject effects | 12.54±0.124 | 7.79±0.191 | 8.14±0.179 | |
| Forecast of final observations | Population effects only | 7.70±0.348 | 7.78±0.385 | 7.47±0.380 |
| Imputed subject effects | 16.52±0.195 | 8.93±0.339 | 10.07±0.291 | |
| Fitted subject effects | – | 4.24±0.238 | 4.44±0.249 | |
| B) Absolute value of bias | ||||
| Prediction type | Subject-specific | CPath | De novo | De novo |
| effects design | parameterization | BR model | MERF model | |
| Whole subject trajectories | Population effects only | 1.12±0.312 | 0.60±0.414 | 0.21±0.259 |
| Imputed subject effects | 3.03±0.308 | 0.22±0.286 | 0.20±0.212 | |
| Forecast of final observations | Population effects only | 0.57±0.482 | 1.02±0.529 | 0.63±0.277 |
| Imputed subject effects | 3.94±0.497 | 0.58±0.525 | 0.39±0.454 | |
| Fitted subject effects | – | 0.25±0.256 | 0.27±0.275 | |
CPath, Critical Path for Alzheimer’s Disease; BR, beta regression; MERF, mixed-effects random forest.
Table 3
Percent differences in mean error and median bias across associated models and subject-specific effect designs for whole subject trajectories (A) and forecasting of final observations (B) for the meta-database. Error results are in the lower half of the table and bias results in the upper half. Negative percentages indicate better predictive performance for the design listed in the row relative to the design in the column. Tests which were not associated either by model type or subject-specific effects design were not evaluated and are indicated with ‘-’. Comparisons where the better predicting model demonstrated improved metrics in at least 90% of the 200 meta-database samplings are bolded
| A) Subject trajectories –meta-database | ||||||||
| Error/Bias | CPath PLE only | CPath SSE imputed | De novo BR PLE only | De novo BR SSE imputed | MERF PLE only | MERF SSE imputed | ||
| CPath PLE only | –171.0% [–201.4% ––155.5% ] | 85.8% [52.2% –141.6%] | – | 434.1% [287.7% –764.7%] | – | |||
| CPath Imputed | 95.0% [92.9% –96.9%] | 1284.6% [825.4% –1929.2%] | – | 1443.7% [1032.4% –2052.6%] | ||||
| De novo BR PLE only | –0.1% [–1.6% –1.3% ] | 174.9% [68.4% –292.9%] | 187.4% [98.0% –370.5%] | – | ||||
| De novo BR SSE imputed | – | –60.9% [–62.3% ––59.6% ] | 21.3% [19.6% –23.1%] | – | 11.5% [–38.1% –84.9% ] | |||
| MERF PLE only | –1.8% [–3.3% ––0.3% ] | – | –1.6% [–3.3% ––0.1% ] | – | 6.6% [–57.9% –65.9% ] | |||
| MERF SSE imputed | – | –54.0% [–55.2% ––52.9% ] | – | 4.5% [3.5% –5.6%] | 28.8% [27.0% –30.6%] | |||
| B) Forecasting final observations – meta-database | ||||||||
| Error | CPath PLE only | CPath SSE imputed | De novo BR PLE only | De novo BR SSE imputed | De novo BR SSE fitted | MERF PLE only | MERF SSE imputed | MERF SSE fitted |
| CPath PLE only | – 593.4% [– 862.4% – – 448.9% ] | – 79.0% [– 151.3% – – 32.7% ] | – | – | – 11.8% [– 59.0% 17.3% ] | – | – | |
| CPath SSE imputed | 114.7% [111.5% – 117.8%] | – | 575.9% [422.7% 849.0%] | – | – | 899.3% [625.7% 1462.8%] | – | |
| De novo BR PLE only | 1.0% [– 1.0% – 3.2% ] | – | 74.5% [25.7% 143.2%] | 305.2% [196.1% 439.9%] | 60.1% [28.2% 92.2%] | – | – | |
| De novo BR SSE imputed | – | – 85.0% [– 87.3% – – 82.8% ] | 14.9% [12.6% 17.2%] | 132.3% [50.3% 238.7%] | – | 47.8% [– 3.5% 152.3% ] | – | |
| De novo BR SSE fitted | – | – | – 83.4% [– 87.5% – 79.3% ] | – 110.7% [– 114.8% – 106.3% ] | – | – | – 8.5% [– 52.8% 35.9% ] | |
| MERF PLE only | – 3.0% [– 5.3% – – 0.8% ] | – | – 4.1% [– 6.4% – 1.9% ] | – | – | 61.1% [15.6% 151.0%] | 133.4% [79.0% 213.8%] | |
| MERF SSE imputed | – | – 64.1% [– 65.8% – – 62.4% ] | – | 12.7% [11.2% 14.4%] | – | 34.8% [32.5% 37.4%] | 44.9% [– 6.3% 124.1% ] | |
| MERF SSE fitted | – | – | – | – | 4.8% [2.2% 7.4%] | – 68.1% [– 72.0% – 64.2% ] | – 126.6% [– 130.7% – 122.4% ] | |
CPath, Critical Path for Alzheimer’s Disease; BR, beta regression; MERF, mixed-effects random forest; PLE, population-level effects; SSE, subject-specific effects.
Patterns for changes in bias for the meta-database were less consistent than those for error. When comparing within models between the population-level effects only and robust imputation designs, the CPath model observed an increase in all samplings in bias under imputation for both whole subject trajectories and final observation forecasting while the de novo BR method had decreases in bias under imputation. For trajectories, there was no difference in bias within the MERF models although there was a decrease in bias in 92% of the meta-database samplings for observational forecasting. When using fitted subject-specific effects for forecasting, the de novo BR model saw decreases in bias compared to its other two designs, meeting the 90% meta-database sampling threshold (98% for imputation and all samplings for population-level effects). This threshold also held for the MERF model comparing fitted effects to population-level effects (91% of samplings) but not when comparing fitted effects to the imputed design (67.5% of samplings). Across models when using only population-level effects, although median bias was largest in the CPath model for whole trajectories and largest in the de novo BR model when forecasting, neither met the 90% consistency threshold compared to bias in the two de novo models. Under imputation, the CPath model had higher bias compared to both de novo models for both prediction types. There was no observed difference in bias between the de novo BR and MERF models under imputation for either prediction type nor was there a difference in bias when using fitted subject-specific effects.
Simulation datasets
Evaluation results for the 500 60-month simulation datasets are shown in Figs. 3 (whole subject trajectories) and 4 (final observation forecasting) with average results reported in Table 4 and percent differences and confidence intervals in Table 5. General patterns in error for the meta-database were largely repeated under simulation although overall error values were larger due to the longer evaluation timeframes. Imputation of subject-specific effects again led to increases in error compared to population-effects only designs for both types of predictions. However, the percent increases in error for the CPath model were notably attenuated at half the magnitude in the synthetic cohorts while the percent increases were mildly larger under simulation for the two de novo methods. When using only population-level effects, there was no difference in error values across the various models with none of the comparisons meeting the 90% threshold. However, under imputation of subject effects, the CPath model did have higher error compared to the de novo BR and MERF models in nearly every synthetic cohort although not to the degree observed in the meta-database. As before, using fitted subject-specific effects led to error values significantly lower for both types of de novo models compared to the other subject-specific effects designs, but no difference was observed in error between the de novo BR and MERF models when using fitted effects.
Fig. 3
Error (A) and bias (B) for each of the models predicting whole subject trajectories for each of the 500 synthetic cohorts. Error bars for root mean square error presented as mean and standard deviation while error bars for bias represent median and interquartile range. CPath, Critical Path for Alzheimer’s Disease; BR, beta regression; MERF, mixed-effects random forest; PLE, population-level effects; SSE, subject-specific effects.
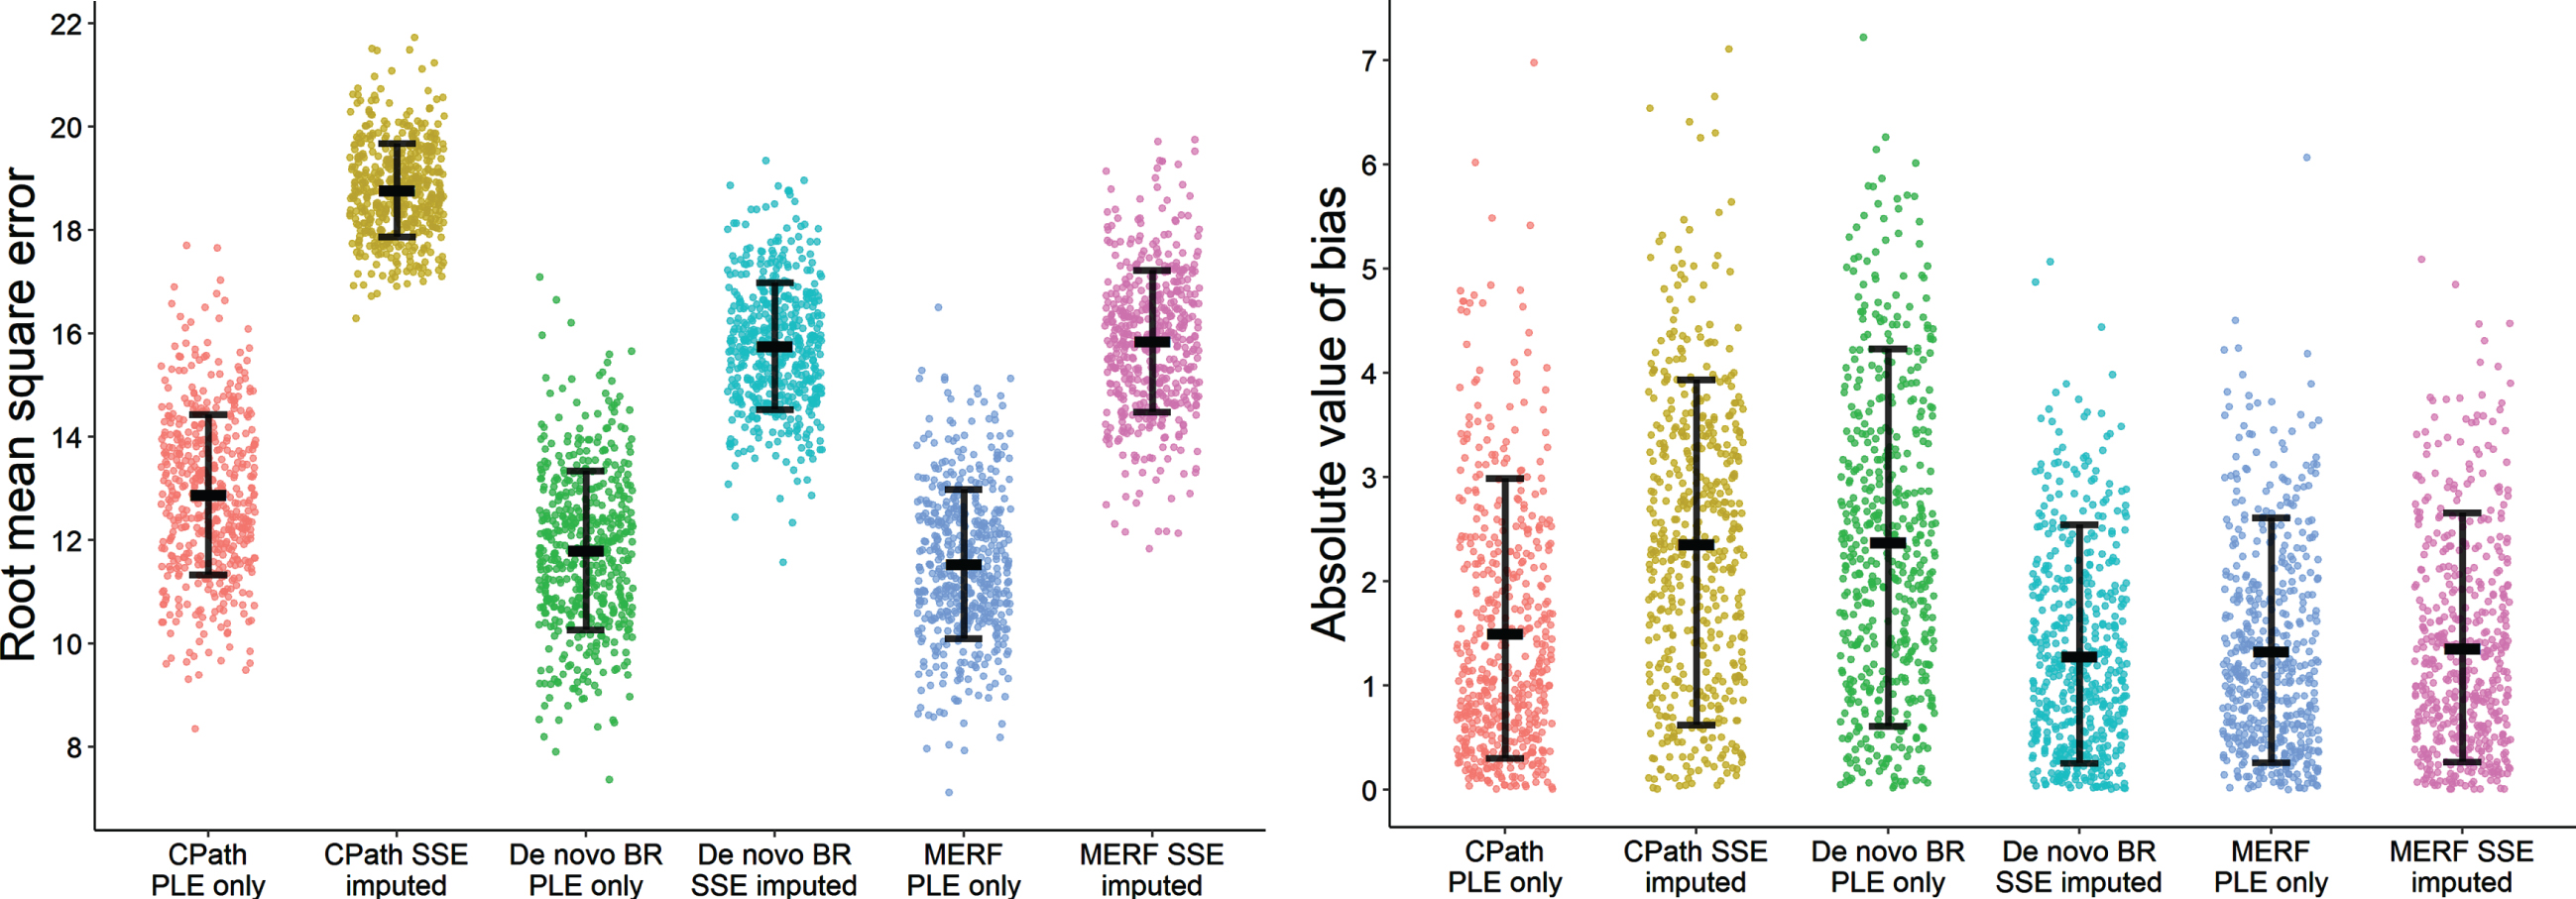
Fig. 4
Error (A) and bias (B) for each of the models forecasting final observations of the holdout sets for each of the 500 synthetic cohorts. Error bars for root mean square error presented as mean and standard deviation while error bars for bias represent median and interquartile range. CPath, Critical Path for Alzheimer’s Disease; BR, beta regression; MERF, mixed-effects random forest; PLE, population-level effects; SSE, subject-specific effects.
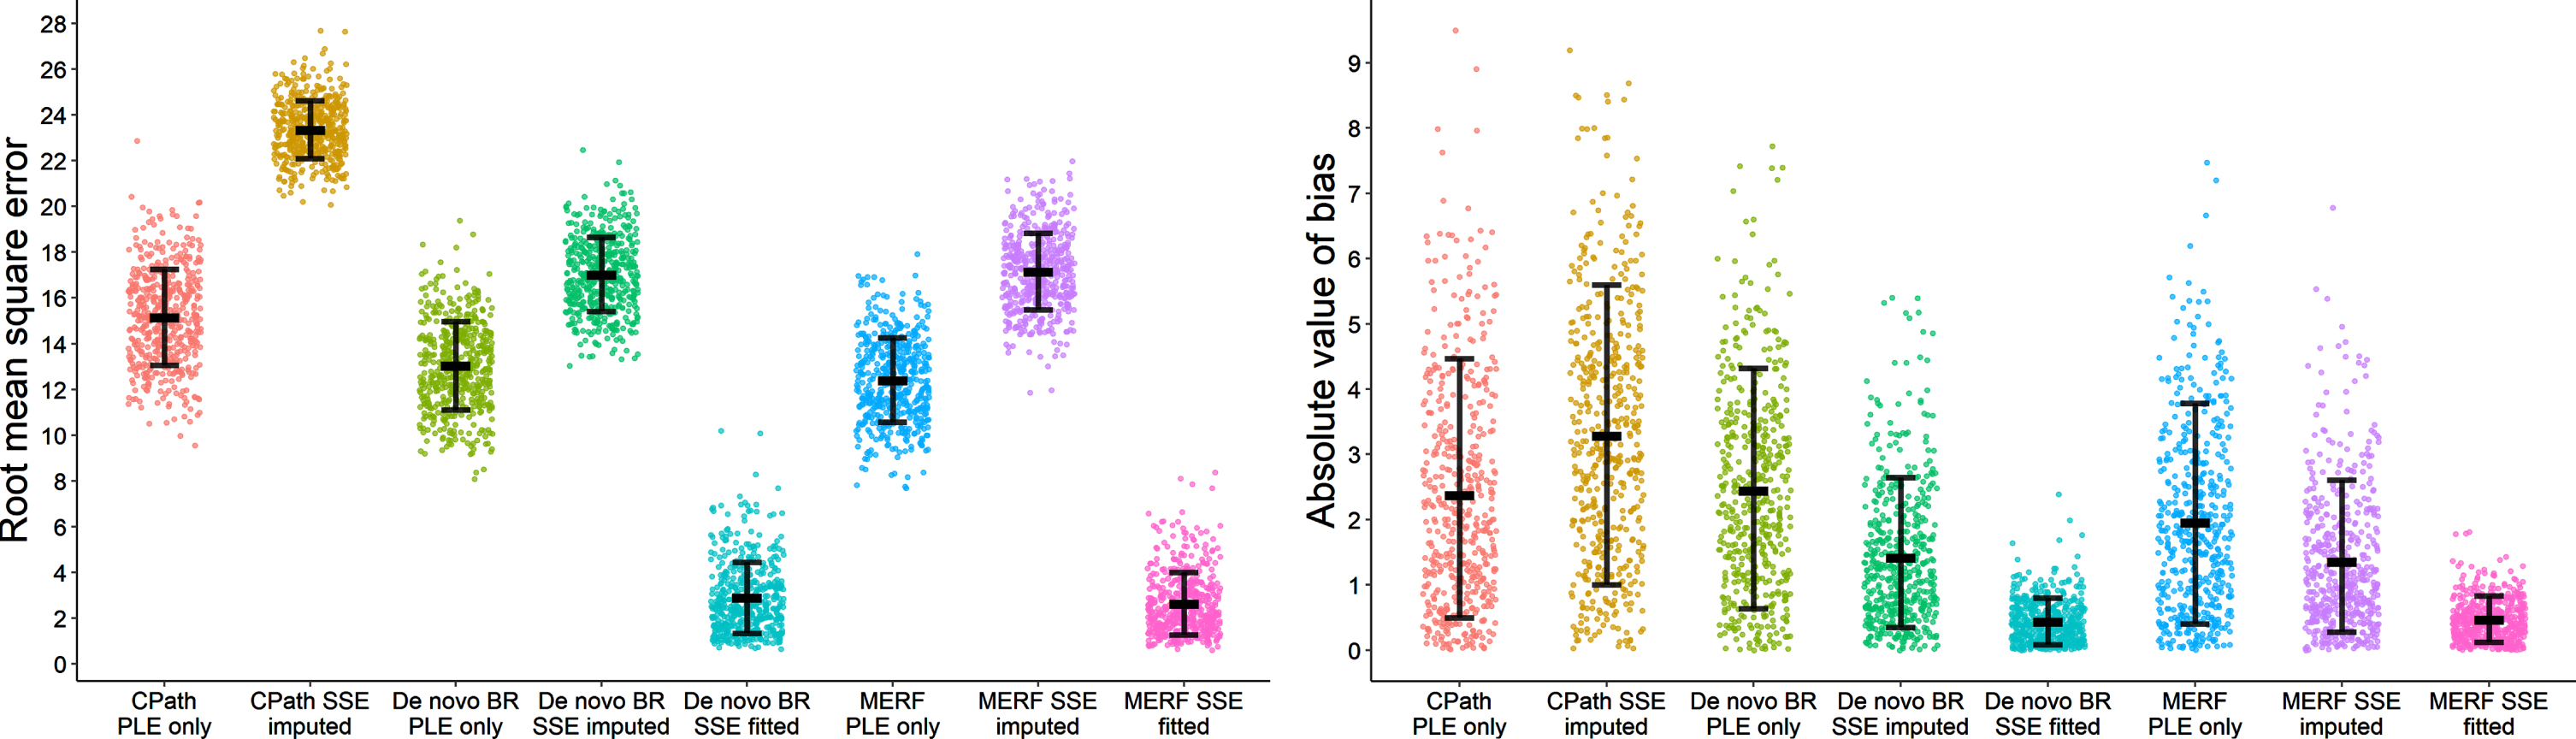
Table 4
Results for the 60-month synthetic cohorts for error (A presented as mean±standard deviation) and bias (B presented as median±interquartile range) across the 500 datasets comparing subject-specific effects designs for whole subject trajectories and final observation forecasts
| A) Root mean square error | ||||
| Prediction type | Subject-specific effects design | CPath parameterization | De novo BR model | De novo MERF model |
| Whole subject trajectories | Population effects only | 12.88±1.552 | 11.80±1.537 | 11.54±1.441 |
| Imputed subject effects | 18.77±0.904 | 15.75±1.230 | 15.85±1.373 | |
| Forecast of final observations | Population effects only | 15.15±2.101 | 13.04±1.926 | 12.41±1.849 |
| Imputed subject effects | 23.35±1.267 | 17.03±1.619 | 17.15±1.685 | |
| Fitted subject effects | – | 2.89±1.548 | 2.65±1.364 | |
| B) Absolute value of bias | ||||
| Prediction type | Subject-specific effects design | CPath parameterization | De novo BR model | De novo MERF model |
| Whole subject trajectories | Population effects only | 1.14±1.677 | 2.24±2.170 | 1.11±1.387 |
| Imputed subject effects | 2.34±2.120 | 1.08±1.421 | 1.12±1.423 | |
| Forecast of final observations | Population effects only | 2.01±2.435 | 2.23±2.241 | 1.77±2.043 |
| Imputed subject effects | 3.11±2.829 | 1.19±1.326 | 1.08±1.353 | |
| Fitted subject effects | – | 0.38±0.470 | 0.44±0.414 | |
CPath, Critical Path for Alzheimer’s Disease; BR, beta regression; MERF, mixed-effects random forest.
Table 5
Percent differences and 95% confidence intervals in mean error and median bias with significance testing comparing across associated models and random effect designs for whole subject trajectories (A) and forecasting of final observations (B) for the for the simulated datasets. Error results are in the lower half of the table and bias results in the upper half. Negative percentages indicate better predictive performance for the design listed in the row relative to the design in the column. Tests which were not associated either by model type or subject-specific effects design were not evaluated and are indicated with ‘-’. Comparisons where the better predicting model demonstrated improved metrics in at least 90% of the 500 synthetic cohorts are bolded
| A) Subject trajectories –simulation | ||||||
| Error/Bias | CPath PLE only | CPath Imputed | De novo BR PLE only | De novo BR Imputed | MERF PLE only | MERF Imputed |
| CPath PLE only | –106.3% [–175.6% –48.2% ] | –97.5% [–161.1% –40.2% ] | – | 1.9% [–33.3% 48.1% ] | – | |
| CPath SSE Imputed | 45.7% [42.2% 49.5%] | – | 116.5% [70.4% 194.1%] | – | 108.3% [58.4% 177.1%] | |
| De novo BR PLE only | –9.1% [–13.2% –5.6% ] | – | 107.3% [57.8% 185.7%] | 101.2% [58.0% 172.1%] | – | |
| De novo BR SSE Imputed | – | –19.1% [–21.4% –16.9% ] | 33.5% [29.5% 37.4%] | – | –3.9% [–47.2% 30.1% ] | |
| MERF PLE only | –11.6% [–15.5% –7.8% ] | – | –2.3% [–5.7% 1.3% ] | – | –0.9% [–43.2% –35.8% ] | |
| MERF SSE Imputed | – | –18.4% [–20.8% –16.1% ] | – | 0.6% [–1.9% 3.0% ] | 37.4% [33.0% 41.9%] | |
| B) Forecasting final observations –simulation | ||||||||
| Error/Bias | CPath PLE only | CPath SSE imputed | De novo BR PLE only | De novo BR SSE imputed | De novo BR SSE fitted | MERF PLE only | MERF SSE imputed | MERF SSE fitted |
| CPath PLE only | –54.7% [–106.2% –17.2% ] | –11.2% [–51.9% 19.7% ] | – | – | 13.6% [–18.8% 55.0% ] | – | – | |
| CPath SSE imputed | 54.1% [50.0% 58.7%] | – | 161.2% [109.5% 247.7%] | – | – | 186.9% [121.5% 281.2%] | – | |
| De novo BR PLE only | –16.2% [–20.5% –11.9% ] | – | 87.8% [43.8% 158.9%] | 480.1% [357.3% 671.1%] | 26.3% [–1.7% 69.6% ] | – | – | |
| De novo BR SSE imputed | – | –37.1% [–40.1% –34.2% ] | 30.6% [26.4% 35.1%] | 208.9% [133.2% 315.5%] | – | 9.8% [–25.3% 47.3% ] | – | |
| De novo BR SSE fitted | – | – | –350.6% [–399.7% –303.9% ] | –488.5% [–561.0% –427.8% ] | – | – | –14.0% [–46.3% 15.8% ] | |
| MERF PLE only | –22.1% [–26.9% –17.3% ] | – | –5.1% [–9.4% –0.6% ] | – | – | 63.3% [21.2% 121.2%] | 303.0% [212.6% 418.8%] | |
| MERF SSE imputed | – | –36.1% [–39.1% –33.2% ] | – | 0.7% [–2.3% 3.4% ] | – | 38.2% [33.6% –42.8%] | 146.8% [88.0% 228.5%] | |
| MERF SSE fitted | – | – | – | – | –9.3% [–27.3% 5.5% ] | –369.0% [–422.1% –325.0% ] | –548.2% [–622.5% –488.7% ] | |
CPath, Critical Path for Alzheimer’s Disease; BR, beta regression; MERF, mixed-effects random forest; PLE, population-level effects; SSE, subject-specific effects.
For bias under simulation, the patterns observed in the meta-database for the de novo BR and MERF models were again observed. For whole trajectories, bias was numerically lower under imputation compared to population-level only designs for the de novo BR model, although this reduction was only observed in 78% of the cohorts, with no statistical difference for the MERF models. When forecasting final observations, imputation did lead to numerically lower bias for both models although neither met the 90% threshold (74.8% of cohorts for de novo BR and 70.2% of cohorts for MERF). Using fitted subject-specific effects led to greatly reduced bias compared to population-level only models for both de novo BR (96.6% of cohorts) and MERF models (92% of cohorts) but did not meet the cohort threshold when comparing subject-specific effects which were imputed to subject-specific effects fit directly (84% for de novo BR and 80.2% for MERF). Most notably for the CPath model, although bias values were still larger when subject-specific effects were imputed compared to using only population-level effects, the increases were several times lower under simulation (1.5–2 times larger) compared to the increases for the meta-database (2–5 times larger), with increased bias only observed in 66% of the whole trajectory cohorts and 62.6% of the forecasting cohorts. In addition, when comparing across models using either population-level effects only or when imputing subject-specific effects, none of the model comparisons reached the 90% threshold which held for both whole trajectories and observational forecasting.
DISCUSSION
This study is the first comprehensive assessment of the impact of subject-specific effects when predicting longitudinal change in cognitive decline as measured by the ADAS-Cog with comparisons considering a widely available and readily accessible pre-parameterized model originally designed for cohort generation, an analogous regression model built directly from a dataset similar to what may be available to clinical researchers, and a more novel ensemble method using mixed-effects random forests also developed ad hoc from a dataset. Imputation of subject-specific effects was associated with increases in error as measured by root mean square error compared to designs where these effects were suppressed while, as an expected high-performance control, using known fitted subject-specific effects led to the smallest prediction error. For models fit directly from the data, bias as measured by absolute value of the bias was numerically largest when only population-level effects were used and decreased when subject-specific effects were imputed and decreased further when previously fitted subject-specific effects were used directly. Notably, under imputation, the percent decreases in bias were not as large as the percent increases in error, an important consideration in bias-variance tradeoff for researchers seeking to jointly minimize both aspects of erroneous prediction instead of one specifically. Critically, for the pre-parameterized CPath model, bias increased under imputation of subject-specific effects. However, although this increase in bias was approximately 2–5 times for a real-world meta-database, it was significantly attenuated when tested under simulation with more generalized datasets, ranging only from 1.5 to 2 times larger, and observed in less than 70% of the collection of synthetic cohorts.
Careful examination of subject-specific effects is underappreciated but especially important when modelling progressive disorders like ADRD. Their studies should preferably be longitudinal wherein the same individuals have multiple repeated measures over time for several months or even years and provide datasets with unique structures. While these data are powerful when predicting ADRD related worsening, care is needed as rudimentary statistical designs are unable to adequately account for within-subject relationships. Ignoring the interrelatedness of repeated measures can lead to errors in inference and, in turn, incorrect conclusions on ADRD progression [42–44]. Internal similarity within subjects is expected under repeated measures and appropriate modelling and utilization of these subject-specific effects is critical whether predicting outcomes for population cohorts or individual subjects [45].
From a clinical perspective, the most important consideration from this analysis is how these observed patterns in error and bias should direct model utilization in ADRD research. Ultimately, this is dependent on the goals of a study since, as demonstrated, different types of predictions and model designs have their own strengths and weaknesses and are best used in their appropriate scenarios. To highlight this, consider two vignettes for an ADRD clinical researcher: generation of a synthetic repeated measures cohort in a feasibility proposal for a longitudinal study, and direct outcome prediction of a future observation for an actual AD patient.
For the synthetic feasibility proposal scenario, generation of predicted outcomes over multiple timepoints for several study participants emphasizes a response across the entire cohort and, under this design, the predicted cognitive outcome of an individual subject is of less importance. This prioritizes a population-level estimate which is as close to the expected value as possible, that is, an estimate which should have especially low bias across the collection of participants, even if the predicted outcome for a specific individual may have higher variance and error. In this situation, imputation of subject-specific effects for each subject in the synthetic cohort is an appropriate course of action as it would be expected to reduce the bias across the cohort as a whole and give a more accurate average estimate for the entire dataset.
As a counterpoint, consider a researcher attempting to predict an outcome for a particular participant for a follow-up visit. Now the emphasis is on the most accurate estimate possible for this single individual, an estimate that has the lowest possible error even if the predicted outcome may be biased relative to the population average. In this paradigm, if the subject-specific effects for this given participant are unknown, imputation would lead to undesirable increases in prediction error. Rather, it is more appropriate to suppress subject-specific effects and rely solely on population-level parameters for prediction. The idea of suppressing subject-specific effects for subject-level predictions at first sounds counterintuitive but can be appreciated in this scenario with the understanding that the exact subject-specific parameters for the individual in question are unknown. By extension, the most ideal scenario would arise if the participant were part of a dataset the researcher had access to, in which case subject-specific effects for this individual could be calculated directly, giving the most accurate cognitive outcome prediction possible.
This dichotomy in clinical utilization of prediction comes into clearer focus when considering the developmental goals of the CPath model. Similar to the first scenario, it was originally developed to generate feasible cohorts to simulate studies in cognitive decline. This is a very different objective from explicitly predicting either trajectories of decline or forecasting of future events at the individual level. Instead, the goal was to develop a methodology which could generate a reasonable mean ADAS-Cog response for a cohort an investigator could anticipate recruiting for feasibility purposes. Here, under this data generation framework, it can be seen how increased variance and reduced bias are in fact desirable. Much like the investigator proposing a study, the priority is for expected ADAS-Cog trajectories which, on average, will tend to be close to the ground truth for a population of interest as possible. Thus, the imputation of subject-specific effects is beneficial, yielding outcomes with greater variability in individuals but reduced overall bias.
In comparison, when attempting to predict outcomes for an individual AD study participant or clinical patient, as in the second scenario, it is far more desirable to have outcomes that are highly accurate with the lowest possible error. In these situations, relying solely on population-level effects leads to predictions with reduced error when compared to imputation of a potential subject-specific effect. Even more preferred is making use of previously observed data in a previously evaluated individual to calculate known and fitted subject-specific effects which will give the most accurate predictions possible. Unfortunately, this is predicated on researchers having access to these datasets to build their own parameterizations which may not always be possible. Regardless, for predictions at the individual level, researchers and clinicians are best served building their own models if possible using previously observed data, or if relying on readily accessible outside parameterizations for convenience, only using demographic and population-level effects.
A key point to mention is when attempting to predict ADAS-Cog scores in the meta-database, a collection of real-world data, the pre-parameterized CPath model showed large increases in both error and bias. On the surface, this would suggest the model as a whole is poorly designed for either generation of synthetic cohorts (its intended purpose) or individual prediction. However, it is important to reiterate its utility in the current study was as a reference parameterization which any ADRD clinical researcher could readily leverage, even without access to an ADRD data cohort of their own, a facet of convenience which should not be understated. Furthermore, when applied to the more generalized synthetic cohorts during simulation, the increases in error and bias were markedly smaller in magnitude and much more in line with the evaluation metrics observed in the two models built directly from the data. This suggests a specific issue of using the pre-specified parameterization with this particular dataset under a prediction framework. Nonetheless, the CPath model can be expected to generalize well to other cohorts like those generated during simulation. This makes its utilization, including the imputation of subject-specific effects as recommended by the authors, more than appropriate for its intended use of generating mean responses in cohorts for clinical trial simulation and calculate expected on-average ADAS-Cog values.
Ultimately, the role of subject-specific effects in modelling cognitive decline is dependent on the investigator’s research question of interest. If the goal is generating data where on average accuracy is desired for a full cohort, the inclusion of imputed subject-specific effects is warranted. However, if the goal is instead to predict the trajectory or endpoint of a specific individual, only population-level fixed effects should be used to get the most accurate prediction possible. The exception to this is when forecasting future observations for an individual whose subject-specific effects are known, having been determined using previously observed data during model building. In these cases, making use of fitted subject-specific effects will always lead to the most unbiased predictions with the smallest errors. Recognizing these scenarios and aligning them with the desired study goals is what will lead to better, more accurate outcomes and higher quality research in cognitive decline.
ACKNOWLEDGMENTS
Research reported in this publication and the described meta-database were supported by the National Institute on Aging of the National Institutes of Health under R01 award number R01AG037561 and P20AG068024.
Authors’ disclosures available online (https://www.j-alz.com/manuscript-disclosures/21-5553r1).
SUPPLEMENTARY MATERIAL
[1] The supplementary material is available in the electronic version of this article: https://dx.doi.org/10.3233/JAD-215553.
REFERENCES
[1] | Darby D , Brodtmann A , Woodward M , Budge M , Maruff P ((2011) ) Using cognitive decline in novel trial designs for primary prevention and early disease-modifying therapy trials of Alzheimer’s disease. Int Psychogeriatr 23: , 1376–1385. |
[2] | Ezzati A , Lipton RB , Alzheimer’s Disease Neuroimaging Initiative ((2020) ) Machine learning predictive models can improve efficacy of clinical trials for Alzheimer’s disease. J Alzheimers Dis 74: , 55–63. |
[3] | Hadjichrysanthou C , Ower AK , de Wolf F , Anderson RM , Alzheimer’s Disease Neuroimaging Initiative ((2018) ) The development of a stochastic mathematical model of Alzheimer’s disease to help improve the design of clinical trials of potential treatments. PLoS One 13: , e0190615. |
[4] | Ito K , Hutmacher MM ((2014) ) Predicting the time to clinically worsening in mild cognitive impairment patients and its utility in clinical trial design by modeling a longitudinal clinical dementia rating sum of boxes from the ADNI database. J Alzheimers Dis 40: , 967–979. |
[5] | Vellas B , Bain LJ , Touchon J , Aisen PS ((2019) ) Advancing Alzheimer’s disease treatment: Lessons from CTAD 2018. J Prev Alzheimers Dis 6: , 198–203. |
[6] | Wattmo C , Wallin AK ((2017) ) Early- versus late-onset Alzheimer’s disease in clinical practice: Cognitive and global outcomes over 3 years. Alzheimers Res Ther 9: , 70. |
[7] | Williams MM , Storandt M , Roe CM , Morris JC ((2013) ) Progression of Alzheimer’s disease as measured by Clinical Dementia Rating Sum of Boxes scores. Alzheimers Dement 9: , S39–44. |
[8] | Iiboshi K , Yoshida K , Yamaoka Y , Eguchi Y , Sato D , Kishimoto M , Funaki K , Mimura M , Kishimoto T ((2020) ) A validation study of the remotely administered Montreal Cognitive Assessment tool in the elderly Japanese population. Telemed J E Health 26: , 920–928. |
[9] | Malek-Ahmadi M , O’Connor K , Schofield S , Coon DW , Zamrini E ((2018) ) Trajectory and variability characterization of the Montreal cognitive assessment in older adults. Aging Clin Exp Res 30: , 993–998. |
[10] | Kennedy RE , Cutter GR , Wang G , Schneider LS ((2015) ) Using baseline cognitive severity for enriching Alzheimer’s disease clinical trials: How does Mini-Mental State Examination predict rate of change? Alzheimers Dement (N Y) 1: , 46–52. |
[11] | Doraiswamy PM , Kaiser L , Bieber F , Garman RL ((2001) ) The Alzheimer’s Disease Assessment Scale: Evaluation of psychometric properties and patterns of cognitive decline in multicenter clinical trials of mild to moderate Alzheimer’s disease. Alzheimer Dis Assoc Disord 15: , 174–183. |
[12] | Sevigny JJ , Peng Y , Liu L , Lines CR ((2010) ) Item analysis of ADAS-Cog: Effect of baseline cognitive impairment in a clinical AD trial. Am J Alzheimers Dis Other Demen 25: , 119–124. |
[13] | Karcher H , Savelieva M , Qi L , Hummel N , Caputo A , Risson V , Capkun G , Alzheimer’s Disease Neuroimaging Initiative ((2020) ) Modelling decline in cognition to decline in function in Alzheimer’s disease. Curr Alzheimer Res 17: , 635–657. |
[14] | Kirk A ((2007) ) Target symptoms and outcome measures: Cognition. Can J Neurol Sci 34: (Suppl 1), S42–46. |
[15] | Conrado DJ , Denney WS , Chen D , Ito K ((2014) ) An updated Alzheimer’s disease progression model: Incorporating non-linearity, beta regression, and a third-level random effect in NONMEM. J Pharmacokinet Pharmacodyn 41: , 581–598. |
[16] | Cook SF , Bies RR ((2016) ) Disease progression modeling: Key concepts and recent developments. Curr Pharmacol Rep 2: , 221–230. |
[17] | Fisher CK , Smith AM , Walsh JR , Coalition Against Major Diseases ((2019) ) Machine learning for comprehensive forecasting of Alzheimer’s disease progression. Sci Rep 9: , 13622. |
[18] | Caselli RJ , Dueck AC , Osborne D , Sabbagh MN , Connor DJ , Ahern GL , Baxter LC , Rapcsak SZ , Shi J , Woodruff BK , Locke DE , Snyder CH , Alexander GE , Rademakers R , Reiman EM ((2009) ) Longitudinal modeling of age-related memory decline and the APOE epsilon4 effect. N Engl J Med 361: , 255–263. |
[19] | Whitehair DC , Sherzai A , Emond J , Raman R , Aisen PS , Petersen RC , Fleisher AS , Alzheimer’s Disease Cooperative Study ((2010) ) Influence of apolipoprotein E varepsilon4 on rates of cognitive and functional decline in mild cognitive impairment. Alzheimers Dement 6: , 412–419. |
[20] | Shahin MH , Bhattacharya S , Silva D , Kim S , Burton J , Podichetty J , Romero K , Conrado DJ ((2020) ) Open data revolution in clinical research: Opportunities and challenges. Clin Transl Sci 13: , 665–674. |
[21] | Rogers JA , Polhamus D , Gillespie WR , Ito K , Romero K , Qiu R , Stephenson D , Gastonguay MR , Corrigan B ((2012) ) Combining patient-level and summary-level data for Alzheimer’s disease modeling and simulation: A beta regression meta-analysis. J Pharmacokinet Pharmacodyn 39: , 479–498. |
[22] | Ito K , Corrigan B , Romero K , Anziano R , Neville J , Stephenson D , Lalonde R ((2013) ) Understanding placebo responses in Alzheimer’s disease clinical trials from the literature meta-data and CAMD database. J Alzheimers Dis 37: , 173–183. |
[23] | Capuano AW , Wilson RS , Leurgans SE , Dawson JD , Bennett DA , Hedeker D ((2018) ) Sigmoidal mixed models for longitudinal data. Stat Methods Med Res 27: , 863–875. |
[24] | Chen YF , Ni X , Fleisher AS , Zhou W , Aisen P , Mohs R ((2018) ) A simulation study comparing slope model with mixed-model repeated measure to assess cognitive data in clinical trials of Alzheimer’s disease. Alzheimers Dement (N Y) 4: , 46–53. |
[25] | Wang G , Berry S , Xiong C , Hassenstab J , Quintana M , McDade EM , Delmar P , Vestrucci M , Sethuraman G , Bateman RJ , Dominantly Inherited Alzheimer Network Trials Unit ((2018) ) A novel cognitive disease progression model for clinical trials in autosomal-dominant Alzheimer’s disease. Stat Med 37: , 3047–3055. |
[26] | Di J , Wang D , Brashear HR , Dragalin V , Krams M ((2016) ) Continuous event monitoring via a Bayesian predictive approach. Pharm Stat 15: , 109–122. |
[27] | Kim SE , Lee B , Jang H , Chin J , Khoo CS , Choe YS , Kim JS , Kang SH , Kim HR , Hwangbo S , Jeong JH , Yoon SJ , Park KW , Kim EJ , Yoon B , Jang JW , Hong JY , Na DL , Seo SW , Choi SH , Kim HJ ((2021) ) Cognitive trajectories of patients with focal β-amyloid deposition. Alzheimers Res Ther 13: , 48. |
[28] | O’Shea DM , Thomas KR , Asken B , Lee AKW , Davis JD , Malloy PF , Salloway SP , Correia S , Alzheimer’s Disease Neuroimaging Initiative ((2021) ) Adding cognition to AT(N) models improves prediction of cognitive and functional decline. Alzheimers Dement (Amst) 13: , e12174. |
[29] | Li Q , Guo Y , He Z , Zhang H , George TJ Jr., Bian J ((2020) ) Using real-world data to rationalize clinical trials eligibility criteria design: A case study of Alzheimer’s disease trials. AMIA Annu Symp Proc 2020: , 717–726. |
[30] | Donohue MC , Aisen PS ((2012) ) Mixed model of repeated measures versus slope models in Alzheimer’s disease clinical trials. J Nutr Health Aging 16: , 360–364. |
[31] | Doody RS , Massman P , Dunn JK ((2001) ) A method for estimating progression rates in Alzheimer disease. Arch Neurol 58: , 449–454. |
[32] | Giil LM , Aarsland D , Vik-Mo AO ((2021) ) Differentiating traits and states identifies the importance of chronic neuropsychiatric symptoms for cognitive prognosis in mild dementia. Alzheimers Dement (Amst) 13: , e12152. |
[33] | Guo J , Shang Y , Fratiglioni L , Johnell K , Welmer AK , Marseglia A , Xu W ((2021) ) Individual changes in anthropometric measures after age 60 years: A 15-year longitudinal population-based study. Age Ageing 50: , 1666–1674. |
[34] | Breitve MH , Chwiszczuk LJ , Bronnick K , Hynninen MJ , Auestad BH , Aarsland D , Rongve A ((2018) ) A longitudinal study of neurocognition in dementia with lewy bodies compared to Alzheimer’s disease. Front Neurol 9: , 124. |
[35] | Giil LM , Aarsland D ((2020) ) Greater variability in cognitive decline in lewy body dementia compared to Alzheimer’s disease. J Alzheimers Dis 73: , 1321–1330. |
[36] | Uspenskaya-Cadoz O , Alamuri C , Wang L , Yang M , Khinda S , Nigmatullina Y , Cao T , Kayal N , O’Keefe M , Rubel C ((2019) ) Machine learning algorithm helps identify non-diagnosed prodromal Alzheimer’s disease patients in the general population. J Prev Alzheimers Dis 6: , 185–191. |
[37] | Milliken JK , Edland SD ((2000) ) Mixed effect models of longitudinal Alzheimer’s disease data: A cautionary note. Stat Med 19: , 1617–1629. |
[38] | Kennedy RE , Cutter GR , Schneider LS ((2014) ) Effect of APOE genotype status on targeted clinical trials outcomes and efficiency in dementia and mild cognitive impairment resulting from Alzheimer’s disease. Alzheimers Dement 10: , 349–359. |
[39] | Polhamus D (2013) adsim: Simulate Alzheimer’s Disease clinical trials. R package version 3.0. |
[40] | Samtani MN , Raghavan N , Novak G , Nandy P , Narayan VA ((2014) ) Disease progression model for Clinical Dementia Rating-Sum of Boxes in mild cognitive impairment and Alzheimer’s subjects from the Alzheimer’s Disease Neuroimaging Initiative. Neuropsychiatr Dis Treat 10: , 929–952. |
[41] | Capitaine L , Genuer R , Thiebaut R ((2021) ) Random forests for high-dimensional longitudinal data. Stat Methods Med Res 30: , 166–184. |
[42] | Bernal-Rusiel JL , Greve DN , Reuter M , Fischl B , Sabuncu MR , Alzheimer’s Disease Neuroimaging Initiative ((2013) ) Statistical analysis of longitudinal neuroimage data with Linear Mixed Effects models. Neuroimage 66: , 249–260. |
[43] | Burton P , Gurrin L , Sly P ((1998) ) Extending the simple linear regression model to account for correlated responses: An introduction to generalized estimating equations and multi-level mixed modelling. Stat Med 17: , 1261–1291. |
[44] | Fitzmaurice G , Laird N , Ware J ((2011) ) Applied Longitudinal Analysis, 2nd Edition, John Wiley & Sons, Hoboken, NJ. |
[45] | Higgins JP , Whitehead A , Turner RM , Omar RZ , Thompson SG ((2001) ) Meta-analysis of continuous outcome data from individual patients. Stat Med 20: , 2219–2241. |


