
Serum Amyloidogenic Nanoplaques and Cytokines in Alzheimer’s Disease: Pilot Study in a Small Naturalistic Memory Clinic Cohort
Abstract
Background:
Neuroinflammation is a central component of Alzheimer’s disease (AD) and correlates closely with amyloid pathology. Markers of inflammation such as cytokines, and amyloidogenic aggregates, so-called nanoplaques, are both promising biomarker candidates for AD. We have previously shown that there is a relationship between the levels of nanoplaques and cytokines in cerebrospinal fluid, but it is unknown whether this association extends to serum.
Objective:
Investigate in a naturalistic memory clinic cohort whether the associations between nanoplaques and cytokines in the cerebrospinal fluid extends to serum.
Methods:
We collected serum from 49 patients assessed for cognitive complaints at the Oslo University Hospital Memory Clinic (15 with clinical AD). We assessed the levels of serum nanoplaques with the novel Thioflavin-T fluorescence correlation spectroscopy (ThT-FCS) assay. Serum levels of nine cytokines (eotaxin-1, granulocyte colony-stimulating factor [G-CSF], interleukin [IL]-6, IL-7, IL-8, monocyte chemoattractant protein-1 (MCP-1), gamma induced protein 10 (IP-10), macrophage inflammatory protein [MIP]-1α, and MIP-1β) were quantified with a multiplex assay and read on a Luminex IS 200 instrument.
Results:
Serum nanoplaques were not increased in clinical AD patients compared to non-AD memory clinic patients and nanoplaques were not associated with any cytokines. The cytokines IL-8 and G-CSF were increased in patients with clinical AD compared to non-AD patients.
Conclusion:
In this small pilot study, serum nanoplaques were not associated with serum cytokines. Nanoplaque levels could not be used to separate clinical AD patients from non-AD patients in this unselected memory clinic cohort.
INTRODUCTION
Alzheimer’s disease (AD) is neuropathologically characterized by extracellular amyloid-β (Aβ) plaques and intracellular tau neurofibrillary tangles [1]. These hallmarks of AD are accompanied by widespread neuroinflammation, as immune cells of the central nervous system, such as astrocytes and microglia, cluster around Aβ aggregates in the AD brain, and release small signaling proteins with pro- and anti-inflammatory effects called cytokines [2]. Notably, it has been proposed that neuroinflammation contributes as much to AD pathogenesis as amyloid and tau aggregation [3]. Therefore, markers of inflammation such as cytokines have gained strong interest as biomarkers for AD [4]. Altered cytokine levels in both cerebrospinal fluid (CSF) and serum have been shown in patients with mild cognitive impairment (MCI) and AD dementia [5]. Aβ pathology and cytokines may interact in a positive feedback loop in AD, with Aβ aggregates inducing the release of cytokines from microglia, and cytokines in turn promoting increased production of Aβ thus facilitating its aggregation and subsequent formation of plaques [6]. However, some cytokines may also have a neuroprotective role [7].
Cytokine-driven neuroinflammation in AD may in part depend on the distribution of Aβ aggregates, whose toxicity depend on their size and molecular structure. Aβ aggregates range from small oligomers such as dimers or trimers, to larger protofibrils and fibrils in plaques [8]; it is especially the larger Thioflavin T (ThT)-binding Aβ aggregates that have been shown to increase neuroinflammation and cytokine release [9, 10]. Such larger aggregates are not easily quantified with established enzyme-linked immunosorbent assays. However, we have previously shown that ThT-labelled amyloidogenic aggregates composed of > 40 monomers with a cross-β sheet structure, hereby called nanoplaques, can be quantified in serum [11] and CSF [12] by a ThT fluorescence correlation spectroscopy (ThT-FCS) assay. Moreover, nanoplaques in CSF are increased in AD [13] and associated with several cytokines [14].
While biomarkers in CSF and neuroimaging biomarkers closely reflect AD pathology, there is much interest in developing blood-based biomarker alternatives for AD [15]. In the context of inflammation, serum analysis is especially relevant as the peripheral and central immune systems interact and affect each other [16]. Indeed, conditions involving chronic systematic inflammation, such as rheumatoid arthritis, are associated with increased levels of pro-inflammatory cytokines and increased AD risk [17]. Several studies have shown altered levels of circulating cytokines in individuals with AD compared to healthy controls [5] and patients with MCI [18]. Similarly, patients with AD have increased levels of serum nanoplaques compared to healthy controls [11]. However, it is not known whether the association between nanoplaques and cytokines that has been observed in the CSF [14], extends to serum.
In the current pilot study, we aimed to extend our analysis of nanoplaques and cytokines from CSF to serum. This was achieved by analyzing amyloidogenic nanoplaques and nine cytokines in serum collected from a naturalistic memory clinic cohort. We included an AD group comprised of patients with clinical AD dementia or MCI-AD, and a non-AD group comprised of patients with subjective cognitive decline (SCD) and MCI or dementia due to other causes than AD.
MATERIALS AND METHODS
Memory clinic cohort
Forty-nine patients from the Norwegian Registry of Persons Assessed for Cognitive Symptoms (NorCog) were included in this study. The patients were assessed at the Oslo University Hospital Memory Clinic between October 2019 and January 2020. All patients and their family caregivers gave informed written consent for participation. This study was conducted in accordance with the 1975 Declaration of Helsinki and approved by the Norwegian Regional Committees for Medical and Health Research Ethics (REC South East, 2017/2235 and 2017/371) and the Data Protector Officer at Oslo University Hospital.
Clinical assessment
In line with a standardized research protocol [19], all patients were assessed with a battery of cognitive tests, including the Mini-Mental State Examination (MMSE), and underwent a physical examination, including blood sampling and, for a sub-set, lumbar puncture (n = 26). The core CSF biomarkers for AD, Aβ42, phosphorylated-tau (p-tau), and total tau (t-tau), were analyzed for patients with lumbar puncture. Biomarker analyses were performed at the Department of Interdisciplinary Laboratory Medicine and Medical Biochemistry at Akershus University Hospital with enzyme-linked immunosorbent assays using the Innotest kit (Innogenetics, Ghent, Belgium). The laboratory adjusted the cut-off for normal Aβ42 values during the inclusion period. For Aβ42, the cut-off for a normal test was CSF Aβ42 > 700 pg/mL for five patients and CSF Aβ42 > 900 pg/mL for 21 patients. The biomarker status for AD and non-AD patients is summarized in Supplementary Table 1. Functional and cognitive impairment on the Clinical Dementia Rating (CDR) scale were scored post-hoc by the author ABK. The CDR sum-of-boxes (CDR-SOB) was used in the analyses.
Clinical diagnoses were made post-hoc by the author ABK, an experienced memory clinic physician. SCD was diagnosed using the Subjective Cognitive Decline Initiative-criteria [20], whereas MCI and dementia were diagnosed using the core clinical criteria from the National Institute of Aging and the Alzheimer’s Association (NIA-AA) [21, 22]. Clinical diagnoses of MCI-AD, AD-dementia, and AD-dementia with etiologically mixed presentation, collectively clinical AD, were made using the NIA-AA diagnostic criteria [21, 22]. These diagnoses were primarily based on clinical presentation, but in the cases with atypical course or etiologically mixed presentations (i.e., presence of concomitant cerebrovascular disease or evidence of a comorbidity that could substantially affect cognition), biomarker data were consulted and patients with negative biomarker data were considered non-AD. All patients who did not meet the criteria for MCI-AD, AD-dementia, or mixed AD-dementia were included in the non-AD group. This group was highly heterogeneous and included patients with SCD as well as patients with MCI or dementia due to non-AD causes such as depression, vascular impairment [23], frontotemporal dementia [24], dementia with Lewy bodies, traumatic brain injury, and normal pressure hydrocephalus.
Analysis of serum nanoplaque levels
The ThT-FCS assay procedure has been described in detail by Tiiman et al. [11] and in the Supplementary Material: “Background on Time-Resolved Thioflavin T (ThT) Fluorescence Intensity Fluctuation Measurements and Analysis” (Supplementary Figures 1–4). In brief, 200μL of blood serum was mixed with 1.6μL of 2.5 mM ThT. Fluorescence intensity fluctuations were recorded for 3000 s (30 series of 10 consecutive measurements, each measurement lasting 10 s) using an individually modified ConfoCor3 system (Carl Zeiss, Jena, Germany) [25]. Experiments were run in duplicates. Automated analysis of fluorescence intensity fluctuations was performed offline using MATLAB (The MathWorks, Inc., Natick, MA) to detect bursts in fluorescence intensity that reflect the passage of ThT-bound nanoplaques through the observation volume element [11]. When the increase in fluorescence intensity was at least five times larger than the standard deviation of the entire time series, the burst was denoted a “single event”. The frequency of single events occurrence (fSEO / h-1) reflects the concentration of nanoplaques in the serum – the larger the fSEO, the higher the nanoplaque concentration [11].
Analysis of serum cytokine levels
Serum cytokine levels were analyzed with a custom-made nine-plex kit (Cat No. 12014058, Bio-Rad Laboratories, Hercules, CA) containing eotaxin-1, granulocyte colony-stimulating factor (G-CSF), interleukin-6 (IL-6), IL-7, IL-8, interferon gamma-induced protein 10 (IP-10), monocyte chemoattractant protein 1 (MCP-1), macrophage inflammatory protein-1α (MIP-1α), and MIP-1β. The nine cytokines were selected based on a screening of a representative set of samples with the human cytokine 27 plex kit (Cat No. M500KCAF0Y, Bio-Rad Laboratories). A 10 % bovine serum albumin (Cat No. A5403-50 G, lot SLBL9495 V, Sigma Aldrich, St. Louis, MO) solution in PBS (pH 7.4, Gibco Cat No. 10010-015, lot 2062123, Thermo Fisher Scientific, Waltham, MA) was added to all serum samples to a final concentration of 0.5% and vortexed. Then, samples were centrifuged for 10 min at 10,000×g at 4°C and 50μL of the supernatant was loaded onto the assay plate. Cytokine levels were measured on a Luminex IS 200 instrument (Bio-Rad). An in-house control was used to observe both intra and inter percentage coefficients of variation. Cytokine concentrations outside the reference limits that were extrapolated by the analysis software were also included in the statistical analysis.
Statistical analysis
For the majority of the variables, distributions were markedly skewed, and thus results are presented as medians and interquartile ranges. Due to the change of cut-off levels in the inclusion period, the CSF Aβ42 variable was dichotomized as amyloid-positive/amyloid-negative. One sample had extreme fSEO values and abnormally high autofluorescence (i.e., fluorescence before ThT was added) and was excluded from statistical analysis. Group differences were assessed with Mann-Whitney U or Kruskal-Wallis tests for continuous variables and χ2 tests for categorical variables. Correlations are reported with Spearman’s ρ correlation coefficient. Statistical analyses were done in STATA 15.1 (StataCorp, College Station, TX) and visualizations were made using R 3.4.4 (R Foundation for Statistical Computing, Vienna, Austria).
RESULTS
Table 1 displays the demographic and clinical information for the clinical AD (n = 15) and the non-AD (n = 33) patients. Core AD biomarkers were only available for a subset of patients. One AD patient was classified as amyloid negative, this patient was right at the cut-off with a CSF Aβ42 level of 700 pg/mL. One non-AD patient with vascular impairment was classified as amyloid positive, but this patient did not meet the clinical criteria for AD.
Table 1
Demographic and clinical characteristics
| All (n = 48) | Non-AD (n = 33) | AD (n = 15) | p | |
| Women, n (%) | 22 (44.9) | 16 (48.0) | 6 (40.0) | 0.58† |
| Age | 66 (56; 73) | 66 (55; 73) | 65 (57; 72) | 0.89 |
| Years of education | 15 (12; 17) | 15 (12; 17) | 15 (11; 18) | 0.91 |
| MMSE* | 27 (23; 29) | 29 (24; 29) | 24 (20; 28) | 0.02 |
| CDR-SOB* | 3.5 (1.5; 5) | 2.25 (0.75; 4.75) | 4.5 (3.0; 5.0) | 0.05 |
| Stage, n (%) | 0.008† | |||
| SCD | 7 (14.6) | 7 (21.0) | 0 (0.0) | |
| MCI | 15 (31.2) | 13 (39.0) | 2 (13.0) | |
| Dementia | 26 (54.2) | 13 (39.0) | 13 (87.0) | |
| CSF Aβ42* below/above cut-off | 13/13 | 1/12 | 12/1 | <0.001† |
| CSF t-tau (pg/mL)* | 360 (250; 520) | 270 (240; 330) | 520 (450; 850) | <0.001 |
| CSF p-tau (pg/mL)* | 58.5 (45; 76) | 46 (43; 56) | 74 (61; 106) | 0.001 |
| Serum CRP (mg/L) | 0.7 (0.6; 2.3) | 0.8 (0.6; 3.3) | 0.6 (0.6; 1.2) | 0.21 |
| Serum nanoplaques (fSEO) | 6.9 (4.1; 12.4) | 6.0 (4.2; 12.6) | 7.8 (3.6; 12.2) | 0.93 |
Data is given as median (quartile 1; quartile 3) and p values are for Mann-Whitney U tests comparing AD and non-AD patients, unless otherwise indicated. Significant differences are highlighted in bold.fSEO is given per hour (h-1). Aβ, amyloid-β, CDR-SOB, Clinical Dementia Rating Scale Sum of Boxes; CRP, C-reactive protein; CSF, cerebrospinal fluid; fSEO, frequency of single event occurrence; MMSE, Mini-Mental State Examination; n, number of patients; P-tau, phosphorylated tau; T-tau, total tau *MMSE n = 29 for non-AD, CDR-SOB n = 28 for non-AD, CSF Aβ42, p-tau and t-tau n = 26 (13 AD, 13 non-AD). † χ2-test.
The AD and non-AD patients were well matched in terms of distributions of sex, age and years of education, but differed significantly in terms of cognitive impairment; the AD group had more dementia patients and lower median MMSE scores. Serum C-reactive protein (CRP) levels were within normal ranges for both groups (<10 mg/L) and there was no indication of acute infection. Serum CRP was not associated with serum nanoplaque levels, ρ= –0.03, nor with CSF tau and neurodegeneration biomarkers for AD, t-tau (n = 25), ρ= –0.09 and p-tau (n = 25), ρ= –0.03. Also, median CRP levels did not significantly differ between amyloid positive or amyloid negative patients (n = 25), 0.7 versus 1.05, p = 0.66. Finally, serum CRP was only associated with increased levels of IP-10, ρ= 0.31. Serum CRP was therefore not further analyzed.
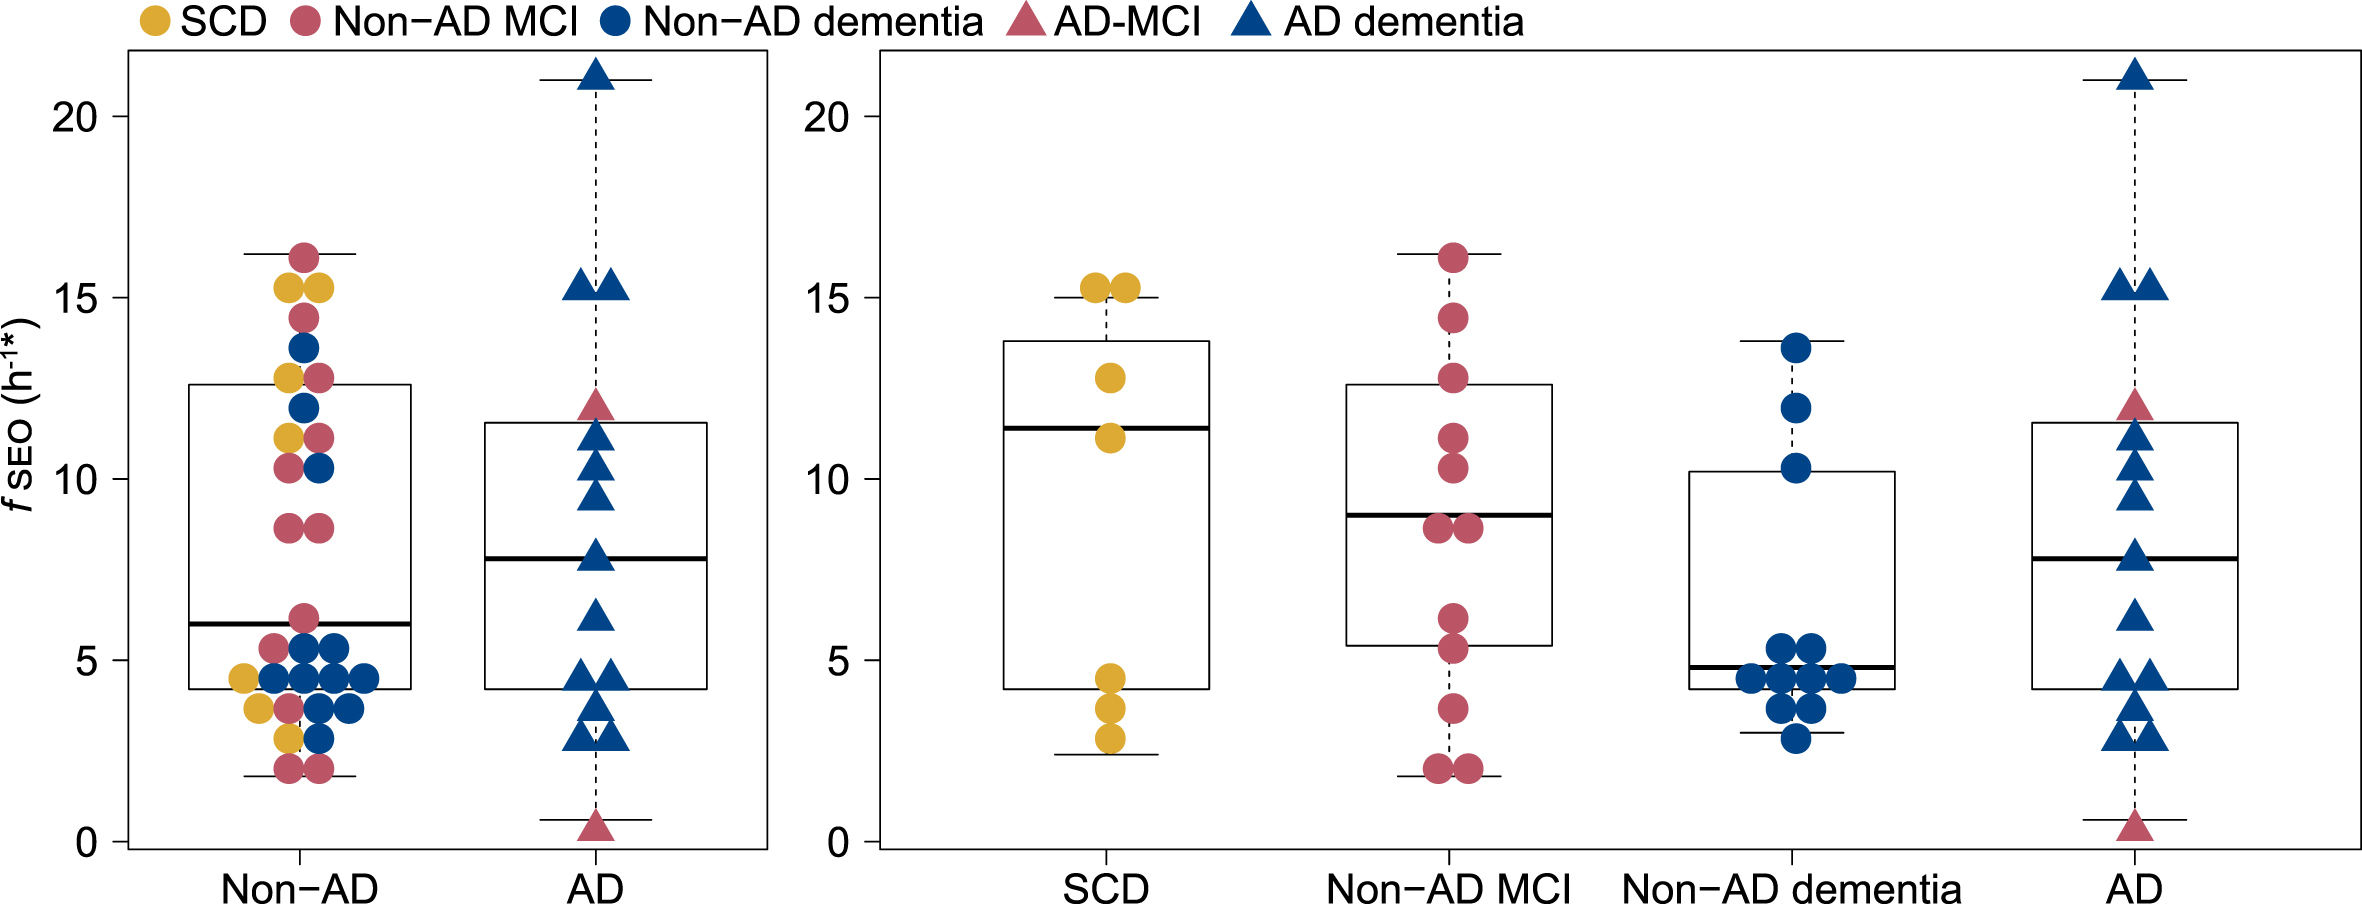
Serum nanoplaque levels did not differ significantly between the two patient groups, with a median fSEO of 6.0 h-1 in the non-AD group and 7.8 h-1 in the AD group, p = 0.93. Within the non-AD group, the median fSEO was 11.4 h-1 (quartile 1 = 3.6, quartile 3 = 15.0) in the SCD group, 9 h-1 (quartile 1 = 5.4, quartile 3 = 12.6) in the non-AD MCI group and 4.8 h-1 (quartile 1 = 4.2, quartile 3 = 10.2) in the non-AD dementia group, but there were no significant differences when comparing serum nanoplaque levels across AD, SCD, non-AD MCI, and non-AD dementia. The distribution of fSEO across the patient groups is presented in Fig. 1. Serum nanoplaques were not associated with CSF Aβ42, p-tau or t-tau in this small cohort.
Fig. 1
Distribution of serum nanoplaque levels (fSEO) in non-AD and AD patients and across SCD, Non-AD MCI, Non-AD dementia and AD (MCI and dementia) patients. *Two outliers with fSEO = 70.2 h-1 (non-AD MCI) and fSEO = 31.2 h-1 (non-AD dementia) are not shown. AD, Alzheimer’s disease; fSEO, frequency of single event occurrence; MCI, mild cognitive impairment; SCD, subjective cognitive decline.
Detectability of inflammatory markers
Inflammatory markers were assessed in 48 patients. The levels of IL-8, Eotaxin-1, IL-6, IP-10, and MCP-1 were above the detection limit in all samples. For G-CSF, MIP-1α, MIP-1β, and IL-7, the levels were below the lower limit of quantification in a minority of samples and included as zero: G-CSF (n = 2), MIP-1α (n = 1), MIP-1β (n = 7), and IL-7 (n = 9).
Serum inflammatory markers in AD and non-AD patients
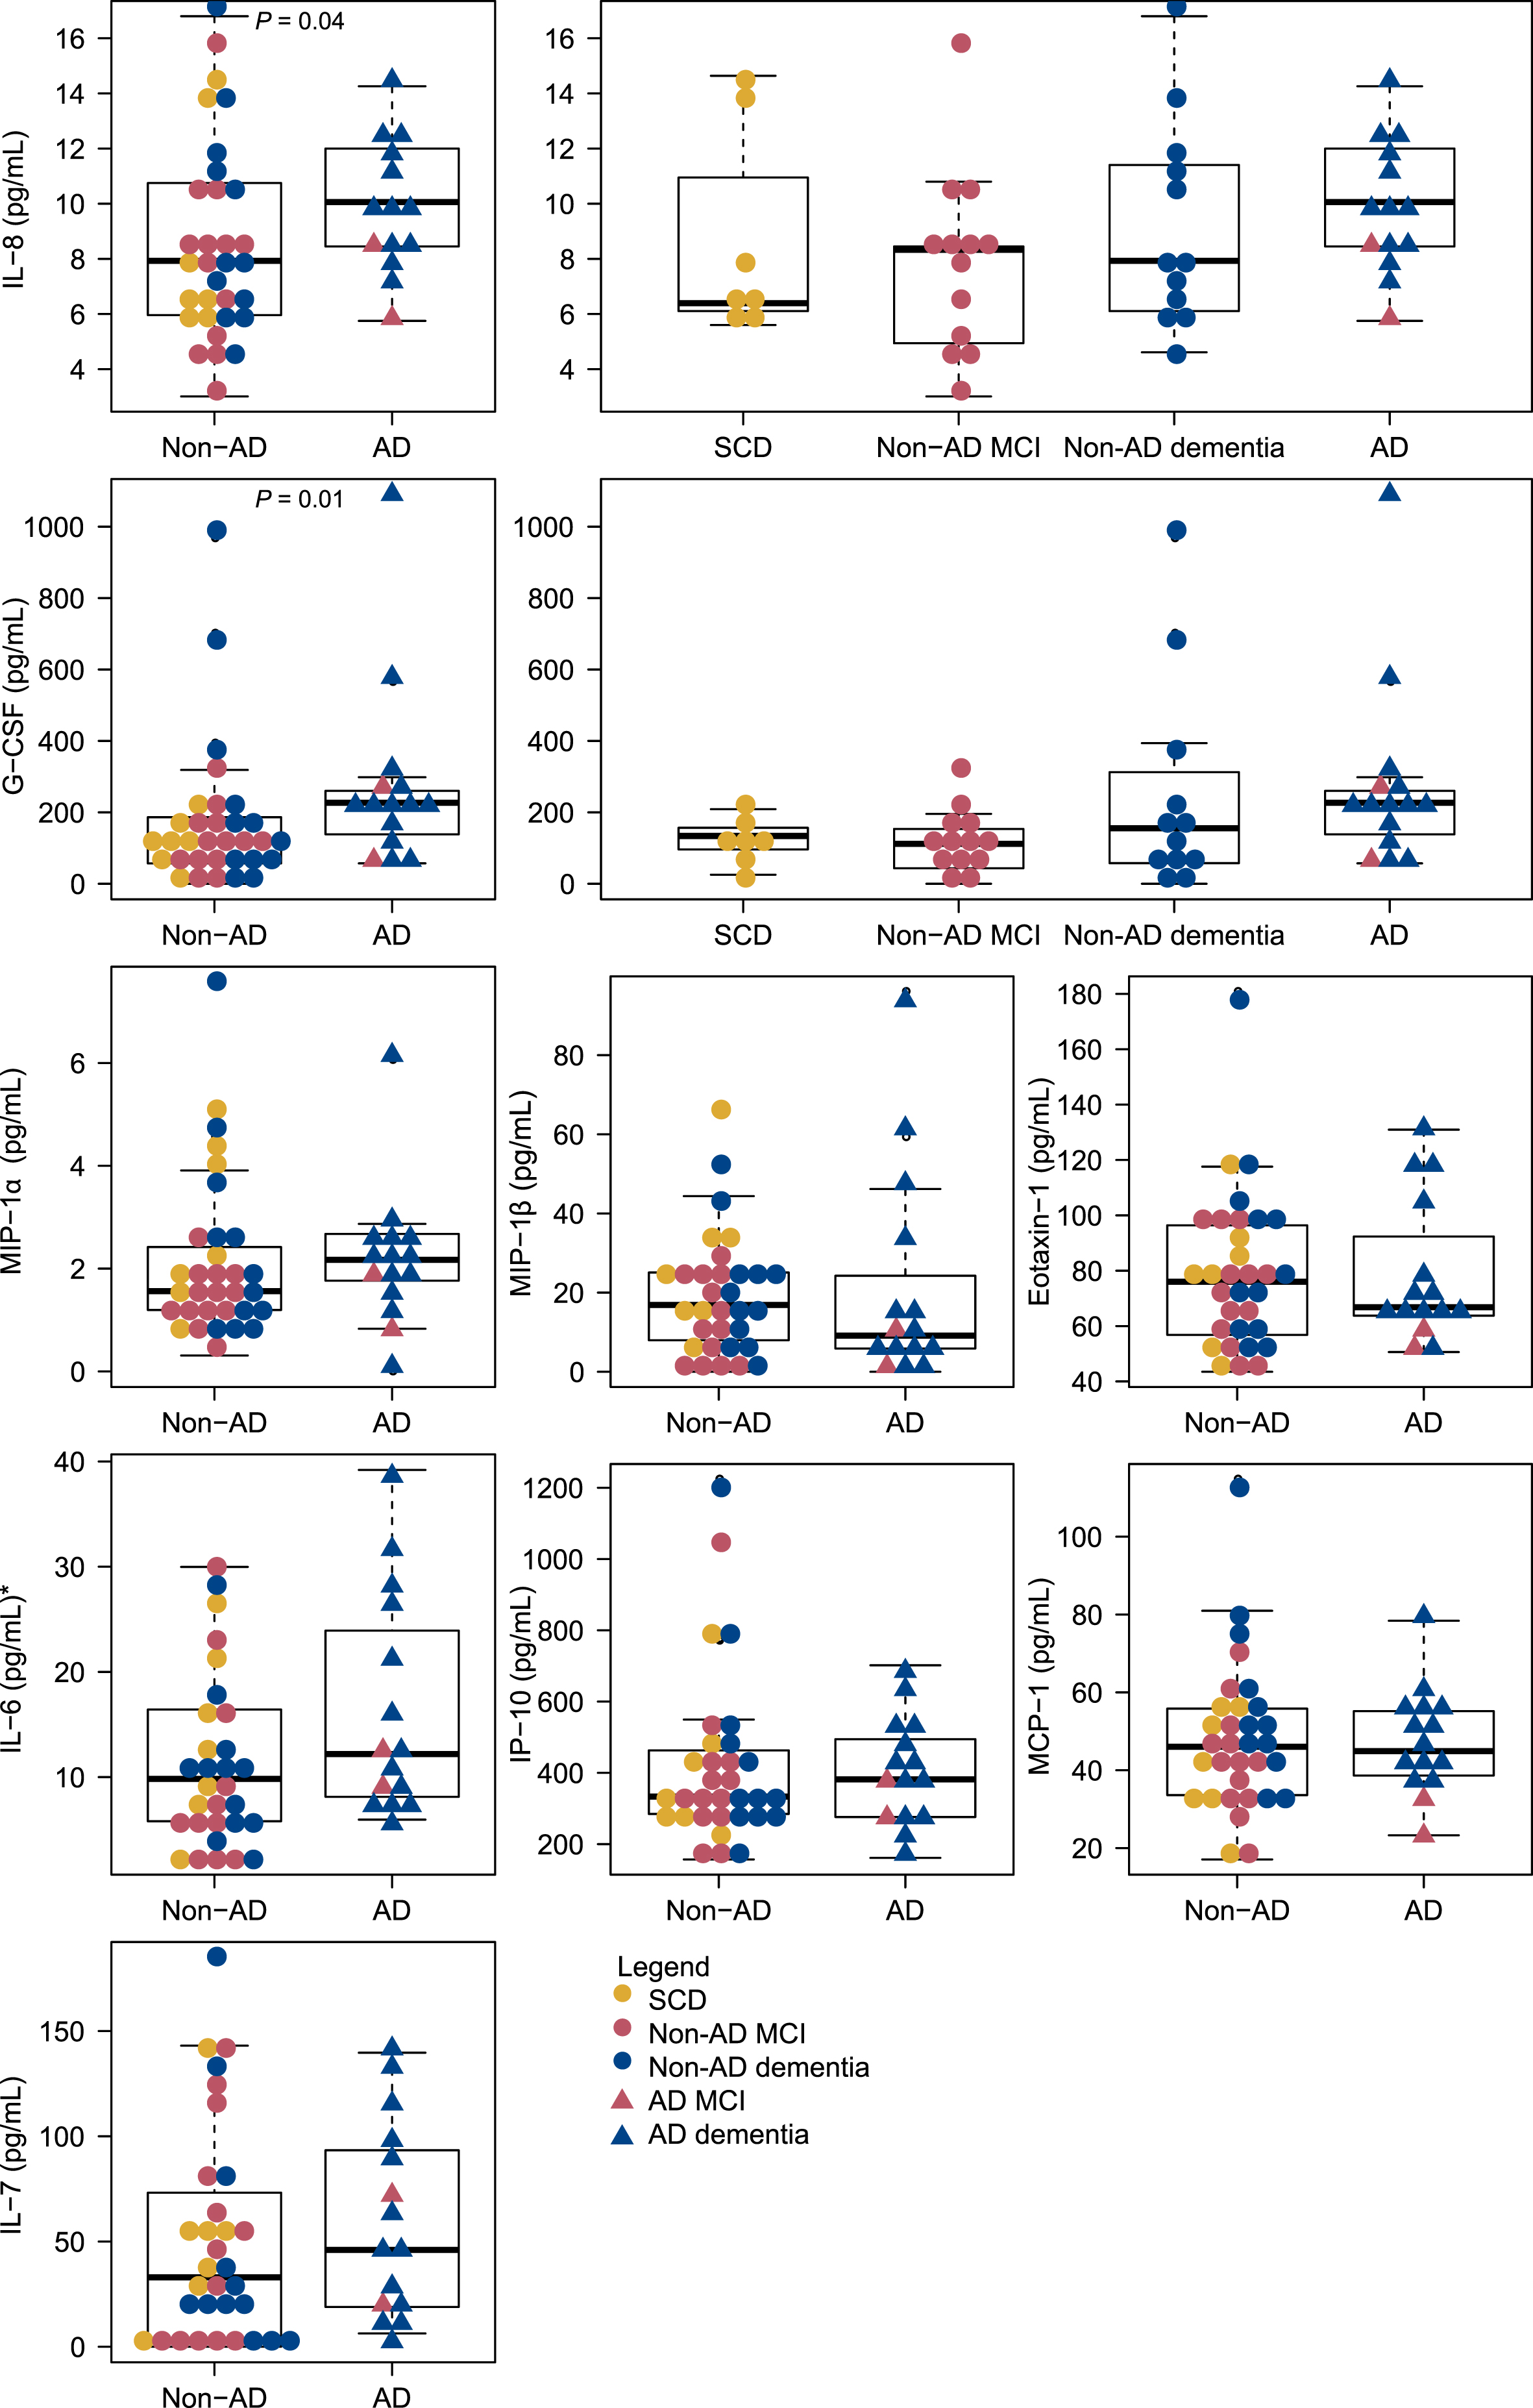
The serum levels of the inflammatory markers are presented in Table 2. Median serum levels of IL-8 were significantly increased in patients with clinical AD (median = 10.11 pg/mL) compared to non-AD patients (median = 7.93 pg/mL), p = 0.01. Also, median serum levels of G-CSF were significantly increased in patients with clinical AD (median = 227.4 pg/mL) compared to non-AD patients (median = 116.4 pg/mL), p < 0.01. The distribution of the cytokines across non-AD and AD patients is presented in Fig. 2. For IL-8 and G-CSF the distribution across SCD, non-AD MCI, non-AD dementia and AD is also shown; additional data for the remaining cytokines is presented in Supplementary Figure 5.
Table 2
Serum cytokine levels (pg/mL) for AD and non-AD patients
| All (n = 47) | Non-AD (n = 32) | AD (n = 15) | p | |
| IL-8 | 8.34 (6.32; 11.27) | 7.93 (5.96; 10.75) | 10.06 (8.34; 12.27) | 0.04 |
| MIP-1α | 1.75 (1.20; 2.65) | 1.56 (1.2; 2.42) | 2.17 (1.68; 2.70) | 0.23 |
| MIP-1β | 15.64 (6.91; 25.3) | 16.90 (7.98; 25.09) | 0.12 (5.30; 32.89) | 0.42 |
| Eotaxin-1 | 74.27 (57.96; 97.38) | 76.04 (56.83; 96.40) | 66.83 (63.60; 107.68) | 0.99 |
| G-CSF | 139.43 (67.47; 228.06) | 116.35 (57.03; 186.45) | 226.67 (119.58; 263.95) | 0.01 |
| IL-6 | 10.58 (6.19; 21.65) | 9.83 (5.81; 16.43) | 12.20 (7.68; 26.03) | 0.22 |
| IP-10 | 360.39 (271.44; 475.26) | 333.54 (284.65; 463.02) | 381.45 (267.16; 525.45) | 0.73 |
| MCP-1 | 45.56 (36.83; 56.28) | 46.05 (33.6; 55.83) | 44.92 (37.21; 56.28) | 0.81 |
| IL-7 | 40.78 (14.15; 82.08) | 32.97 (0; 73.20) | 46.02 (17.74; 100.20) | 0.30 |
Data are given as median (quartile 1; quartile 3) and p values for Mann-Whitney U tests between non-AD and AD-groups, unless otherwise indicated. Significant differences are highlighted in bold. G-CSF, granulocyte colony-stimulating factor; IL, interleukin; IP, interferon gamma-induced protein; MCP, monocyte chemoattractant protein; MIP, macrophage inflammatory protein.
Fig. 2
Distribution of serum cytokine levels across AD and non-AD patients. Distributions across SCD, Non-AD MCI, Non-AD dementia and AD (MCI and dementia) are shown for IL-8 and G-CSF. *Two outliers with IL-6 = 100.2 pg/mL and IL-6 = 45.2 pg/mL, both non-AD MCI, are not shown. AD, Alzheimer’s disease; fSEO, frequency of single event occurrence; G-CSF, granulocyte colony-stimulating factor; IL, interleukin; IP, interferon gamma-induced protein; MCI, mild cognitive impairment; MCP, monocyte chemoattractant protein; MIP, macrophage inflammatory protein; SCD, subjective cognitive decline.
The relationship between inflammatory markers and nanoplaque levels in serum
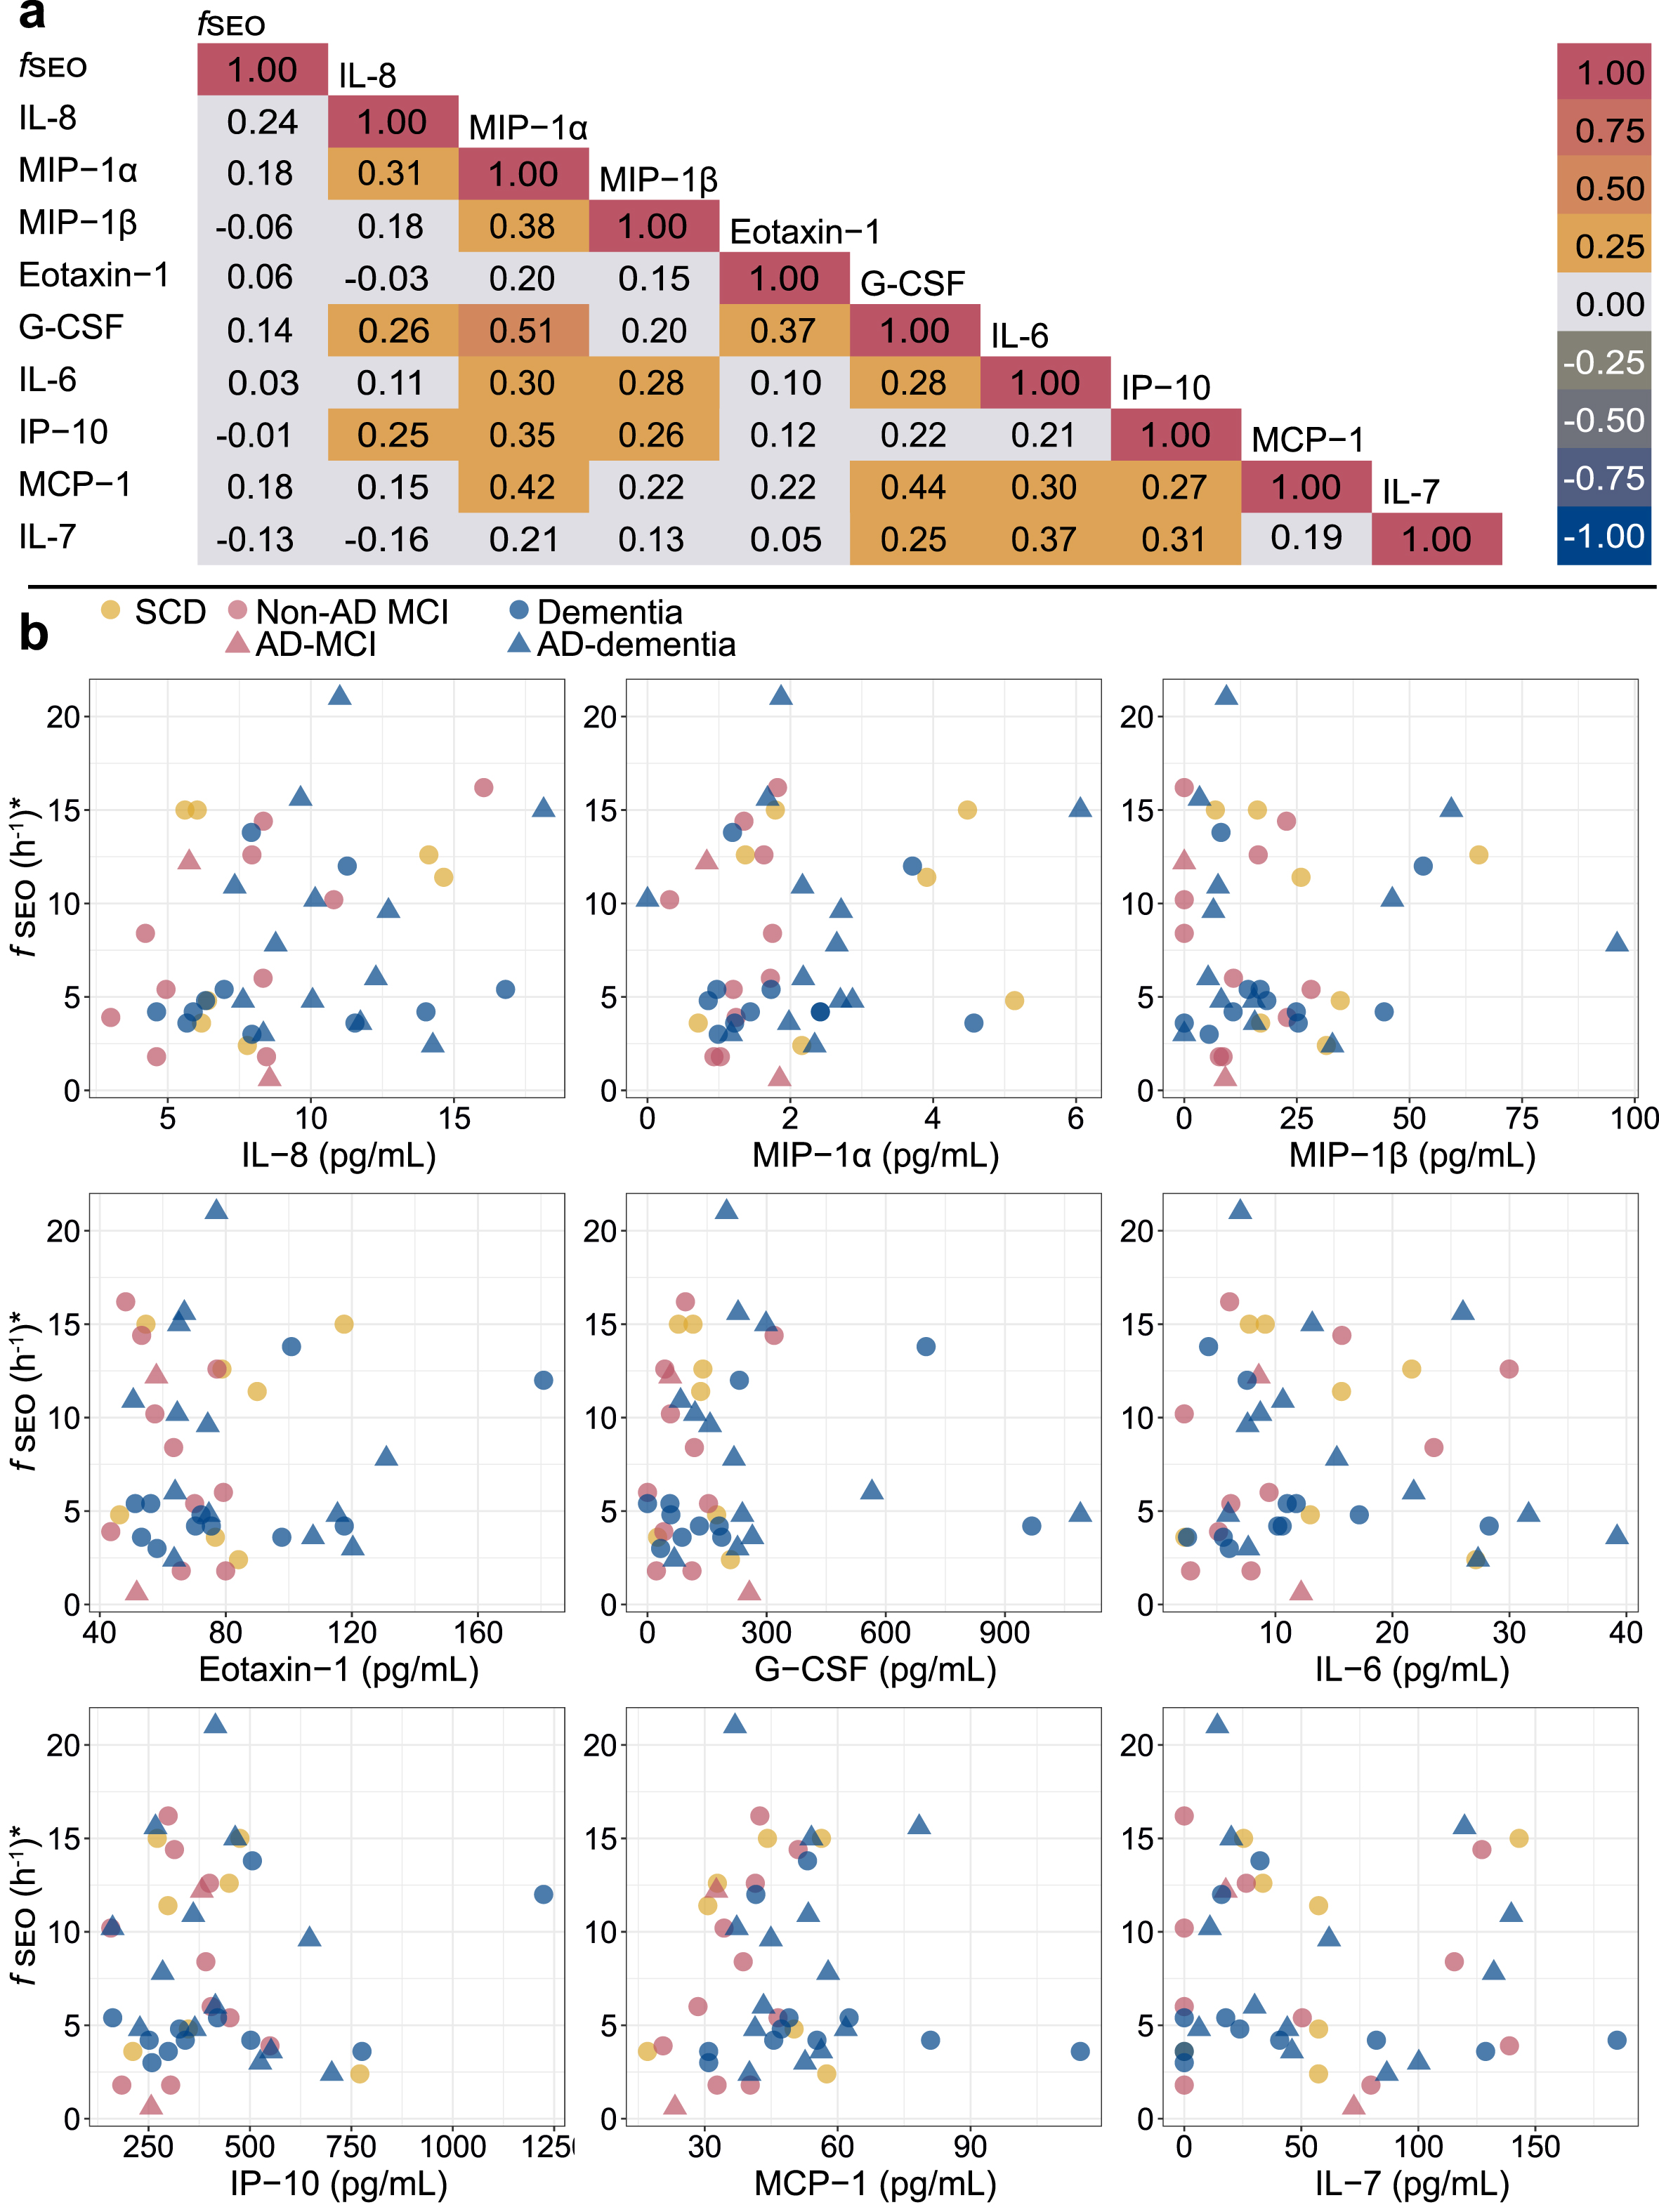
The Spearman correlation matrix for the serum fSEO (nanoplaque levels) and the cytokines is presented in Fig. 3. Serum fSEO was not correlated with any of the cytokines; the correlation coefficients were all small (ρ<0.25). Certain of the cytokines were strongly correlated with each other. In the sub-set with CSF biomarkers, higher CSF t-tau was associated with higher serum IL-8 (ρ= 0.40) and higher serum G-CSF (ρ= 0.41).
Fig. 3
a) Spearman correlation matrix for the serum nanoplaques and cytokines. b) Correlations between serum nanoplaque levels and serum cytokine levels. Darker colors indicate overlapping values. *Outliers with fSEO = 70.2 h-1,fSEO = 31.2 h-1, IL-6 = 100.2 pg/mL and IL-6 = 45.2 pg/mL, are not shown. AD, Alzheimer’s disease; fSEO, frequency of single event occurrence; G-CSF, granulocyte colony-stimulating factor; IL, interleukin; IP, interferon gamma-induced protein; MCI, mild cognitive impairment; MCP, monocyte chemoattractant protein; MIP, macrophage inflammatory protein; SCD, subjective cognitive decline.
Sensitivity analysis
As the non-AD group was highly heterogeneous, we performed two sets of sensitivity analysis (data not shown). In the first sensitivity analysis we excluded patients with SCD, and in the second we excluded patients with vascular impairment and Lewy body dementia, known to be associated with amyloid aggregation [26, 27]. When excluding SCD patients, MMSE no longer differed between the AD and non-AD group. When excluding the patients with vascular impairment and Lewy body dementia, CDR-SOB was significantly higher in the AD group than in the non-AD group (p < 0.05). Further, after exclusion of the patients with vascular impairment and Lewy body dementia, p-tau showed an association with IL-8 (ρ= 0.47) and G-CSF (ρ= 0.47). Beyond this, exclusion of these patients did not affect the results.
DISCUSSION
In the current study, we have extended our previous research to study the associations of nanoplaques and cytokines in serum. Our main findings were that serum nanoplaques were not increased in clinical AD patients compared to non-AD memory clinic patients and that serum nanoplaques were not associated with cytokine levels. Further, out of the nine analyzed cytokines, only IL-8 and G-CSF were significantly increased in the AD group.
While we have previously shown that amyloidogenic nanoplaques are increased in the serum of AD patients compared to healthy controls [11], our current results show that serum nanoplaque levels did not differ between clinical AD and non-AD patients. This suggests limited use of serum nanoplaque levels as a single biomarker for differential diagnosis between AD and non-AD patients in a memory clinic setting. Potentially, this could be due to limitations of the ThT-FCS assay. The ThT-FCS assay labels amyloids, i.e., aggregates with a β-sheet secondary structure, and detects them with single-molecule sensitivity and high specificity. However, the ThT-FCS assay cannot identify aggregates that adopt other conformations that do not give rise to ThT fluorescence, such as α-helix. Moreover, it also cannot report on the primary structure, i.e., the amino acid sequence, of the peptides composing the nanoplaques. In addition to Aβ, several other proteins can aggregate and acquire this secondary structure; the serum nanoplaques may therefore be composed of Aβ in combination with other proteins [29]. Another challenge arises because of the inherently low concentration of nanoplaques in serum. As only a small number of amyloids from the central nervous system enters the peripheral blood circulation, only a handful of nanoplaque passages are observed during the signal acquisition time. In our original study, we have shown that while fluorescence intensity peaks are occasionally detected in the serum without ThT, the mean frequency of their occurrence,
Cytokine and nanoplaque levels were not associated in serum, in contrast to previous findings in CSF in a different patient cohort [14]. This suggests that while CSF nanoplaques appear to be associated with markers of neuroinflammation, serum nanoplaques are not good indicators of cytokine-driven systemic inflammatory or anti-inflammatory activity. The interpretation of this data is complicated, as we do not have paired CSF and serum concentrations for the nanoplaques and cytokines. As such, we cannot be certain whether nanoplaques could be produced in the periphery, nor what percentage of the measured cytokines are derived from the central nervous system. However, previous studies including cytokine measures from paired CSF and serum samples have found no correlation between the two [30]. This implies that the cytokine levels in the CSF are, at least partially, independent from the systemic cytokine levels.
In our cohort, serum IL-8 and G-CSF levels were increased in patients with clinical AD compared to non-AD patients. In the CSF, IL-8 levels are negatively associated with amyloidogenic nanoplaques [14]; it is unclear why the relationship between IL-8 and nanoplaques is not paralleled in serum. One potential explanation is that CSF IL-8 levels are higher than serum IL-8 levels in AD, suggesting that cytokines in the CSF are derived from the brain and not the periphery [30]. Previous research on serum IL-8 as a biomarker for AD has rendered conflicting results. Most studies report elevated levels in AD [31–33], but one study found a significant reduction of IL-8 in both CSF and serum [30]. However, high IL-8 levels are not exclusive to AD, but also associated with, e.g., cognitive decline post-stroke [34]. Further, one study found that IL-8 was only increased in AD patients with concomitant vascular disease (white matter hyperintensities) [35], but the mechanisms underlying this association is unclear; in the current study IL-8 was elevated in AD patients without concomitant cerebrovascular disease. G-CSF also appears to have a complex relationship with AD pathology and levels depend on disease stage. G-CSF is decreased in AD patients compared to healthy controls and patients with vascular dementia [36, 37], but within AD patients, higher G-CSF levels are indicative of increased disease severity [38]. Thus, one potential explanation of the increased G-CSF levels in AD patients is that they had more severe disease. It is unknown whether G-CSF may be an indicator of disease severity in non-AD neurological disorders.
Although cytokines have been highlighted as potential early biomarkers for AD [4], previous research on serum cytokine levels has resulted in conflicting findings. Therefore, the clinical significance of these measurements is heavily debated. Nonetheless, it is possible that the immune component of AD is affected by immune cells from outside the brain [39]. Indeed, the OAS1 gene, which controls pro-inflammatory responses of peripheral myeloid cells, has recently been linked to both AD and critical illness with coronavirus disease 2019 (COVID-19) [40]. Moreover, several viral infections have been linked to AD risk and AD pathology [41], suggesting a role for systematic inflammation in AD. Markers of systemic inflammation have been linked with several markers of AD pathology, including disruption in the functional connectivity of the default mode network, hippocampal atrophy, and core CSF biomarkers [42]; both protective and damaging effects are present. However, it is difficult to separately analyze the effects of neuroinflammation and systemic inflammation, as they interact and influence each other [43]. Increased levels of serum IL-6 and MCP-1 at selected AD stages have been reported previously [44, 45], whereas IP-10 appears to be increased exclusively in CSF and not in serum [46]. Most studies have compared patients with AD to patients at earlier stages of cognitive impairment (MCI) and/or healthy controls. However, it is likely that cytokines are involved in multiple pathologies, which could explain the lack of group differences between the AD and non-AD patients.
One avenue for future research is to explore the association between vascular pathology, systemic inflammation and amyloid pathology. Blood-brain barrier (BBB) dysfunction is an early feature of AD pathology [47], but the mechanisms driving this are not well known. Larger Aβ aggregates have been shown to contribute to neuroinflammation through compromising the BBB [48]. It is unknown how BBB impairment might affect the concentrations of nanoplaques in serum and CSF. Moreover, the BBB could be damaged in AD due to cerebral amyloid angiopathy, the accumulation of Aβ within the brain blood vessels, which causes vascular inflammation [49]. Damage to the BBB could affect the communication between the central and peripheral immune systems [49]. While little is known about the association between inflammation and BBB dysfunction in AD pathogenesis [49], several of the analyzed cytokines have been associated with BBB dysfunction [50–53]. It has been proposed that in early stages of AD, systematic and central inflammatory processes act in concert to affect BBB permeability, leaving the brain more vulnerable to downstream neurodegeneration [53]. As such, it would be of interest to understand the interplay between CSF and serum nanoplaques, cytokines and markers of BBB dysfunction.
Our study has several limitations. Most notably, the cohort is small to begin with (49 patients), and a major caveat in the interpretation of our data is that we only have complete biomarker profiles for a small subgroup (26 patients). However, in our previous research on the NorCog population we have found very high congruence between clinical- and biomarker-based classification of patients [14]. Furthermore, we do not have paired measurements of nanoplaque levels in CSF and serum from the same patient, and we cannot be certain of the composition of the quantified nanoplaques, which limits our interpretations as previously discussed. A further limitation is the lack of a healthy control group and clinical information that would be of relevance for systemic inflammation. Finally, given the small sample size, there are a few patients in each subgroup, and the non-AD cohort is highly heterogeneous, including samples from patients with vascular impairment and Lewy body dementia, conditions known to frequently present with amyloid aggregates [26, 27].
Conclusion
In this small naturalistic memory clinic cohort, serum nanoplaque levels did not differ between AD and non-AD patients and were not associated with any cytokines tested, while two out of the nine cytokines, IL-8 and G-CSF, were increased in AD patients compared to non-AD patients. This suggests that serum nanoplaque levels do not correlate with these indicators of systemic inflammation, and that this biomarker alone cannot be used to identify clinical AD in unselected memory clinic cohorts.
ACKNOWLEDGMENTS
This work was supported by funding from the Olav Thon Foundation, Swedish Foundation for Strategic Research (SBE13-0115), Swedish Research Council (VR 2018-05337), Olle Engkvists Foundation (199-0480), Magnus Bergvalls Foundation (2019-03381, 2020-04043) and by grants provided by Region Stockholm (ALF projects 20180365 and 20190561). The funding agencies had no influence on the study design, methods, data collection, analysis or interpretation, manuscript writing or the decision to submit the article for publication.
We want to acknowledge the Norwegian Registry of Persons Assessed for Cognitive Symptoms (NorCog) for providing access to patient data and CSF samples. We thank the patients who have participated in NorCog.
Authors’ disclosures available online (https://www.j-alz.com/manuscript-disclosures/21-5504r1).
SUPPLEMENTARY MATERIAL
[1] The supplementary material is available in the electronic version of this article: https://dx.doi.org/10.3233/JAD-215504.
REFERENCES
[1] | Serrano-Pozo A , Frosch MP , Masliah E , Hyman BT ((2011) ) Neuropathological alterations in Alzheimer disease. Cold Spring Harb Perspect Med 1: , a006189. |
[2] | Heneka MT , Carson MJ , El Khoury J , Landreth GE , Brosseron F , Feinstein DL , Jacobs AH , Wyss-Coray T , Vitorica J , Ransohoff RM , Herrup K , Frautschy SA , Finsen B , Brown GC , Verkhratsky A , Yamanaka K , Koistinaho J , Latz E , Halle A , Petzold GC , Town T , Morgan D , Shinohara ML , Perry VH , Holmes C , Bazan NG , Brooks DJ , Hunot S , Joseph B , Deigendesch N , Garaschuk O , Boddeke E , Dinarello CA , Breitner JC , Cole GM , Golenbock DT , Kummer MP ((2015) ) Neuroinflammation in Alzheimer’s disease. Lancet Neurol 14: , 388–405. |
[3] | Zhang B , Gaiteri C , Bodea LG , Wang Z , McElwee J , Podtelezhnikov AA , Zhang C , Xie T , Tran L , Dobrin R , Fluder E , Clurman B , Melquist S , Narayanan M , Suver C , Shah H , Mahajan M , Gillis T , Mysore J , MacDonald ME , Lamb JR , Bennett DA , Molony C , Stone DJ , Gudnason V , Myers AJ , Schadt EE , Neumann H , Zhu J , Emilsson V ((2013) ) Integrated systems approach identifies genetic nodes and networks in late-onset Alzheimer’s disease. Cell 153: , 707–720. |
[4] | Wang WY , Tan MS , Yu JT , Tan L ((2015) ) Role of pro-inflammatory cytokines released from microglia in Alzheimer’s disease. Ann Transl Med 3: , 136. |
[5] | Shen XN , Niu LD , Wang YJ , Cao XP , Liu Q , Tan L , Zhang C , Yu JT ((2019) ) Inflammatory markers in Alzheimer’s disease and mild cognitive impairment: A meta-analysis and systematic review of 170 studies. J Neurol Neurosurg Psychiatry 90: , 590–598. |
[6] | Heneka MT , Sastre M , Dumitrescu-Ozimek L , Dewachter I , Walter J , Klockgether T , Van Leuven F ((2005) ) Focal glial activation coincides with increased BACE1 activation and precedes amyloid plaque deposition in APP[V717I] transgenic mice. J Neuroinflammation 2: , 22. |
[7] | Taipa R , das Neves SP , Sousa AL , Fernandes J , Pinto C , Correia AP , Santos E , Pinto PS , Carneiro P , Costa P , Santos D , Alonso I , Palha J , Marques F , Cavaco S , Sousa N ((2019) ) Proinflammatory and anti-inflammatory cytokines in the CSF of patients with Alzheimer’s disease and their correlation with cognitive decline. Neurobiol Aging 76: , 125–132. |
[8] | Nag S , Sarkar B , Bandyopadhyay A , Sahoo B , Sreenivasan VKA , Kombrabail M , Muralidharan C , Maiti S ((2011) ) Nature of the amyloid-beta monomer and the monomer-oligomer equilibrium. J Biol Chem 286: , 13827–13833. |
[9] | De S , Whiten DR , Ruggeri FS , Hughes C , Rodrigues M , Sideris DI , Taylor CG , Aprile FA , Muyldermans S , Knowles TPJ , Vendruscolo M , Bryant C , Blennow K , Skoog I , Kern S , Zetterberg H , Klenerman D ((2019) ) Soluble aggregates present in cerebrospinal fluid change in size and mechanism of toxicity during Alzheimer’s disease progression. Acta Neuropathol Commun 7: , 120. |
[10] | De S , Wirthensohn DC , Flagmeier P , Hughes C , Aprile FA , Ruggeri FS , Whiten DR , Emin D , Xia Z , Varela JA , Sormanni P , Kundel F , Knowles TPJ , Dobson CM , Bryant C , Vendruscolo M , Klenerman D ((2019) ) Different soluble aggregates of Aβ42 can give rise to cellular toxicity through different mechanisms. Nat Commun 10: , 1541. |
[11] | Tiiman A , Jelic V , Jarvet J , Jaremo P , Bogdanovic N , Rigler R , Terenius L , Graslund A , Vukojevic V ((2019) ) Amyloidogenic nanoplaques in blood serum of patients with Alzheimer’s disease revealed by time-resolved Thioflavin T fluorescence intensity fluctuation analysis. J Alzheimers Dis 68: , 571–582. |
[12] | Aksnes M , Müller EG , Tiiman A , Edwin TH , Terenius L , Revheim ME , Vukojević V , Bogdanović N , Knapskog AB ((2020) ) Amyloidogenic nanoplaques in cerebrospinal fluid: Relationship to amyloid brain uptake and clinical Alzheimer’s disease in a memory clinic cohort. J Alzheimers Dis 77: , 831–842. |
[13] | Aksnes M , Tiiman A , Edwin TH , Terenius L , Bogdanović N , Vukojević V , Knapskog A-B ((2021) ) Comparison of cerebrospinal fluid amyloidogenic nanoplaques with core biomarkers of Alzheimer’s disease. Front Aging Neurosci 12: , 608628. |
[14] | Aksnes M , Aass HCD , Tiiman A , Edwin TH , Terenius L , Bogdanović N , Vukojević V , Knapskog A-B ((2021) ) Associations of cerebrospinal fluid amyloidogenic nanoplaques with cytokines in Alzheimer’s disease. Transl Neurodegener 10: , 18. |
[15] | Blennow K ((2017) ) A review of fluid biomarkers for Alzheimer’s disease: Moving from CSF to blood. Neurol Ther 6: , 15–24. |
[16] | Perry VH , Teeling J ((2013) ) Microglia and macrophages of the central nervous system: The contribution of microglia priming and systemic inflammation to chronic neurodegeneration. Semin Immunopathol 35: , 601–612. |
[17] | Wang J , Gu BJ , Masters CL , Wang Y-J ((2017) ) A systemic view of Alzheimer disease—insights from amyloid-β metabolism beyond the brain. Nat Rev Neurol 13: , 612–623. |
[18] | Hazen J , Vistnes M , Barca ML , Eldholm RS , Persson K , Brækhus A , Saltvedt I , Selbæk G , Engedal K , Knapskog AB ((2020) ) The association between circulating inflammatory markers and the progression of Alzheimer disease in Norwegian memory clinic patients with mild cognitive impairment or dementia. Alzheimer Dis Assoc Disord 34: , 47–53. |
[19] | Braekhus A , Ulstein I , Wyller TB , Engedal K ((2011) ) The Memory Clinic–outpatient assessment when dementia is suspected. Tidsskr Nor Laegeforen 131: , 2254–2257. |
[20] | Jessen F , Amariglio RE , van Boxtel M , Breteler M , Ceccaldi M , Chetelat G , Dubois B , Dufouil C , Ellis KA , van der Flier WM , Glodzik L , van Harten AC , de Leon MJ , McHugh P , Mielke MM , Molinuevo JL , Mosconi L , Osorio RS , Perrotin A , Petersen RC , Rabin LA , Rami L , Reisberg B , Rentz DM , Sachdev PS , de la Sayette V , Saykin AJ , Scheltens P , Shulman MB , Slavin MJ , Sperling RA , Stewart R , Uspenskaya O , Vellas B , Visser PJ , Wagner M ((2014) ) A conceptual framework for research on subjective cognitive decline in preclinical Alzheimer’s disease. Alzheimers Dement 10: , 844–852. |
[21] | Albert MS , DeKosky ST , Dickson D , Dubois B , Feldman HH , Fox NC , Gamst A , Holtzman DM , Jagust WJ , Petersen RC , Snyder PJ , Carrillo MC , Thies B , Phelps CH ((2011) ) The diagnosis of mild cognitive impairment due to Alzheimer’s disease: Recommendations from the National Institute on Aging-Alzheimer’s Association workgroups on diagnostic guidelines for Alzheimer’s disease. Alzheimers Dement 7: , 270–279. |
[22] | McKhann GM , Knopman DS , Chertkow H , Hyman BT , Jack CR Jr. , Kawas CH , Klunk WE , Koroshetz WJ , Manly JJ , Mayeux R , Mohs RC , Morris JC , Rossor MN , Scheltens P , Carrillo MC , Thies B , Weintraub S , Phelps CH ((2011) ) The diagnosis of dementia due to Alzheimer’s disease: Recommendations from the National Institute on Aging-Alzheimer’s Association workgroups on diagnostic guidelines for Alzheimer’s disease. Alzheimers Dement 7: , 263–269. |
[23] | Sachdev P , Kalaria R , O’Brien J , Skoog I , Alladi S , Black SE , Blacker D , Blazer DG , Chen C , Chui H , Ganguli M , Jellinger K , Jeste DV , Pasquier F , Paulsen J , Prins N , Rockwood K , Roman G , Scheltens P ((2014) ) Diagnostic criteria for vascular cognitive disorders: A VASCOG statement. Alzheimer Dis Assoc Disord 28: , 206–218. |
[24] | Rascovsky K , Hodges JR , Knopman D , Mendez MF , Kramer JH , Neuhaus J , van Swieten JC , Seelaar H , Dopper EG , Onyike CU , Hillis AE , Josephs KA , Boeve BF , Kertesz A , Seeley WW , Rankin KP , Johnson JK , Gorno-Tempini ML , Rosen H , Prioleau-Latham CE , Lee A , Kipps CM , Lillo P , Piguet O , Rohrer JD , Rossor MN , Warren JD , Fox NC , Galasko D , Salmon DP , Black SE , Mesulam M , Weintraub S , Dickerson BC , Diehl-Schmid J , Pasquier F , Deramecourt V , Lebert F , Pijnenburg Y , Chow TW , Manes F , Grafman J , Cappa SF , Freedman M , Grossman M , Miller BL ((2011) ) Sensitivity of revised diagnostic criteria for the behavioural variant of frontotemporal dementia. Brain 134: , 2456–2477. |
[25] | Vukojevic V , Heidkamp M , Ming Y , Johansson B , Terenius L , Rigler R ((2008) ) Quantitative single-molecule imaging by confocal laser scanning microscopy. Proc Natl Acad Sci U S A 105: , 18176–18181. |
[26] | Lewis H , Beher D , Cookson N , Oakley A , Piggott M , Morris CM , Jaros E , Perry R , Ince P , Kenny RA , Ballard CG , Shearman MS , Kalaria RN ((2006) ) Quantification of Alzheimer pathology in ageing and dementia: Age-related accumulation of amyloid-beta(42) peptide in vascular dementia. Neuropathol Appl Neurobiol 32: , 103–118. |
[27] | Colom-Cadena M , Gelpi E , Charif S , Belbin O , Blesa R , Martí MJ , Clarimón J , Lleó A ((2013) ) Confluence of α-synuclein, tau, and β-amyloid pathologies in dementia with Lewy bodies. J Neuropathol Exp Neurol 72: , 1203–1212. |
[28] | Funke SA , Birkmann E , Henke F , Gortz P , Lange-Asschenfeldt C , Riesner D , Willbold D ((2007) ) Single particle detection of Abeta aggregates associated with Alzheimer’s disease. Biochem Biophys Res Commun 364: , 902–907. |
[29] | Luo J , Wärmländer SKTS , Gräslund A , Abrahams JP ((2016) ) Cross-interactions between the Alzheimer disease amyloid-β peptide and other amyloid proteins: A further aspect of the amyloid cascade hypothesis. J Biol Chem 291: , 16485–16493. |
[30] | Hesse R , Wahler A , Gummert P , Kirschmer S , Otto M , Tumani H , Lewerenz J , Schnack C , von Arnim CA ((2016) ) Decreased IL-8 levels in CSF and serum of AD patients and negative correlation of MMSE and IL-1β. BMC Neurol 16: , 185. |
[31] | Galimberti D , Schoonenboom N , Scarpini E , Scheltens P ((2003) ) Chemokines in serum and cerebrospinal fluid of Alzheimer’s disease patients. Ann Neurol 53: , 547–548. |
[32] | Alsadany MA , Shehata HH , Mohamad MI , Mahfouz RG ((2013) ) Histone deacetylases enzyme, copper, and IL-8 levels in patients with Alzheimer’s disease. Am J Alzheimers Dis Other Demen 28: , 54–61. |
[33] | Zhang J , Sokal I , Peskind ER , Quinn JF , Jankovic J , Kenney C , Chung KA , Millard SP , Nutt JG , Montine TJ ((2008) ) CSF multianalyte profile distinguishes Alzheimer and Parkinson diseases. Am J Clin Pathol 129: , 526–529. |
[34] | Narasimhalu K , Lee J , Leong YL , Ma L , De Silva DA , Wong MC , Chang HM , Chen C ((2015) ) Inflammatory markers and their association with post stroke cognitive decline. Int J Stroke 10: , 513–518. |
[35] | Zhu Y , Chai YL , Hilal S , Ikram MK , Venketasubramanian N , Wong B-S , Chen CP , Lai MKP ((2017) ) Serum IL-8 is a marker of white-matter hyperintensities in patients with Alzheimer’s disease. Alzheimers Dement 7: , 41–47. |
[36] | Laske C , Stellos K , Stransky E , Leyhe T , Gawaz M ((2009) ) Decreased plasma levels of granulocyte-colony stimulating factor (G-CSF) in patients with early Alzheimer’s disease. J Alzheimers Dis 17: , 115–123. |
[37] | Schmitz M , Hermann P , Oikonomou P , Stoeck K , Ebert E , Poliakova T , Schmidt C , Llorens F , Zafar S , Zerr I ((2015) ) Cytokine profiles and the role of cellular prion protein in patients with vascular dementia and vascular encephalopathy. Neurobiol Aging 36: , 2597–2606. |
[38] | Barber RC , Edwards MI , Xiao G , Huebinger RM , Diaz-Arrastia R , Wilhelmsen KC , Hall JR , O’Bryant SE ((2012) ) Serum granulocyte colony-stimulating factor and Alzheimer’s disease. Dement Geriatr Cogn Dis Extra 2: , 353–360. |
[39] | Efthymiou AG , Goate AM ((2017) ) Late onset Alzheimer’s disease genetics implicates microglial pathways in disease risk. Mol Neurodegener 12: , 43. |
[40] | Magusali N , Graham AC , Piers TM , Panichnantakul P , Yaman U , Shoai M , Reynolds RH , Botia JA , Brookes KJ , Guetta-Baranes T , Bellou E , Bayram S , Sokolova D , Ryten M , Sala Frigerio C , Escott-Price V , Morgan K , Pocock JM , Hardy J , Salih DA ((2021) ) A genetic link between risk for Alzheimer’s disease and severe COVID-19 outcomes via the OAS1 gene. Brain 144: , 3727–3741. |
[41] | Xia X , Wang Y , Zheng J ((2021) ) COVID-19 and Alzheimer’s disease: How one crisis worsens the other. Transl Neurodegener 10: , 15. |
[42] | Magalhães TNC , Weiler M , Teixeira CVL , Hayata T , Moraes AS , Boldrini VO , Dos Santos LM , de Campos BM , de Rezende TJR , Joaquim HPG , Talib LL , Forlenza OV , Cendes F , Balthazar MLF ((2018) ) Systemic inflammation and multimodal biomarkers in amnestic mild cognitive impairment and Alzheimer’s disease. Mol Neurobiol 55: , 5689–5697. |
[43] | Mietelska-Porowska A , Wojda U ((2017) ) T lymphocytes and inflammatory mediators in the interplay between brain and blood in Alzheimer’s disease: Potential pools of new biomarkers. J Immunol Res 2017: , 4626540. |
[44] | Kim YS , Lee KJ , Kim H ((2017) ) Serum tumour necrosis factor-α and interleukin-6 levels in Alzheimer’s disease and mild cognitive impairment. Psychogeriatrics 17: , 224–230. |
[45] | Galimberti D , Fenoglio C , Lovati C , Venturelli E , Guidi I , Corrà B , Scalabrini D , Clerici F , Mariani C , Bresolin N , Scarpini E ((2006) ) Serum MCP-1 levels are increased in mild cognitive impairment and mild Alzheimer’s disease. Neurobiol Aging 27: , 1763–1768. |
[46] | Galimberti D , Venturelli E , Fenoglio C , Lovati C , Guidi I , Scalabrini D , Mariani C , Bresolin N , Scarpini E ((2007) ) IP-10 serum levels are not increased in mild cognitive impairment and Alzheimer’s disease. Eur J Neurol 14: , e3–e4. |
[47] | Bell RD , Zlokovic BV ((2009) ) Neurovascular mechanisms and blood-brain barrier disorder in Alzheimer’s disease. Acta Neuropathol 118: , 103–113. |
[48] | Parodi-Rullán R , Ghiso J , Cabrera E , Rostagno A , Fossati S ((2020) ) Alzheimer’s amyloid β heterogeneous species differentially affect brain endothelial cell viability, blood-brain barrier integrity, and angiogenesis. Aging Cell 19: , e13258. |
[49] | Takeda S , Sato N , Morishita R ((2014) ) Systemic inflammation, blood-brain barrier vulnerability and cognitive/non-cognitive symptoms in Alzheimer disease: Relevance to pathogenesis and therapy. Front Aging Neurosci 6: , 171. |
[50] | Man S-M , Ma Y-R , Shang D-S , Zhao W-D , Li B , Guo D-W , Fang W-G , Zhu L , Chen Y-H ((2007) ) Peripheral T cells overexpress MIP-1α to enhance its transendothelial migration in Alzheimer’s disease. Neurobiol Aging 28: , 485–496. |
[51] | Brat DJ , Bellail AC , Van Meir EG ((2005) ) The role of interleukin-8 and its receptors in gliomagenesis and tumoral angiogenesis. Neuro Oncol 7: , 122–133. |
[52] | Bowman GL , Dayon L , Kirkland R , Wojcik J , Peyratout G , Severin IC , Henry H , Oikonomidi A , Migliavacca E , Bacher M , Popp J ((2018) ) Blood-brain barrier breakdown, neuroinflammation, and cognitive decline in older adults. Alzheimers Dement 14: , 1640–1650. |
[53] | Ott BR , Jones RN , Daiello LA , de la Monte SM , Stopa EG , Johanson CE , Denby C , Grammas P ((2018) ) Blood-cerebrospinal fluid barrier gradients in mild cognitive impairment and Alzheimer’s disease: Relationship to inflammatory cytokines and chemokines. Front Aging Neurosci 10: , 245–245. |


