
Oscillatory Activity of the Hippocampus in Prodromal Alzheimer’s Disease: A Source-Space Magnetoencephalography Study
Abstract
Background:
In Alzheimer’s disease (AD), oscillatory activity of the human brain slows down. However, oscillatory slowing varies between individuals, particularly in prodromal AD. Cortical oscillatory changes have shown suboptimal accuracy as diagnostic markers. We speculated that focusing on the hippocampus might prove more successful, particularly using magnetoencephalography (MEG) for capturing subcortical oscillatory activity.
Objective:
We explored MEG-based detection of hippocampal oscillatory abnormalities in prodromal AD patients.
Methods:
We acquired resting-state MEG data of 18 AD dementia patients, 18 amyloid-β-positive amnestic mild cognitive impairment (MCI, prodromal AD) patients, and 18 amyloid-β-negative persons with subjective cognitive decline (SCD). Oscillatory activity in 78 cortical regions and both hippocampi was reconstructed using beamforming. Between-group and hippocampal-cortical differences in spectral power were assessed. Classification accuracy was explored using ROC curves.
Results:
The MCI group showed intermediate power values between SCD and AD, except for the alpha range, where it was higher than both (p < 0.05 and p < 0.001). The largest differences between MCI and SCD were in the theta band, with higher power in MCI (p < 0.01). The hippocampi showed several unique group differences, such as higher power in the higher alpha band in MCI compared to SCD (p < 0.05). Classification accuracy (MCI versus SCD) was best for absolute theta band power in the right hippocampus (AUC = 0.87).
Conclusion:
In this MEG study, we detected oscillatory abnormalities of the hippocampi in prodromal AD patients. Moreover, hippocampus-based classification performed better than cortex-based classification. We conclude that a focus on hippocampal MEG may improve early detection of AD-related neuronal dysfunction.
INTRODUCTION
Human neuronal activity in Alzheimer’s disease (AD) is characterized by a gradual, diffuse slowing of cortical oscillatory activity as the disease progresses, as can be assessed with scalp electroencephalography (EEG). There is an early increase in slow activity in the theta band (4–8 Hz), followed by decreases in the faster beta (13–30 Hz) and alpha (8–13 Hz) bands, and ultimately an increase in slow delta activity (0.5–4 Hz). The dominant posterior rhythm, often referred as “alpha rhythm”, which is centered around±10 Hz in healthy adults, can slow down to below 8 Hz [1, 2]. While these changes in the resting-state background pattern have been known for decades and correlate with cognitive impairment in AD, measures that quantify oscillatory slowing (e.g., based on power spectral density), have so far produced suboptimal diagnostic markers of AD [3]. A main reason for this is individual variability: in early AD, the background pattern can still remain relatively intact, complicating reliable early detection through EEG. Recently developed advanced machine learning-based classification methods are improving neurophysiological marker performance, but at this point the role of EEG markers in AD diagnosis is still supportive and context dependent [4, 5]. How can we further improve the early neurophysiological detection of AD?
The hippocampus is one of the archetypical early sites of AD pathophysiology. Structural pathology (e.g., tau phosphorylation and atrophy) is prominent in this region, correlating with the typical episodic memory impairment in AD patients. Hippocampal neuronal and synaptic activity and function is also heavily disrupted in AD. In fact, in vitro and in vivo research in AD animal models describes marked early changes in AD pathophysiology: one of the most striking abnormalities being neuronal hyperexcitability and hyperactivity, presumably mediated through amyloid-β-induced mechanisms of glutamate excitotoxicity of pyramidal neurons, as well as interneuron dysfunction [6, 7]. Relating information from animal models to knowledge from human studies can be challenging, for example due to many human studies being done on sporadic instead of familial AD, but doing so may give us a more complete picture of the present pathological processes, as there appears to be a general consensus that neuronal hyperexcitability plays a role [8]. Even before extensive synapse and neuron loss occurs, these pathological processes lead to altered behavioral repertoires of those neurons, and their combined effects are presumed to trigger a further detrimental cascade of neuronal excitation/inhibition imbalance with excitotoxic neurodegeneration, neuronal circuit malfunction, synchronization failure between larger neuronal assemblies, oscillatory changes, and ultimately long-distance functional and structural brain network disruption, resulting in cognitive decline [8–14]. So, while neuronal dysfunction is not confined to the hippocampus, it is recognized as an early AD hotspot.
A relevant clinical question is therefore whether quantitative analysis of hippocampal dysfunction might produce more powerful biomarkers in early AD stages. However, investigating hippocampal activity non-invasively in humans is a considerable technical challenge. Functional MRI (fMRI) studies have reported abnormal hippocampal activation in prodromal AD patients, and even in asymptomatic persons at risk to develop AD such as APOE4 and PSEN1 carriers [15–20]. However, the BOLD signal used for fMRI is a rather indirect measure of neuronal activity, with a low temporal resolution compared to neurophysiological techniques such as EEG and magnetoencephalography (MEG). On the other hand, with the traditional scalp EEG, accurately capturing subcortical, hippocampus-specific oscillations is difficult because of the relatively low spatial resolution, and predilection for cortical activity. Of all current non-invasive methods, MEG has the highest spatiotemporal resolution to record brain activity [21]. Using source reconstruction methods, MEG can reliably reconstruct activity in subcortical regions, including the hippocampus [22–26]. Furthermore, detection of activity in higher frequency bands such as gamma (> 30 Hz) is more reliable in MEG than in EEG, because of the reduced interference of underlying scalp tissue (e.g., muscle artefacts) on the MEG signal [27]. Since gamma activity is directly tied to hippocampal interneuron function and memory processes in AD, this is a potentially relevant technical advantage.
So far, only a few studies have examined resting-state source-space MEG of the hippocampus in AD. In mild-to-moderate AD patients, a previous source-space MEG study from our group showed hippocampal slowing, in line with the well-established cortical slowing in AD [28]. However, for clinical purposes, the earlier, pre-dementia phase is particularly relevant because this is the stage where the diagnosis of AD is preferably reached, and where new treatment options are likely to be more successful [29]. In so-called ‘prodromal AD’ (i.e., mild cognitive impairment (MCI) with positive amyloid-β biomarkers), several recent source-space MEG studies have reported changes in subcortical regions, including the hippocampus [30–33]. However, these studies had a different focus (e.g., functional connectivity analysis), as will be reviewed in more detail in the discussion section.
A source-space MEG study in prodromal AD patients with a specific focus on spectral analysis of the hippocampus compared to other regions has not yet been performed. Hippocampal activity may either show similar, yet more pronounced changes, or different behavior than in healthy persons as well as AD patients. For this purpose, we also performed within-subject comparisons between hippocampal and cortical power.
We hypothesized that the hippocampus in MCI patients would show intermediate levels of oscillatory slowing compared to persons with subjective cognitive complaints (SCD) and AD patients, but that for the MCI group the proportional change in the hippocampus versus cortical regions would be higher (i.e., more pronounced abnormalities in the hippocampus) than in the SCD and AD groups, potentially signifying pathology specific to the earlier stages of the AD continuum. Therefore, we set out to explore hippocampal and global cortical oscillatory patterns in MEG data in healthy controls with SCD, persons with prodromal AD (MCI) and mild-to-moderate AD dementia patients. Besides relative spectral power, we also included absolute power analysis to have a broad view of the oscillatory profile of hippocampal dysfunction. This decision was inspired by the tendency of studies relating spiking with local field potentials to report absolute power levels [34, 35] and our interest in assessing whether absolute and relative power contain complementary information in our study population. Moreover, underlying pathophysiological changes may independently alter oscillatory content of a signal in a general or more frequency range-bound way. Therefore, measuring both absolute and relative power can give us information we might miss by limiting ourselves to one or the other. Starting with global cortical group differences in spectral power measures, we then focus on hippocampal differences and their differences from the global cortical measures, and lastly explore their discriminatory value at the individual level.
MATERIALS AND METHODS
Subjects
The study involved three age- and gender-matched groups totaling 54 subjects: 18 AD dementia patients, 18 patients with amnestic MCI, and 18 persons with SCD. All were recruited from the Amsterdam Dementia Cohort (ADC) of the Alzheimer Center of the VU University Medical Center in the period of spring 2015–2018. All subjects were assessed according to a standard clinical protocol, which involved history taking, physical and neurological examination, an interview with a spouse or close family member, blood tests, 3T MRI of the brain according to a standard protocol, routine MEG [36], and a thorough neuropsychological assessment battery [37]. The diagnosis was made in a consensus meeting in which all the available clinical data were considered by a multidisciplinary team. For this retrospective study, subjects with a clinical diagnosis of (amnestic) MCI according to National Institute on Aging–Alzheimer’s Association (NIA-AA) 2011 criteria who received a baseline MEG registration, and with positive amyloid-β biomarkers (cerebrospinal fluid (CSF) ptau/amyloid-β ratio > 0.020 and/or abnormal amyloid-β PET) were recruited [38]. Memory was the only objectively impaired cognitive domain in the neuropsychological battery results of the MCI group. AD patients likewise fulfilled diagnostic NIA-AA 2011 criteria for probable AD, with similar biomarker evidence for AD pathology [39]. In addition, patients who after extensive examination received the diagnosis SCD with a baseline MEG were recruited as healthy controls, and all groups were age- and gender-matched for further analysis [40]. The biomarker status was amyloid-β-negative for 15 of the SCD subjects, and unknown for the remaining three. MCI and AD patients had (semi-)annual clinical follow-up visits combined with repeated neuropsychological testing. Since the MCI subjects all had amnestic MCI with positive biomarkers, we considered them to be on a trajectory towards AD, sometimes alternatively labelled with ‘MCI due to AD’ or ‘prodromal AD’. For sake of clarity, in the results section we shall refer to this group as ‘MCI’. Follow-up cognitive status after 3 years was known for all MCI patients: at that point, 67% of the MCI subjects had indeed converted to the dementia stage (see Supplementary Figures 3 and 4). The local Research Ethics Committee approved the study, and all participants gave written informed consent.
MEG data acquisition and pre-processing
MEG recordings were obtained on the same day as the clinical evaluation, and in the same week in which the clinical diagnosis was made. MEG recordings were performed in a magnetically shielded room (VacuumSchmelze GmbH, Hanua, Germany) using a 306-channel whole-head system (Elekta Neuromag Oy, Helsinki, Finland). The recording protocol consisted of at least two five-minute blocks of eyes-closed resting-state condition. During the eyes-closed condition, patients were instructed to close their eyes, stay awake, and to reduce eye movements. Only data from the first eyes-closed session were analyzed here. The recordings were sampled at 1250 Hz, with an online anti-aliasing filter (410 Hz) and high-pass filter (0.1 Hz). Offline, a spatial filter, the temporal extension of Signal Space Separation (tSSS) [41, 42], as implemented in MaxFilter software (Elekta Neuromag Oy, version 2.2.12), was applied with a sliding window of 10 s and correlation limit of 0.9, respectively. After visual inspection, channels containing excessive artefacts were manually discarded before estimation of the SSS coefficients. The number of excluded channels varied between 1 and 12. The head position relative to the MEG sensors was recorded continuously using the signals from five head-localization coils. The head-localization coil positions were digitized, as well as the outline of the participant’s scalp (500 points), using a 3D digitizer (Fastrak, Polhemus, Colchester, VT, USA). This scalp surface was used for co-registration with the structural (MRI) template that produced the best fit.
MEG source reconstruction
In order to obtain source-localized activity for all regions, we applied an atlas-based beamforming approach [43]: Sensor signals were projected to an anatomical framework such that source-reconstructed neuronal activity for 78 cortical regions-of-interest (ROIs) plus both hippocampi, identified by means of automated anatomical labeling (AAL) [44] (Supplementary Table 1), was obtained. To obtain a single time series for an ROI, we used each ROIs centroid as representative for that ROI [45]. For the computation of the beamformer weights we used the sphere that best fitted the scalp surface as a volume conductor model and an equivalent current dipole as source model. The orientation of the dipole was chosen to maximize the beamformer output [46]. Once the broadband (0.5–70 Hz) normalized [47] beamformer weights for the selected voxel were computed, then the broadband (0.5–70 Hz) time-series for this voxel, i.e., a virtual electrode, was reconstructed [43].
Data selection and processing
For the subsequent offline processing the source-reconstructed time-series were converted to ASCII files. For each subject five artefact-free, downsampled epochs (sample frequency 312 Hz, 4,096 samples per epoch of 13.2 s) of the first eyes-closed resting-state recording were used for further analysis. All quantitative spectral analyses were performed with in-house developed software (BrainWave version 0.9.152.8.5). Both absolute and relative power were calculated using the Fast Fourier Transform for the following frequency bands: broadband (0.5–45 Hz), delta (0.5–4 Hz), theta (4–8 Hz), lower alpha (8–10 Hz), upper alpha (10–13 Hz), beta (13–30 Hz), and gamma (30–48 Hz). Peak frequency of the posterior dominant rhythm was designated as the frequency at which spectral power was maximal within the 4–13 Hz range in 6 posterior AAL regions (Superior, middle and inferior occipital gyri, calcarine region, cuneus and lingual gyrus). All analyses were first performed for each epoch separately, and prior to group statistics the measures obtained from the five epochs per person were averaged.
For this study, we included both absolute and relative spectral power analysis, as they may provide complimentary information in terms of reflecting the underlying pathophysiology. Furthermore, to examine the specificity of hippocampal changes, its oscillatory profile was compared to global (i.e., mean cortical) activity. Finally, we aimed to explore classification accuracy of hippocampal findings for individual patients. While this study was not powered to draw firm conclusions about biomarker accuracy, here we were primarily interested in testing how hippocampal measures performed against global cortical measures, particularly in the MCI group versus SCD, as this is the clinically most relevant contrast.
Statistical analysis
Statistical analysis was performed with SPSS for Mac (version 25.0). Subject characteristics were compared with two-tailed independent sample t-tests. To reduce multiple comparison issues, an analysis of variance (ANOVA) for repeated measures was performed for the spectral outcome measures, with group as between-subject factor (n = 3) and region (mean of all cortical ROIs versus hippocampus left and right separately, n = 3) as within-subject factor (for each frequency band separately; Greenhouse-Geisser corrected) and spectral measures as dependent variable. Spectral measures showed Gaussian distributions. As a post-hoc test, pairwise group differences (SCD versus MCI; MCI versus AD; SCD versus AD) were tested parametrically with two-tailed independent sample t-tests (not assuming equal variance) when the ANOVA showed significant group or group*region effects. Receiver operating characteristic (ROC) curves were plotted to quantify between-subject discrimination accuracy for the spectral measures in all frequency bands for cortical areas (averaged over all 78 cortical regions) and both hippocampi separately. Values of p < 0.05 were considered significant.
RESULTS
Subject characteristics
Table 1 shows the main characteristics of the subject groups. The study population features a relatively young AD cohort with age- and gender-matched healthy controls (SCD) and amnestic MCI (due to AD) patients. Average Mini-Mental State Examination (MMSE) scores were significantly lower in MCI versus SCD, and in AD versus MCI. Psychoactive medication use was incidental in all groups and did not differ significantly (not shown here).
Table 1
Subject characteristics
| SCD | MCI | AD | ||
| n | 18 | 18 | 18 | |
| Age (y) | 64.2 (±6.1) | 64.1 (±6.2) | 63.8 (±6.5) | ns |
| M/F (n) | 8/10 | 9/9 | 9/9 | ns |
| Mean MMSE score (points) | 27.8 (±2.1) | 25.8 (±1.9) | 17.9 (±4.7) | ** |
SCD, subjective cognitive decline; MCI, amnestic mild cognitive impairment with positive amyloid-β biomarkers for AD; AD, Alzheimer’s disease dementia with positive amyloid-β biomarkers; MMSE, Mini-Mental State Examination; ns, no significant differences. **significance level of p < 0.001 (MCI versus SCD and AD versus MCI. Numbers between brackets represent standard deviations.
Group comparisons
Power spectra
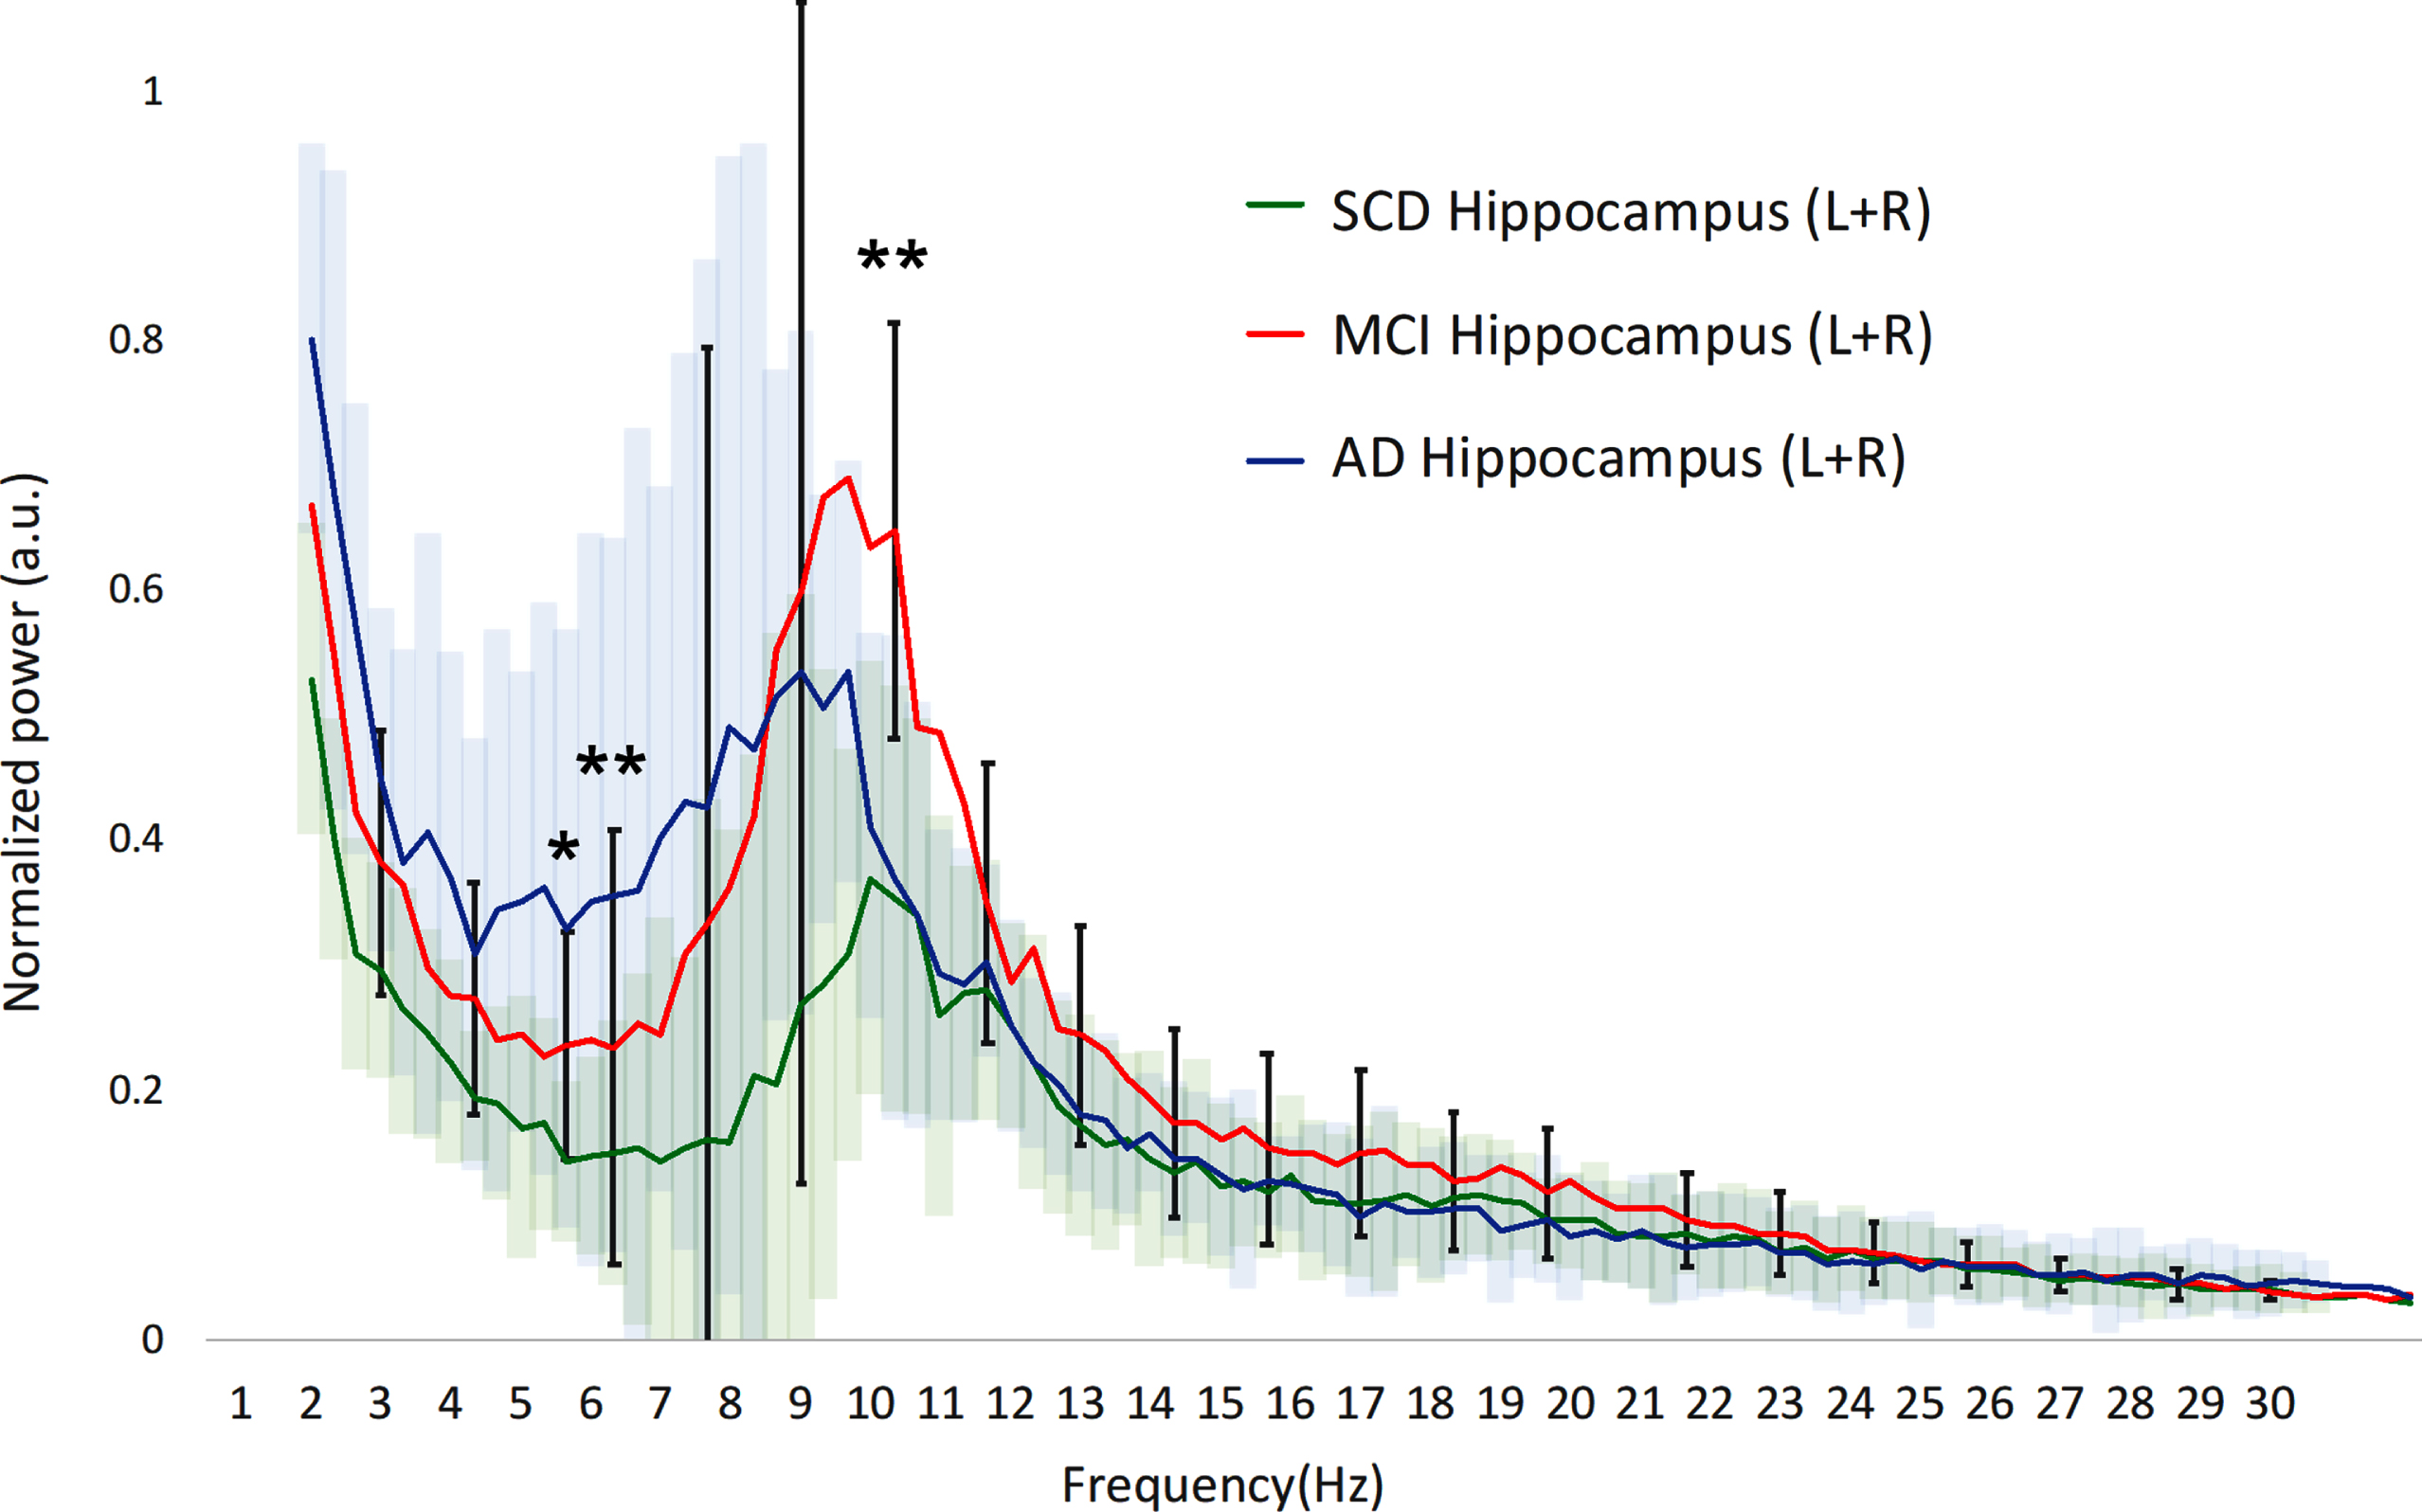
We first examined the averaged power spectra for the different groups in order to obtain a visual impression of any differences in spectral power, with a focus on the clinically relevant differences between SCD and MCI. Cortical power in MCI is higher across the upper theta-lower beta frequency range (±7–20 Hz) compared to both SCD and AD, albeit with a large variability (Fig. 1A). Significant differences between MCI and SCD were found in the upper theta and lower alpha ranges (p < 0.01 around 7 Hz). In the hippocampi (Fig. 1B), the differences were similar, yet slightly more pronounced, with significantly higher power in the theta and higher alpha ranges for MCI compared to SCD (p < 0.01).
Fig. 1A
Hippocampal power spectra. SCD, subjective cognitive decline; MCI, mild cognitive impairment; AD, Alzheimer’s disease; Hz, Hertz; a.u., arbitrary units. The 95% confidence interval of the MCI group is drawn using solid black lines, for the SCD and AD groups color clouds are used. Gamma frequency range (30–45 Hz) not shown. a.u., arbitrary units. *indicates significance level p < 0.05 (MCI versus SCD). **indicates significance level p < 0.01 (MCI versus SCD).
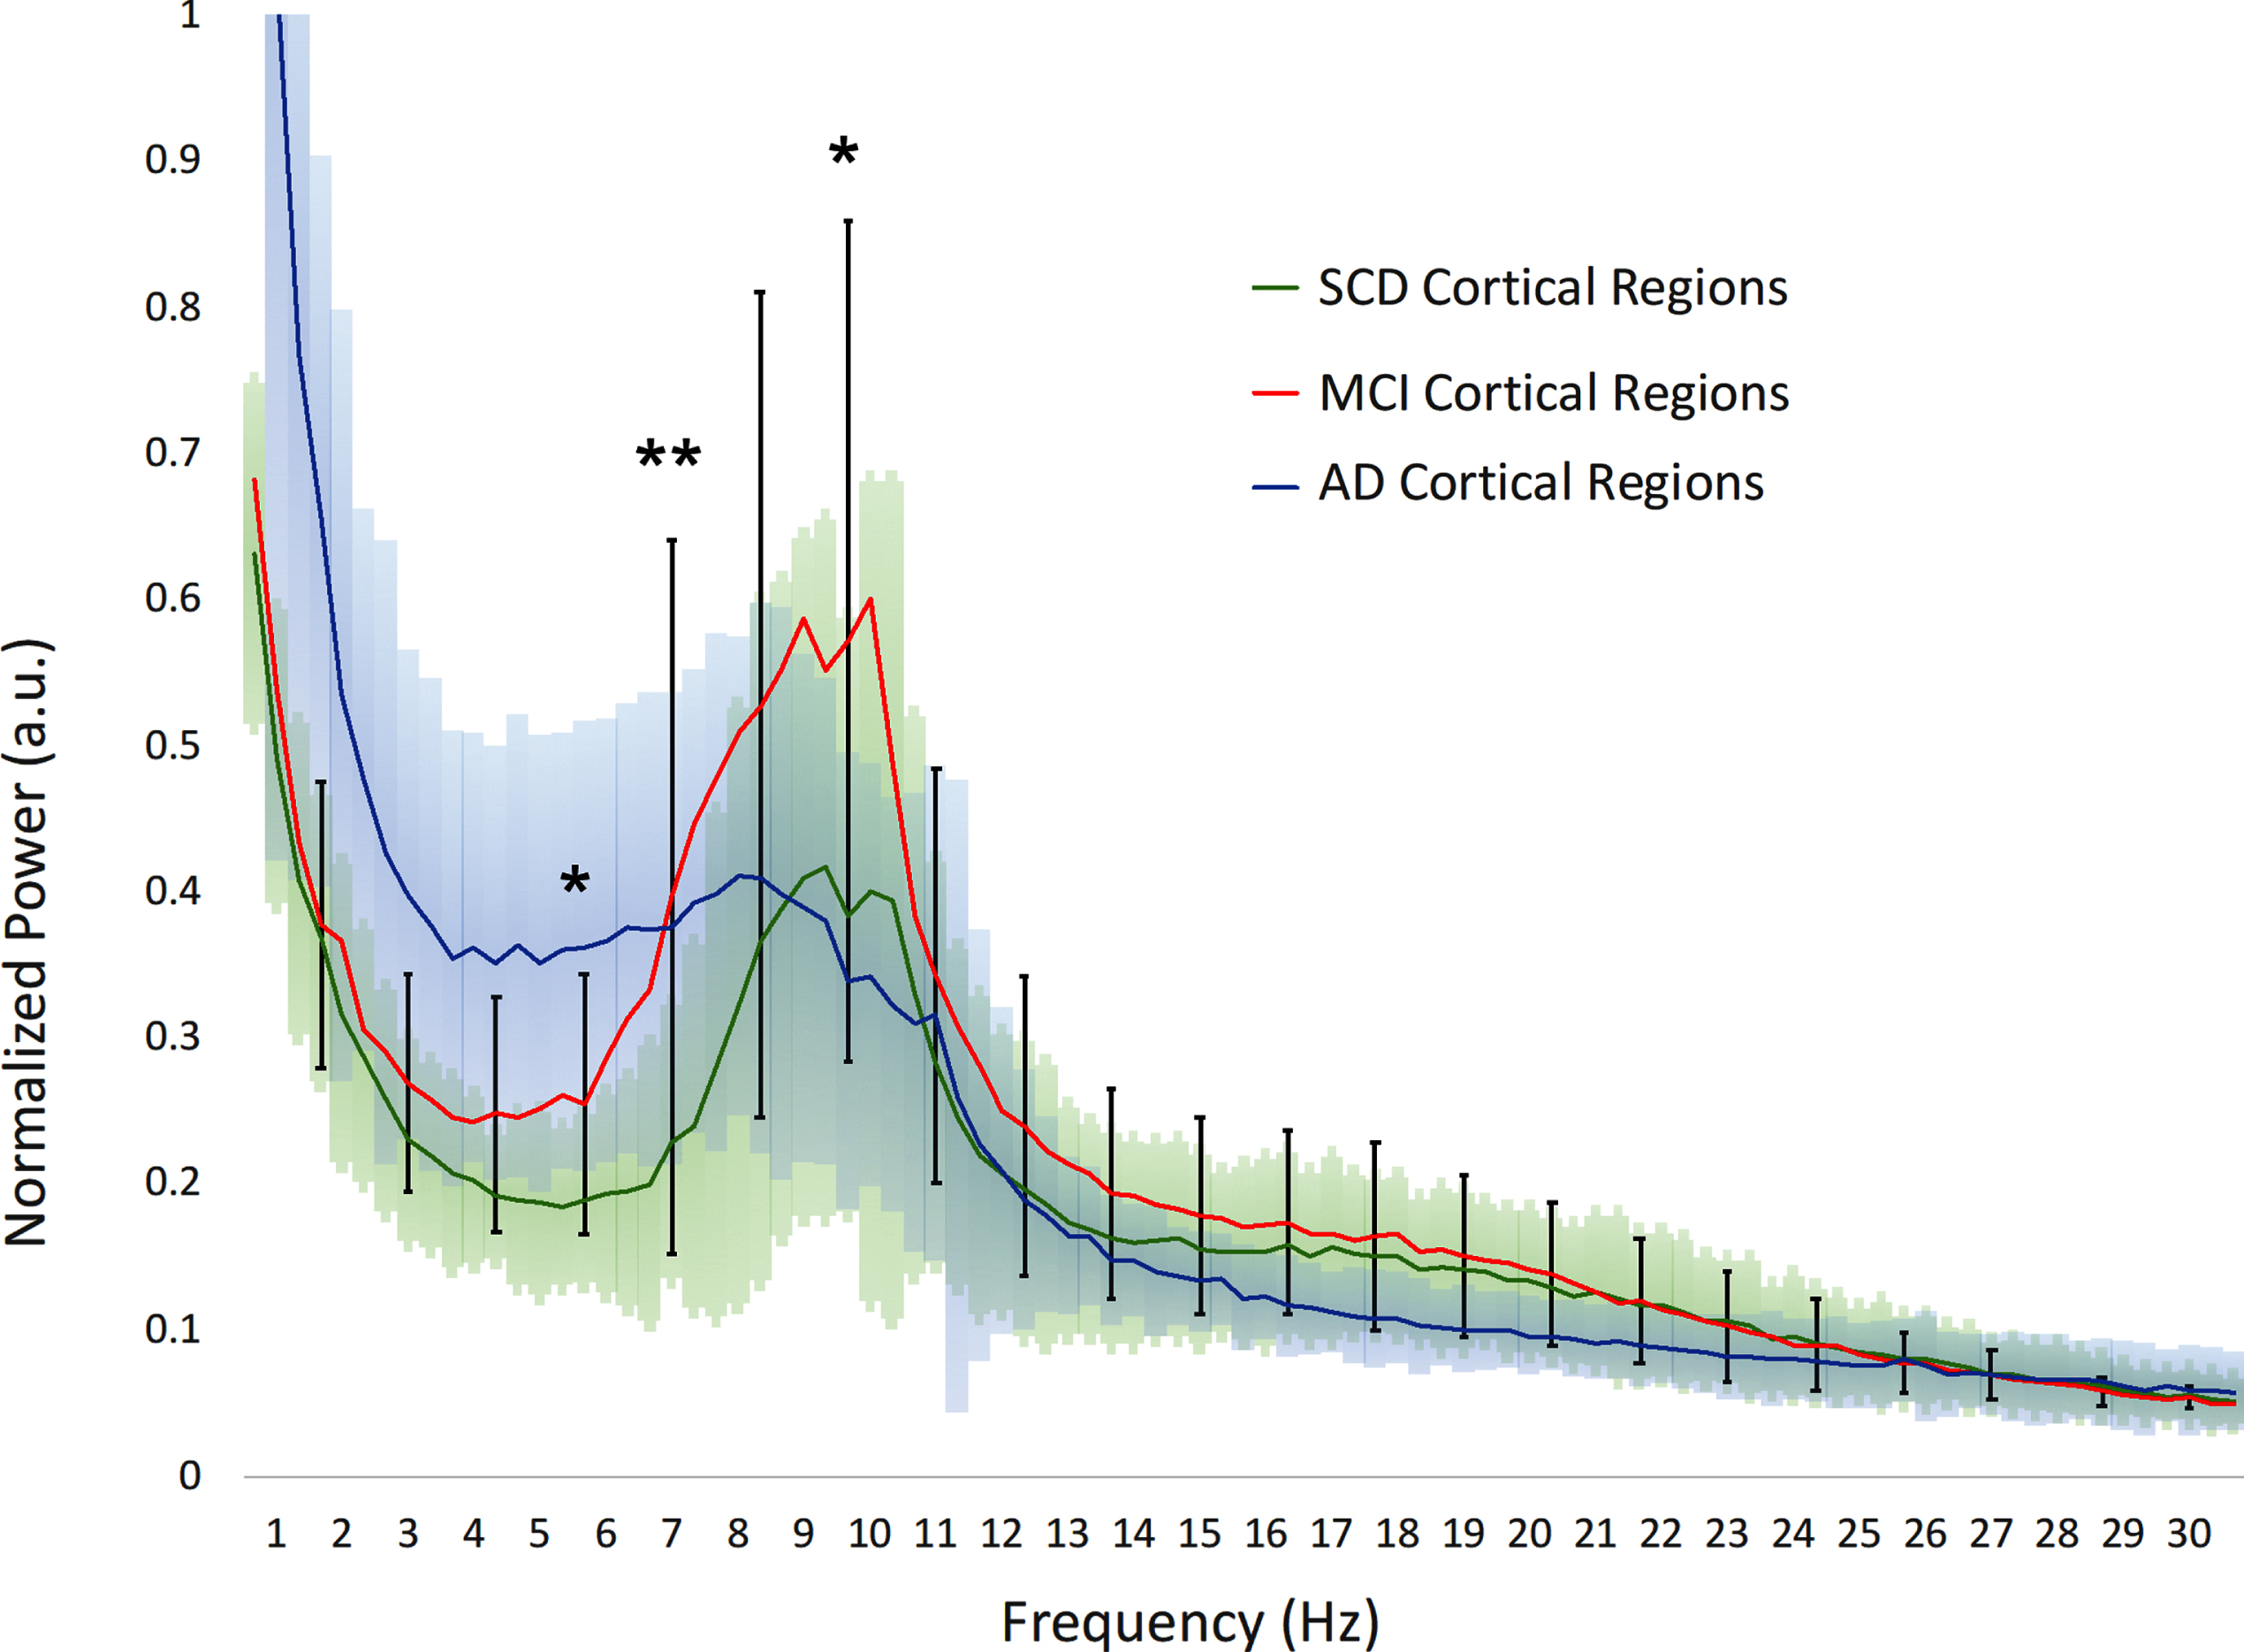
Fig. 1B
Hippocampal power spectra. SCD, subjective cognitive decline; MCI, mild cognitive impairment; AD, Alzheimer’s disease; Hz, Hertz; a.u., arbitrary units. The 95% confidence interval of the MCI group is drawn using solid black lines, for the SCD and AD groups color clouds are used, for visual clarity. Gamma frequency range (30–45 Hz) not shown. a.u., arbitrary units. *indicates significance level p < 0.05 (MCI versus SCD). **indicates significance level p < 0.01 (MCI versus SCD).
Next, we investigated quantitative group differences in spectral power for different frequency bands, both for absolute and relative power. The complete results of the repeated measures ANOVA analyses are described in Supplementary Tables 1 and 2, here we provide a summary and relevant post-hoc t-test results.
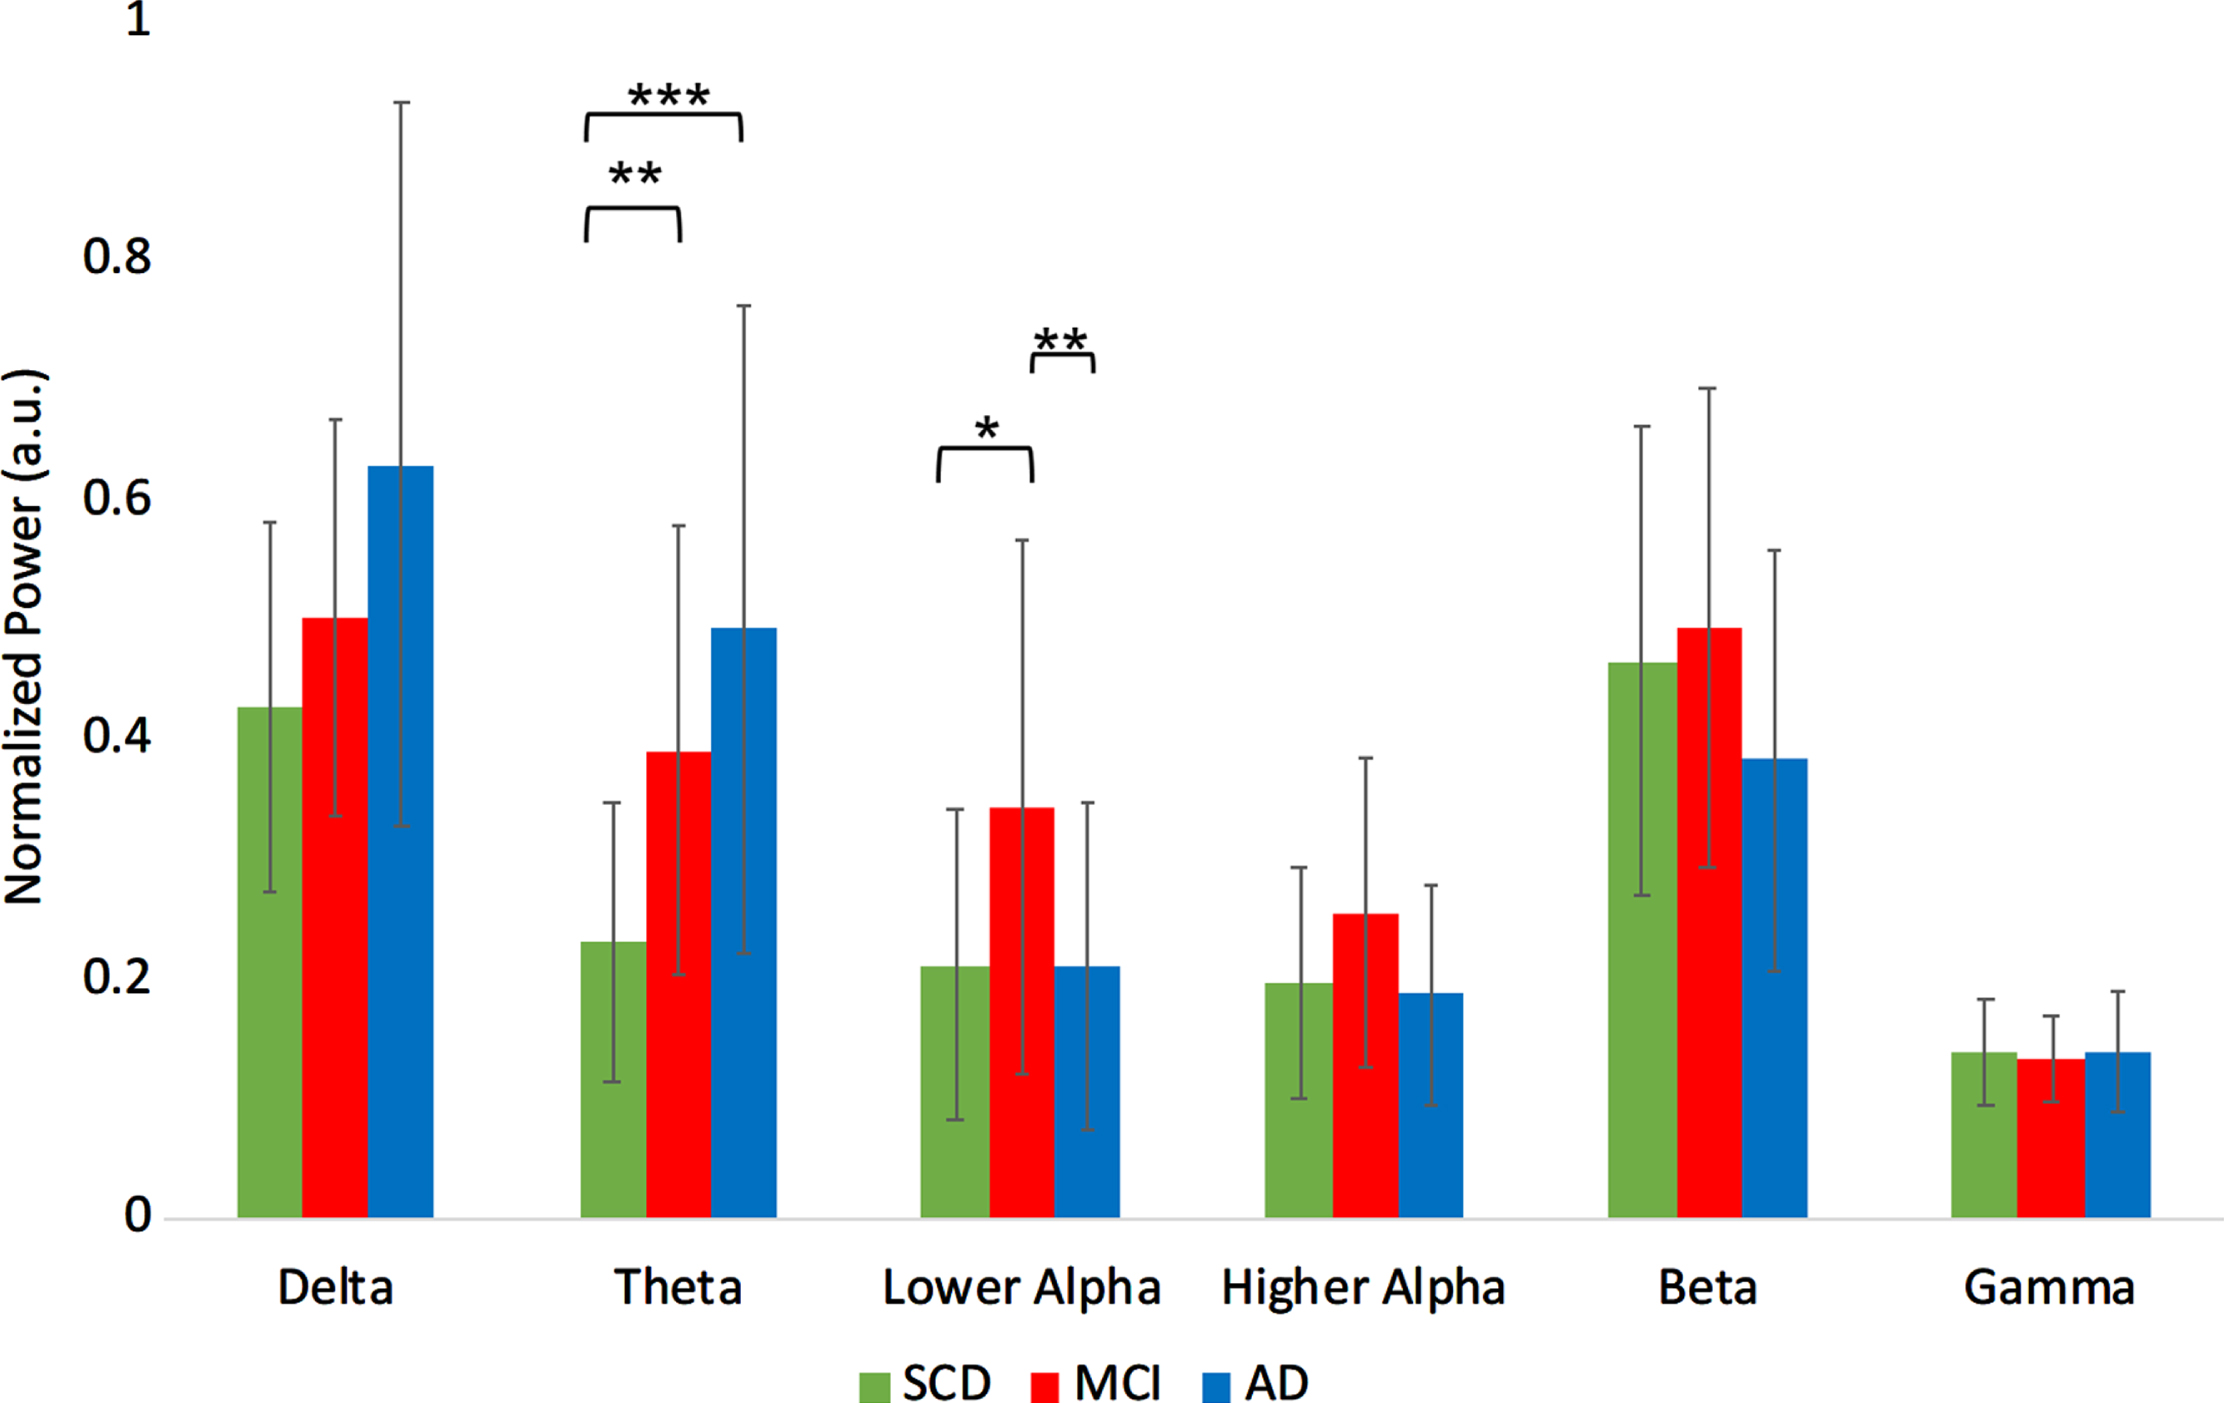
Absolute power
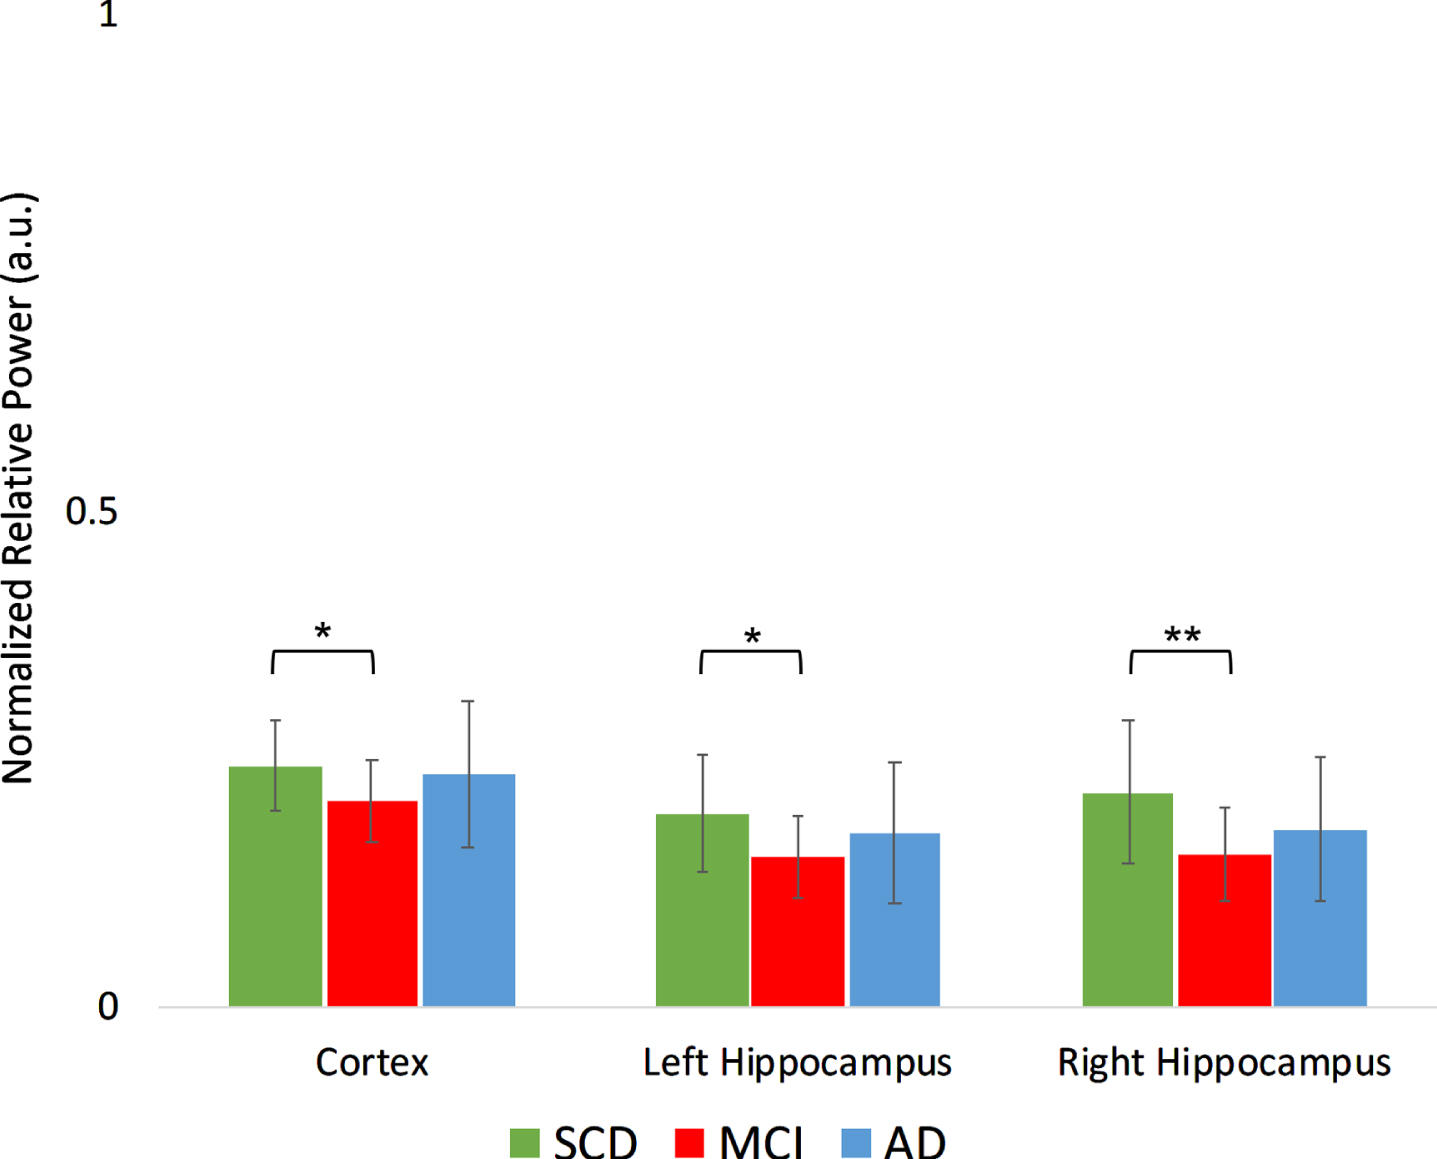
For the absolute power ANOVA (Supplementary Table 2), we found a significant group effect in the theta (F[2,50] = 6.563, p < 0.01) and lower alpha (F[2,50] = 3.652, p < 0.05) band.
Absolute theta power was higher in MCI compared to SCD (t(34) = –3.3, p < 0.01), and in AD compared to SCD (t(34) = 3.7, p < 0.001). Absolute power in the lower alpha band for the MCI group was higher compared to both SCD (t(34) = 2.0, p < 0.05) and to AD (t(34) = 2.9, p < 0.01) (Fig. 2A).
Fig. 2A
Normalized absolute power results per group, averaged over the regions. a.u., arbitrary units. ***indicates significance level p < 0.001. **indicates significance level p < 0.01. *indicates significance level p < 0.05. Error bars indicate 95% confidence interval.
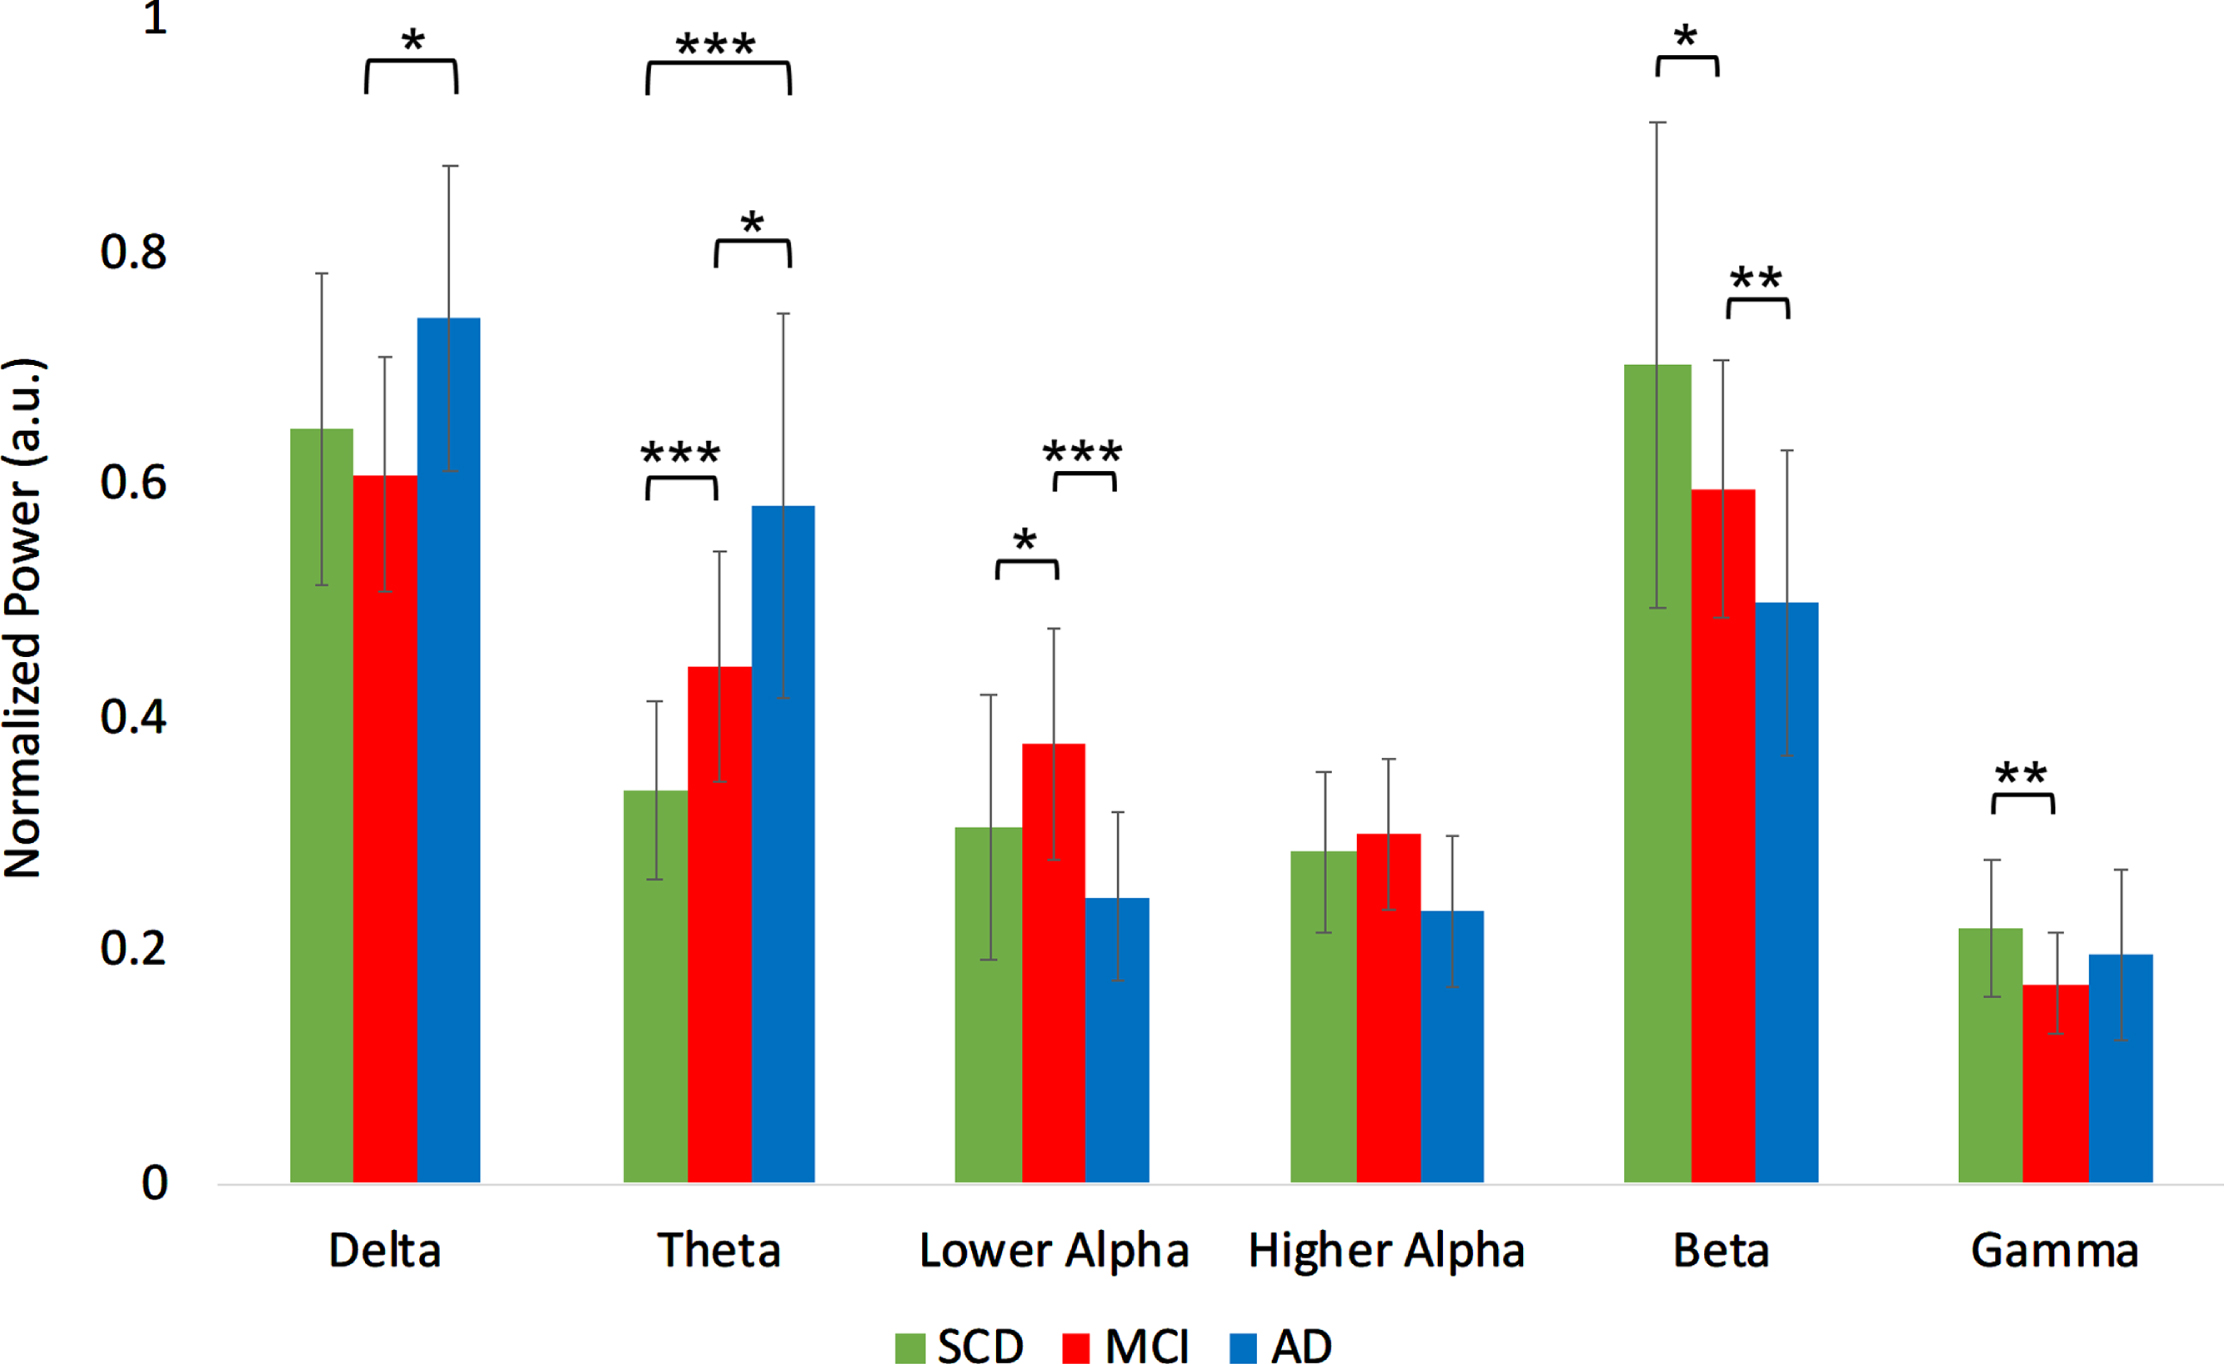
Relative power
For the relative power ANOVA (Supplementary Table 2), we found a significant group effect in the delta ([2,50] = 3.203, p < 0.05), theta (F[2,50] = 15.042, p < 0.001), lower alpha (F[2,50] = 6.739, p < 0.01), beta (F[2,50] = 5.785, p < 0.01), and gamma (F[2,50] = 3.370, p < 0.05) band. Relative delta power was higher in AD compared to MCI (t(34) = 2.65, p < 0.05). Relative theta power was higher in MCI compared to SCD (t(34) = 3.95, p < 0.001), higher in AD compared to MCI (t(34) = 2.24, p < 0.05), and higher in AD compared to SCD (t(34) = 5.10, p < 0.001). Relative power in the lower alpha band was higher in MCI compared to SCD (t(34) = 2.13, p < 0.05), and compared to AD (t(34) = 4.11, p < 0.001). Relative beta power was lower in MCI compared to SCD (t(34) = –2.04, p < 0.05) and lower in AD compared to SCD (t(34) = –2.97, p < 0.01). Relative gamma power was lower in MCI compared to SCD (t(34) = –2.87, p < 0.01) (Fig. 2B).
Fig. 2B
Normalized relative power results per group, averaged over the regions. a.u., arbitrary units. ***indicates significance level p < 0.001. **indicates significance level p < 0.01. *indicates significance level p < 0.05. Error bars indicate 95% confidence interval.
Posterior dominant peak frequency
The SCD (mean 9.75±0.66 Hz) and MCI (mean 9.58±0.53 Hz) groups did not differ significantly in their posterior peak frequency. The AD group (mean 8.47±1.38 Hz) had a lower posterior peak frequency compared to both SCD (t(34) = –3.5, p < 0.01) and MCI (t(34) = –3.2, p < 0.01).
Overall, both absolute and relative power analysis showed similar group differences, confirming the well-established slowing in AD, with intermediate values for the MCI group. However, in the lower alpha band, relative power levels were higher for MCI than for both SCD and AD, while relative gamma power levels were lower than in both other groups. This could indicate a phase of deviating oscillatory behavior in prodromal AD, so next we focused on the hippocampus as a potential site of stronger abnormalities.
Hippocampal oscillatory activity
To ascertain whether the hippocampus actually showed stronger AD-related oscillatory changes than the cortical regions, we directly made this comparison for the different groups. In the absolute power ANOVA, a significant region effect was found for broadband and all individual frequency bands (p < 0.001, except for gamma, where: p < 0.05). A significant group*region interaction was found in the upper alpha band (F[4,102] = 3.197, p < 0.05). In the relative power ANOVA, a significant effect was observed in the theta (F[2,50] = 14.404, p < 0.001), lower alpha (F[2,50] = 18.627, p < 0.001), beta (F[2,50] = 39.593, p < 0.001), and gamma (F[2,50] = 111.395, p < 0.001) band. A significant group*region interaction was found in the higher alpha (F[4,102] = 3.197, p < 0.05) and gamma (F[4,102] = 3.363, p < 0.05) band.
A visual impression of regional spectral power differences can be seen in Fig. 3. In the theta band, relative power is overall higher in MCI compared to SCD, and in AD compared to MCI, showing a gradual increase along the disease progression. The highest values for relative theta power are found in the temporal cortex and the hippocampus, which stand out clearly from the rest of the cortex. In comparison, the visualization of the total power in the three subject groups shows that the highest values are found in the MCI group, demonstrating a non-gradual change along the AD continuum. The highest total power values were found in the posterior cingulum, but hippocampal values were also elevated compared to most of the cortex.
Fig. 3
3D headplots of spectral analysis results across groups. The hippocampus has been projected on the medial surface and is outlined in white. Panels A-C display relative theta power, while panels D-F display total power results. The virtual electrodes were scaled by a factor of one hundred when converting from *.fif to *.asc format. SCD, subjective cognitive decline; MCI, mild cognitive impairment; AD, Alzheimer’s disease.
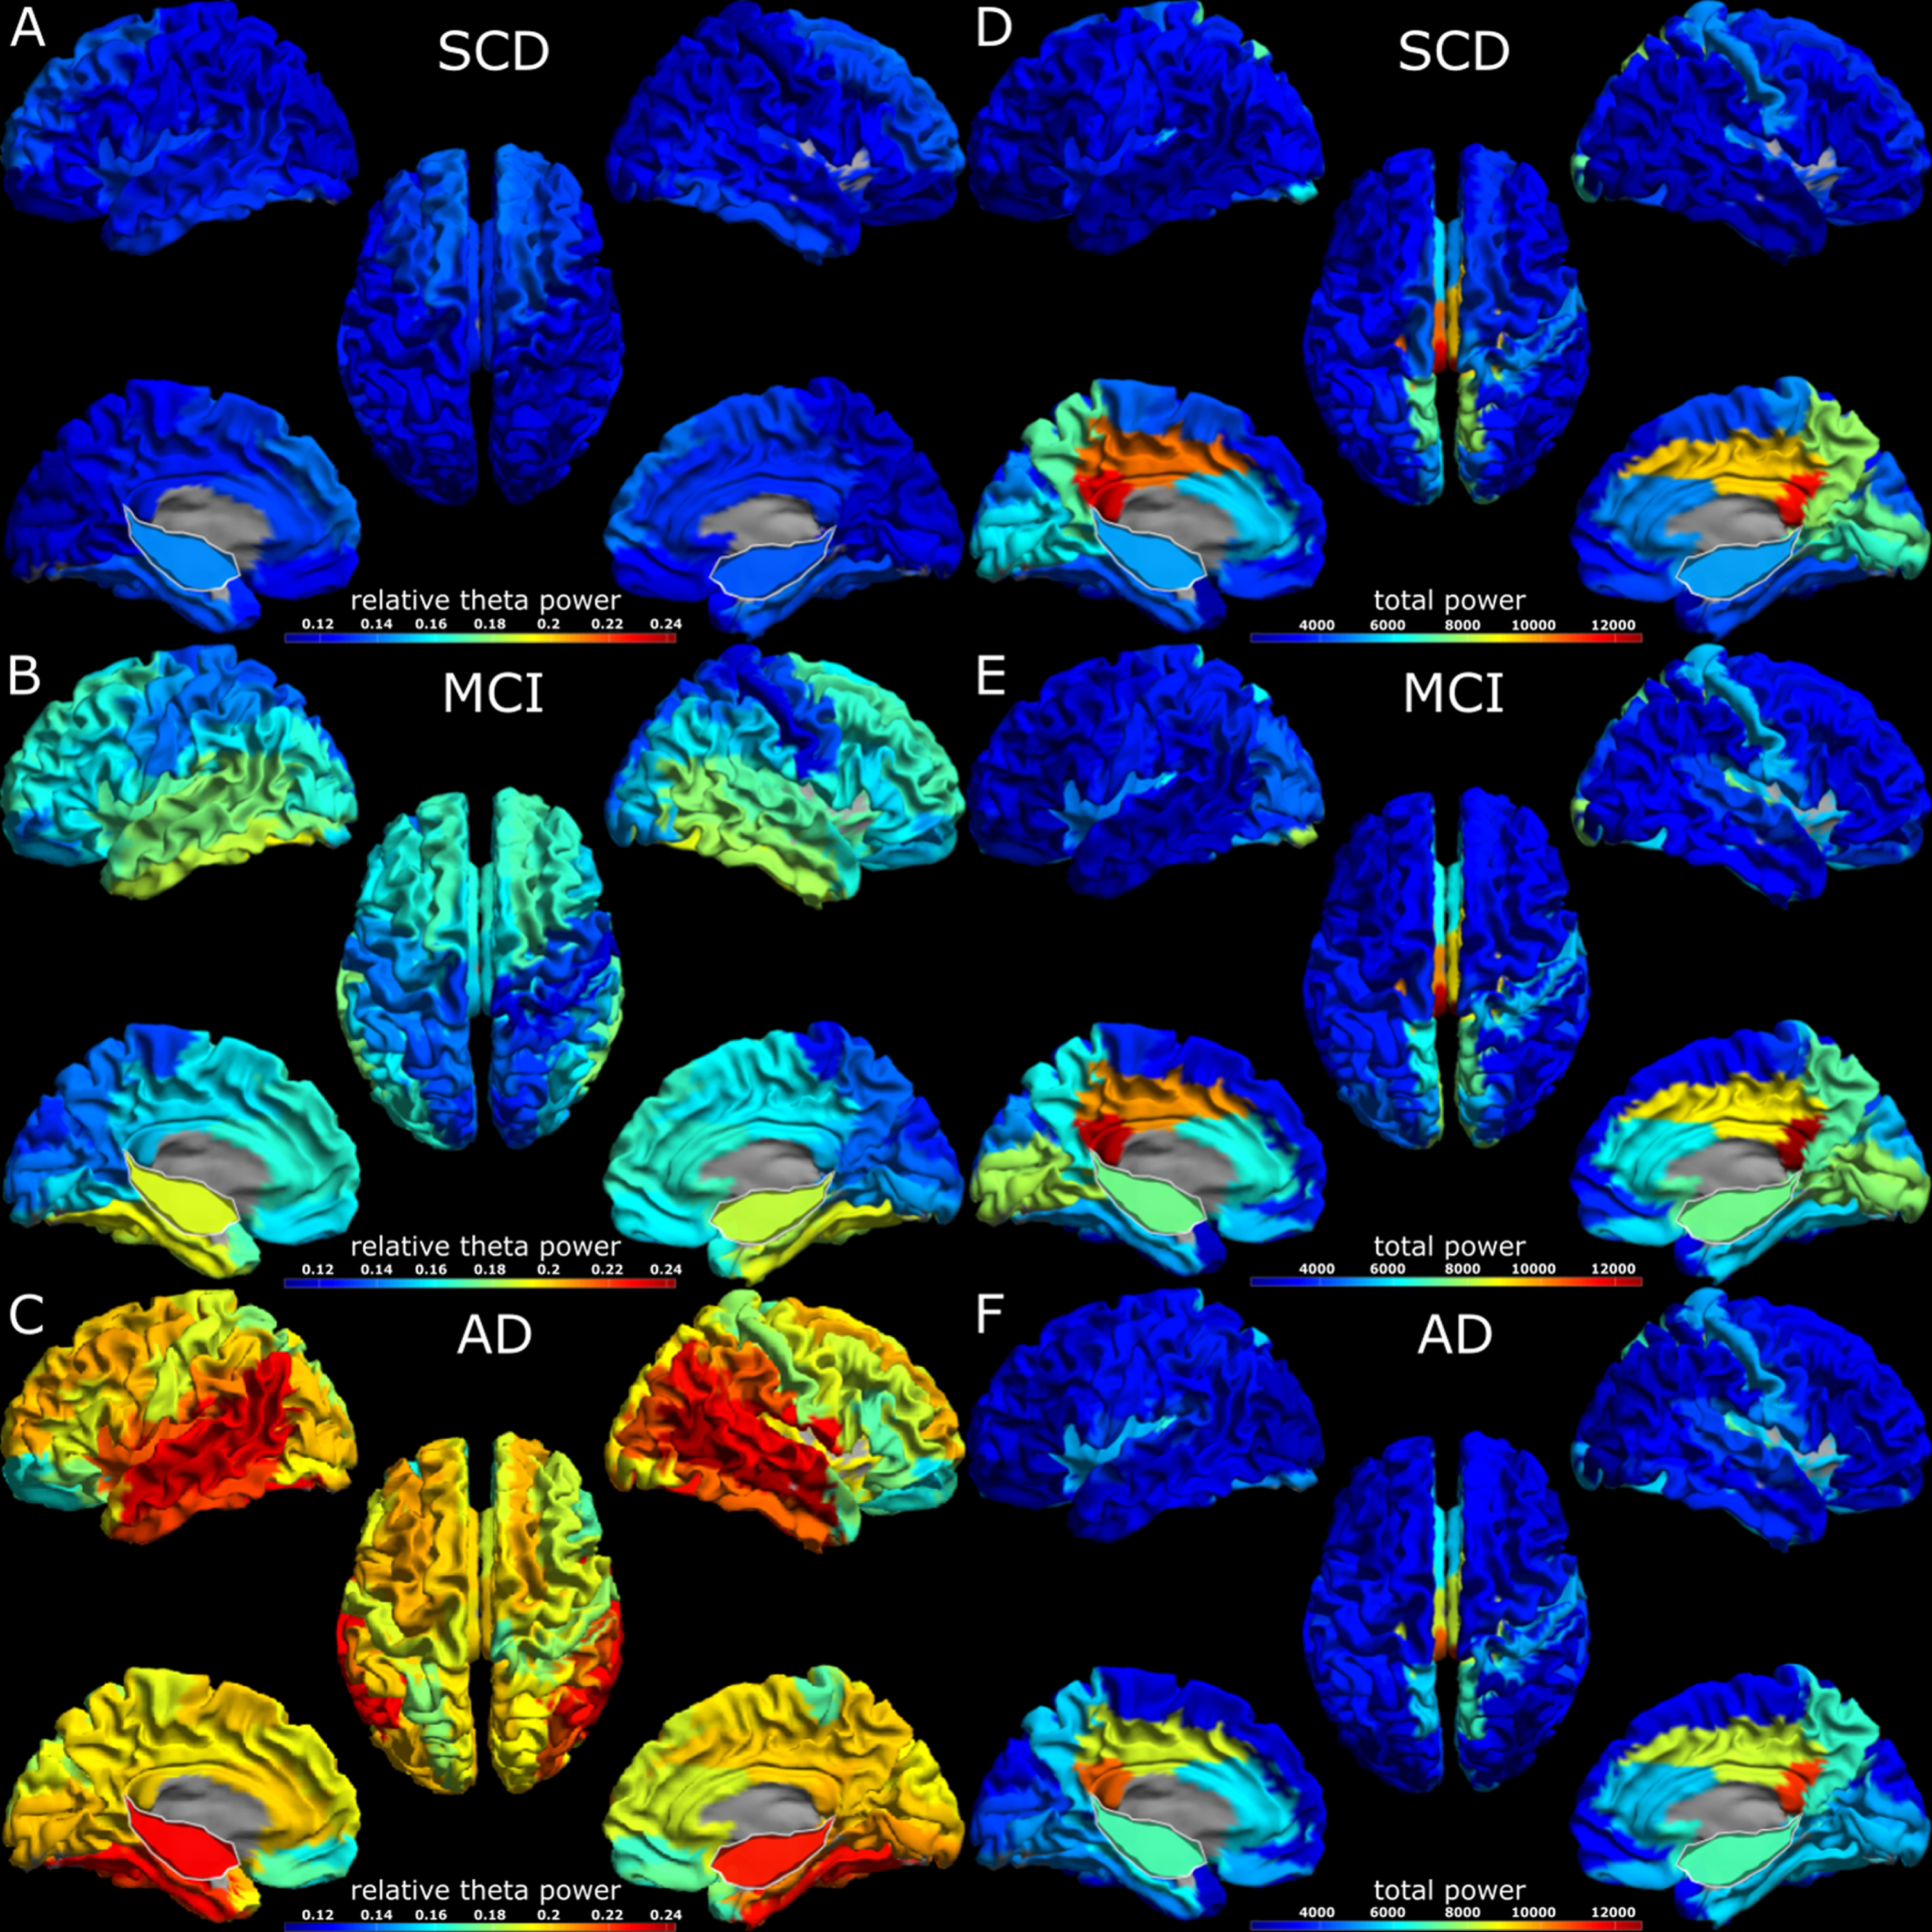
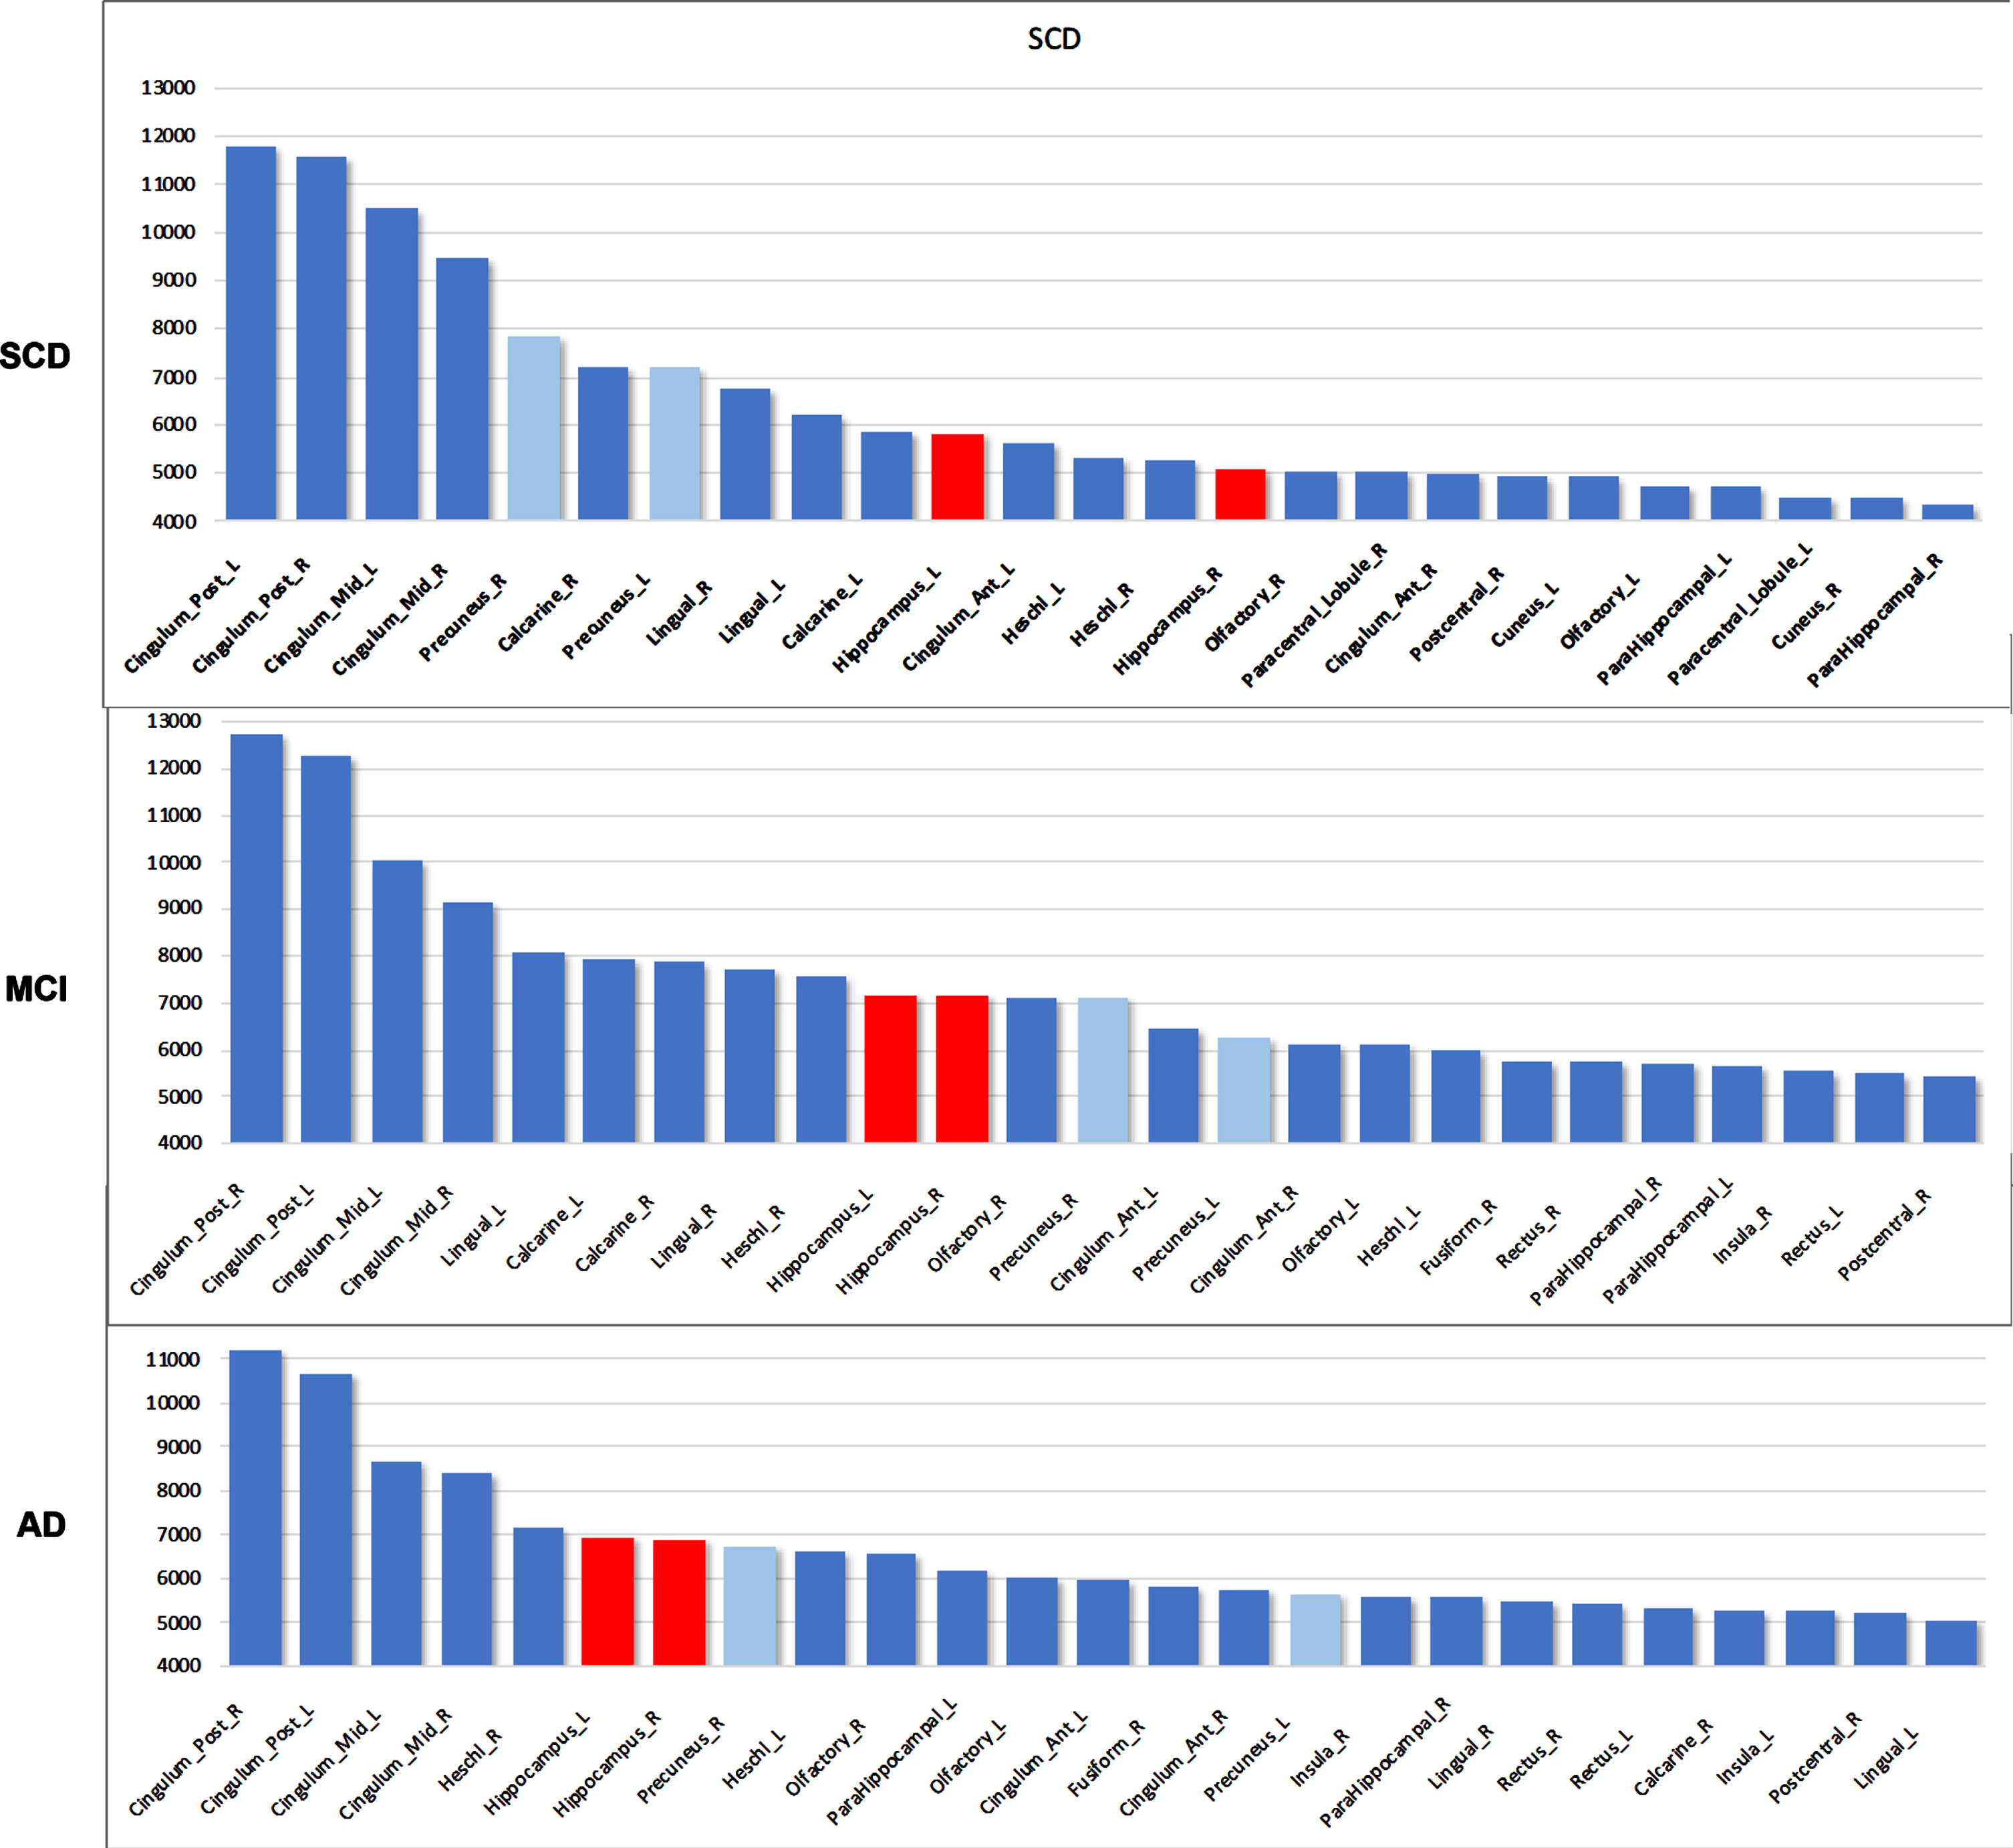
When ranking the top 25 regions based on their total power level for the different groups, diverging trends appear: both hippocampi rise to the top 10 along the AD disease course, with an increase in total power (Fig. 4). In contrast, other regions decreased in ranking, including areas that are known to be affected in AD such as the precuneus and lingual gyrus. Next, we performed quantitative analyses more directly comparing the global cortex and the hippocampi.
Fig. 4
Total power ranking for top 25 AAL regions. Hippocampus (red) rises in rank over the disease course. Precuneal regions (light blue) and lingual gyrus, on the other hand, drop in rank. Y-axis values indicate absolute total power values. SCD, subjective cognitive decline; MCI, mild cognitive impairment; AD, Alzheimer’s disease. Hippocampal regions are colored red, precuneus region is colored light blue. L, left; R, right.
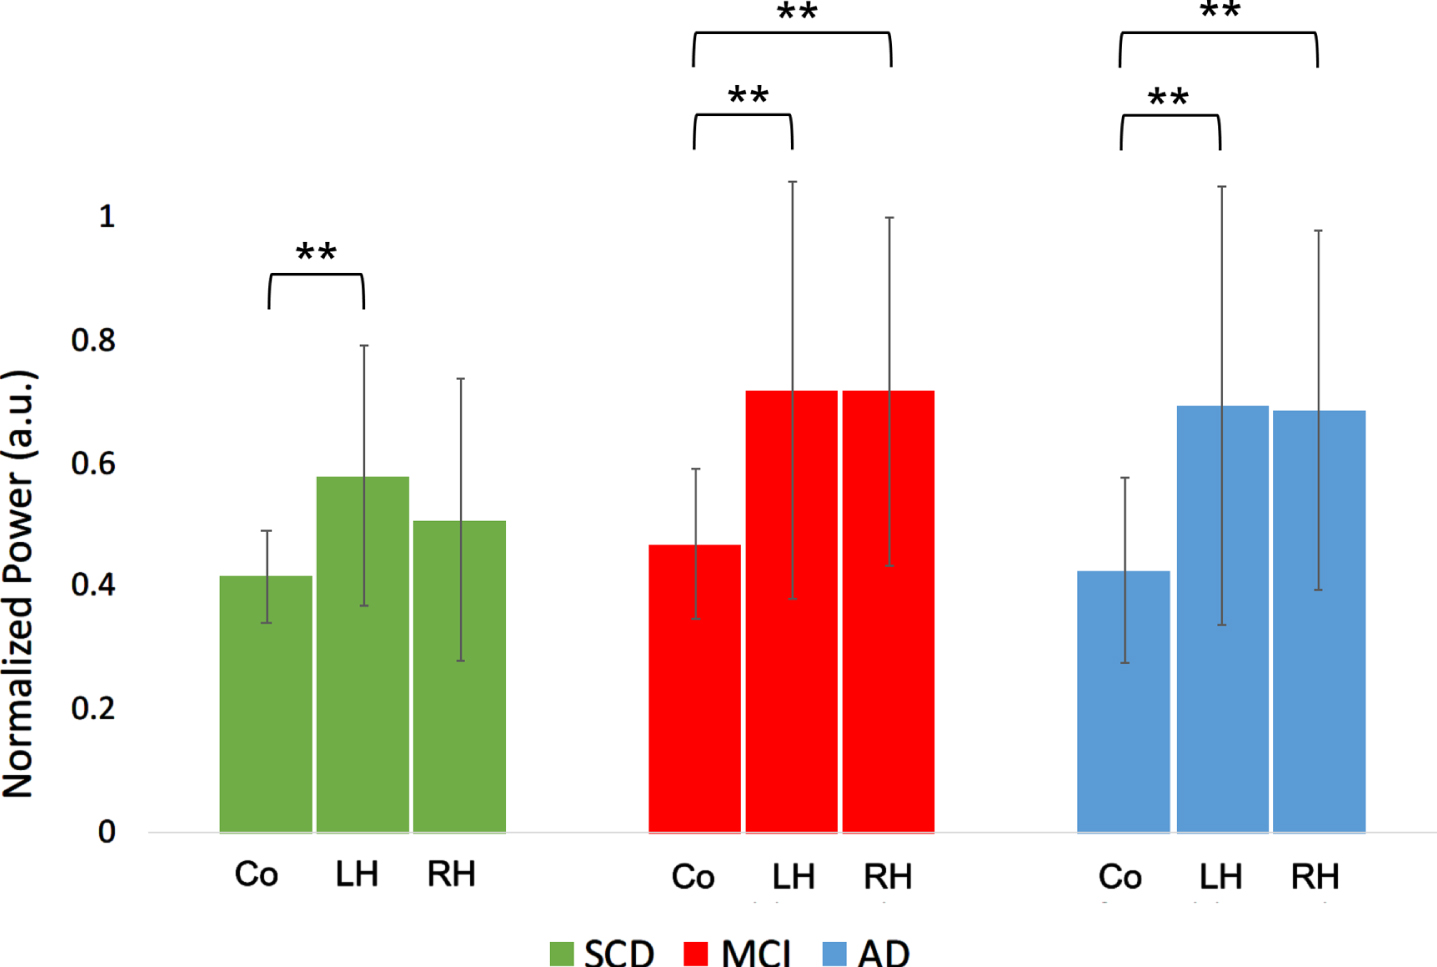
When comparing absolute broadband (0.5–48 Hz) power (“total power”) between the cortex and the hippocampi within groups, hippocampal power was consistently higher than average cortical power in all groups (p < 0.01), except for the right hippocampus in the SCD group (Fig. 5A).
Fig. 5A
Total power comparison between cortex and hippocampi, for the different groups. Co, cortical regions; LH, left hippocampus; RH, right hippocampus; SCD, subjective cognitive decline; MCI, mild cognitive impairment; AD, Alzheimer’s disease. Significance levels indicate t-test results comparing the means of hippocampal values with the cortical means within groups. a.u., arbitrary units. **indicates significance level p < 0.01. Error bars indicate 95% confidence interval.
The upper alpha band showed a significant region*group interaction (Fig. 5B): the MCI group had a higher absolute power in the right hippocampus in MCI compared to SCD (t(34) = 2.4, p < 0.05), as well as higher average cortical power in MCI compared to AD (t(34) = 2.1, p < 0.05).
Fig. 5B
Normalized absolute power results in the higher alpha frequency band (10–13 Hz) per group, for different regions. a.u., arbitrary units. *indicates significance level p < 0.05. Error bars indicate 95% confidence interval.
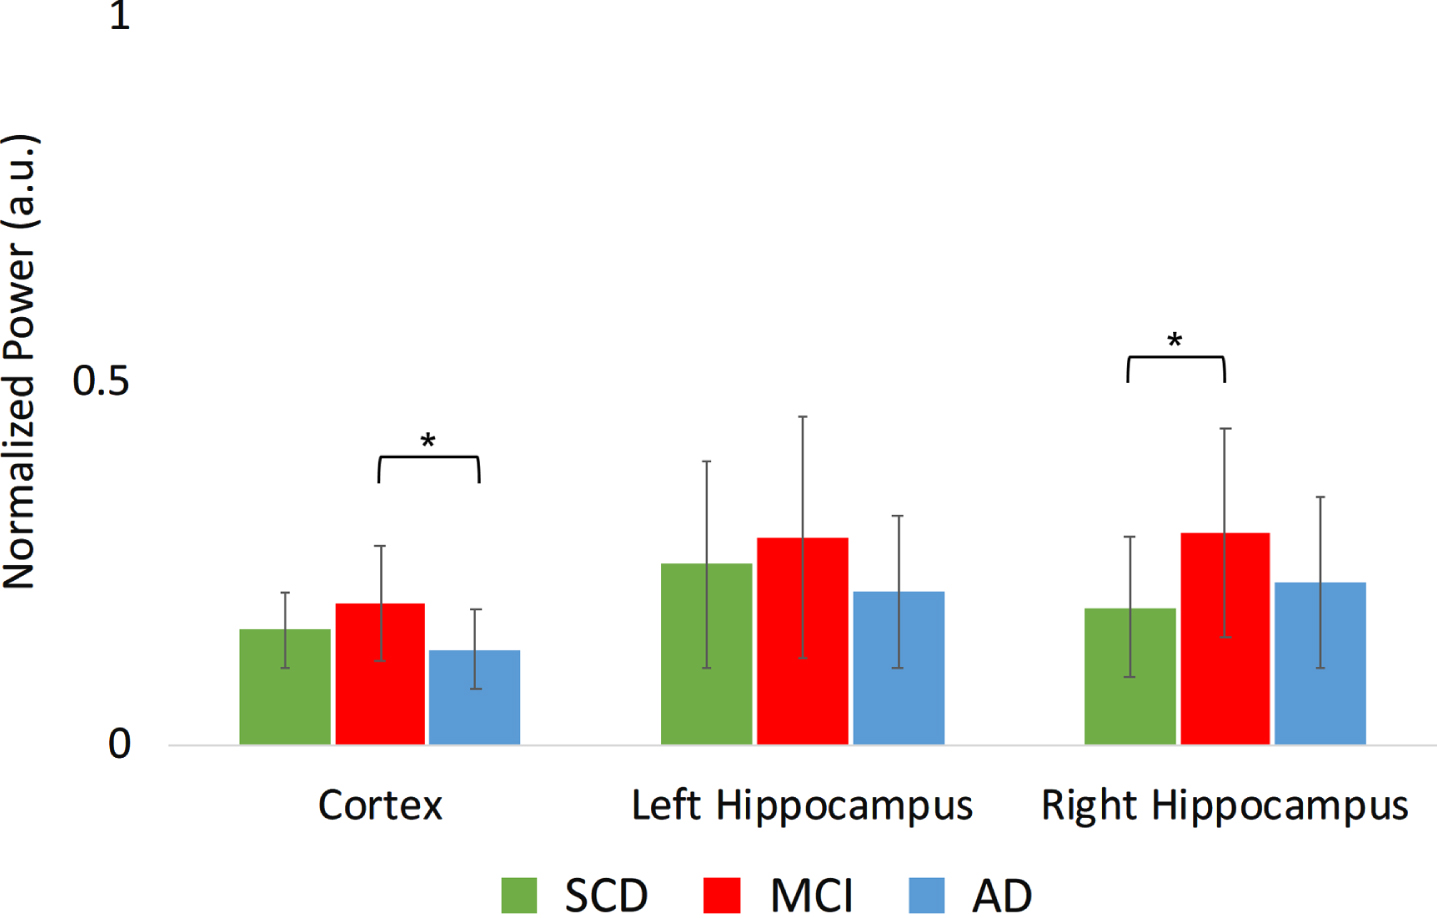
For relative power, two frequency bands show a significant group*region interaction (Fig. 6A, B): in the higher alpha band, the MCI group showed higher relative power in the cortical regions compared to AD (t(34) = 2.60, p < 0.05). In the gamma band, MCI showed lower relative power compared to SCD in the cortical regions (t(34) = –2.43, p < 0.05), left hippocampus (t(34) = –2.68, p < 0.05), and right hippocampus (t(34) = –3.06, p < 0.01).
Fig. 6A
A Normalized relative power results in the higher alpha frequency band (10–13 Hz) per group, for different regions. a.u., arbitrary units. *indicates significance level p < 0.05. Error bars indicate 95% confidence interval.
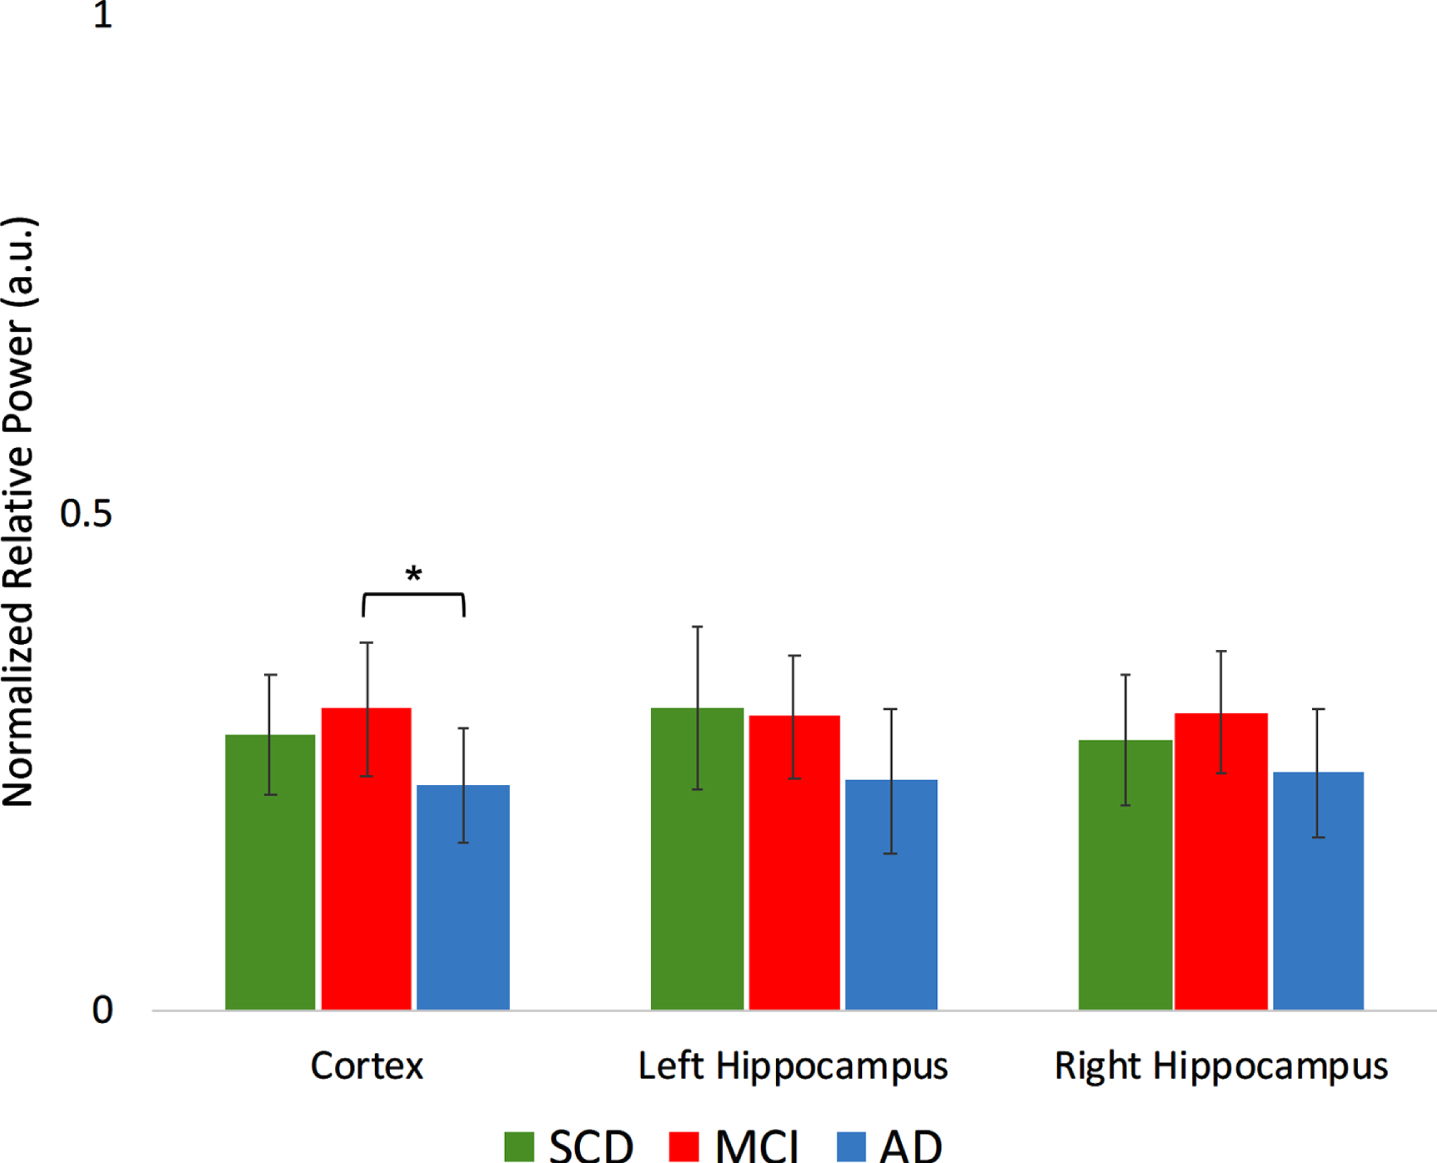
Fig. 6B
Normalized relative power results in the gamma frequency band (30–45 Hz) per group, for different regions. a.u., arbitrary units. **indicates significance level p < 0.01. *indicates significance level p < 0.05. Error bars indicate 95% confidence interval.
Summarizing, these regional analyses indicate that the hippocampi have relatively high spectral power levels, that they show more pronounced changes than the cortical regions, and that in the MCI phase, they do not follow the trend of demonstrating intermediate power values between SCD and AD, most evident on the right side. These findings led us to subsequently investigate the discriminatory power of global cortical and hippocampal power values at an individual level.
Classification accuracy
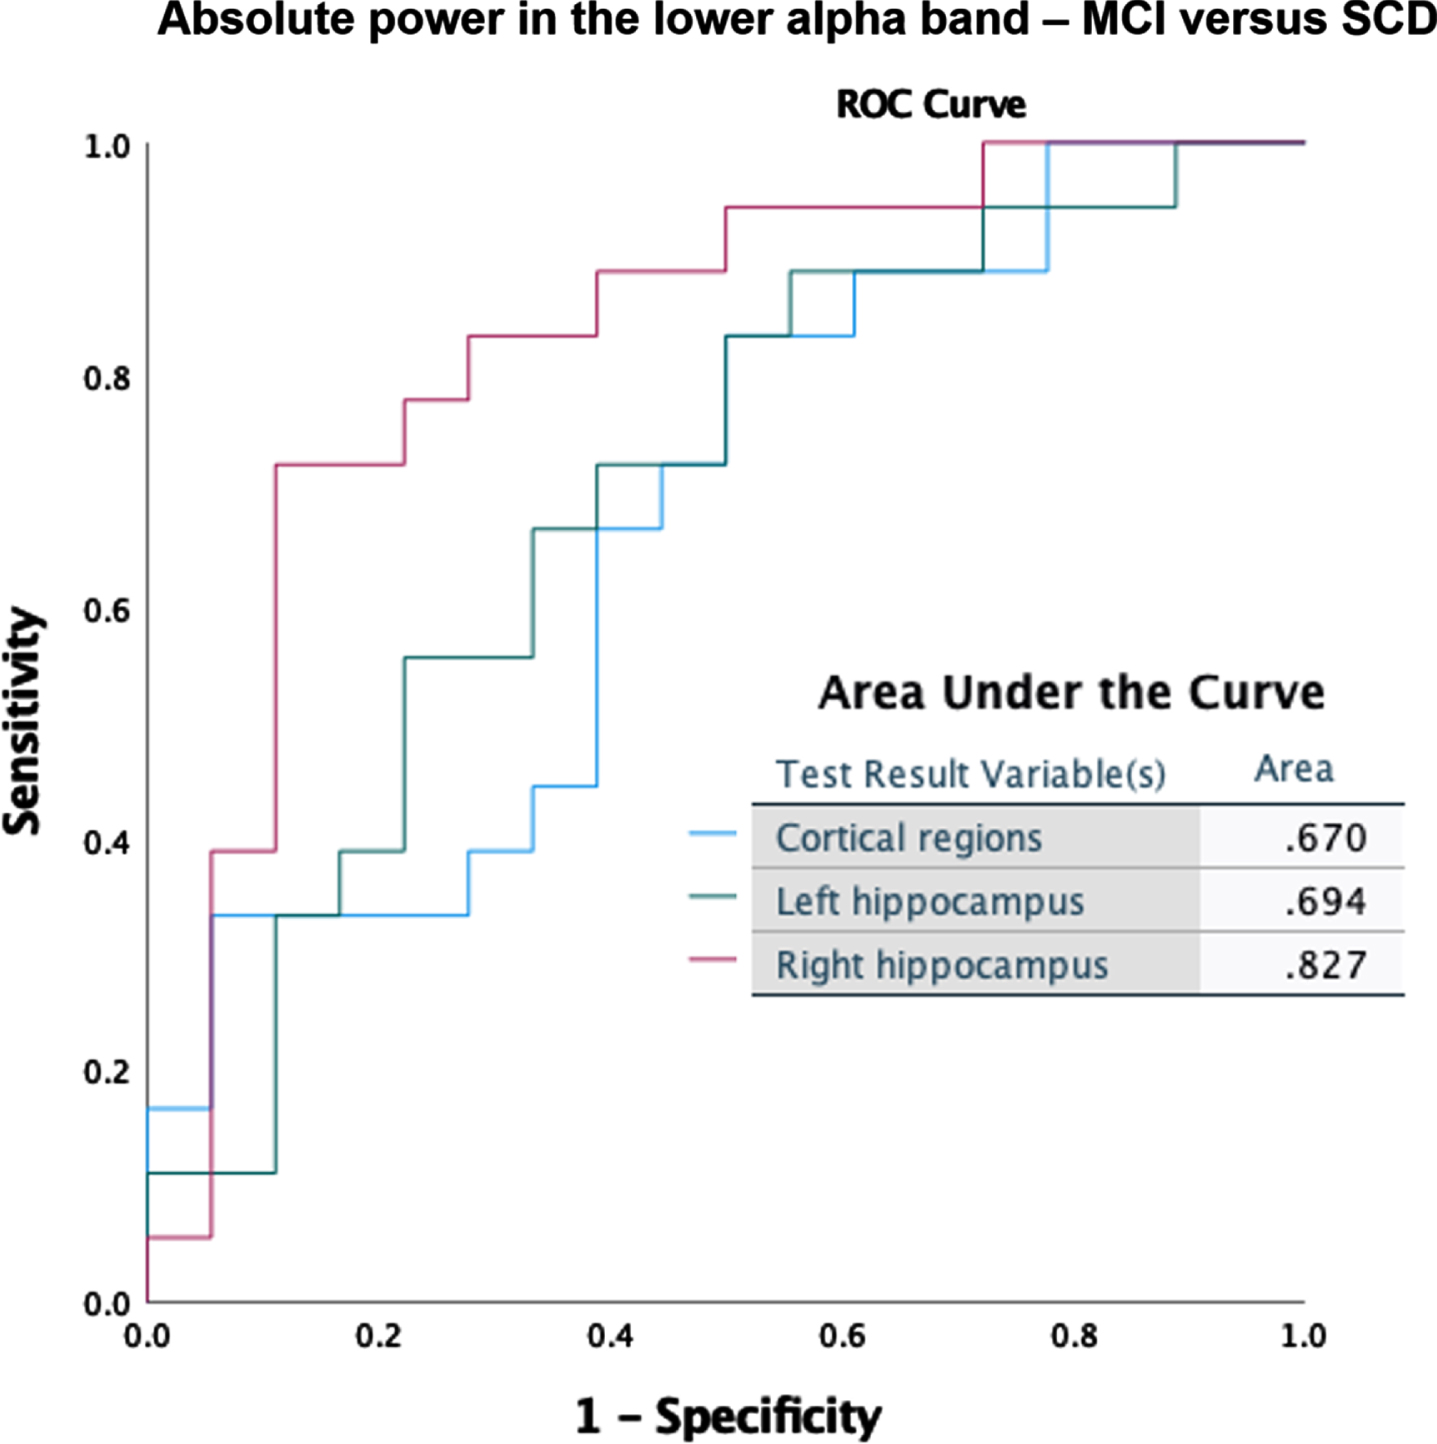
Classification accuracy was tested for the global cortical and hippocampal (left and right separately) absolute and relative power results. Here we show the best scoring measures for discrimination between MCI and SCD. Absolute right hippocampal theta power produced the best classification (Fig. 7A), with a substantially better score (AUC = 0.87) than for the cortical regions (AUC = 0.77) or the left hippocampus (AUC = 0.74). Absolute power in the lower alpha band (Fig. 7B) also showed superior classification for the right hippocampus (AUC = 0.83) compared to the cortical regions (AUC = 0.67) and left hippocampus (AUC = 0.70).
Fig. 7A
ROC curves for discrimination between MCI and SCD, based on absolute power in the theta band (4–8 Hz).
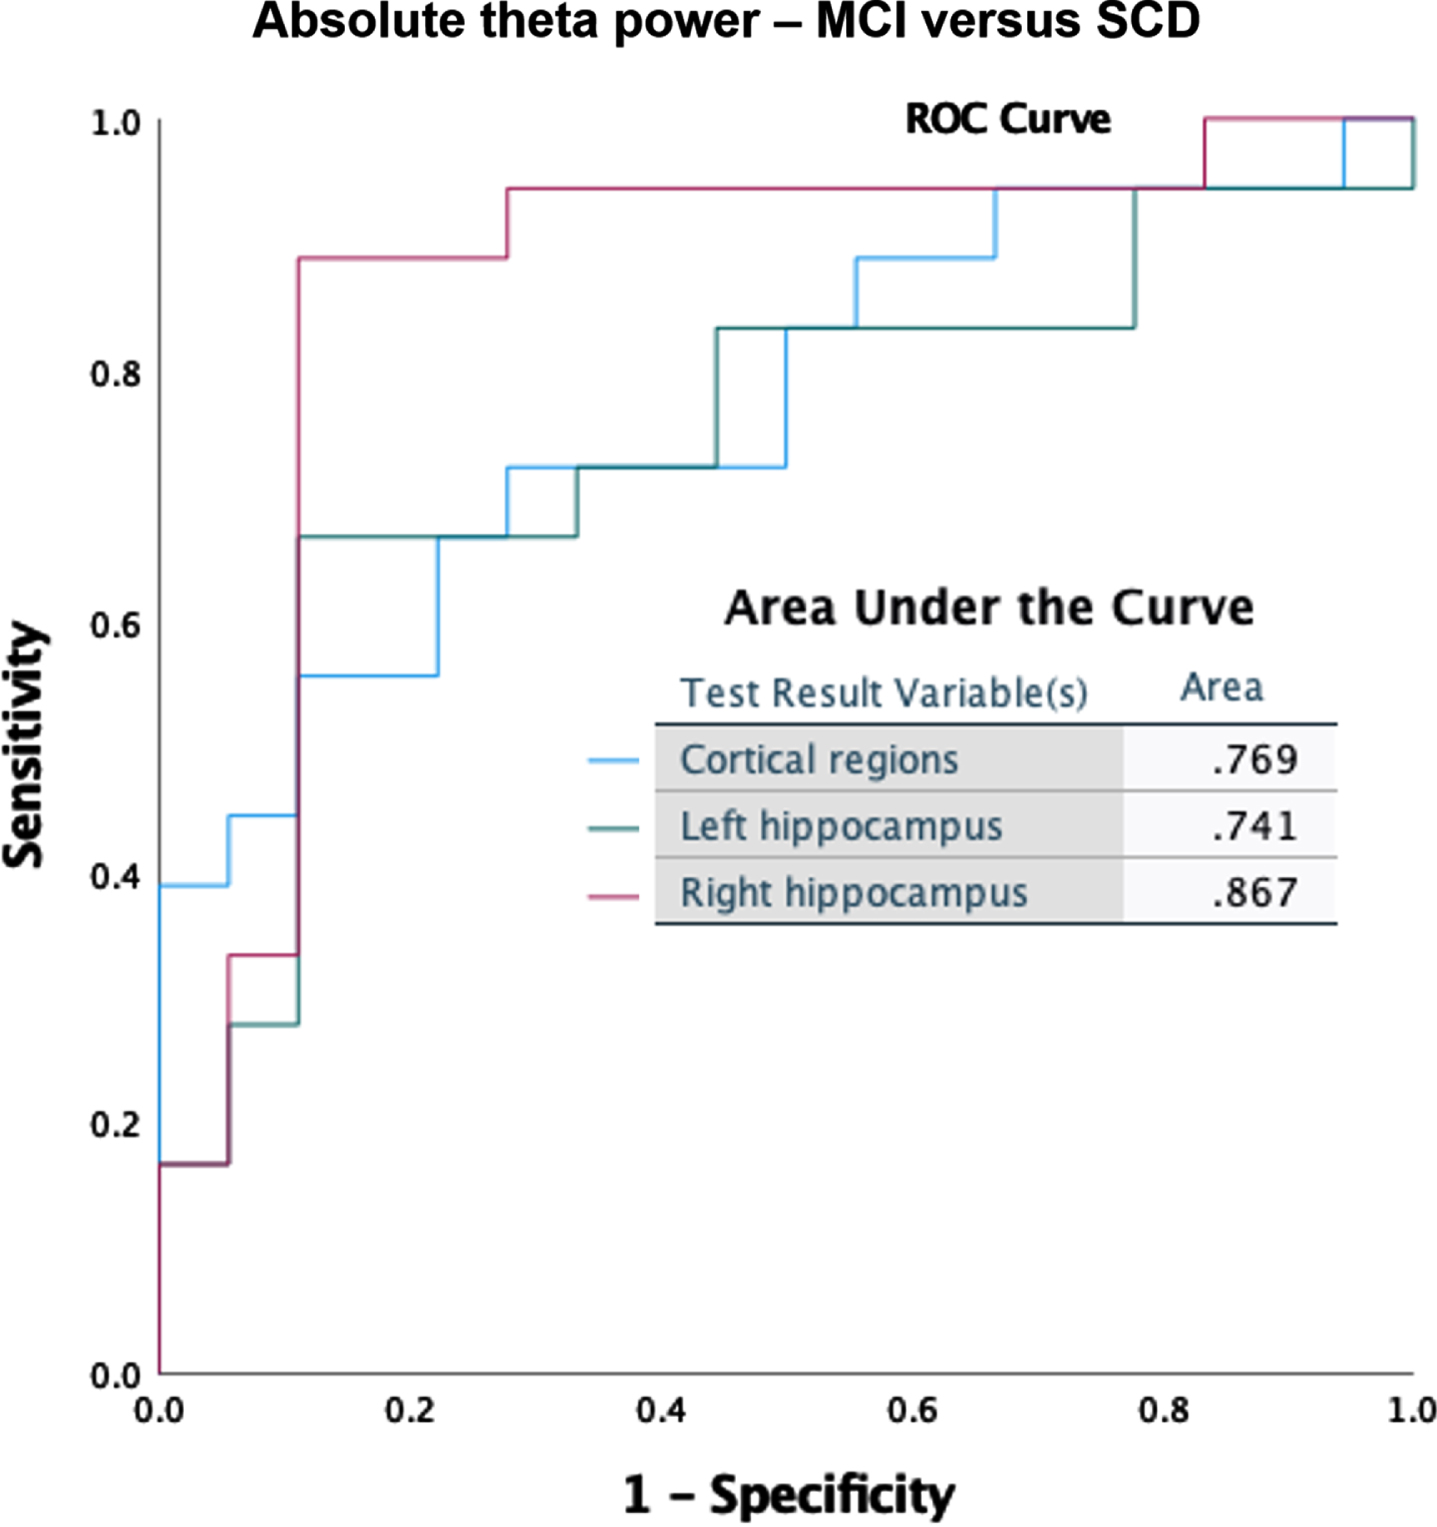
Fig. 7B
ROC curves for classification between MCI and SCD, based on absolute power in the lower alpha band (8–10 Hz).
In the Supplementary Material, we show two more ROC curves (Supplementary Figures 1 and 2): relative theta power classification of MCI versus SCD, where cortical regions (AUC = 0.83) performed slightly better than the hippocampi (AUC = 0.80), and relative power in the lower alpha band for MCI versus AD, where cortical regions and hippocampi performed equally well in terms of classification accuracy (AUC 0.81). In all other frequency bands for both relative and absolute power (both MCI versus SCD and MCI versus AD), AUC scores were below 0.80, but the right hippocampus consistently outperformed the global cortical average and left hippocampus (not shown).
In summary, classification results suggest that taking into account hippocampal power can enhance the discriminatory accuracy of resting-state MEG data in early AD.
DISCUSSION
In this study, we were able to detect signs of altered hippocampal oscillatory activity in source-space resting-state MEG data of amyloid-β-positive amnestic MCI patients (also known as prodromal AD or ‘MCI due to AD’). Our main finding is that hippocampal activity in this phase largely follows the well-established pattern of oscillatory slowing, but that there are notable high spectral power levels in the alpha range, particularly in the hippocampus. Below, we discuss the relevance of these observations.
Abnormal hippocampal activity in prodromal AD
Relative and absolute power differences between MCI and SCD were found in all frequency bands, largely in line with neurophysiological literature in AD. As expected, in the cortical and hippocampal power spectra (Fig. 1A, B), we see higher levels of low frequency (delta and theta) power in AD, with MCI showing intermediate values. This is confirmed in the frequency-band specific analysis, with both absolute and relative theta power increases in MCI, and relative beta and gamma power decreases as well (Figs. 2 and 3), leading to an overall picture of generalized slowing.
A reduction in the peak frequency of the posterior dominant rhythm is a well-known characteristic of AD, and this was reproduced in our study, with the posterior peak frequency being lower in AD compared to SCD and MCI. The MCI group, however, did not exhibit a significantly lower posterior peak frequency compared to SCD. This indicates that these prodromal AD patients were likely in a relatively early phase of the trajectory towards dementia.
Besides expected changes, a deviating pattern could also be discerned: that of spectral power enhancement in the MCI group in the alpha range (8–13 Hz). The higher alpha power (relative and absolute) values in MCI compared to SCD and AD were seen in many cortical regions but were most pronounced in the hippocampus. This unexpected phenomenon is unlikely to result from oscillatory slowing alone: in that case, MCI would have lower absolute and relative alpha power values than SCD, similar to the AD group. Another argument for hippocampus-specific change in MCI comes from the comparison between hippocampus and cortical regions within subjects, where total power was higher in both hippocampi compared to cortical levels in MCI, but only in the left hippocampus in SCD. We also ranked the regions with the highest total power for the different groups, which indicated that cortical regions surrounding the hippocampus are not necessarily the ones with high—or substantially changing—power levels (Figs. 3 and 4). The highest-ranking regions in all groups were the left and right posterior cingulum, which is in line with precious literature and their status as high degree hub regions [48]. A second observation is that the hippocampal rank rises over the disease course, while most other regions (including the early affected precuneus) show a drop—both in absolute power and in rank. This raises the question whether a ‘spatial ratio’ between for instance the precuneus and hippocampus power levels could be an indication of disease severity.
A deviating pattern for the hippocampus was not reported in previous source-space MEG studies. Engels et al. [28] found oscillatory slowing in in all subregions of the hippocampus, but their study investigated AD patients in the later dementia stage. Lopez-Sanz et al. described a decrease in hippocampal peak frequency in the MCI group [30]. However, the study had several methodological differences compared to ours: MCI patients were not necessarily of the amnestic type, and amyloid-β biomarkers were not considered, making underlying AD pathology less certain. Also, there was no direct comparison of the hippocampi with other regions, and as MCI patients were on average±10 years older than in our group, age-related oscillatory slowing might have played a larger role. Hughes et al. reported relative power increases of slower frequencies and decreases of faster frequencies in many regions including the hippocampal areas in MCI [31]. While group size was larger (n = 165), no biomarker or neuropsychological profiles for MCI patients were reported, and no direct comparison between hippocampus and other regions was performed. In the study of Nakamura et al., MCI patients were on average±10 years older, but did have PiB-PET amyloid-β biomarker confirmation [32]. Interestingly, the amyloid-β-positive individuals (both cognitively normal and MCI) showed an alpha power increase compared to amyloid-β-negative individuals, suggesting a link between AD-pathology and alpha increase. This was however not specific for the hippocampi, but rather medial prefrontal areas. An added value of this study, that might also explain a few of the discrepancies with the studies above, is the strict inclusion of amnestic MCI patients, who were amyloid-β biomarker-confirmed, and underwent long term-clinical follow-up in a tertiary memory clinic, obtaining as much certainty as possible about them being on a trajectory towards AD dementia. Furthermore, the younger age-range and our specific source-space reconstruction methodology might explain the observed differences.
Group classification accuracy
Given our relatively modest cohort size, it is noteworthy that we were still able to find changes in (hippocampal) oscillatory activity capable of distinguishing MCI from SCD on an individual level. We achieved a fair accuracy for classifying between MCI and SCD using the absolute theta power of the right hippocampus (Fig. 7A). The solid performance of the theta band in our classification was not surprising, given that an increased power in the theta band is a well-documented early feature of AD [36, 49]. For the right hippocampus, good AUC values (> 0.8) were also obtained for other frequency bands, such as the absolute power in the lower alpha band (Fig. 7B), and relative power in the theta band (Supplementary Figure 1). The high accuracy for the right hippocampus compared to other regions is notable. When discriminating between MCI and AD, the relative lower alpha band produced best results for all regions equally (AUC = 0.81) (Supplementary Figure 2), adding more weight to the notion of a spectral profile deviation in MCI patients on the path from SCD towards AD. Although not our primary objective, these results indicate hippocampal MEG biomarker potential. Note that any reliable non-invasive marker of early AD can have considerable clinical value, for example for patient-friendly early diagnosis and efficient trial recruitment. The specificity of our findings for AD continuum remains to be tested, for example by comparing MCI with dementia with Lewy bodies.
High spectral power: a sign of underlying neuronal hyperactivity?
What could be the significance of the elevated hippocampal spectral power in the amyloid-β positive MCI/prodromal AD group? We speculated whether the abnormal hippocampal power profile might be a representation of the underlying pathological hyperactivity, as reported in recent literature. In the past years, hippocampal neuronal hyperactivity has emerged as a consistent early feature of AD in animal models (AD) [7, 50, 51]. Amyloid-β-related toxicity is the main driver of hippocampal hyperactivity, acting through various mechanisms of synaptic and cellular damage such as glutamate dysregulation [6, 52] and interneuron dysfunction [53–55], while other aspects such as APOE4 carrier status may also play a role [56]. Intriguingly, both in AD animal models and humans in the prodromal stage of AD, reduction of hippocampal hyperactivity with low dose levetiracetam, an antiepileptic drug, has been associated with memory improvement [57, 58]. This finding supports the suggested pathologic nature of hyperactivity and its relationship with cognitive performance, and also implicates reversibility, relevant for therapeutic strategies. In addition, neuronal hyperactivity has been shown to regulate both amyloid-β and tau deposition rates in animal studies, adding weight to the notion that it might not just be a downstream effect, but in fact a more central component of the disease mechanism [59–61]. Given these findings, early detection of hippocampal neuronal hyperactivity may be of substantial interest for diagnostic and therapeutic purposes.
Currently, however, a practical, non-invasive method to directly detect neuronal hyperactivity at the cellular level in patients is lacking. It is important to realize that the considerable scale difference between neuronal spiking and oscillatory behavior of macroscale neural regions renders a simple one-to-one relationship between cellular recordings and the EEG/MEG signal unlikely [35]. Therefore, the macroscale signature of (hippocampal) neuronal hyperactivity is hard to predict or validate without some kind of translational approach. Unfortunately, simultaneous, multiscale data acquisition in early AD in humans is technically and ethically very challenging. Here, computational modeling may provide a powerful ‘next-best’ alternative [8, 62]. Recent multiscale modeling studies suggest that various scenarios of AD-induced neuronal hyperexcitability in fact demonstrate higher neuronal firing rates along with both large-scale oscillatory slowing and increase in total power [63–65]. For this reason, we have opted to also include absolute power analysis in this study, and our MCI findings seem compatible with the modeled neuronal hyperactivity scenarios.
In recent literature, increases in oscillatory activity have also frequently been interpreted as a compensatory mechanism with a possible link to cognitive and neural reserve [66, 67]. Although a functional reconfiguration in response to damage is certainly expected from the brain, in our opinion there is no specific reason why an increase would be more likely to represent compensation. In fact, there are several reasons to expect otherwise: first, from the cellular perspective, neuronal disinhibition is a common reaction to pathology since maintaining the membrane potential requires energy, and when this breaks down depolarization (and hyperexcitability) follows [68]. In other words, hyperactivity/-excitability is likely to be pathological, not compensatory, at the cellular level. Second, in neuronal circuits where excitation/inhibition balance is important to maintain the required flexibility to respond to inputs, and where adaptive phase synchronization is needed for neuronal communication, an increase in firing rate is not necessarily a good thing [8]. The hypothesis of recruitment of silent synapses/neurons is made less likely by the tendency of the energy-hungry brain to discard unused synapses/neurons. Moreover, recruitment of more cells does not automatically lead to higher oscillatory power. There are, however, additional possibilities, such as the potential of compensatory activity to rewire the synaptic connections between neurons in order to account for lost connections. Finally, as increases in oscillatory activity have been related to both cognitive improvement and deterioration, it is not simply a matter of “the more power, the better” [32, 58, 69, 70]. Therefore, the question whether macroscopic increases in oscillatory power are beneficial or pathological, or both, remains as of yet unresolved.
Benefits of hippocampal MEG
EEG-related changes are increasingly being used as outcome measure in clinical trials in AD, primarily focusing on the well-established slowing by means of cortical theta power increase [49]. This focus on EEG is certainly logical, since EEG systems are far more widely accessible than the sizable and expensive MEG systems. However, it is likely that the technical advantages of MEG are relevant for the detection of the early-stage changes in AD. Source-space MEG is relatively well-suited for capturing abnormal hippocampal oscillatory activity compared to EEG [36]. First, its higher spatiotemporal resolution enables more reliable source reconstruction, and description of deeper structures such as the hippocampus. Secondly, absolute power and gamma frequency band investigation may be more meaningful in MEG than EEG due to its cleaner signal [27]. With these considerations and our present findings in mind, further development of hippocampal MEG-based early AD markers is warranted.
Study limitations and future directions
Some of the choices regarding how the study was conducted may have had unintended influences on the research. One of these factors is the relatively modest sample size (n = 18 per group). Regardless, we believe that this limitation is alleviated by the fact that our groups were well-defined and matched for age and gender. Not only did we have CSF (and often PET) amyloid-β and tau biomarkers for the MCI and AD groups, but we also had at least 3-year clinical follow-up records for the patients.
In the current study, our resolution of the hippocampus itself was limited to a single virtual electrode. As such, we were unable to investigate any possible subregional differences in the hippocampi themselves. In a previous source-space MEG study by Engels et al. [28] of hippocampal oscillatory patterns in 27 AD patients, hippocampal activity was assessed in three sub-regions, but the oscillatory slowing that was found was similar for all of them. It could, however, be the case that in our MCI group we may have missed a potential difference in oscillatory behavior among sub-regions, since antero-posterior gradients in hippocampal AD pathophysiology over time have been previously described [71]
Additionally, we mainly compared hippocampal to average cortical activity, and not to surrounding mesiotemporal subcortical regions. The evidence for early neurophysiological involvement of the hippocampal regions in AD is, however, very well characterized in recent literature, and our main interest was the contrast with the traditional cortical changes. Activity of surrounding cortical regions was included in the global activity, from which the hippocampal activity differed significantly. Although activity of parahippocampal regions could have averaged out with this approach, that does not diminish the potential value of the hippocampal observations.
Our results have also led to new questions, some of which could provide aims for future research. For example, comparisons between amyloid-β-positive and -negative MCI or SCD patients might enable further identification of AD-specific disturbances of oscillatory activity. Likewise, a comparison of healthy controls and SCD patients at risk for AD (amyloid-β-positive or genetically predisposed) could provide an even earlier look into the neuronal dynamics of dementia, for example confirming that the hippocampal alterations precede the cortical changes. Connectivity analysis might be another worthwhile instrument to detect early hippocampal differences, since it is likely that hippocampal dysfunction will have an effect on the interaction with connected regions. In MCI, various studies have reported altered functional connectivity patterns, notably hypersynchrony, but these studies did not focus on the hippocampus specifically [3, 30, 72–74]. A recent source-space MEG study did show hippocampal decrease in functional connectivity in AD [74]. Besides augmenting our understanding of AD pathophysiology, new measures of altered hippocampal activity could aid in developing stronger prognostic and/or diagnostic markers, since current EEG/MEG-based markers lack specificity [3]. However, larger groups, longitudinal data, multimodal data, and machine-learning based approaches may be required [75]. So far, relatively straightforward measures such as spectral power perform best, so using them to look at specific regions or conditions may be an equally valid approach.
Conclusion
Resting-state MEG is capable of detecting abnormal hippocampal activity in amyloid-β-positive amnestic MCI patients. In this early AD stage there is, against a background development of -expected- diffuse oscillatory slowing, an increase of spectral power in the alpha frequency range compared to healthy controls, which is not confined to, yet remarkably pronounced in the hippocampi. Since hippocampal changes are stronger and more discriminative than cortical changes, further follow-up in adequately powered studies could improve diagnostic marker strength.
ACKNOWLEDGMENTS
Willem de Haan is funded by the ZonMw Memorabel and TOP grants.
Authors’ disclosures available online (https://www.j-alz.com/manuscript-disclosures/21-5464r1).
SUPPLEMENTARY MATERIAL
[1] The supplementary material is available in the electronic version of this article: https://dx.doi.org/10.3233/JAD-215464.
REFERENCES
[1] | Schomer DL , Lopes Da Silva F ((2012) ) Niedermeyer’s electroencephalography: Basic principles, clinical applications, and related fields.. Lippincott Williams & Wilkins. |
[2] | Jeong J ((2004) ) EEG dynamics in patients with Alzheimer’s disease. Clin Neurophysiol 115: , 1490–1505. |
[3] | Rossini PM , Di Iorio R , Vecchio F , Anfossi M , Babiloni C , Bozzali M , Bruni AC , Cappa SF , Escudero J , Fraga FJ , Giannakopoulos P , Guntekin B , Logroscino G , Marra C , Miraglia F , Panza F , Tecchio F , Pascual-Leone A , Dubois B ((2020) ) Early diagnosis of Alzheimer’s disease: The role of biomarkers including advanced EEG signal analysis. Report from the IFCN-sponsored panel of experts. Clin Neurophysiol 131: , 1287–1310. |
[4] | Babiloni C , Blinowska K , Bonanni L , Cichocki A , de Haan W , Del Percio C , Dubois B , Escudero J , Fernández A , Frisoni G , Guntekin B , Hajos M , Hampel H , Ifeachor E , Kilborn K , Kumar S , Johnsen K , Johannsson M , Jeong J , LeBeau F , Lizio R , Lopes da Silva F , Maestú F , McGeown WJ , McKeith I , Vito Moretti D , Nobili F , Olichney J , Onofrj M , Palop JJ , Rowan M , Stocchi F , Struzik ZM , Tanila H , Teipel S , Taylor JP , Weiergräber M , Yener G , Young-Pearse T , Drinkenburg WH , Randall F ((2020) ) What electrophysiology tells us about Alzheimer’s disease: A window into the synchronization and connectivity of brain neurons. Neurobiol Aging 85: , 58–73. |
[5] | Tzimourta KD , Christou V , Tzallas AT , Giannakeas N , Astrakas LG , Angelidis P , Tsalikakis D , Tsipouras MG ((2021) ) Machine learning algorithms and statistical approaches for Alzheimer’s disease analysis based on resting-state EEG recordings: A systematic review. Int J Neural Syst 31: , 2130002. |
[6] | Zott B , Simon MM , Hong W , Unger F , Chen-Engerer HJ , Frosch MP , Sakmann B , Walsh DM , Konnerth A ((2019) ) A vicious cycle of β amyloid–dependent neuronal hyperactivation. Science 365: , 559–565. |
[7] | Palop JJ , Mucke L ((2010) ) Amyloid-β–induced neuronal dysfunction in Alzheimer’s disease: From synapses toward neural networks. Nat Neurosci 13: , 812–818. |
[8] | Maestú F , de Haan W , Busche MA , DeFelipe J ((2021) ) Neuronal excitation/inhibition imbalance: Core element of a translational perspective on Alzheimer pathophysiology. Ageing Res Rev 69: , 101372. |
[9] | D’Amelio M , Rossini PM ((2012) ) Brain excitability and connectivity of neuronal assemblies in Alzheimer’s disease: From animal models to human findings. Prog Neurobiol 99: , 42–60. |
[10] | Stam CJ ((2014) ) Modern network science of neurological disorders. Nat Rev Neurosci 15: , 683–695. |
[11] | Canter RG , Penney J , Tsai LH ((2016) ) The road to restoring neural circuits for the treatment of Alzheimer’s disease. Nature 539: , 187–196. |
[12] | Busche MA , Konnerth A ((2016) ) Impairments of neural circuit function in Alzheimer’s disease. Philos Trans R Soc Lond B Biol Sci 371: , 20150429. |
[13] | Jones DT , Knopman DS , Gunter JL , Graff-Radford J , Vemuri P , Petersen RC , Weiner MW , Boeve BF , Jack CR Jr ((2016) ) Cascading network failure across the Alzheimer’s disease spectrum. Brain 139: , 547–562. |
[14] | Haberman RP , Branch A , Gallagher M ((2017) ) Targeting neural hyperactivity as a treatment to stem progression of late-onset Alzheimer’s disease. Neurotherapeutics 14: , 662–676. |
[15] | Huijbers W , Mormino EC , Schultz AP , Wigman S , Ward AM , Larvie M , Amariglio RE , Marshall GA , Rentz DM , Johnson KA , Sperling RA ((2015) ) Amyloid-β deposition in mild cognitive impairment is associated with increased hippocampal activity, atrophy and clinical progression. Brain 138: , 1023–1035. |
[16] | Bookheimer SY , Strojwas MH , Cohen MS , Saunders AM , Pericak-Vance MA , Mazziotta JC , Small GW ((2000) ) Patterns of brain activation in people at risk for Alzheimer’s disease. N Engl J Med 343: , 450–456. |
[17] | Filippini N , MacIntosh BJ , Hough MG , Goodwin GM , Frisoni GB , Smith SM , Matthews PM , Beckmann CF , Mackay CE ((2009) ) Distinct patterns of brain activity in young carriers of the APOE-ɛ4 allele. Proc Natl Acad Sci U S A 106: , 7209–7214. |
[18] | Reiman EM , Quiroz YT , Fleisher AS , Chen K , Velez-Pardo C , Jimenez-Del-Rio M , Fagan AM , Shah AR , Alvarez S , Arbelaez A , Giraldo M , Acosta-Baena N , Sperling RA , Dickerson B , Stern CE , Tirado V , Munoz C , Reiman RA , Huentelman MJ , Alexander GE , Langbaum JBS , Kosik K , Tariot PN , Lopera F ((2012) ) Brain imaging and fluid biomarker analysis in young adults at genetic risk for autosomal dominant Alzheimer’s disease in the presenilin 1 E280A kindred: A case-control study. Lancet Neurol 11: , 1048–1056. |
[19] | Yassa MA , Stark SM , Bakker A , Albert MS , Gallagher M , Stark CE ((2010) ) High-resolution structural and functional MRI of hippocampal CA3 and dentate gyrus in patients with amnestic mild cognitive impairment. Neuroimage 51: , 1242–1252. |
[20] | Sperling RA , Dickerson BC , Pihlajamaki M , Vannini P , LaViolette PS , Vitolo OV , Hedden T , Becker JA , Rentz DM , Selkoe DJ , Johnson KA ((2010) ) Functional alterations in memory networks in early Alzheimer’s disease. Neuromolecular Med 12: , 27–43. |
[21] | Hari R , Puce A ((2017) ), MEG-EEG Primer. Oxford University Press. |
[22] | Hillebrand A , Barnes GR ((2005) ) Beamformer analysis of MEG data. Int Rev Neurobiol 68: , 149–171. |
[23] | Hillebrand A , Nissen IA , Ris-Hilgersom I , Sijsma NCG , Ronner HE , van Dijk BW , Stam CJ ((2016) ) Detecting epileptiform activity from deeper brain regions in spatially filtered MEG data. Clin Neurophysiol 127: , 2766–2769. |
[24] | Ruzich E , Crespo-García M , Dalal SS , Schneiderman JF , ((2019) ) Characterizing hippocampal dynamics with MEG: A systematic review and evidence-based guidelines. Human brain mapping 40: , 1353–1375. |
[25] | Pu Y , Cheyne DO , Cornwell BR , Johnson BW ((2018) ) Non-invasive investigation of human hippocampal rhythms using magnetoencephalography: A review. Front Neurosci 12: , 273. |
[26] | Pizzo F , Roehri N , Medina Villalon S , Trébuchon A , Chen S , Lagarde S , Carron R , Gavaret M , Giusiano B , McGonigal A , Bartolomei F , Badier JM , Bénar CG ((2019) ) Deep brain activities can be detected with magnetoencephalography. Nat Commun 10: , 971. |
[27] | Boto E , Holmes N , Leggett J , Roberts G , Shah V , Meyer S , Duque Muñoz L , Mullinger K , Tierney TM , Bestmann S , Barnes GR , Bowtell R , Brookes MJ ((2018) ) Moving magnetoencephalography towards real-world applications with a wearable system. Nature 555: , 657–661. |
[28] | Engels M , Hillebrand A , van der Flier WM , Stam CJ , Scheltens P , van Straaten EC ((2016) ) Slowing of hippocampal activity correlates with cognitive decline in early onset Alzheimer’s disease: An MEG study with virtual electrodes. Front Aging Neurosci 10: , 238. |
[29] | Scheltens P , De Strooper B , Kivipelto M , Holstege H , Chételat G , Teunissen CE , Cummings J , van der Flier WM ((2021) ) Alzheimer’s disease. Lancet 397: , 1577–1590. |
[30] | López-Sanz D , Bruña R , Garcés P , Martín-Buro MC , Walter S , Delgado ML , Montenegro M , López Higes R , Marcos A , Maestú F ((2017) ) Functional connectivity disruption in subjective cognitive decline and mild cognitive impairment: A common pattern of alterations. Front Aging Neurosci 9: , 109. |
[31] | Hughes LE , Henson RN , Pereda E , Bruña R , López-Sanz D , Quinn AJ , Woolrich MW , Nobre AC , Rowe JB , Maestú F ((2019) ) BioFIND Working Group. Biomagnetic biomarkers for dementia: A pilot multicentre study with a recommended methodological framework for magnetoencephalography. Alzheimers Dement (Amst) 11: , 450–462. |
[32] | Nakamura A , Cuesta P , Fernández A , Arahata Y , Iwata K , Kuratsubo I , Bundo M , Hattori H , Sakurai T , Fukuda K , Washimi Y , Endo H , Takeda A , Diers K , Bajo R , Maestú F , Ito K , Kato T ((2018) ) Electromagnetic signatures of the preclinical and prodromal stages of Alzheimer’s disease. Brain 141: , 1470–1485. |
[33] | Cuesta P , Garcés P , Castellanos NP , López ME , Aurtenetxe S , Bajo R , Pineda-Pardo JA , Bruña R , Marín AG , Delgado M , Barabash A , Ancín I , Cabranes JA , Fernandez A , Del Pozo F , Sancho M , Marcos A , Nakamura A , Maestú F ((2015) ) Influence of the APOE ɛ4 allele and mild cognitive impairment diagnosis in the disruption of the MEG resting state functional connectivity in sources space. J Alzheimers Dis 44: , 493–505. |
[34] | Buzsáki G , Anastassiou CA , Koch C ((2012) ) The origin of extracellular fields and currents–EEG, ECoG, LFP and spikes. Nat Rev Neurosci 13: , 407–420. |
[35] | Cohen MX ((2017) ) Where does EEG come from and what does it mean? Trends Neurosci 40: , 208–218. |
[36] | Gouw AA , Hillebrand A , Schoonhoven DN , Demuru M , Ris P , Scheltens P , Stam CJ ((2021) ) Routine magnetoencephalography in memory clinic patients: A machine learning approach. Alzheimers Dement (Amst) 13: , e12227. |
[37] | van der Flier WM , Scheltens P ((2018) ) Amsterdam Dementia Cohort: Performing research to optimize care. J Alzheimers Dis 62: , 1091–1111. |
[38] | Albert MS , DeKosky ST , Dickson D , Dubois B , Feldman HH , Fox NC , Gamst A , Holtzman DM , Jagust WJ , Petersen RC , Snyder PJ , Carrillo MC , Thies B , Phelps CH ((2011) ) The diagnosis of mild cognitive impairment due to Alzheimer’s disease: Recommendations from the National Institute on Aging-Alzheimer’s Association workgroups on diagnostic guidelines for Alzheimer’s disease. Alzheimers Dement 7: , 270–279. |
[39] | McKhann GM , Knopman DS , Chertkow H , Hyman BT , Jack CR Jr , Kawas CH , Klunk WE , Koroshetz WJ , Manly JJ , Mayeux R , Mohs RC , Morris JC , Rossor MN , Scheltens P , Carrillo MC , Thies B , Weintraub S , Phelps CH ((2011) ) The diagnosis of dementia due to Alzheimer’s disease: Recommendations from the National Institute on Aging-Alzheimer’s Association workgroups on diagnostic guidelines for Alzheimer’s disease. Alzheimers Dement 7: , 263–269. |
[40] | Jessen F , Amariglio RE , van Boxtel M , Breteler M , Ceccaldi M , Chételat G , Dubois B , Dufouil C , Ellis KA , van der Flier WM , Glodzik L , van Harten AC , de Leon MJ , McHugh P , Mielke MM , Molinuevo JL , Mosconi L , Osorio RS , Perrotin A , Petersen RC , Rabin L , Rami L , Reisberg B , Rentz D , Sachdev PS , de la Sayette V , Saykin AJ , Scheltens P , Shulman MB , Slavin MJ , Sperling RA , Sterwart R , Uspenskaya O , Bellas B , Visser PJ , Wagner M ((2014) ) Subjective Cognitive Decline Initiative (SCD-I) Working Group. A conceptual framework for research on subjective cognitive decline in preclinical Alzheimer’s disease. Alzheimers Dement 10: , 844–852. |
[41] | Taulu S , Simola J ((2006) ) Spatiotemporal signal space separation method for rejecting nearby interference in MEG measurements. Phys Med Biol 51: , 1759–1768. |
[42] | Taulu S , Hari R ((2009) ) Removal of magnetoencephalographic artifacts with temporal signal-space separation: Demonstration with single-trial auditory-evoked responses. Hum Brain Mapp 30: , 1524–1534. |
[43] | Hillebrand A , Barnes GR , Bosboom JL , Berendse HW , Stam CJ ((2012) ) Frequency-dependent functional connectivity within resting-state networks: An atlas-based MEG beamformer solution. Neuroimage 59: , 3909–3921. |
[44] | Tzourio-Mazoyer N , Landeau B , Papathanassiou D , Crivello F , Etard O , Delcroix N , Mazoyer B , Joliot M ((2012) ) Automated anatomical labeling of activations in SPM using a macroscopic anatomical parcellation of the MNI MRI single-subject brain. Neuroimage 15: , 273–289. |
[45] | Hillebrand A , Tewarie P , Van Dellen E , Yu M , Carbo EW , Douw L , Gouw A , van Straaten ECW , Stam CJ ((2016) ) Direction of information flow in large-scale resting-state networks is frequency-dependent. Proc Natl Acad Sci U S A 113: , 3867–3872. |
[46] | Sekihara K , Nagarajan SS , Poeppel D , Marantz A ((2004) ) Asymptotic SNR of scalar and vector minimum-variance beamformers for neuromagnetic source reconstruction. IEEE Trans Biomed Eng 51: , 1726–1734. |
[47] | Cheyne D , Bostan AC , Gaetz W , PangEW ((2007) ) Event-related beamforming: A robust method for presurgical functional mapping using MEG. Clin Neurophysiol 118: , 1691–1704. |
[48] | Yao Z , Zhang Y , Lin L , Zhou Y , Xu C , Jiang T ; Alzheimer’s Disease Neuroimaging Initiative ((2010) ) Abnormal cortical networks in mild cognitive impairment and Alzheimer’s disease. PLoS Comput Biol 6: , e1001006. |
[49] | Gouw AA , Alsema AM , Tijms BM , Borta A , Scheltens P , Stam CJ , van der Flier WM ((2017) ) EEG spectral analysis as a putative early prognostic biomarker in nondemented, amyloid positive subjects. Neurobiol Aging 57: , 133–142. |
[50] | Busche MA , Konnerth A ((2015) ) Neuronal hyperactivity–A key defect in Alzheimer’s disease? Bioessays 37: , 624–632. |
[51] | Stargardt A , Swaab DF , Bossers K ((2015) ) The storm before the quiet: Neuronal hyperactivity and Aβ in the presymptomatic stages of Alzheimer’s disease. Neurobiol Aging 36: , 1–11. |
[52] | Li S , Hong S , Shepardson NE , Walsh DM , Shankar GM , Selkoe D ((2009) ) Soluble oligomers of amyloid β protein facilitate hippocampal long-term depression by disrupting neuronal glutamate uptake. Neuron 62: , 788–801. |
[53] | Verret L , Mann EO , Hang GB , Barth AM , Cobos I , Ho K , Devidze N , Masliah E , Kreitzer AC , Mody I , Mucke L , Palop JJ ((2012) ) Inhibitory interneuron deficit links altered network activity and cognitive dysfunction in Alzheimer model. Cell 149: , 708–721. |
[54] | Palop JJ , Mucke L ((2016) ) Network abnormalities and interneuron dysfunction in Alzheimer disease. Nat Rev Neurosci 17: , 777. |
[55] | Hijazi S , Heistek TS , Scheltens P , Neumann U , Shimshek DR , Mansvelder HD , Smit AB , van Kesteren RE ((2020) ) Early restoration of parvalbumin interneuron activity prevents memory loss and network hyperexcitability in a mouse model of Alzheimer’s disease. Mol Psychiatry 25: , 3380–3398. |
[56] | Nuriel T , Angulo SL , Khan U , Ashok A , Chen Q , Figueroa HY , Emrani S , Liu L , Herman M , Barrett G , Savage V , Buitrago L , Cepeda-Prado E , Fung C , Goldberg E , Gross SS , Hussaini SA , Moreno H , Small SA , Duff KE ((2017) ) Neuronal hyperactivity due to loss of inhibitory tone in APOE4 mice lacking Alzheimer’s disease-like pathology. Nat Commun 8: , 1–14. |
[57] | Sanchez PE , Zhu L , Verret L , Vossel KA , Orr AG , Cirrito JR , Devidze N , Ho K , Yu GQ , Palop JJ , Mucke L ((2012) ) Levetiracetam suppresses neuronal network dysfunction and reverses synaptic and cognitive deficits in an Alzheimer’s disease model. Proc Natl Acad Sci U S A 109: , E2895–E2903. |
[58] | Bakker A , Krauss GL , Albert MS , Speck CL , Jones LR , Stark CE , Yassa MA , Bassett SS , Shelton AL , Gallagher M ((2012) ) Reduction of hippocampal hyperactivity improves cognition in amnestic mild cognitive impairment. Neuron 74: , 467–474. |
[59] | Bero AW , Yan P , Roh JH , Cirrito JR , Stewart FR , Raichle ME , Lee JM , Holtzman DM ((2011) ) Neuronal activity regulates the regional vulnerability to amyloid-β deposition. Nat Neurosci 14: , 750–756. |
[60] | Yamada K , Holth JK , Liao F , Stewart FR , Mahan TE , Jiang H , Cirrito JR , Patel TK , Hochgräfe K , Mandelkow EM , Holtzman DM ((2014) ) Neuronal activity regulates extracellular tau in vivo. J Exp Med 211: , 387–393. |
[61] | Wu JW , Hussaini SA , Bastille IM , Rodriguez GA , Mrejeru A , Rilett K , Sanders DW , Cook C , Fu H , Boonen RA , Herman M , Nahmani E , Emrani S , Figueroa YH , Diamond MI , Clelland CL , Wray S , Duff KE ((2016) ) Neuronal activity enhances tau propagation and tau pathology in vivo. Nat Neurosci 19: , 1085–1092. |
[62] | de Haan W ((2017) ) The virtual trial. Front Neurosci 11: , 110. |
[63] | Zou X , Coyle D , Wong-Lin KF , Maguire L ((2011) ) Computational study of hippocampal-septal theta rhythm changes due to beta-amyloid-altered ionic channels. PLoS One 6: , e21579. |
[64] | Stefanovski L , Triebkorn P , Spiegler A , Diaz-Cortes MA , Solodkin A , Jirsa V , McIntosh AR , Ritter P ; Alzheimer’s Disease Neuroimaging Initiative ((2019) ) Linking molecular pathways and large-scale computational modeling to assess candidate disease mechanisms and pharmacodynamics in Alzheimer’s disease. Front Comput Neurosci 13: , 54. |
[65] | van Nifterick AM , Gouw AA , Scheltens P , Stam CJ , de Haan W ((2020) ) A loss of neuronal inhibition best explains EEG abnormalities in preclinical Alzheimer’s disease: A multiscale computational modeling study. AAIC Poster 16: , e043262. |
[66] | Jacobs HIL , Radua J , Lückmann HC , Sack AT ((2013) ) Meta-analysis of functional network alterations in Alzheimer’s disease: Toward a network biomarker. Neurosci Biobehav Rev 37: , 753–765. |
[67] | Gleichmann M , Chow VW , Mattson MP ((2011) ) Homeostatic disinhibition in the aging brain and Alzheimer’s disease. J Alzheimers Dis 24: , 15–24. |
[68] | Olney JW , Wozniak DF , Farber NB ((1977) ) Excitotoxic neurodegeneration in Alzheimer disease: New hypothesis and new therapeutic strategies. Arch Neurol 54: , 1234–1240. |
[69] | Liang P , Wang Z , Yang Y , Jia X , Li K ((2011) ) Functional disconnection and compensation in mild cognitive impairment: Evidence from DLPFC connectivity using resting-state fMRI. PLoS One 6: , e22153. |
[70] | Gaubert S , Raimondo F , Houot M , Corsi MC , Naccache L , Diego Sitt J , Hermann B , Oudiette D , Gagliardi G , Habert MO , Dubois B , De Vico Fallani F , Bakardjian H , Epelbaum S ; Alzheimer’s Disease Neuroimaging Initiative ((2019) ) EEG evidence of compensatory mechanisms in preclinical Alzheimer’s disease. Brain 142: , 2096–2112. |
[71] | Chan D , Fox NC , Scahill RI , Crum WR , Whitwell JL , Leschziner G , Rossor AM , Stevens JM , Cipolotti L , Rossor MN ((2001) ) Patterns of temporal lobe atrophy in semantic dementia and Alzheimer’s disease. Ann Neurol 49: , 433–442. |
[72] | Pusil S , Dimitriadis SI , López ME , Pereda E , Maestú F ((2019) ) Aberrant MEG multi-frequency phase temporal synchronization predicts conversion from mild cognitive impairment-to-Alzheimer’s disease. Neuroimage Clin 24: , 101972. |
[73] | Pusil S , López ME , Cuesta P , Bruña R , Pereda E , Maestú F ((2019) ) Hypersynchronization in mild cognitive impairment: The ‘X’ model. Brain 142: , 3936–3950. |
[74] | Yu M , Engels MMA , Hillebrand A , van Straaten ECW , Gouw AA , Teunissen C , van der Flier WM , Scheltens P , Stam CJ ((2017) ) Selective impairment of hippocampus and posterior hub areas in Alzheimer’s disease: An MEG-based multiplex network study. Brain 140: , 1466–1485. |
[75] | Grueso S , Viejo-Sobera R ((2021) ) Machine learning methods for predicting progression from mild cognitive impairment to Alzheimer’s disease dementia: A systematic review. Alzheimers Res Ther 13: , 162. |


