
Targeted Metabolomic Analysis in Alzheimer’s Disease Plasma and Brain Tissue in Non-Hispanic Whites
Abstract
Background:
Metabolites are biological compounds reflecting the functional activity of organs and tissues. Understanding metabolic changes in Alzheimer’s disease (AD) can provide insight into potential risk factors in this multifactorial disease and suggest new intervention strategies or improve non-invasive diagnosis.
Objective:
In this study, we searched for changes in AD metabolism in plasma and frontal brain cortex tissue samples and evaluated the performance of plasma measurements as biomarkers.
Methods:
This is a case-control study with two tissue cohorts: 158 plasma samples (94 AD, 64 controls; Texas Alzheimer’s Research and Care Consortium – TARCC) and 71 postmortem cortex samples (35 AD, 36 controls; Banner Sun Health Research Institute brain bank). We performed targeted mass spectrometry analysis of 630 compounds (106 small molecules: UHPLC-MS/MS, 524 lipids: FIA-MS/MS) and 232 calculated metabolic indicators with a metabolomic kit (Biocrates MxP® Quant 500).
Results:
We discovered disturbances (FDR≤0.05) in multiple metabolic pathways in AD in both cohorts including microbiome-related metabolites with pro-toxic changes, methylhistidine metabolism, polyamines, corticosteroids, omega-3 fatty acids, acylcarnitines, ceramides, and diglycerides. In AD, plasma reveals elevated triglycerides, and cortex shows altered amino acid metabolism. A cross-validated diagnostic prediction model from plasma achieves AUC = 82% (CI95 = 75–88%); for females specifically, AUC = 88% (CI95 = 80–95%). A reduced model using 20 features achieves AUC = 79% (CI95 = 71–85%); for females AUC = 84% (CI95 = 74–92%).
Conclusion:
Our findings support the involvement of gut environment in AD and encourage targeting multiple metabolic areas in the design of intervention strategies, including microbiome composition, hormonal balance, nutrients, and muscle homeostasis.
INTRODUCTION
Every year, over 6 million people worldwide develop Alzheimer’s disease (AD) [1]. AD is a complex disorder, multifactorial in its origin. There are known genetic, environmental, and sociodemographic factors and risks for AD linked to other diseases [2]. Underlying mechanisms eventually lead to accumulation of amyloid plaques, neurofibrillary tangles, and neuronal death [3]. When exactly neuronal homeostasis becomes pathological is unclear.
Following the success of genomic studies, other omic techniques applied to AD have shed light on disease mechanisms that can potentially identify biomarkers for early detection [4]. One of them is metabolomics, which allows the quantitative analysis of physiological metabolites in numerous classes of compounds present in biofluids and tissues. Metabolites are the high-level mediators of biochemical processes in the human body and are of important diagnostic value.
Broad metabolomic studies in AD are limited, generally lacking validation and sometimes yielding contradictory results [5]. To date, no metabolomic model in AD has reached sufficient performance to serve as a reliable clinical diagnostic biomarker. Replication efforts are hindered by differences in assay coverages and participant characteristics including AD stage. Among the larger studies, Varma et al. [6] used a targeted assay and compared two serum cohorts and one brain cohort in terms of metabolite association with multiple AD pathology related scores and produced a list of 25 metabolites ranked by the number of associated scores. Proitsi et al. [7] performed untargeted analysis and list several compounds different in AD, only two of which are identified by chemical name. Barupal et al. [8] found 15 metabolites different in AD without considering covariates. Recently, Lim et al. [9] recorded 152 metabolites different in AD, but included several summary lipid measures as covariates, effectively comparing relative proportions of individual lipid species rather than absolute values. Studies rarely consider such confounding factors as comorbidities, medication, and sample handling. Protection against violations of model assumptions is often neglected, e.g., silently assuming homoscedasticity, which can lead to incorrect results.
In this case-control study, we performed a comprehensive targeted metabolomic analysis in plasma and in tissue from the frontal cortex to identify metabolic changes characteristic of AD, which could extend our understanding of the disease and potentially serve as a diagnostic biomarker or target for intervention. The analysis covers most important metabolic pathways. Targeted analysis generally offers higher accuracy compared to untargeted approaches and a more reliable identification of the compounds. We included a range of possible confounders and performed a statistically robust analysis with a series of regression models and explored possible plasma biomarkers with a cross-validated diagnostic prediction model.
METHODS
Participants and samples
Plasma samples (200μl) were obtained from 94 AD cases and 64 control subjects, which were part of a longitudinal study conducted by the Texas Alzheimer’s Research and Care Consortium (TARCC) [10]. The study was performed in 2005–2018 with participants, older than 55 years, recruited at dementia clinics of the TARCC member institutions. Controls included volunteers and family members (although we do not have access to the familial pairing). We selected a large subset with the following characteristics: consistent diagnosis during subsequent follow-up visits with at least 3 annual follow-ups, no other major disorder of central nervous system (CNS), equal sex representation, and controls with matched distributions of age, sex, and apolipoprotein E (APOE) ɛ4 allele carriers. The diagnosis follows a clinical examination with a neuropsychological battery using NINCDS-ADRDA criteria [11], with our AD cases classified as “probable AD”, while controls showed no cognitive impairment and achieved a zero on the Clinical Dementia Rating (CDR) scale [12]. The selected samples were collected in 2007–2014 at 4 sites: Baylor College of Medicine (Houston, TX), University of Texas Southwestern Medical Center (Dallas, TX), Texas Tech University Health Sciences Centrum (Lubbock, TX), and University of North Texas Health Science Center (Fort Worth, TX). All 4 centers followed a harmonized collection protocol and we adjusted for a possible site-related effect in the statistical analysis.
Postmortem frontal cortex samples (500 mg) from 35 AD cases and 36 controls, collected in 2004–2018 and continuously stored at –80°C, were obtained from the Banner Sun Health Research Institute brain bank [13] (Sun City, AZ). The diagnosis followed histopathological examination and NIA-Reagan classification [14], with the AD cases classified as “high likelihood of AD”. Controls had no history of clinical diagnosis of cognitive impairment. The participants had no other major CNS pathology.
We excluded several non-White or Hispanic subjects because there were not enough observations to reliably estimate the effect of other races or ethnicities. Presence of such effects is plausible due to cultural differences in diet and lifestyle as well as genetic variations and not accounting for them would negatively impact statistical power of the analysis. Additional details on sample filtration are provided in the Supplementary Methods.
We also accessed and analyzed available data on non-CNS diagnoses and current medication use as listed in the Supplementary Methods. For the cortex cohort, these data were updated during pre-mortem visits.
Chromatography and mass spectrometry
Targeted metabolomic analysis was based on triple quadrupole ultra-high-performance liquid chromatography tandem mass spectrometry (UHPLC-MS/MS) using Shimadzu Nexera chromatography platform (Shimadzu Corporation, Kyoto, Japan) coupled to Sciex QTrap 5500 mass spectrometer (AB Sciex LLC, Framingham, MA, USA). We applied the Biocrates MxP® Quant 500 targeted kit (Biocrates Life Sciences AG, Innsbruck, Austria), potentially quantitating 106 small molecules in chromatography mode and 524 lipids in flow-injection mode (FIA-MS/MS), covering the most important metabolic pathways. Annotations for the individual metabolites with identifiers to external databases are provided in Supplementary File 1. Additionally, 232 metabolic indicators were calculated from sums or ratios of relevant metabolites according to Biocrates MetaboINDICATOR™ formulas [15]. We refer to the whole set of metabolites and metabolic indicators as analytes. The indicators can be regarded as physiologically-relevant derived measures and are statistically analyzed separately from metabolites. The indicators denoted as “X synthesis” are computed as a ratio of metabolite X and its main precursors in attempt to reflect the conversion ratio. Since there are multiple explanations why such an indicator could be altered, the interpretation needs to be done cautiously in context of the individual metabolites.
Brain cortex samples were extracted with 85% ethanol in phosphate buffered saline at concentration 3μl/mg, homogenized with sonicator, and centrifuged for 20 minutes. The clear extract (30μl) was transferred onto a kit plate (with pre-injected internal standards) and dried down. For plasma samples, we added 10μl directly to the plate. In brief, the rest of the assay includes derivatization with 5% phenylisothiocyanate in pyridine, ethanol and water (1:1:1), and subsequent extraction with 5 mM ammonium acetate in methanol. Chromatography was done with 0.2% formic acid in acetonitrile (organic mobile phase) and 0.2% formic acid in water (inorganic mobile phase). Flow-injection analysis was performed with methanol and Biocrates MxP® Quant 500 proprietary additive of undisclosed composition. As proprietary knowledge, Biocrates prefers to keep mass transitions of individual metabolites undisclosed.
Sample handling was done on dry ice to avoid multiple freeze-thaw cycles. We randomized the samples across plates already prior to their processing to avoid any accidental bias towards one of the diagnostic groups. Plates included blanks to calculate limits of detection and repeats of a quality control sample to monitor the coefficient of variation (presented in the Limitations section in Discussion; also see Supplementary Methods for more details).
Data preprocessing
Chromatographic peaks were identified and integrated in Biocrates MetIDQ™ Oxygen-DB110-3005 and manually reviewed. Areas of metabolite peaks were divided by areas of their respective internal standards. Further processing was done in R v3.6.1 [16] with RStudio [17] and details are provided in the Supplementary Methods. Briefly, we performed median scaling plate normalization to account for possible batch effects, calculated limits of detection from blanks to filter out low-abundant metabolites with poor detection, transformed the data via Box-Cox transformation through R package car [18] to better approximate normal distributions, and adjusted outliers via Tukey’s fencing [19] to avoid skewing the means by extreme values. The values were then standardized with respect to control samples to facilitate comparison of regression coefficients in the statistical analysis. We imputed several cases of missing sociodemographic values (BMI, education) by manual review of other visits (plasma cohort) or conditioned on diagnosis group and sex (cortex cohort).
Statistical methods
The statistical analysis was done in R v3.6.1 [16] with RStudio and package ggplot2 [20] for visualization. We provide more details in the Supplementary Methods. Briefly, differential analysis was performed with a series of multivariable bootstrapped de-sparsified L1-regularized linear regression models via R package hdi [21], checked for collinearity with R package car [18] and adjusted for heteroscedasticity when suspected with Breusch-Pagan test [22] (R package lmtest [23]). This type of model has been shown suitable for accurate high-dimensional inference with many covariates, estimating reliable confidence intervals thanks to de-sparsification and bootstrapping [24]. The covariates include sociodemographic attributes, disorders, medication, and supplementation as well as sample collection and handling attributes. The unit of regression coefficients is 1 standard deviation (SD) of the distribution of controls. False discovery rate (FDR) is controlled with q-values [25]. Pathway analysis was done with human KEGG [26] and SMPDB [27] metabolic pathways, borrowing a statistical approach introduced in ChemRICH enrichment analysis [28] with FDR control using q-values [25]. For biomarker analysis, we constructed diagnostic prediction models via extreme gradient boosting (XGBoost) [29] with nested cross-validation and evaluated them in terms of area under receiver operating characteristic curve (AUC) score with R package pROC [30] with respect to the number of features used after step-wise elimination. We report the top 30 most predictive features. Demographics were compared with Welch’s t-test and Fisher’s exact test. We explored associations with other diagnoses in terms of odds ratios (OR) with univariable logistic regression models, FDR-controlled with Benjamini-Hochberg procedure [31].
RESULTS
Participant characteristics are summarized in Table 1. We also present all metadata and data tables (from raw values to final tables) as Supplementary Dataset files (separately for both cohorts and for metabolites and metabolic indicators). The largest differences are in Mini-Mental State Examination (MMSE) score [32] (p < 0.001), with mild-moderate impairment (mean = 23, SD = 4) in the plasma cohort AD and mild-severe impairment (mean = 15, SD = 8) in the cortex cohort AD (based on MMSE to dementia severity mapping [33]). Education of AD participants in the plasma cohort is slightly lower compared to controls (–1.3y, p = 0.002). Postmortem intervals are short, close to 3 hours on average, with no difference between the groups. Duration of storage in the freezer since the collection is somewhat higher for the control cortex samples, as we had to go further in time and obtain “older” samples to get an adequate number of controls. Nevertheless, it does not pose an issue: Any tissue degradation would be reflected in higher levels of choline and amino acids, but the observed values do not conform to this pattern. Choline levels of longer stored control samples are indistinguishable from control samples with shorter freezer storage (Welch’s t-test p = 0.92 for upper versus lower tertile). We also control for a potential freezer storage effect in the regression alongside other covariates.
Table 1
Participant Demographics and Sample Characteristics
| Plasma | Frontal cortex | |||||
| AD (n = 94) | Controls (n = 64) | pa | AD (n = 35) | Controls (n = 36) | pa | |
| Sex, male, No. (%) | 47 (50%) | 32 (50%) | 1 | 20 (57%) | 22 (61%) | 0.81 |
| Age, y, mean (SD) | 71 (8) | 71 (8) | 0.78 | 81 (9) | 82 (10) | 0.44 |
| Race | All non-Hispanic White | 1 | All non-Hispanic White | 1 | ||
| Education, y, mean (SD) | 15 (3) | 16 (3) | 0.002 | 15 (2) | 14 (3) | 0.66 |
| BMI, kg/m2, mean (SD) | 27 (4) | 28 (5) | 0.37 | 24 (4) | 25 (5) | 0.73 |
| APOE, ɛ4 carrier, No. (%) | 43 (46%) | 27 (42%) | 0.74 | 18 (51%) | 5 (14%) | 0.008 |
| ɛ4/ɛ4 carrierb, No. (%) | 6 (6%) | 2 (3%) | 0.47 | 2 (6%) | 0 (0%) | 0.24 |
| MMSE, mean (SD) | 23 (4) | 29 (1) | < 0.001 | 15 (8) | 28 (1) | < 0.001 |
| Fasting, h, mean (SD) | 5 (4) | 4 (3) | 0.09 | NAc | NAc | NAc |
| PMI, h, mean (SD) | NAc | NAc | NAc | 3.4 (0.8) | 3.2 (1.0) | 0.26 |
| Storage, y, mean (SD) | 10 (2) | 10 (2) | 0.56 | 7 (2) | 10 (4) | 0.002 |
AD, Alzheimer’s disease; APOE, apolipoprotein E; BMI, body mass index; MMSE, Mini-Mental State Examination; NA, not available; PMI, postmortem interval. aGroup comparison was performed with Welch’s t-test (continuous variables) and Fisher’s exact test (count variables). bHere, ɛ4/ɛ4 carriers are a subgroup of ɛ4 carriers. cFasting status is unknown for deceased donors. Postmortem interval is not applicable for living plasma donors.
Brief association analysis further shows a link between AD and diagnosis of depression (OR = 4.1, 95% confidence interval (CI95) = 1.4–14.5, FDR = 0.044), hypercholesterolemia (OR = 2.3, CI95 = 1.2–4.5, FDR = 0.044), and hypertension (OR = 2.2, CI95 = 1.2–4.2, FDR = 0.044), in the plasma cohort, and between AD and cerebral amyloid angiopathy (OR = 33, CI95 = 9.1–208, FDR < 0.001), APOE ɛ4 allele (OR = 5.6, CI95 = 2.5–13, FDR < 0.001), and cerebral white matter rarefaction (OR = 4.4, CI95 = 1.9–11, FDR = 0.010) in the cortex cohort.
Metabolomic analysis in plasma
Differentially altered metabolites and metabolic indicators
We found 353 metabolites (including lipid species) and 26 metabolic indicators altered in AD plasma. Among small molecules (Table 2), the most intriguing findings are changes related to microbial activity. There is increased 5-aminovaleric acid (+ 0.72, CI95 = 0.36–1.09, FDR = 0.001), para-cresol sulfate (+0.35, CI95 = 0.02–0.70, FDR = 0.017) and trimethylamine N-oxide (+ 0.45, CI95 = 0.00–0.87, FDR = 0.020). Indole derivatives are shifted towards more abundant indoxyl sulfate (+ 0.49, CI95 = 0.18–0.82, FDR = 0.001) and 3-indoleacetic acid (+ 0.36, CI95 = 0.02–0.70, FDR = 0.013), whereas 3-indolepropionic acid is decreased (–0.35, CI95 = –0.67–0.05, FDR = 0.012). Bile acid profile is altered by decreased cholic acid (–0.32, CI95 = –0.71–0.01, FDR = 0.023) and its increased 7α-dehydroxylation (+ 0.53, CI95 = 0.13–0.92, FDR = 0.037).
Table 2
Regression Coefficients of Small Molecules and Indicators Altered in AD Plasma or Frontal Cortex
| Plasma | Frontal cortex | |||||
| Metabolite or indicator | Effecta | CI95 | FDRb | Effecta | CI95 | FDRb |
| Microbiome-related metabolites | ||||||
| 5-Aminovaleric acid | 72% | (36% – 109%) | 0.001 | 61% | (23% – 101%) | 0.015 |
| para-Cresol sulfate | 35% | (2% – 70%) | 0.017 | 50% | (3% – 95%) | 0.07 |
| Trimethylamine N-oxide | 45% | (0% – 87%) | 0.020 | 9% | (–29% – 51%) | 0.43 |
| 3-Indoleacetic acid | 36% | (2% – 70%) | 0.013 | 34% | (–17% – 79%) | 0.16 |
| 3-Indolepropionic acid | –35% | (–67% – –5%) | 0.012 | NAc | NAc | NAc |
| Indoxyl sulfate | 49% | (18% – 82%) | 0.001 | 58% | (14% – 100%) | 0.027 |
| Sum of indoles | 48% | (16% – 82%) | 0.009 | 55% | (16% – 100%) | 0.020 |
| Cholic acid | –32% | (–71% – 1%) | 0.023 | –1% | (–41% – 37%) | 0.54 |
| Deoxycholic acid | 28% | (–6% – 62%) | 0.044 | 7% | (–35% – 46%) | 0.48 |
| 7α-Dehydroxylation of cholic acid | 53% | (13% – 92%) | 0.037 | 12% | (–27% – 49%) | 0.29 |
| Methylhistidine metabolism | ||||||
| 1-Methylhistidine | 33% | (–2% – 67%) | 0.024 | 50% | (10% – 90%) | 0.034 |
| 3-Methylhistidine | 36% | (1% – 67%) | 0.020 | –5% | (–43% – 32%) | 0.46 |
| 1-Methylhistidine synthesis | –38% | (–74% – –3%) | 0.10 | 47% | (6% – 91%) | 0.038 |
| β-Alanine | 46% | (12% – 81%) | 0.004 | 34% | (–12% – 80%) | 0.15 |
| Anserine | NAc | NAc | NAc | –80% | (–145% – –13%) | 0.049 |
| Anserine synthesis | NAc | NAc | NAc | –85% | (–121% – –50%) | 0.003 |
| Carnosine | 64% | (27% – 99%) | 0.001 | 38% | (–2% – 78%) | 0.09 |
| Carnosine synthesis | 65% | (27% – 105%) | 0.009 | 6% | (–30% – 46%) | 0.35 |
| Homocysteine metabolism | ||||||
| Homocysteine | 21% | (–9% – 55%) | 0.06 | 71% | (23% – 117%) | 0.027 |
| Betaine | –25% | (–62% – 13%) | 0.06 | –62% | (–110% – –14%) | 0.034 |
| Betaine synthesis | –44% | (–81% – –18%) | 0.019 | –13% | (–54% – 27%) | 0.28 |
| Sum of betaine and related metabolites | –33% | (–66% – –6%) | 0.046 | –64% | (–109% – –15%) | 0.022 |
| Choline | 12% | (–22% – 45%) | 0.13 | –58% | (–93% – –23%) | 0.007 |
| Sarcosine synthesis from choline | –1% | (–34% – 28%) | 0.62 | 65% | (25% – 109%) | 0.007 |
| Cystine | –4% | (–30% – 37%) | 0.21 | 70% | (28% – 110%) | 0.007 |
| Cysteine synthesis | 4% | (–33% – 38%) | 0.60 | 51% | (5% – 97%) | 0.039 |
| Glutathione constituents | 16% | (–19% – 46%) | 0.44 | 100% | (47% – 158%) | 0.003 |
| Taurine synthesis | –8% | (–44% – 18%) | 0.44 | –85% | (–131% – –36%) | 0.003 |
| Polyamines | ||||||
| Putrescine | –9% | (–42% – 26%) | 0.17 | –52% | (–90% – –16%) | 0.015 |
| Putrescine synthesis | –22% | (–57% – 9%) | 0.24 | –76% | (–121% – –29%) | 0.003 |
| Spermidine | 8% | (–28% – 39%) | 0.20 | 63% | (26% – 102%) | 0.007 |
| Spermidine synthesis | 22% | (–9% – 50%) | 0.23 | 75% | (33% – 115%) | 0.003 |
| Spermine | 37% | (0% – 72%) | 0.021 | 12% | (–25% – 55%) | 0.41 |
| Spermine synthesis | 38% | (7% – 68%) | 0.08 | –51% | (–88% – –13%) | 0.003 |
| Sum of polyamines | 10% | (–32% – 43%) | 0.59 | 60% | (26% – 97%) | 0.007 |
| Purines | ||||||
| Xanthine synthesis | NAc | NAc | NAc | 71% | (32% – 109%) | 0.003 |
| Steroids | ||||||
| Cortisol | 41% | (–1% – 81%) | 0.023 | 80% | (42% – 117%) | 0.007 |
| Cortisone | 35% | (–2% – 73%) | 0.025 | NAc | NAc | NAc |
| Omega-3 fatty acids | ||||||
| DHA | –42% | (–78% – –14%) | 0.003 | –33% | (–67% – 0%) | 0.07 |
| EPA | –37% | (–71% – –6%) | 0.009 | –44% | (–83% – –5%) | 0.05 |
| Ratio of DHA to ARA | –55% | (–93% – –16%) | 0.030 | –33% | (–68% – 2%) | 0.06 |
| Carboxylic acids | ||||||
| Aconitic acid | 26% | (–7% – 61%) | 0.044 | 10% | (–29% – 49%) | 0.41 |
| 3-Hydroxyglutaric acid | 37% | (2% – 71%) | 0.017 | 53% | (7% – 104%) | 0.06 |
| Lactic acid | 25% | (–10% – 62%) | 0.06 | 73% | (27% – 118%) | 0.015 |
| Succinic acid | 27% | (–7% – 62%) | 0.046 | 53% | (7% – 96%) | 0.049 |
| Sum of carboxylic acids | 26% | (–11% – 63%) | 0.23 | 79% | (37% – 124%) | 0.003 |
| Amino acids | ||||||
| Alanine | 32% | (1% – 63%) | 0.020 | 118% | (72% – 171%) | 0.007 |
| Arginine | 33% | (2% – 64%) | 0.017 | 73% | (30% – 111%) | 0.007 |
| Cysteine | 15% | (–19% – 54%) | 0.11 | 106% | (54% – 157%) | 0.007 |
| Glutamine | 9% | (–19% – 43%) | 0.13 | 61% | (22% – 103%) | 0.022 |
| Histidine | –2% | (–33% – 29%) | 0.22 | 87% | (42% – 133%) | 0.007 |
| Isoleucine | 26% | (–6% – 59%) | 0.05 | 67% | (22% – 109%) | 0.022 |
| Leucine | 20% | (–13% – 53%) | 0.07 | 67% | (25% – 110%) | 0.015 |
| Lysine | 24% | (–13% – 60%) | 0.06 | 56% | (12% – 101%) | 0.048 |
| Methionine | 25% | (–9% – 61%) | 0.05 | 63% | (20% – 106%) | 0.007 |
| Phenylalanine | 4% | (–25% – 35%) | 0.19 | 109% | (60% – 159%) | 0.007 |
| Serine | 1% | (–37% – 37%) | 0.23 | 91% | (43% – 144%) | 0.007 |
| Threonine | 30% | (–6% – 64%) | 0.032 | 118% | (59% – 177%) | 0.007 |
| Tryptophan | 3% | (–34% – 38%) | 0.22 | 118% | (63% – 169%) | 0.007 |
| Tyrosine | –1% | (–33% – 32%) | 0.22 | 105% | (57% – 158%) | 0.007 |
| Valine | 24% | (–9% – 58%) | 0.050 | 94% | (46% – 139%) | 0.007 |
| Dihydrolipoamide dehydrogenase deficiency | 11% | (–25% – 46%) | 0.48 | –65% | (–106% – –24%) | 0.007 |
| Fischer ratio | 34% | (–2% – 67%) | 0.15 | –49% | (–93% – –5%) | 0.045 |
| Glycine synthesis | 10% | (–26% – 43%) | 0.48 | –49% | (–105% – –24%) | 0.020 |
| (–91% – –4%) | ||||||
| (–86% – –12%) | ||||||
| Sum of AAs | 25% | (–8% – 61%) | 0.23 | 116% | (62% – 168%) | 0.003 |
| Sum of aromatic AAs | 1% | (–31% – 35%) | 0.61 | 111% | (60% – 160%) | 0.003 |
| Sum of branched-chain AAs | 24% | (–9% – 56%) | 0.24 | 78% | (37% – 123%) | 0.003 |
| Sum of essential AAs | 22% | (–14% – 59%) | 0.30 | 99% | (50% – 146%) | 0.003 |
| Sum of non-essential AAs | 26% | (–9% – 61%) | 0.23 | 109% | (58% – 158%) | 0.003 |
| Sum of solely glucogenic AAs | 29% | (–4% – 65%) | 0.15 | 112% | (57% – 165%) | 0.003 |
| Sum of solely ketogenic AAs | 24% | (–11% – 59%) | 0.24 | 65% | (22% – 110%) | 0.007 |
| Sum of sulfur-containing AAs | 28% | (–8% – 65%) | 0.23 | 101% | (49% – 150%) | 0.003 |
| Others amino acid related | ||||||
| α-Aminoadipic acid | 9% | (–27% – 39%) | 0.17 | 131% | (75% – 185%) | 0.007 |
| α-Aminobutyric acid | 26% | (–14% – 66%) | 0.06 | 55% | (15% – 110%) | 0.034 |
| Acetylornithine | NAc | NAc | NAc | 53% | (7% – 102%) | 0.049 |
| Creatinine | 20% | (–14% – 53%) | 0.08 | 74% | (30% – 118%) | 0.007 |
| Histamine | NAc | NAc | NAc | 54% | (11% – 101%) | 0.042 |
| Homoarginine | 13% | (–20% – 41%) | 0.13 | 50% | (13% – 88%) | 0.031 |
| trans-4-Hydroxyproline | 52% | (10% – 91%) | 0.009 | 92% | (45% – 134%) | 0.007 |
| Kynurenine | –9% | (–43% – 27%) | 0.15 | 99% | (47% – 147%) | 0.007 |
| Methionine sulfoxide | –13% | (–45% – 17%) | 0.12 | 54% | (12% – 97%) | 0.039 |
| Methionine oxidation | –27% | (–58% – 5%) | 0.19 | –44% | (–84% – –4%) | 0.039 |
| SDMA | 9% | (–30% – 45%) | 0.18 | 50% | (16% – 85%) | 0.022 |
| Sum of dimethylated arginine | 9% | (–30% – 48%) | 0.52 | 50% | (14% – 85%) | 0.010 |
| Neurotransmitters | ||||||
| DOPA synthesis | NAc | NAc | NAc | –130% | (–191% – –68%) | 0.003 |
| GABA synthesis | –6% | (–35% – 30%) | 0.59 | –63% | (–100% – –29%) | 0.003 |
| Serotonin synthesis | –2% | (–32% – 32%) | 0.64 | –73% | (–120% – –29%) | 0.003 |
Metabolic indicators: Anserine synthesis, anserine/carnosine; Betaine synthesis, betaine/choline; Carnosine synthesis, carnosine/histidine; Cysteine synthesis, cysteine/(serine + methionine); 7α-Dehydroxylation of cholic acid, deoxycholic acid/cholic acid; Dihydrolipoamide dehydrogenase deficiency, proline/phenylalanine; DOPA synthesis, DOPA/tyrosine; Fischer ratio, sum of branched-chain amino acids/sum of aromatic amino acids; GABA synthesis, GABA/glutamate; Glutathione constituents, glutamate + glycine + cysteine; Glycine synthesis, glycine/serine; Methionine oxidation, methionine sulfoxide/methionine; 1-Methylhistidine synthesis, 1-methylhistidine/(carnosine + anserine); Putrescine synthesis, putrescine/ornithine; Sarcosine synthesis from choline, sarcosine/choline; Serotonin synthesis, serotonin/tryptophan; Spermidine synthesis, spermidine/putrescine; Spermine synthesis, spermine/spermidine; Taurine synthesis, taurine/cysteine; Xanthine synthesis, xanthine/hypoxanthine. AAs, amino acids; ARA, arachidonic acid; BC, branched-chain; CI95, 95% confidence interval; DHA, docosahexaenoic acid; DOPA, 3,4-dihydroxyphenylalanine; EPA, eicosapentaenoic acid; FDR, false discovery rate; GABA, γ-aminobutyric acid; NA, not available; SDMA, symmetric dimethylarginine. aAD regression coefficient in units of 1 standard deviation of the distribution of controls. bFDR control with q-values following bootstrapped p-values of multivariable de-sparsified L1-regularized linear regression models. FDR≤0.05 is rounded to 3 decimal places and highlighted in red (upregulated) and blue (downregulated). cValue not available when the metabolite was not sufficiently detected (in at least 50% of samples in either group above the limit of detection). In case of indicators, this happens if a) all metabolites of a sum indicator were not sufficiently detected, b) all metabolites in a nominator or denominator of a ratio indicator were not sufficiently detected, or c) the remaining sufficiently detected metabolites in the indicator completely overlap with another more specific indicator (e.g., Sum of triglycerides and Sum of unsaturated triglycerides).
Further, methylhistidine metabolism (methylhistidines, carnosine, β-alanine) is upregulated. Polyamine metabolism is disrupted with increased spermine. Steroids cortisol and cortisone are elevated. Levels of omega-3 fatty acids (docosahexaenoic acid (DHA) and eicosapentaenoic acid (EPA)) are decreased. Several carboxylic acids are elevated: 3-hydroxyglutaric acid, succinic acid, and aconitic acid. Betaine synthesis (ratio betaine/choline) is decreased. There is a mild increase in amino acids, with alanine, arginine, threonine, and valine reaching a statistically significant FDR level. Volcano plot (Fig. 1A) shows the most significantly altered small molecules in plasma: 5-aminovaleric acid, carnosine, indoxyl sulfate, β-alanine, DHA, EPA, 3-indoleacetic acid, 3-indolepropionic acid, and trans-4-hydroxyproline.
Fig. 1
Volcano Plots for Plasma Metabolites. Volcano plots of AD regression coefficients for small molecules (A) and lipids (B) in plasma. The red referrence line denotes FDR significance of 0.05. The most outlying values for small molecules are labeled. Notice the large skew towards positive significant values in lipids, indicating hyperlipidemia. 5-AVA, 5-aminovaleric acid; beta-Ala, β-alanine; DHA, docosahexaenoic acid; EPA, eicosapentaenoic; Ind-SO4, indoxyl sulfate; 3-IAA, 3-indoleacetic acid; 3-IPA, 3-indolepropionic acid; t4-OH-Pro, trans-4-hydroxyproline.
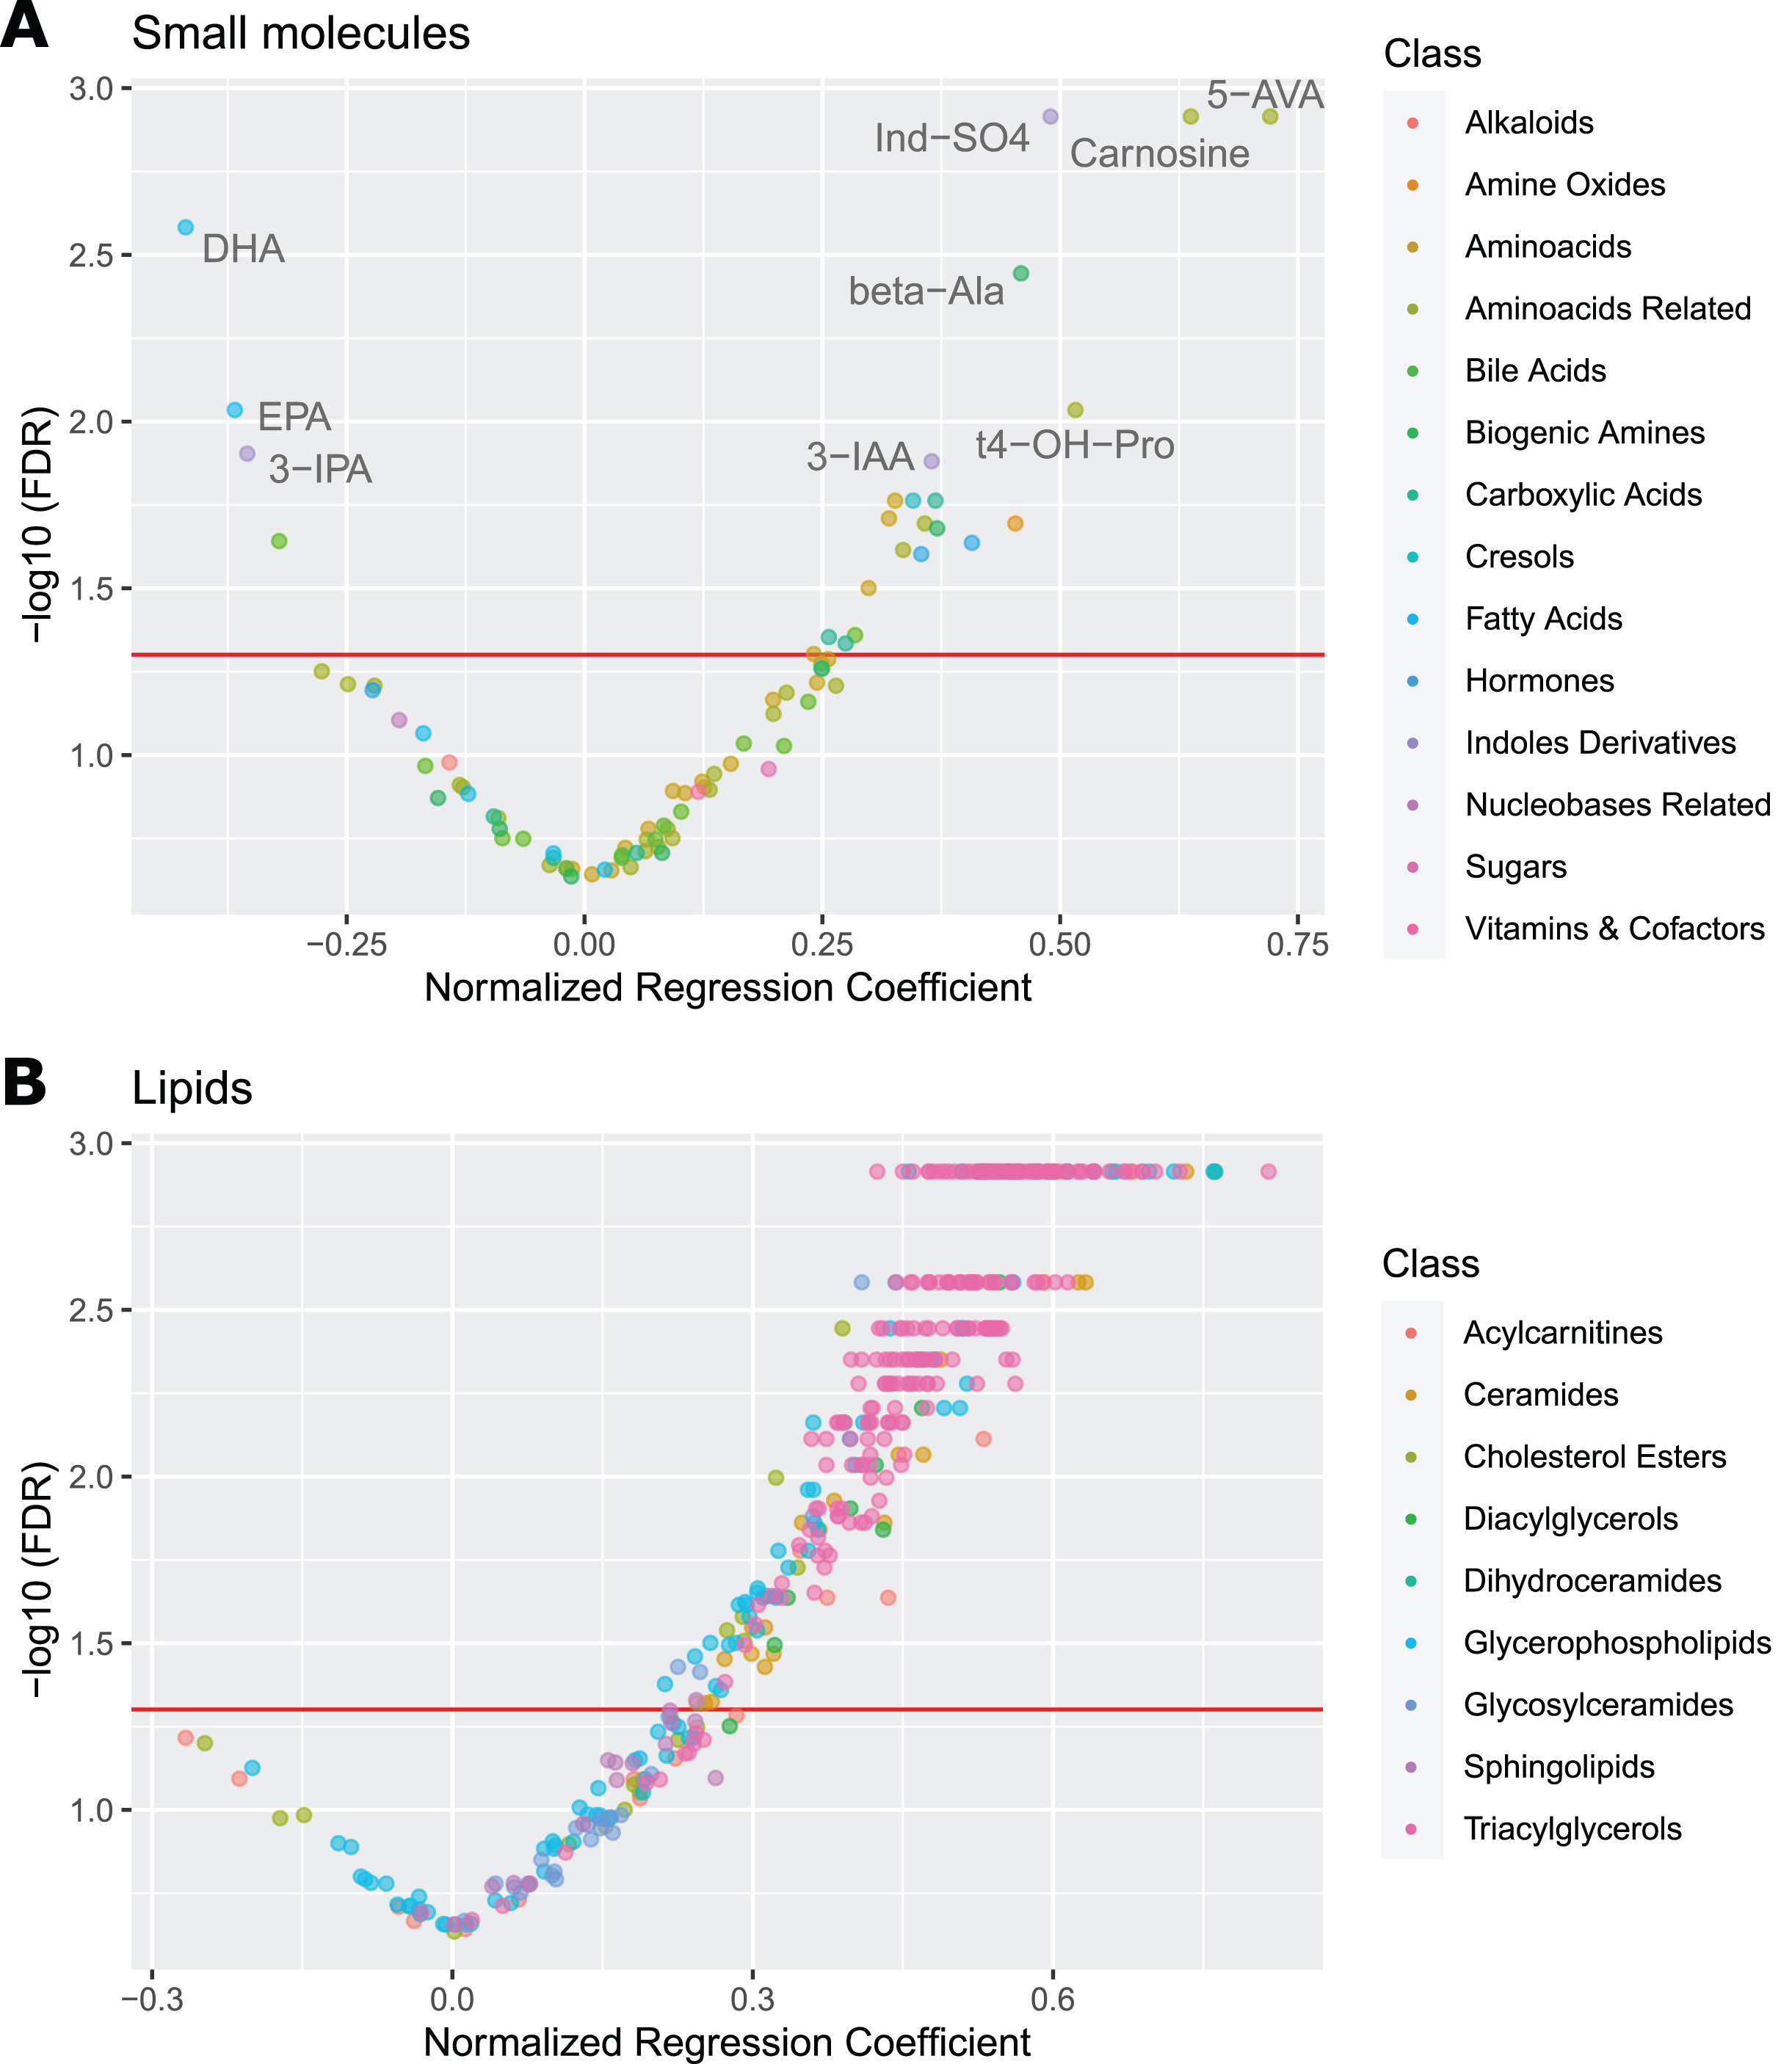
In lipid metabolism (Table 3; individual lipid species are listed in Supplementary Table 1), we see general elevation in multiple lipid classes: Several saturated acylcarnitines are elevated (3:0, 8:0, 10:0, 18:0). Phosphatidylcholines are increased, most significantly polyunsaturated and diacyl phosphatidylcholines. Lysophosphatidylcholines are increased regardless of saturation or size, possibly indicating higher activity of phospholipase A2. Ceramides are increased, including some glycosylceramides. Unsaturated triglycerides, diglycerides, and several cholesterol species are also elevated. Volcano plot of lipid species (Fig. 1B) captures the upregulated lipid metabolism. See Supplementary Figure 1 for visualization of AD effects across lipid classes and Supplementary Figure 2 for illustrative boxplots of several of the altered analytes.
Table 3
Regression Coefficients of Lipid Indicators Altered in AD Plasma or Frontal Cortex
| Plasma | Cortex | |||||
| Indicator | Effecta | CI95 | FDRb | Effecta | CI95 | FDRb |
| Acylcarnitines | ||||||
| Ratio of ACs to fatty acids | 17% | (–15% – 50%) | 0.36 | 85% | (42% – 131%) | 0.003 |
| Ratio of hydroxylated ACs to ACs | NAc | NAc | NAc | –70% | (–110% – –31%) | 0.003 |
| Ratio of SCFA ACs to MCFA ACs | –27% | (–61% – 6%) | 0.21 | 61% | (12% – 114%) | 0.018 |
| MCAD deficiency screen (C8/C2) | 58% | (17% – 101%) | 0.019 | NAc | NAc | NAc |
| SBCAD deficiency screen (C5/C0) | –40% | (–78% – 0%) | 0.13 | 50% | (12% – 90%) | 0.018 |
| Sum of ACs | 11% | (–25% – 42%) | 0.48 | 92% | (48% – 136%) | 0.003 |
| Sum of MUFA ACs | 15% | (–16% – 49%) | 0.38 | 63% | (21% – 104%) | 0.010 |
| Sum of PUFA ACs | NAc | NAc | NAc | 70% | (9% – 125%) | 0.039 |
| Sum of SFA ACs | 9% | (–25% – 42%) | 0.51 | 91% | (50% – 135%) | 0.003 |
| Sum of LCFA ACs | 10% | (–25% – 46%) | 0.47 | 63% | (10% – 113%) | 0.027 |
| Sum of MCFA ACs | 29% | (–5% – 67%) | 0.21 | 65% | (26% – 105%) | 0.003 |
| Sum of SCFA ACs | 20% | (–11% – 50%) | 0.29 | 90% | (52% – 127%) | 0.003 |
| Phosphatidylcholines | ||||||
| Ratio of PCs to choline | 19% | (–13% – 52%) | 0.30 | 62% | (23% – 99%) | 0.003 |
| Ratio of diacyl PCs to choline | 20% | (–12% – 50%) | 0.29 | 60% | (20% – 101%) | 0.003 |
| Ratio of acyl-alkyl PCs to choline | 11% | (–17% – 41%) | 0.38 | 66% | (35% – 99%) | 0.003 |
| Ratio of acyl-alkyl to diacyl PCs | –20% | (–53% – 14%) | 0.30 | 44% | (4% – 81%) | 0.039 |
| Sum of PCs | 51% | (20% – 85%) | 0.009 | 5% | (–51% – 64%) | 0.37 |
| Sum of diacyl PCs | 53% | (22% – 87%) | 0.019 | –9% | (–65% – 48%) | 0.34 |
| Sum of acyl-alkyl PCs | 32% | (2% – 61%) | 0.12 | 44% | (8% – 76%) | 0.025 |
| Sum of PUFA PCs | 56% | (26% – 90%) | 0.009 | 5% | (–48% – 55%) | 0.38 |
| Sum of lysoPCs | 68% | (35% – 100%) | 0.009 | –34% | (–76% – 7%) | 0.09 |
| Sum of MUFA lysoPCs | 57% | (20% – 90%) | 0.009 | –41% | (–92% – 3%) | 0.07 |
| Sum of PUFA lysoPCs | 81% | (47% – 112%) | 0.009 | –32% | (–66% – 4%) | 0.08 |
| Sum of SFA lysoPCs | 58% | (24% – 90%) | 0.009 | –28% | (–65% – 7%) | 0.11 |
| Sum of LCFA lysoPCs | 69% | (36% – 104%) | 0.009 | –34% | (–74% – 6%) | 0.09 |
| Sum of choline lipids | 58% | (26% – 93%) | 0.009 | –51% | (–88% – –15%) | 0.020 |
| Phospholipase A2 activity (over PC aa C38:6) | 51% | (21% – 81%) | 0.009 | –17% | (–73% – 36%) | 0.29 |
| Sphingomyelins | ||||||
| Ratio of hydroxylated SMs to non-hydroxylated SMs | –23% | (–53% – 7%) | 0.23 | 49% | (16% – 83%) | 0.010 |
| Sum of hydroxylated SMs | 11% | (–13% – 43%) | 0.37 | 58% | (19% – 94%) | 0.003 |
| Sum of VLCFA SMs | 14% | (–12% – 43%) | 0.32 | 42% | (5% – 77%) | 0.039 |
| Ceramides | ||||||
| Ratio of glycosylCer to Cer | –47% | (–77% – –14%) | 0.037 | 37% | (–3% – 76%) | 0.07 |
| Ratio of hexosylCer to Cer | –49% | (–80% – –13%) | 0.019 | 36% | (–3% – 75%) | 0.07 |
| Sum of Cer | 60% | (24% – 92%) | 0.019 | 41% | (8% – 78%) | 0.039 |
| Sum of glycosylCer | 16% | (–17% – 51%) | 0.34 | 39% | (6% – 73%) | 0.039 |
| Sum of hexosylCer | 10% | (–21% – 41%) | 0.47 | 38% | (4% – 72%) | 0.039 |
| Sum of dihexosylCer | 19% | (–14% – 52%) | 0.32 | 39% | (4% – 73%) | 0.038 |
| Sum of trihexosylCer | 20% | (–10% – 49%) | 0.25 | 47% | (3% – 94%) | 0.049 |
| Sum of LCFA Cer | 60% | (26% – 95%) | 0.019 | 46% | (9% – 86%) | 0.022 |
| Sum of LCFA glycosylCer | 15% | (–16% – 46%) | 0.37 | 42% | (6% – 75%) | 0.027 |
| Sum of VLCFA Cer | 58% | (27% – 92%) | 0.009 | 35% | (0% – 69%) | 0.06 |
| Sum of VLCFA glycosylCer | 15% | (–17% – 45%) | 0.36 | 37% | (3% – 71%) | 0.039 |
| Sum of VLCFA dihydroCer | 81% | (44% – 117%) | 0.009 | NAc | NAc | NAc |
| Diglycerides and triglycerides | ||||||
| Ratio of DGs to fatty acids | 30% | (–2% – 64%) | 0.15 | 62% | (30% – 94%) | 0.003 |
| Ratio of TGs to fatty acids | 37% | (4% – 70%) | 0.09 | 55% | (11% – 100%) | 0.022 |
| Ratio of DGs to TGs | –39% | (–76% – –6%) | 0.08 | 47% | (7% – 84%) | 0.036 |
| Sum of DGs | NAc | NAc | NAc | 67% | (26% – 103%) | 0.003 |
| Sum of unsaturated DGs | 48% | (14% – 82%) | 0.037 | 66% | (30% – 103%) | 0.003 |
| Sum of TGs | 56% | (28% – 86%) | 0.009 | NAc | NAc | NAc |
| Sum of unsaturated TGs | 56% | (27% – 90%) | 0.009 | 56% | (6% – 103%) | 0.044 |
| Cholesteryl esters | ||||||
| Sum of PUFA CEs | 31% | (3% – 63%) | 0.11 | –53% | (–104% – –4%) | 0.045 |
| Sum of saturated CEs | –17% | (–53% – 20%) | 0.37 | 54% | (6% – 102%) | 0.039 |
ACs, acylcarnitines; CEs, cholesteryl esters; Cer, ceramides; CI95, 95% confidence interval; Cn, acylcarnitine Cn:0; DGs, diglycerides; FDR, false discovery rate; MCAD, medium-chain acyl-coenzyme A dehydrogenase; MCFA, medium-chain fatty acid; MUFA, monounsaturated fatty acid; NA, not available; LCFA, long-chain fatty acid; PCs, phosphatidylcholines; PUFA, polyunsaturated fatty acid; SBCAD, short/branched-chain acyl-coenzyme A dehydrogenase; SCFA, short-chain fatty acid; SFA, saturated fatty acid; SMs, sphingomyelins; TGs, triglycerides; VLCFA, very long-chain fatty acid. aAD regression coefficient in units of 1 standard deviation of the distribution of controls. bFDR control with q-values following bootstrapped p-values of multivariable de-sparsified L1-regularized linear regression models. FDR≤0.05 is rounded to 3 decimal places and highlighted in red (upregulated) and blue (downregulated). cValue not available when the metabolite was not sufficiently detected (in at least 50% of samples in either group above the limit of detection). In case of indicators, this happens if a) all metabolites of a sum indicator were not sufficiently detected, b) all metabolites in a nominator or denominator of a ratio indicator were not sufficiently detected, or c) the remaining sufficiently detected metabolites in the indicator completely overlap with another more specific indicator (e.g., Sum of triglycerides and Sum of unsaturated triglycerides).
Additionally, we report on observed sex-specific metabolic changes (Supplementary Table 2): Compared to females, males have higher levels of several amino acids (only glycine is lower), increased tryptophan metabolism including serotonin, muscle-related metabolites, spermidine, betaine as well as dehydroepiandrosterone sulfate (DHEAS), but lower EPA. Among lipids, males have consistently lower ceramides, glycosylceramides, sphingomyelins, hydroxysphingomyelins, cholesteryl esters, phosphatidylcholines, lysophosphatidylcholines, and higher diglycerides and triglycerides.
Differentially altered pathways
Pathway analysis identified several KEGG pathways (Table 4) dysregulated in AD: steroid biosynthesis, branched-chain amino acid biosynthesis, 3 pathways related to omega-6 and omega-3 fatty acids, metabolism of glycerolipids and glycerophospholipids, and metabolism of sphingolipids. The custom set of metabolites linked to microbial activity is also significant.
Table 4
KEGG Pathways Significantly Altered in AD Plasma or Frontal Cortex
| Pathway | Plasma | Cortex | ||
| Effecta | FDRb | Effecta | FDRb | |
| Steroid biosynthesis | 27% | 0.006 | 13% | 0.86 |
| Arginine biosynthesis | 15% | 0.58 | 49% | < 0.001 |
| Purine metabolism | NAc | NAc | 35% | 0.047 |
| Alanine, aspartate and glutamate metabolism | 16% | 0.54 | 58% | < 0.001 |
| Glycine, serine and threonine metabolism | 13% | 0.62 | 71% | < 0.001 |
| Cysteine and methionine metabolism | 16% | 0.47 | 72% | < 0.001 |
| Valine, leucine and isoleucine biosynthesis | 25% | 0.007 | 87% | < 0.001 |
| Lysine degradation | 29% | 0.25 | 66% | < 0.001 |
| Arginine and proline metabolism | 25% | 0.24 | 54% | < 0.001 |
| Histidine metabolism | 25% | 0.19 | 50% | < 0.001 |
| Tryptophan metabolism | 12% | 0.67 | 65% | 0.045 |
| beta-Alanine metabolism | 26% | 0.23 | 47% | 0.002 |
| Taurine and hypotaurine metabolism | 12% | 0.79 | 77% | 0.008 |
| D-Amino acid metabolism | 21% | 0.19 | 72% | < 0.001 |
| Glutathione metabolism | 16% | 0.62 | 52% | < 0.001 |
| Glycerolipid metabolism | 50% | < 0.001 | 21% | 0.016 |
| Glycerophospholipid metabolism | 32% | < 0.001 | 26% | < 0.001 |
| Arachidonic acid metabolism | 29% | < 0.001 | 22% | 0.05 |
| Linoleic acid metabolism | 28% | < 0.001 | 22% | 0.05 |
| alpha-Linolenic acid metabolism | 30% | < 0.001 | 22% | 0.045 |
| Sphingolipid metabolism | 28% | < 0.001 | 42% | < 0.001 |
| Glyoxylate and dicarboxylate metabolism | 14% | 0.63 | 51% | 0.003 |
| Nicotinate and nicotinamide metabolism | 16% | 0.47 | 38% | 0.021 |
| Sulfur metabolism | 14% | 0.62 | 69% | 0.001 |
| Aminoacyl-tRNA biosynthesis | 15% | 0.39 | 77% | < 0.001 |
| Microbial metabolitesd | 30% | 0.012 | 30% | 0.11 |
FDR, false discovery rate. aAverage magnitude (absolute value) of AD regression coefficients (from bootstrapped multivariable de-sparsified L1-regularized linear regression models) for assigned metabolites. bFDR control with q-values following set enrichment using Kolmogorov-Smirnov test. FDR≤0.05 is rounded to 3 decimal places and highlighted in gold. cPathway excluded due to not passing the threshold of at least 4 assigned metabolites. dA custom-defined set of metabolites related to microbial activity, as they are not included in human KEGG pathways.
These results are repeated with SMPDB pathways (Table 5), which provide rather better coverage, and extend the set of significant results by several pathways related to methylhistidine metabolism (histidine metabolism, β-alanine metabolism, carnosine synthesis), homocysteine metabolism (betaine metabolism, glycine, and serine metabolism), spermidine and spermine biosynthesis, and multiple pathways related to biosynthesis of triglycerides and phosphatidylethanolamines. Note that both KEGG and SMPDB pathway databases are incomplete and do not contain majority of lipid pathways.
Table 5
SMPDB Pathways Significantly Altered in AD Plasma or Frontal Cortex
| Pathway | Plasma | Cortex | ||
| Effecta | FDRb | Effecta | FDRb | |
| Glycine and Serine Metabolism | 18% | 0.036 | 71% | < 0.001 |
| beta-Alanine Metabolism | 27% | 0.030 | 47% | 0.008 |
| Ammonia Recycling | 7% | 0.21 | 57% | 0.001 |
| Glutathione Metabolism | 16% | 0.11 | 78% | 0.002 |
| Alpha Linolenic Acid and Linoleic Acid Metabolism | 21% | 0.036 | NAc | NAc |
| Arginine and Proline Metabolism | 20% | 0.06 | 50% | < 0.001 |
| Oxidation of Branched-Chain Fatty Acids | 22% | 0.032 | 62% | < 0.001 |
| Valine, Leucine, and Isoleucine Degradation | 21% | 0.010 | 68% | < 0.001 |
| Methionine Metabolism | 14% | 0.06 | 62% | < 0.001 |
| Sphingolipid Metabolism | 29% | 0.011 | 44% | < 0.001 |
| Histidine Metabolism | 31% | 0.004 | 51% | < 0.001 |
| Purine Metabolism | 11% | 0.11 | 37% | 0.041 |
| Urea Cycle | 17% | 0.08 | 58% | < 0.001 |
| Tryptophan Metabolism | 15% | 0.08 | 72% | 0.004 |
| Aspartate Metabolism | 17% | 0.09 | 47% | < 0.001 |
| Glutamate Metabolism | 16% | 0.08 | 62% | < 0.001 |
| Betaine Metabolism | 21% | 0.030 | 63% | < 0.001 |
| Spermidine and Spermine Biosynthesis | 21% | 0.036 | 46% | 0.008 |
| Carnitine Synthesis | 21% | 0.032 | 47% | 0.002 |
| Warburg Effect | 18% | 0.07 | 58% | < 0.001 |
| PE Biosynthesis PE(14:0/18:1(9Z)) | NAc | NAc | 55% | 0.008 |
| PE Biosynthesis PE(16:0/16:1(9Z)) | NAc | NAc | 55% | 0.010 |
| PE Biosynthesis PE(16:0/18:1(11Z)) | 24% | 0.036 | 56% | 0.008 |
| PE Biosynthesis PE(16:0/18:1(9Z)) | 24% | 0.036 | 56% | 0.008 |
| PE Biosynthesis PE(16:0/18:2(9Z,12Z)) | 32% | 0.036 | 62% | 0.008 |
| PE Biosynthesis PE(16:0/20:3(8Z,11Z,14Z)) | NAc | NAc | 53% | 0.008 |
| PE Biosynthesis PE(16:1(9Z)/18:1(9Z)) | 29% | 0.037 | NAc | NAc |
| PE Biosynthesis PE(18:0/20:4(5Z,8Z,11Z,14Z)) | NAc | NAc | 59% | 0.008 |
| PE Biosynthesis PE(18:1(11Z)/18:1(11Z)) | 27% | 0.036 | 57% | 0.005 |
| PE Biosynthesis PE(18:1(9Z)/16:0) | 24% | 0.036 | 56% | 0.008 |
| PE Biosynthesis PE(18:1(9Z)/18:1(9Z)) | 27% | 0.036 | 57% | 0.005 |
| PE Biosynthesis PE(18:1(9Z)/18:2(9Z,12Z)) | 27% | 0.036 | 47% | 0.07 |
| PE Biosynthesis PE(18:1(9Z)/20:3(8Z,11Z,14Z)) | NAc | NAc | 53% | 0.012 |
| PE Biosynthesis PE(18:1(9Z)/20:4(5Z,8Z,11Z,14Z)) | NAc | NAc | 48% | 0.037 |
| PE Biosynthesis PE(18:2(9Z,12Z)/18:2(9Z,12Z)) | 29% | 0.036 | 46% | 0.07 |
| PE Biosynthesis PE(18:2(9Z,12Z)/20:4(5Z,8Z,11Z,14Z)) | NAc | NAc | 52% | 0.008 |
| De Novo TG Biosynthesis TG(16:0/16:1(9Z)/18:0) | 43% | < 0.001 | NAc | NAc |
| De Novo TG Biosynthesis TG(16:0/18:1(9Z)/20:0) | 45% | < 0.001 | NAc | NAc |
| De Novo TG Biosynthesis TG(16:0/18:1(9Z)/20:1(11Z)) | 44% | < 0.001 | 32% | 0.11 |
| De Novo TG Biosynthesis TG(16:0/18:1(9Z)/18:2(9Z,12Z)) | 48% | < 0.001 | NAc | NAc |
| De Novo TG Biosynthesis TG(16:0/18:1(9Z)/20:4(5Z,8Z,11Z,14Z)) | 54% | < 0.001 | 39% | 0.035 |
| De Novo TG Biosynthesis TG(16:0/18:2(9Z,12Z)/20:1(11Z)) | 52% | < 0.001 | NAc | NAc |
| De Novo TG Biosynthesis TG(16:0/18:2(9Z,12Z)/20:4(5Z,8Z,11Z,14Z)) | 56% | < 0.001 | 43% | 0.030 |
| De Novo TG Biosynthesis TG(16:1(9Z)/18:1(9Z)/18:2(9Z,12Z)) | 45% | < 0.001 | NAc | NAc |
| De Novo TG Biosynthesis TG(16:1(9Z)/18:1(9Z)/20:4(5Z,8Z,11Z,14Z)) | 57% | < 0.001 | NAc | NAc |
| De Novo TG Biosynthesis TG(18:1(9Z)/18:2(9Z,12Z)/20:4(5Z,8Z,11Z,14Z)) | 53% | < 0.001 | 38% | 0.09 |
| De Novo TG Biosynthesis TG(16:0/18:1(9Z)/20:3(5Z,8Z,11Z)) | 52% | < 0.001 | 33% | 0.14 |
| De Novo TG Biosynthesis TG(16:0/18:1(9Z)/22:5(4Z,7Z,10Z,13Z,16Z)) | 53% | < 0.001 | NAc | NAc |
| De Novo TG Biosynthesis TG(16:0/18:1(9Z)/22:5(7Z,10Z,13Z,16Z,19Z)) | 53% | < 0.001 | NAc | NAc |
| De Novo TG Biosynthesis TG(16:0/18:2(9Z,12Z)/20:3(5Z,8Z,11Z)) | 55% | < 0.001 | NAc | NAc |
| De Novo TG Biosynthesis TG(16:0/18:2(9Z,12Z)/18:3(6Z,9Z,12Z)) | 57% | < 0.001 | 29% | 0.50 |
| De Novo TG Biosynthesis TG(16:0/18:2(9Z,12Z)/18:3(9Z,12Z,15Z)) | 57% | < 0.001 | 29% | 0.50 |
| De Novo TG Biosynthesis TG(16:0/18:2(9Z,12Z)/22:6(4Z,7Z,10Z,13Z,16Z,19Z)) | 29% | 0.036 | NAc | NAc |
| De Novo TG Biosynthesis TG(18:1(9Z)/18:2(9Z,12Z)/20:5(5Z,8Z,11Z,14Z,17Z)) | 38% | 0.001 | 18% | 0.48 |
| Microbial metabolitesd | 30% | 0.002 | 30% | 0.12 |
FDR, false discovery rate; PE, phosphatidylethanolamine; TG, triglyceride. aAverage magnitude (absolute value) of AD regression coefficients (from bootstrapped multivariable de-sparsified L1-regularized linear regression models) for assigned metabolites. bFDR control with q-values following set enrichment using Kolmogorov-Smirnov test. FDR≤0.05 is rounded to 3 decimal places and highlighted in gold. cPathway excluded due to not passing the threshold of at least 4 assigned metabolites. dA custom-defined set of metabolites related to microbial activity, as they are not included in human SMPDB pathways.
Diagnostic prediction model
Using all analytes and basic sociodemographic data (sex, age, education, BMI, APOE ɛ4), the cross-validated model achieves AUC 82% (CI95 = 75–88%), significantly more (p < 0.001) than a model with the basic sociodemographic data alone (AUC 58%, CI95 = 48–67%), which in turn is not significantly better than a random model (AUC 54%, CI95 = 45–63%) as expected (since the controls have matched distributions of sex, age, and APOE ɛ4). Interestingly, the model seems to classify females more accurately (p = 0.06) with AUC 88% (CI95 = 80–95%) versus AUC 75% (CI95 = 64–85%) for males. A model with all analytes but without basic sociodemographic data achieves almost identical performance as the full model.
Step-wise reduction of the model features (Fig. 2A) shows a stable performance up to around 120 features with AUC 83% (slight increase comparing to the full model, since feature selection reduces noise), after which the performance slowly decreases down to AUC 79% at around 20 features, followed by a rapid deterioration in performance down to AUC 70% with 2 features.
Fig. 2
Predictive Performance and Most Important Features For Plasma Samples. A) AUC of a diagnostic prediction model for AD versus controls in the plasma cohort in dependence on the number of selected features (analytes+basic sociodemographic profile: sex, age, education, BMI, APOE ɛ4). Dashed gold line shows AUC of a reference model using only basic sociodemographic profile. Dashed black line shows AUC of a reference random model. Shaded areas illustrate 95% confidence intervals. The p-value was obtained with DeLong’s test between the full model and basic model. B) Average importance (magnitude of feature contribution to the model decision) of the model features plotted against the feature rank (as ranked by consecutive feature elimination, 0 = best). The green line denotes a threshold of top 30 features, which are deatiled in (C). The color scale corresponds to the importance weight. Positive value: increased in AD; negative: decreased in AD. This figure presents results averaged over 20 randomizations to reduce random noise. Metabolic indicators: Asymmetrical arginine methylation, asymmetrically dimethylated arginine (ADMA)/arginine; Carnosine synthesis, carnosine/histidine; MCAD deficiency screen, C8/C2; 1-Methylhistidine synthesis, 1-methylhistidine/(carnosine + anserine); Proline hydroxylation, hydroxyproline/proline; SBCAD deficiency screen, C5/C0. ACs, acylcarnitines; AUC, area under receiver operating characteristic curve; 5-AVA, 5-aminovaleric acid; CE, cholesteryl ester; Cer, ceramide; Cn, acylcarnitine Cn:0; DHA, docosahexaenoic acid; DHEAS, dehydroepiandrosterone sulfate; 2MBG, 2-methylbutyrylglycinuria; MCAD, medium-chain acyl-CoA dehydrogenase; OH, hydroxylated; PC, phosphatidylcholine; PUFA, polyunsaturated fatty acid; SBCAD, short/branched-chain acyl-CoA dehydrogenase; TG, triglyceride; VLCFA, very long-chain fatty acid.
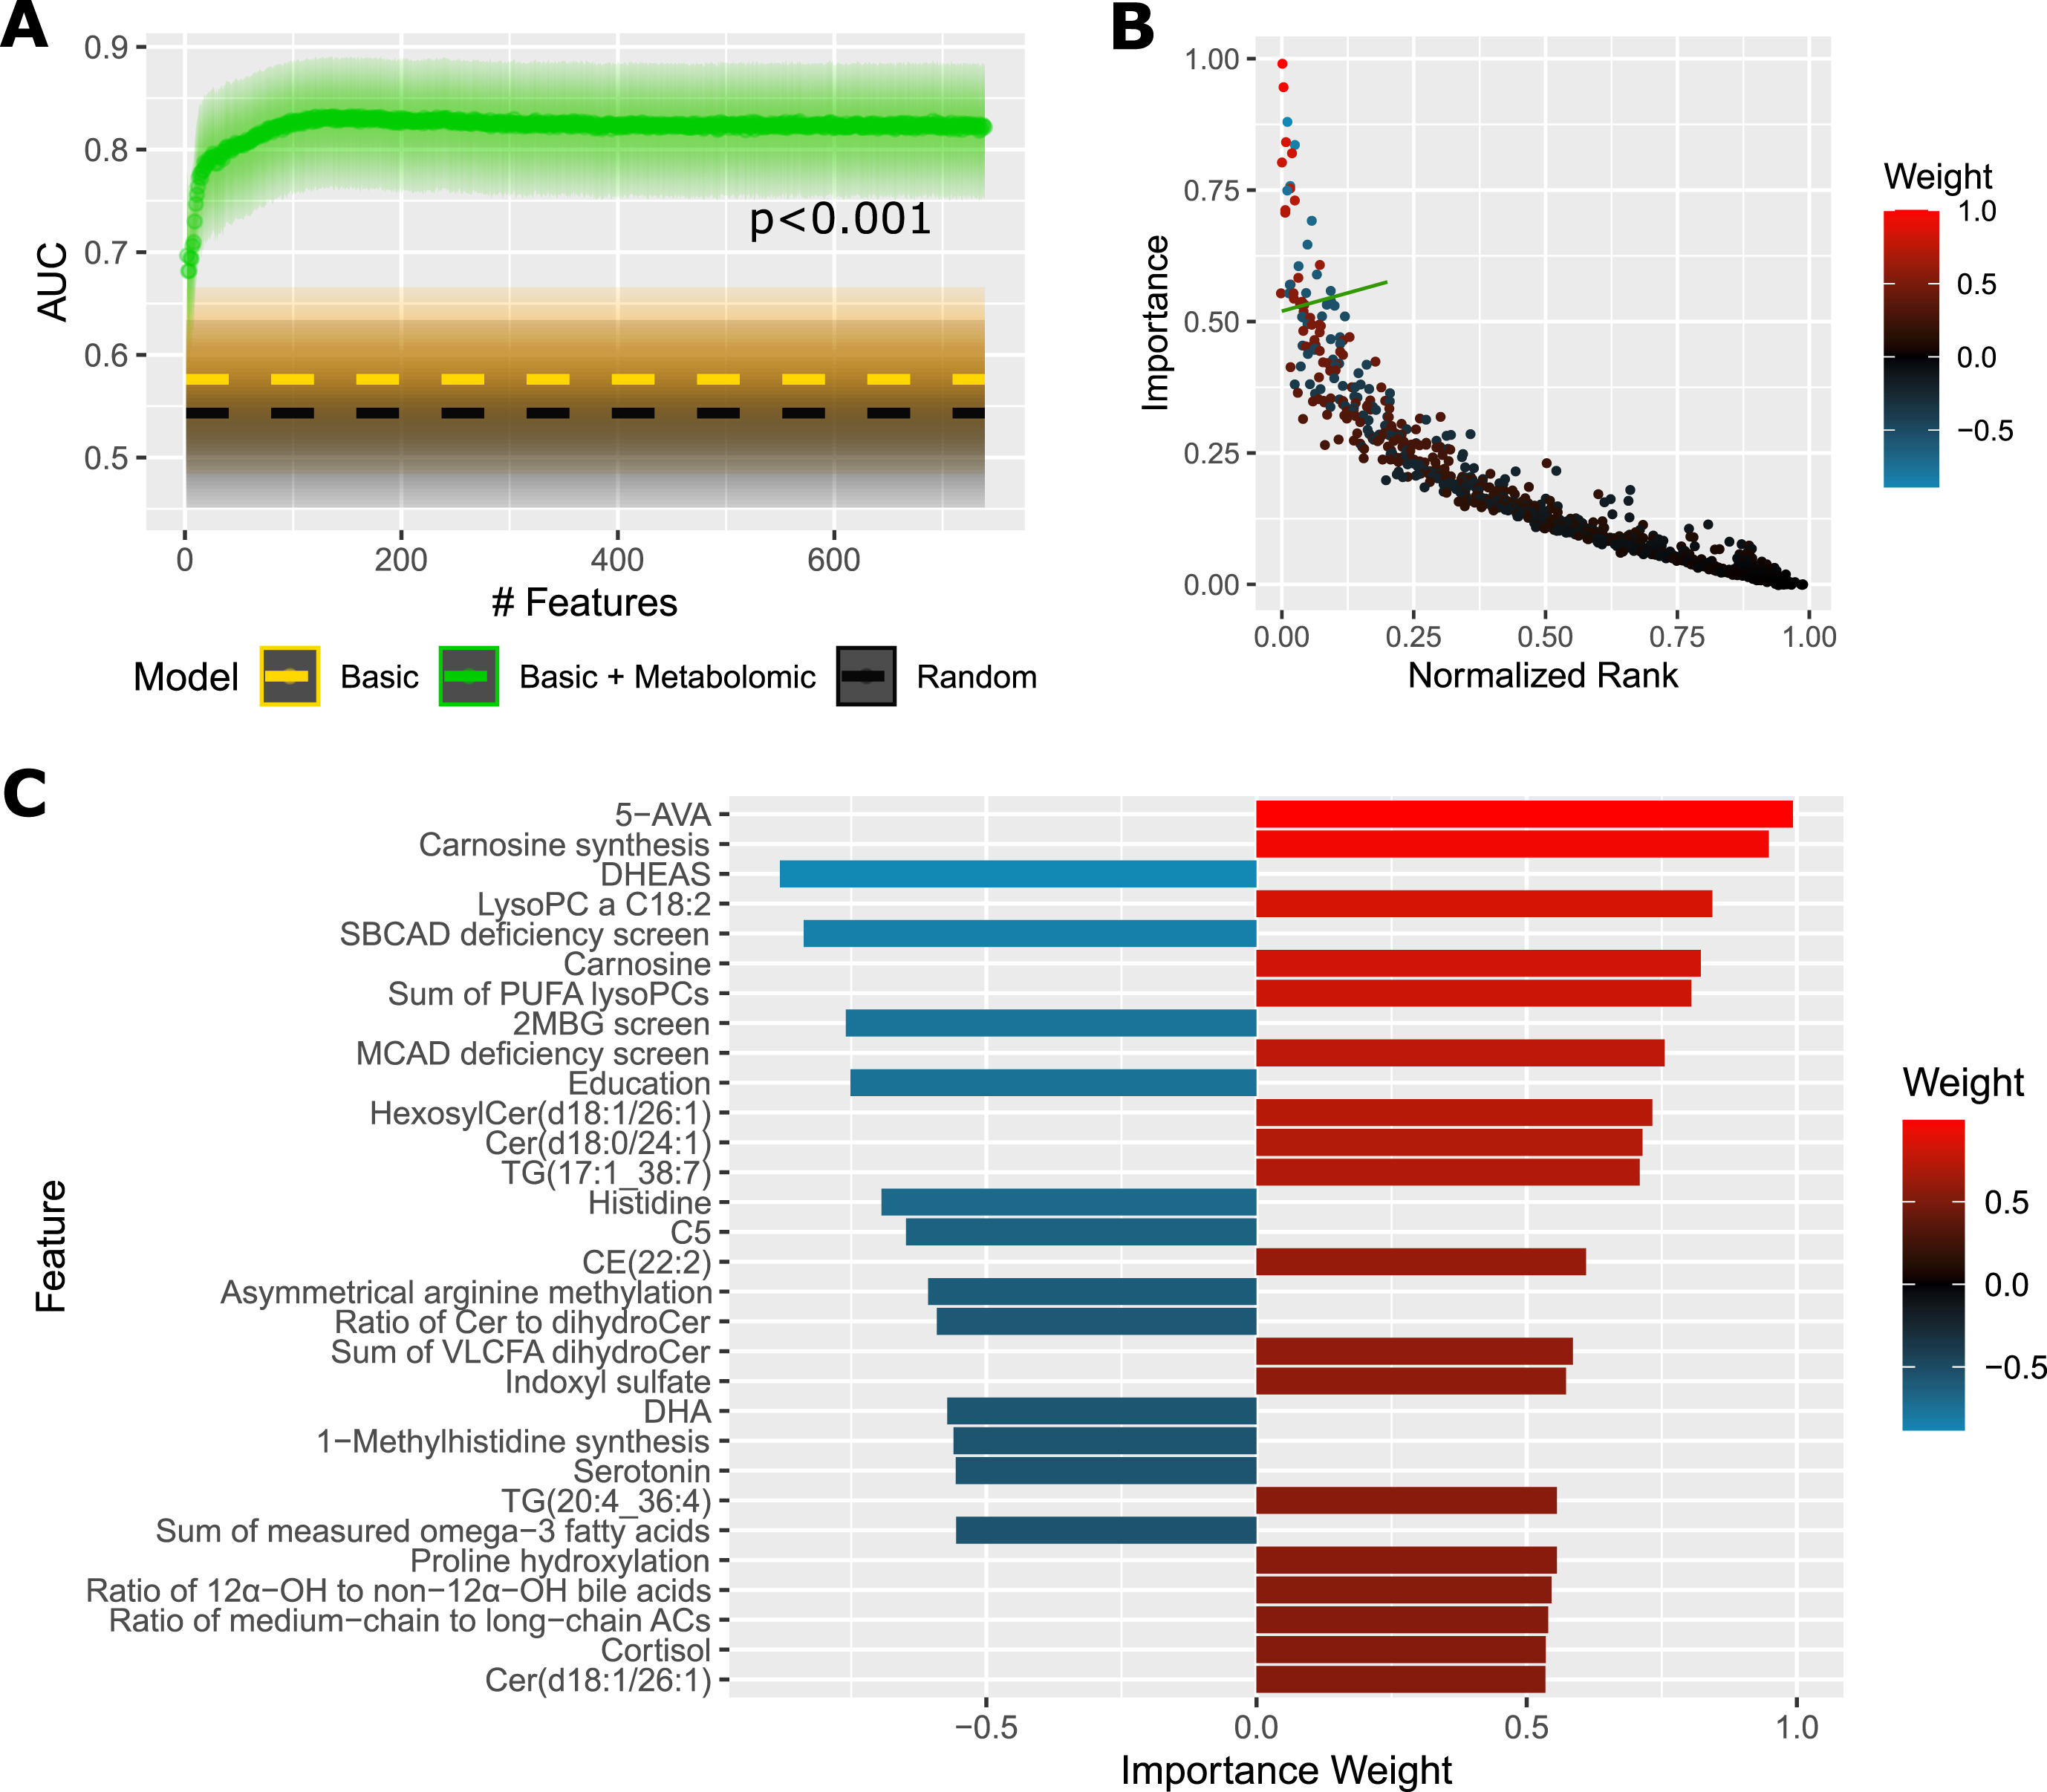
Importance plot (Fig. 2B) captures the distribution of average feature importance with respect to the feature rank during the reduction process. The top 30 features are detailed in Fig. 2C, with 5-aminovaleric acid and carnosine synthesis (ratio carnosine/histidine) being most important. We can see multiple metabolites or indicators already detected in the differential analysis: microbial metabolites, methylhistidine metabolites, omega-3 fatty acids, cortisol, proline hydroxylation, and certain lipids. Additionally, there are three metabolites not previously detected as statistically different: DHEAS, acylcarnitine C5:0, and serotonin, all of them with downregulation predictive of AD. Education is also among the top 30 features and its lower value is more characteristic of AD.
Metabolomic analysis in brain frontal cortex
Differentially altered metabolites and metabolic indicators
We found 103 metabolites and 66 indicators altered in AD brain cortex. Several of the small molecules (Table 2) are related to microbial activity: 5-aminovaleric acid (+ 0.61, CI95 = 0.23–1.01, FDR = 0.015) and indoxyl sulfate (+ 0.58, CI95 = 0.14–1.00, FDR = 0.027), while para-cresol sulfate is close to FDR significance (+ 0.50, CI95 = 0.03–0.95, FDR = 0.07).
Methylhistidine metabolism is disrupted with elevated 1-methylhistidine and decreased anserine. Homocysteine metabolism exhibits upregulated transsulfuration pathway and decreased betaine and choline. Polyamines are dysregulated by decreased putrescine and elevated spermidine, but unchanged spermine. Cortisol is elevated. Purine metabolism exhibits increased xanthine synthesis (ratio xanthine/hypoxanthine), which may indicate increased activity of xanthine oxidoreductase. Decrease in omega-3 fatty acids is close to FDR significance (EPA 0.05, DHA 0.07). Among carboxylic acids, lactic acid and succinic acid are elevated, and elevation of 3-hydroxyglutaric acid is close to FDR significance (0.06). Synthesis of multiple neurotransmitters is decreased (serotonin, γ-aminobutyric acid (GABA), dopamine precursor dihydroxyphenylalanine (DOPA)). There is a general increase across most of amino acids and their related compounds, including trans-4-hydroxyproline, kynurenine, methionine sulfoxide, α-aminoadipic acid, creatinine, and symmetric dimethylarginine (SDMA).
Among lipids (Table 3; individual lipid species are listed in Supplementary Table 1), we found elevated acylcarnitines, regardless of their saturation or length. Acyl-alkyl phosphatidylcholines are increased, whereas lysophosphatidylcholines show the opposite trend (FDR < 0.1). Several sphingomyelins are elevated as well as ceramides, especially glycosylceramides. Certain unsaturated triglycerides and diglycerides are increased. Saturated cholesteryl esters are increased, whereas polyunsaturated cholesteryl esters are decreased.
Differentially altered pathways
On the pathway level, we see alterations across many amino acid groups in KEGG (Table 4). Next, there are changes in several pathways reflecting transsulfuration, β-alanine metabolism, purine metabolism, glyoxylate and dicarboxylate metabolism, nicotinate and nicotinamide metabolism, and from lipids glycerolipid and glycerophospholipid metabolism and sphingolipid metabolism. These results are repeated with SMPDB pathways (Table 5) and further extended with betaine metabolism, spermidine and spermine biosynthesis, urea cycle and ammonia recycling, and biosynthesis of multiple triglycerides and phosphatidylethanolamines.
Diagnostic prediction model
A model with all analytes and basic sociodemographic data (sex, age, education, BMI, APOE ɛ4) achieves cross-validated performance of AUC 80% (CI95 = 69–90%), which is significantly (p = 0.018) more than a random model (AUC 53%, CI95 = 39–66%). A model with the basic sociodemographic data alone now yields AUC 64% (CI95 = 51–77%), mainly owing to the APOE ɛ4 genotype, and the full model outperforms it less significantly with p = 0.09. A model with all analytes but without basic sociodemographic data achieves almost identical performance as the full model. Again, the full model tends to classify females (AUC 88%, CI95 = 71–99%) better than males (AUC 74%, CI95 = 58–88%), but the difference is not statistically significant (p = 0.27).
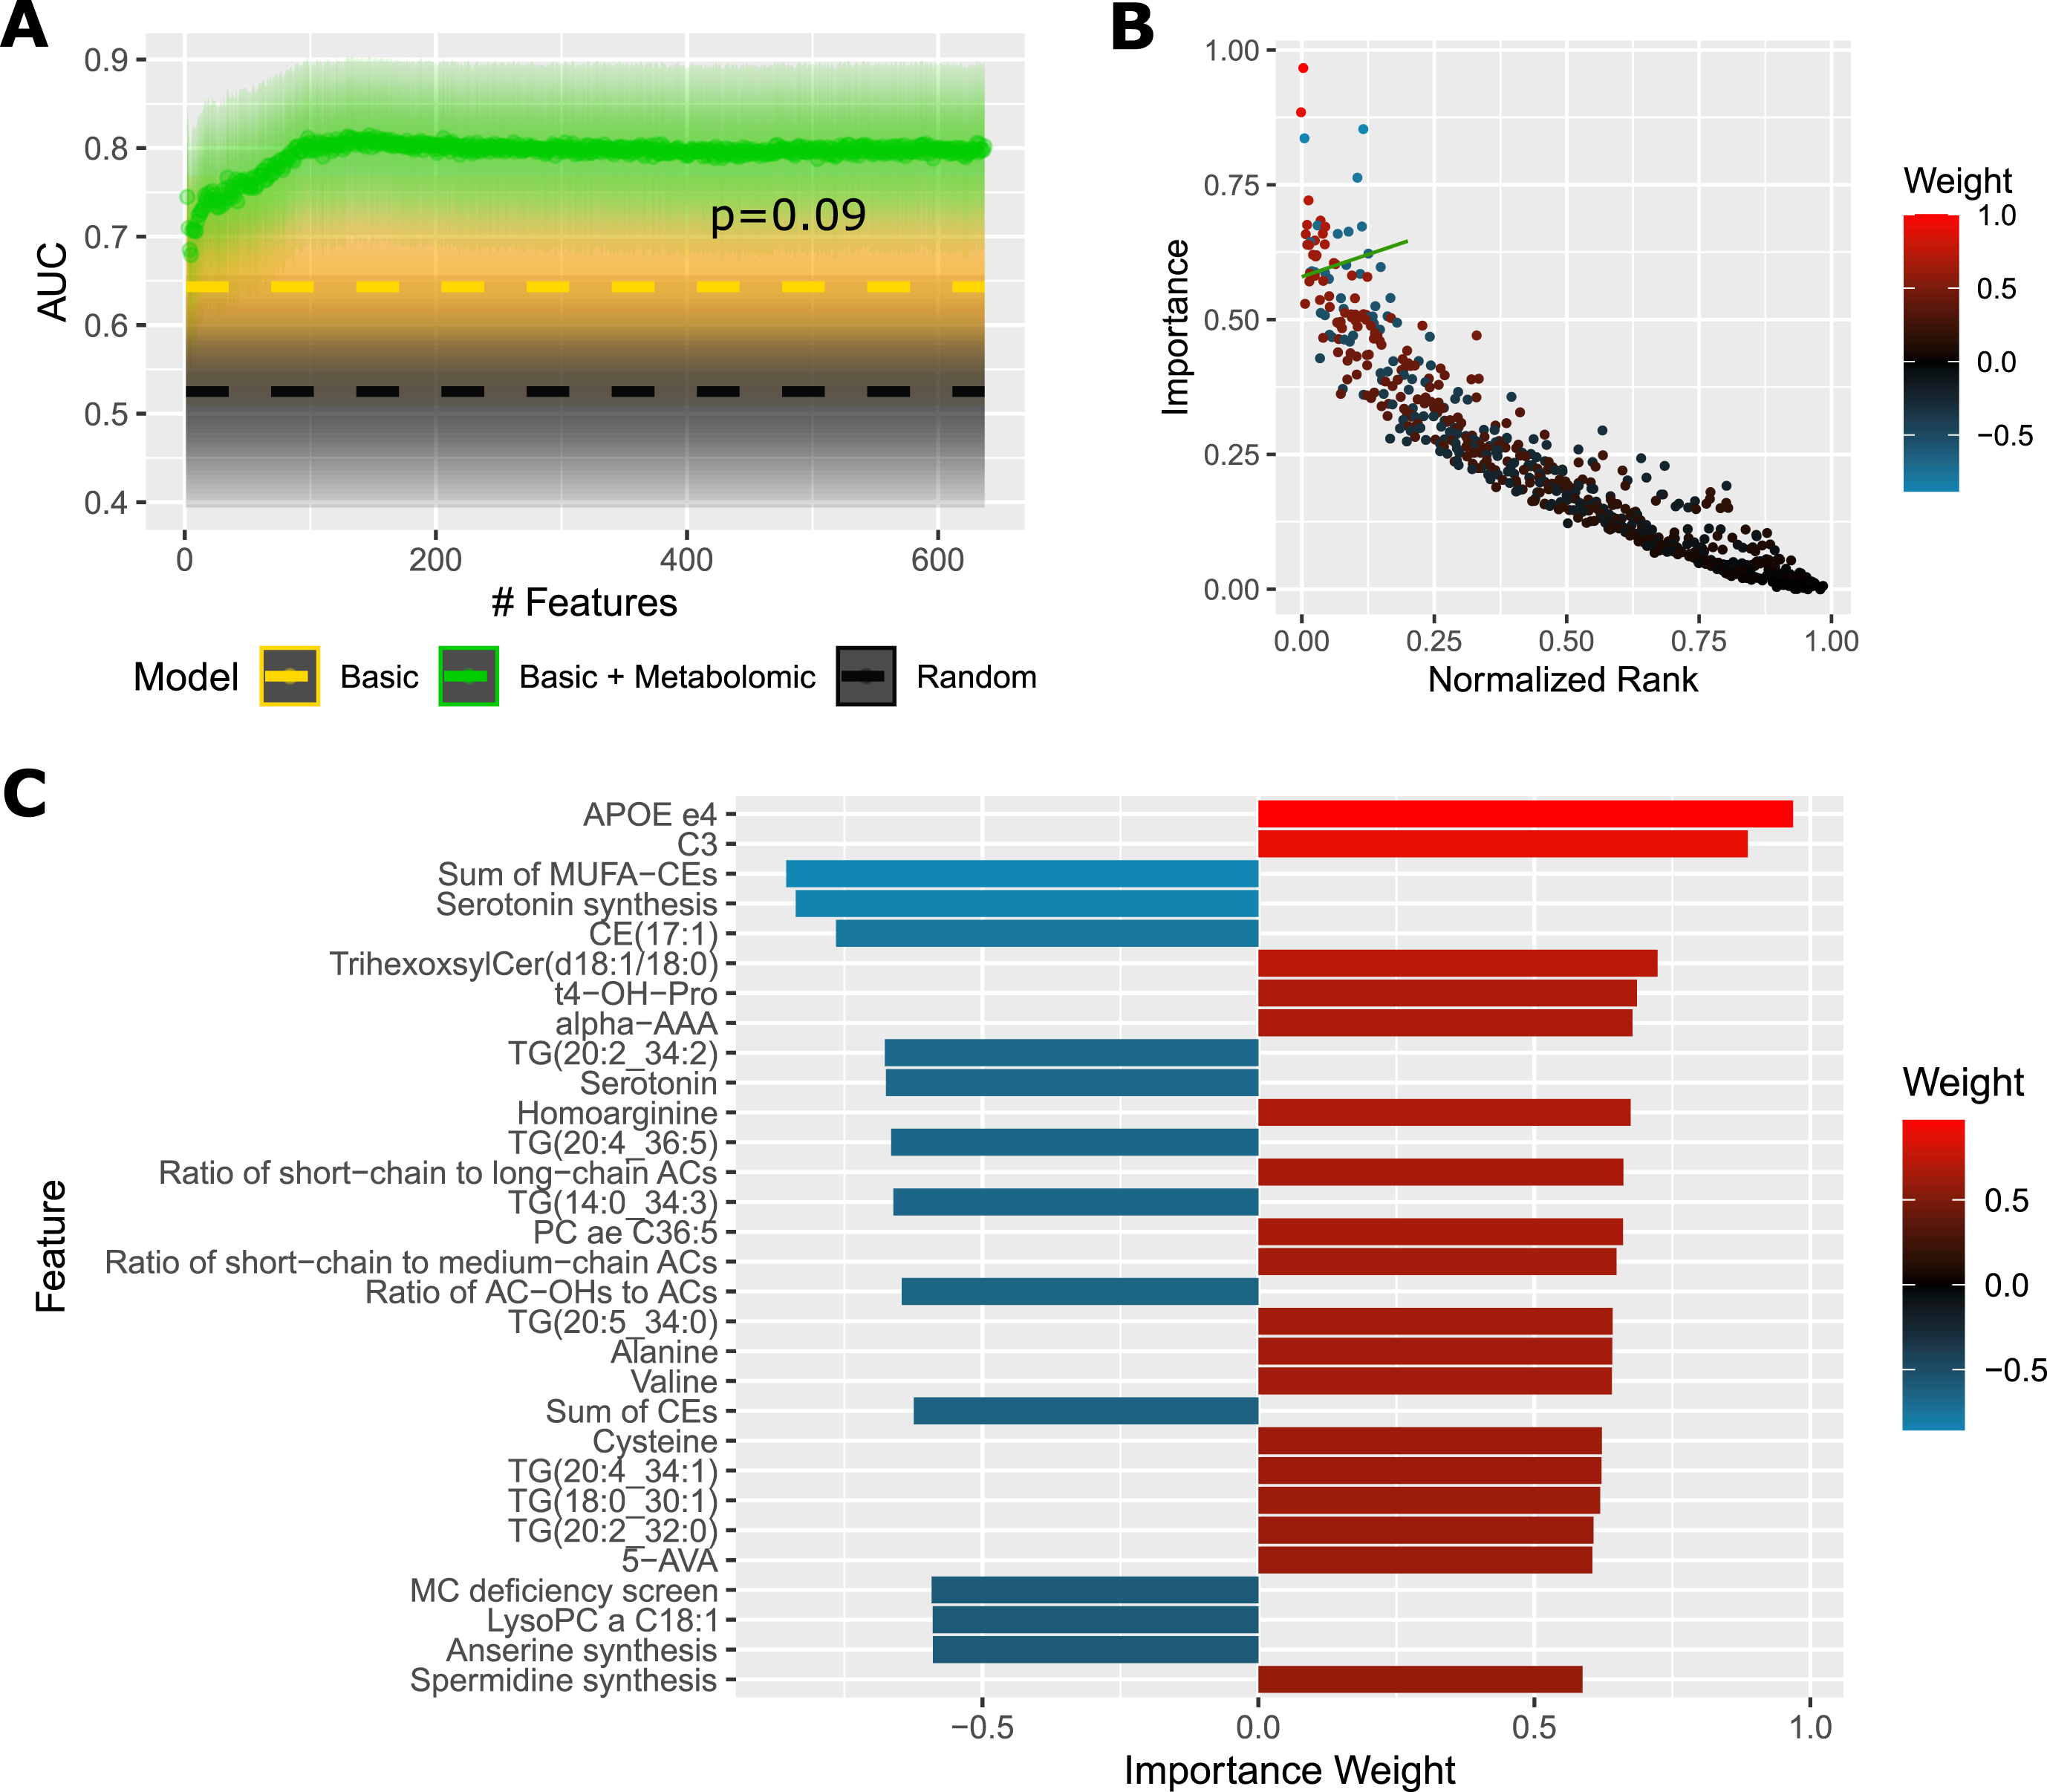
Step-wise reduction of the model features (Fig. 3A) shows a stable performance up to around 100 features with AUC 81%, after which the performance slowly decreases down to AUC 75% at around 20 features, and then further down to AUC 70% with 2 features. Importance plot (Fig. 3B) captures the distribution of average feature importance with respect to the feature rank during the reduction process. The top 30 features are detailed in Fig. 3C, with APOE ɛ4 and acylcarnitine C3:0 being most important. We can see multiple metabolites or indicators already detected in the differential analysis: lipid species and indicators including cholesterols, triglycerides, acylcarnitines, several amino acids and related products, serotonin, trans-4-hydroxyproline, 5-aminovaleric acid as well as indicators of anserine and spermidine synthesis. Several triglycerides and lysophosphatidylcholine C18:1 show a negative association with AD, which we did not capture in the statistical analysis due to lower FDR significance.
Fig. 3
Predictive Performance and Most Important Features For Cortex Samples. A) AUC (area under receiver operating characteristic curve) of a diagnostic prediction model for AD versus controls in the cortex cohort in dependence on the number of selected features (analytes + basic sociodemographic profile: sex, age, education, BMI, APOE ɛ4). Dashed gold line shows AUC of a reference model using only basic sociodemographic profile. Dashed black line shows AUC of a reference random model. Shaded areas illustrate 95% confidence intervals. The p-value was obtained with DeLong’s test between the full model and basic model. B) Average importance (magnitude of feature contribution to the model decision) of the model features plotted against the feature rank (as ranked by consecutive feature elimination, 0 = best). The green line denotes a threshold of top 30 features, which are deatiled in (C). The color scale corresponds to the importance weight. Positive value: increased in AD; negative: decreased in AD. This figure presents results averaged over 20 randomizations to reduce random noise. Metabolic indicators: Anserine synthesis, anserine/carnosine; MC deficiency screen, C16/C3; Serotonin synthesis, serotonin/tryptophan; Spermidine synthesis, spermidine/putrescine. ACs, acylcarnitines; ae, acyl-alkyl; alpha-AAA, α-aminoadipic acid; AUC, area under receiver operating characteristic curve; 5-AVA, 5-aminovaleric acid; CE, cholesteryl ester; Cer, ceramide; Cn, acylcarnitine Cn:0; OH, hydroxylated; PC, phosphatidylcholine; MC, multiple carboxylase; MUFA, monounsaturated fatty acid; t4-OH-pro, trans-4-hydroxyproline; TG, triglyceride.
DISCUSSION
We found alterations in multiple metabolites and metabolic pathways, often overlapping in plasma and brain. The diagnostic prediction models achieve moderate performance, with the top results exploiting around 100 metabolites and indicators, but with most power coming from the top 20 spread across various metabolic pathways. The performance diminishes faster when using fewer features. This supports the idea that the metabolic changes act as independent risk factors, each contributing to the outcome. Presence of APOE ɛ4 allele remains among the most important factors. Top 30 features for the plasma and brain models intersect on 5-aminovaleric acid, methylhistidine metabolism, serotonin, trans-4-hydroxyproline, and on involvement of acylcarnitines, triglycerides, lysophosphatidylcholines, and cholesteryl esters. The models tend to better classify females in both tissue cohorts and given the incidence of AD is higher among females [34], this increase seems to be reflected in metabolism, although further study is needed to confirm this trend.
In AD plasma, there are a number of microbiome-related metabolites changed. 5-Aminovaleric acid is a degradation product derived from various bacterial genera, e.g., Clostridium, Escherichia, and Corynebacterium [35, 36], but can also be produced endogenously. It has not previously been associated with AD or cognitive impairment. Para-cresol sulfate is a microbial uremic toxin inducing neuroinflammation in mice [37]. Indoles are derived from gut bacteria, by sequestering tryptophan, and indoxyl sulfate is another uremic toxin with neurotoxic effects [38]. 3-indoleacetic acid is a pro-apoptotic compound negatively associated with cognition [39]. In contrast, 3-indolepropionic acid is neuroprotective [40] and we found it decreased. Other changes include elevated trimethylamine N-oxide, which has been linked to atherosclerosis and AD [41], and decreased cholic acid with increased 7α-dehydroxylation into deoxycholic acid, mediated by gut bacteria and previously associated with cognitive decline [42], indicating higher microbial activity converting primary bile acids into pro-inflammatory secondary bile acids. The changes in microbiome-related metabolites are consistently in the pro-toxic direction and we hypothesize that they contribute to the disease etiology. Indeed, recent research reveals direct inflammatory effect of microbiota in AD [43]. We found some of these metabolites are elevated even in the AD brain; i.e., 5-aminovaleric acid, indoxyl sulfate, and with FDR = 0.07 also para-cresol sulfate. Whether the presence of microbial metabolites in brain is due to blood-brain barrier crossing or microbial invasion of CNS, it highlights the importance of studying the gut-brain interaction.
We found two dietary compounds with anti-inflammatory effects decreased in AD: omega-3 fatty acids and betaine. Reduced omega-3 fatty acids have been implicated in AD [44], possibly due to less efficient synthesis in liver [45], which can affect the microbiome composition [46]. Betaine regulates signaling pathways involved in oxidative stress and inflammation [47] and facilitates re-methylation of homocysteine, linked to atherosclerosis [48] and AD [49]. The betaine pathway may be stressed due to impaired metabolism of folate and vitamin B12 deficiency, commonly associated in AD [50]. Interestingly, betaine supplementation has been reported to provide clinical benefit in AD [51]. Altered methylation cycle flux can result in hypomethylation [52, 53] or affect polyamines by enhanced decarboxylation of S-adenosylmethionine, promoting aminopropylation. Increased polyamine spermidine in AD brain has been previously reported [54], which we also observed. In plasma, however, we found higher spermine, perhaps due to lower abundance of spermine synthase in cerebral cortex. Polyamines generally have a protective effect [55] although increased levels can promote tau condensation and neurotoxicity [56, 57], potentially contributing to AD.
Some evidence implicates spermine oxidase activity (ratio spermine/spermidine) in muscle pathophysiology [58]. Indeed, AD is associated with muscle reduction [59, 60], and we found elevated amino acids (strongly in cortex) and methylhistidine metabolites (mainly in plasma, especially 3-methylhistidine, a myofibrillar compound), indicative of muscle degradation. Other amino acid related metabolites are increased, including 3-hydroxyglutaric acid with excitotoxic properties on N-methyl-D-aspartate (NMDA) receptors [61]. Muscle activity can affect the microbiome and in turn influence neurodegeneration [62]. Musculature is also affected by androgens, known to be decreased in AD [63, 64], and negatively impacted by corticosteroids [65]. Consistent with the hypothesis of hormonal link to AD muscle loss, we found increased levels of corticosteroids and decreased DHEAS (in the diagnostic prediction model), validating previous reports [66, 67]. This increase is sometimes explained by chronic stress response or dysregulated circadian cycle and sleep disorders, a common theme in AD, negatively impacting glymphatic clearance and hippocampal volume [68]. In connection with brain function, we found decreased synthesis of neurotransmitters (serotonin, GABA, DOPA), reflecting impairment associated with depression, a common comorbidity in AD [69].
Another possible reason for neuromuscular degeneration occurring in AD is related to mitochondrial dysfunction [70–72], promoted by oxidative stress, inflammatory environment, and insulin resistance [73], which is considered to be related to AD [74]. We observed elevated acylcarnitines, key elements in mitochondrial beta-oxidation, which accumulate during mitochondrial impairment [75] and correlate with ICU-acquired muscle loss [76]. Further, aconitic acid (plasma only) and succinic acid are elevated, suggesting a disturbed mitochondrial tricarboxylic acid (TCA) cycle, possibly due to inefficient succinate dehydrogenase, which is involved in neurodegeneration and lipid accumulation [77]. Brain energy metabolism includes production and consumption of lactic acid [78], which is formed in cytosol via a pathway alternative to the TCA cycle, and we found it elevated in cortex. Lactate accumulates in inflamed tissues [79], in traumatic brain injury [80] and is implicated in accelerated production of β-amyloid peptide [81], thus possibly linked to AD.
Besides acylcarnitines, we found other lipid classes elevated in AD. Ceramides are linked to oxidative stress and mitochondrial dysfunction [82] and might directly contribute to AD [83]. Increased plasma dihydroceramides are predictive of future diabetes mellitus [84]. Glycosylceramides are abundant in neuronal tissue and their elevation has also been previously associated with AD [85]. Increased plasma lysophosphatidylcholines may reflect phospholipase A2 activity and are linked to inflammation and immunomodulation [86]. Interestingly, cortex lysophosphatidylcholines show the opposite trend, regardless of their saturation, but specifically those with long chains, whereas those with very long chains (VLCFA) all trend towards upregulation. This might be due to inefficient transport to brain via Mfsd2a transporter, which is also the main route for omega-3 fatty acids uptake, but VLCFA lysophosphatidylcholines are synthesized in brain tissue by elongases and has been shown to be unaffected in MFSD2A knock-out mice [87].
Elevated diglycerides, triglycerides, and cholesteryl esters in AD correspond to results of other studies [88, 89], although the decrease in polyunsaturated cholesteryl esters in AD brain has not been reported yet. Triglycerides are associated with xanthine oxidoreductase activity [90] and we found it similarly increased in AD brain. Overall, hyperlipidemia is considered a risk factor for AD [91], reflecting inefficient lipid degradation in lysosomes and autophagosomes [92, 93]. Lipotoxicity is further implicated in liver disease and microbiome dysbiosis [94], and in turn, liver disease is sometimes considered a contributor to AD [95].
Our findings align well with the metabolites identified by Varma et al. [6] as an intersection of associations with several AD pathology scores (ranging from future conversion to AD to histopathology markers, amyloid-β, and tau proteins). They performed a targeted study using Biocrates AbsoluteIDQ p180, a predecessor of Biocrates MxP® Quant 500 which we applied in this study. Out of 20 metabolites that they link to AD in brain, we discovered 11 (8 lipid species + 3 small molecules), 3 more lipids achieved slightly lower statistical significance (FDR≤0.06), and additional 6 lipids all clearly show a correct trend of downregulation although further from FDR significance. In great consistency, none of the metabolites show an opposite trend than they predict. For plasma, they list 16 metabolites (excluding two with inconsistent association direction), out of which we identified 6 (5 lipids +1 small molecule) and 4 more lipids with slightly lower FDR significance. For 5 metabolites we did not see any trend and 1 metabolite we identified in the opposite direction than they predict. This particular metabolite is acylcarnitine C3:0 and we found it elevated in both AD brain and plasma, whereas they found it positively associated in brain but negatively associated in plasma. Collectively, this is a good overlap considering we analyzed only clinical AD diagnosis in the plasma cohort but not other markers of AD pathology or progression as described by Varma et al.
In summary, we identified multiple metabolic changes in AD with frequent similarities between plasma and cortex indicating increased microbial toxins, oxidative stress, pro-inflammatory environment, and mitochondrial dysfunction on the one hand, and decreased protective and anti-inflammatory potential on the other hand. While the changes are often small, they provide some insight into the disease complexity and potential risk factors. For example, plasma level of 5-aminovaleric acid higher than 90% of controls poses OR = 3.5 (CI95 = 1.5–9.1). Considering the prevalence of AD in general elderly population around 10% [96], the estimated relative risk (RR) would be 2.9 (CI95 = 1.9–4.3), more than that of diabetes mellitus (RR = 1.5, CI95 = 1.2–1.8) in a meta-analysis [97]. Similarly for cortex, 5-aminovaleric acid higher than 80% of controls leads to the estimated RR = 3.0 (CI95 = 1.6–5.7). Moreover, some of the metabolic changes are modifiable, with several studies showing positive effects of specific diets on cognitive decline and risk of AD [98]. Our results encourage the design of more complex interventional strategies, targeting multiple metabolic areas simultaneously, ideally tailored to one’s metabolic profile, e.g., microbiome composition, hormonal balance, nutrients, and muscle homeostasis.
Strengths and limitations
This is the first study to date to apply the metabolomic kit Biocrates MxP® Quant 500 to study AD. The assay explores a broad spectrum of metabolic pathways together with hundreds of lipid species in 12 lipid classes. The brain samples were collected within a short postmortem interval averaging 3 h, reducing any postmortem effect. We applied advanced statistical methods to maximize statistical power of the analysis while satisfying underlying assumptions and adjusting for multiple hypothesis testing. The model controls for various clinical information as well as tissue handling factors, which are often not considered in other studies. Further, we applied a machine learning approach to test for biomarkers with a nested cross-validation for a reliable estimation of the performance. Efforts were made to minimize any potential bias.
While our analysis is broad and encompasses most areas of the human metabolome, it does not cover all metabolites within the pathways, which only narrowly-focused specialized single-pathway methods can do. This, however, does not affect the validity of our results. Second, the lipid part is performed via flow-injection with a limited number of internal standards (only several per lipid class). This is common in lipidomics and this might result in slightly higher noise and less precise quantification. Based on quality control samples, the average coefficient of variation was 14% (plasma, across 4 plates) and 10% (cortex, 2 plates) in the UHPLC-MS/MS method, and 19% (plasma) and 20% (cortex) in the FIA-MS/MS method. This is reasonable although the noise might negatively impact the predictive performance. The identification of lipid molecules provides lower resolution due to existence of potential isobaric and isomeric forms inseparable by mass spectra only. Another limitation is unavailability of any information regarding dietary regime of the subjects, which would allow to adjust for its contribution to their metabolic profiles.
Conclusion
We present evidence that AD is associated with multiple pro-toxic changes in microbial metabolites and several metabolic pathways, often overlapping in plasma and brain tissue, including metabolism of methylhistidine, homocysteine, polyamines, corticosteroids, omega-3 fatty acids, carboxylic acids, amino acids, and various lipid classes. We validated multiple previously published studies and discovered newly associated metabolites, e.g., 5-aminovaleric acid, advancing our knowledge of metabolism in AD. Overall, the results highlight the disease complexity and a plausible role of the detected metabolic dysfunctions as individual risk factors for AD due to their pathological nature.
ACKNOWLEDGMENTS
This study was made possible, in part, by the Texas Alzheimer’s Research and Care Consortium (TARCC), funded by the state of Texas through the Texas Council on Alzheimer’s Disease and Related Disorders, and by the Lyda Hill Foundation, the Aging Mind Foundation Dallas, BvB Dallas, and by the Barbara Wallace and Kelly King Charitable Foundation Trust.
We are thankful to Ivy Bolaño for her contribution to the mass spectrometry analysis. We also thank Khanh Vũ for providing access to allocated computational resources.
We are grateful to the Banner Sun Health Research Institute Brain and Body Donation Program of Sun City, Arizona for the sale of human brain tissue. The Brain and Body Donation Program is supported by the National Institute of Neurological Disorders and Stroke (U24 NS072026 National Brain and Tissue Resource for Parkinson’s Disease and Related Disorders), the National Institute on Aging (P30 AG19610 Arizona Alzheimer’s Disease Core Center), the Arizona Department of Health Services (contract 211002, Arizona Alzheimer’s Research Center), the Arizona Biomedical Research Commission (contracts 4001, 0011, 05–901 and 1001 to the Arizona Parkinson’s Disease Consortium) and the Michael J. Fox Foundation for Parkinson’s Research.
Authors’ disclosures available online (https://www.j-alz.com/manuscript-disclosures/21-5448r1).
SUPPLEMENTARY MATERIAL
[1] The supplementary material is available in the electronic version of this article: https://dx.doi.org/10.3233/JAD-215448.
REFERENCES
[1] | World Health Organization ((2021) ) Dementia. https://www.who.int/news-room/fact-sheets/detail/dementia, Last updated 2 September 2021, Accessed on October 5, 2021. |
[2] | Hersi M , Irvine B , Gupta P , Gomes J , Birkett N , Krewski D ((2017) ) Risk factors associated with the onset and progression of Alzheimer’s disease: A systematic review of the evidence. Neurotoxicology 61: , 143–187. |
[3] | Selkoe DJ , Hardy J ((2016) ) The amyloid hypothesis of Alzheimer’s disease at 25 years. EMBO Mol Med 8: , 595–608. |
[4] | Sancesario GM , Bernardini S ((2018) ) Alzheimer’s disease in the omics era. Clin Biochem 59: , 9–16. |
[5] | Sriwichaiin S , Chattipakorn N , Chattipakorn SC ((2021) ) Metabolomic alterations in the blood and brain in association with Alzheimer’s disease: Evidence from in vivo to clinical studies. J Alzheimers Dis 84: , 23–50. |
[6] | Varma VR , Oommen AM , Varma S , Casanova R , An Y , Andrews RM , O’Brien R , Pletnikova O , Troncoso JC , Toledo J , Baillie R , Arnold M , Kastenmueller G , Nho K , Doraiswamy PM , Saykin AJ , Kaddurah-Daouk R , Legido-Quigley C , Thambisetty M ((2018) ) Brain and blood metabolite signatures of pathology and progression in Alzheimer disease: A targeted metabolomics study. PLoS Med 15: , e1002482. |
[7] | Proitsi P , Kim M , Whiley L , Simmons A , Sattlecker M , Velayudhan L , Lupton MK , Soininen H , Kloszewska I , Mecocci P , Tsolaki M , Vellas B , Lovestone S , Powell JF , Dobson RJB , Legido-Quigley C ((2017) ) Association of blood lipids with Alzheimer’s disease: A comprehensive lipidomics analysis. Alzheimers Dement 13: , 140–151. |
[8] | Barupal DK , Baillie R , Fan S , Saykin AJ , Meikle PJ , Arnold M , Nho K , Fiehn O , Kaddurah-Daouk R , Alzheimer Disease Metabolomics Consortium ((2019) ) Sets of coregulated serum lipids are associated with Alzheimer’s disease pathophysiology. Alzheimers Dement (Amst) 11: , 619–627. |
[9] | Lim WLF , Huynh K , Chatterjee P , Martins I , Jayawardana KS , Giles C , Mellett NA , Laws SM , Bush AI , Rowe CC , Villemagne VL , Ames D , Drew BG , Masters CL , Meikle PJ , Martins RN , AIBL research group ((2020) ) Relationships between plasma lipids species, gender, risk factors, and Alzheimer’s disease. J Alzheimers Dis 76: , 303–315. |
[10] | Waring S , O’Bryant SE , Reisch JS , Diaz-Arrastia R , Knebl J , Doody R ((2008) ) The Texas Alzheimer’s Research Consortium longitudinal research cohort: Study design and baseline characteristics. Texas Public Health J 60: , 9–13. |
[11] | McKhann G , Drachman D , Folstein M , Katzman R , Price D , Stadlan EM ((1984) ) Clinical diagnosis of Alzheimer’s disease: Report of the NINCDS-ADRDA Work Group under the auspices of Department of Health and Human Services Task Force on Alzheimer’s Disease. Neurology 34: , 939–944. |
[12] | Hughes CP , Berg L , Danziger WL , Coben LA , Martin RL ((1982) ) A new clinical scale for the staging of dementia. Br J Psychiatry 140: , 566–572. |
[13] | Beach TG , Adler CH , Sue LI , Serrano G , Shill HA , Walker DG , Lue L , Roher AE , Dugger BN , Maarouf C , Birdsill AC , Intorcia A , Saxon-Labelle M , Pullen J , Scroggins A , Filon J , Scott S , Hoffman B , Garcia A , Caviness JN , Hentz JG , Driver-Dunckley E , Jacobson SA , Davis KJ , Belden CM , Long KE , Malek-Ahmadi M , Powell JJ , Gale LD , Nicholson LR , Caselli RJ , Woodruff BK , Rapscak SZ , Ahern GL , Shi J , Burke AD , Reiman EM , Sabbagh MN ((2015) ) Arizona Study of Aging and Neurodegenerative Disorders and brain and Body Donation Program: Arizona brain and body donation program. Neuropathology 35: , 354–389. |
[14] | The National Institute on Aging and Reagan Institute Working Group on Diagnostic Criteria for the Neuropathological Assessment of Alzheimer’s Disease ((1997) ) Consensus recommendations for the postmortem diagnosis of Alzheimer’s disease.S. Neurobiol Aging 18: , 1–2. |
[15] | Limonciel A , Ustaszewski B , Dearth S , Adam G , Buratti M , Koal T ((2020) ) MetaboINDICATOR™: Translate Metabolomics & Lipidomics into Knowledge. MetaboNews 10: , 3–5. http://www.metabonews.ca/Feb2020/MetaboNews_Feb2020.pdf |
[16] | Ripley BD ((2001) ) The R project in statistical computing. MSOR connect 1: , 23–25. |
[17] | RStudio Team ((2019) ) RStudio: Integrated Development for R, RStudio, Inc., Boston, MA. http://www.rstudio.com |
[18] | Fox J , Weisberg S ((2018) ) An R Companion to Applied Regression 3rd ed, SAGE Publications, Thousand Oaks, CA. |
[19] | Tukey JW ((1977) ) Exploratory Data Analysis, Addison-Wesley, Reading, MA. |
[20] | Wickham H ((2016) ) Ggplot2: Elegant graphics for data analysis, Springer International Publishing, Cham, Switzerland. |
[21] | Dezeure R , Bühlmann P , Meier L , Meinshausen N ((2015) ) High-dimensional inference: Confidence intervals, p-values and R-Software hdi. Stat Sci 30: , 533–558. |
[22] | Breusch TS , Pagan AR ((1979) ) A simple test for heteroscedasticity and random coefficient variation. Econometrica 47: , 1287. |
[23] | Zeileis A , Hothorn T ((2002) ) Diagnostic checking in regression relationships. R News 2: , 7–10. |
[24] | Dezeure R , Bühlmann P , Zhang C-H ((2017) ) High-dimensional simultaneous inference with the bootstrap. Test (Madr) 26: , 685–719. |
[25] | Storey JD , Bass AJ , Dabney A , Robinson D ((2019) ) Qvalue: Q-value estimation for false discovery rate control [R package qvalue version 2.18.0]. GitHub, http://github.com/jdstorey/qvalue, Last updated Jan 10, 2019, Accessed on October 5, 2021. |
[26] | Kanehisa M , Furumichi M , Tanabe M , Sato Y , Morishima K ((2017) ) KEGG: New perspectives on genomes, pathways, diseases and drugs. Nucleic Acids Res 45: , D353–D361. |
[27] | Jewison T , Su Y , Disfany FM , Liang Y , Knox C , Maciejewski A , Poelzer J , Huynh J , Zhou Y , Arndt D , Djoumbou Y , Liu Y , Deng L , Guo AC , Han B , Pon A , Wilson M , Rafatnia S , Liu P , Wishart DS ((2014) ) SMPDB 2.0: Big improvements to the Small Molecule Pathway Database. Nucleic Acids Res 42: , D478–84. |
[28] | Barupal DK , Fiehn O ((2017) ) Chemical Similarity Enrichment Analysis (ChemRICH) as alternative to biochemical pathway mapping for metabolomic datasets. Sci Rep 7: , 14567. |
[29] | Chen T , He T , Benesty M , Khotilovich V , Tang Y , Cho H , Chen K , Mitchell R , Cano I , Zhou T , Li M , Xie J , Lin M , Geng Y , Li Y ((2021) ) Xgboost: Extreme Gradient Boosting [R package version 1.4.1.1]. The Comprehensive R Archive Network, https://CRAN.R-project.org/package=xgboost, Last updated 2021-04-22, Accessed on October 5, 2021. |
[30] | Robin X , Turck N , Hainard A , Tiberti N , Lisacek F , Sanchez J-C , Müller M ((2011) ) pROC: An open-source package for R and S+ to analyze and compare ROC curves. BMC Bioinformatics 12: , 77. |
[31] | Benjamini Y , Hochberg Y ((1995) ) Controlling the false discovery rate: A practical and powerful approach to multiple testing. J R Stat Soc 57: , 289–300. |
[32] | Folstein MF , Folstein SE , McHugh PR ((1975) ) “Mini-mental state”. A practical method for grading the cognitive state of patients for the clinician. J Psychiatr Res 12: , 189–198. |
[33] | Perneczky R , Wagenpfeil S , Komossa K , Grimmer T , Diehl J , Kurz A ((2006) ) Mapping scores onto stages: Mini-mental state examination and clinical dementia rating. Am J Geriatr Psychiatry 14: , 139–144. |
[34] | Peterson A , Tom SE ((2021) ) A lifecourse perspective on female sex-specific risk factors for later life cognition. Curr Neurol Neurosci Rep 21: , 46. |
[35] | Rodionov AV , Trapezov EV , Dmitriev BA , Chakhava OV ((1988) ) Identification of 5-aminovaleric acid as a characteristic product of metabolism of various Clostridium species. Bioorg Khim 14: , 944–951. |
[36] | Shin JH , Park SH , Oh YH , Choi JW , Lee MH , Cho JS , Jeong KJ , Joo JC , Yu J , Park SJ , Lee SY ((2016) ) Metabolic engineering of Corynebacterium glutamicum for enhanced production of 5-aminovaleric acid. Microb Cell Fact 15: , 174. |
[37] | Sun C-Y , Li J-R , Wang Y-Y , Lin S-Y , Ou Y-C , Lin C-J , Wang J-D , Liao S-L , Chen C-J ((2020) ) P-cresol sulfate caused behavior disorders and neurodegeneration in mice with unilateral nephrectomy involving oxidative stress and neuroinflammation. Int J Mol Sci 21: , 6687. |
[38] | Lin Y-T , Wu P-H , Tsai Y-C , Hsu Y-L , Wang HY , Kuo M-C , Kuo P-L , Hwang S-J ((2019) ) Indoxyl sulfate induces apoptosis through oxidative stress and mitogen-activated protein kinase signaling pathway inhibition in human astrocytes. J Clin Med 8: , 191. |
[39] | Lin Y-T , Wu P-H , Lee H-H , Mubanga M , Chen C-S , Kuo M-C , Chiu Y-W , Kuo P-L , Hwang S-J ((2019) ) Indole-3 acetic acid increased risk of impaired cognitive function in patients receiving hemodialysis. Neurotoxicology 73: , 85–91. |
[40] | Chyan YJ , Poeggeler B , Omar RA , Chain DG , Frangione B , Ghiso J , Pappolla MA ((1999) ) Potent neuroprotective properties against the Alzheimer beta-amyloid by an endogenous melatonin-related indole structure, indole-3-propionic acid. J Biol Chem 274: , 21937–21942. |
[41] | Vogt NM , Romano KA , Darst BF , Engelman CD , Johnson SC , Carlsson CM , Asthana S , Blennow K , Zetterberg H , Bendlin BB , Rey FE ((2018) ) The gut microbiota-derived metabolite trimethylamine N-oxide is elevated in Alzheimer’s disease. Alzheimers Res Ther 10: , 124. |
[42] | MahmoudianDehkordi S , Arnold M , Nho K , Ahmad S , Jia W , Xie G , Louie G , Kueider-Paisley A , Moseley MA , Thompson JW , St John Williams L , Tenenbaum JD , Blach C , Baillie R , Han X , Bhattacharyya S , Toledo JB , Schafferer S , Klein S , Koal T , Risacher SL , Allan Kling M , Motsinger-Reif A , Rotroff DM , Jack J , Hankemeier T , Bennett DA , De Jager PL , Trojanowski JQ , Shaw LM , Weiner MW , Doraiswamy PM , Duijn CM , Saykin AJ , Kastenmüller G , Kaddurah-Daouk R , for the Alzheimer’s Disease Neuroimaging Initiative and the Alzheimer Disease Metabolomics Consortium ((2019) ) Altered bile acid profile associates with cognitive impairment in Alzheimer’s disease-An emerging role for gut microbiome. Alzheimers Dement 15: , 76–92. |
[43] | Shen H , Guan Q , Zhang X , Yuan C , Tan Z , Zhai L , Hao Y , Gu Y , Han C ((2020) ) New mechanism of neuroinflammation in Alzheimer’s disease: The activation of NLRP3 inflammasome mediated by gut microbiota. Prog Neuropsychopharmacol Biol Psychiatry 100: , 109884. |
[44] | Martín V , Fabelo N , Santpere G , Puig B , Marín R , Ferrer I , Díaz M ((2010) ) Lipid alterations in lipid rafts from Alzheimer’s disease human brain cortex. J Alzheimers Dis 19: , 489–502. |
[45] | Astarita G , Jung K-M , Berchtold NC , Nguyen VQ , Gillen DL , Head E , Cotman CW , Piomelli D ((2010) ) Deficient liver biosynthesis of docosahexaenoic acid correlates with cognitive impairment in Alzheimer’s disease. PLoS One 5: , e12538. |
[46] | Costantini L , Molinari R , Farinon B , Merendino N ((2017) ) Impact of omega-3 fatty acids on the gut Microbiota. Int J Mol Sci 18: , 2645. |
[47] | Zhao G , He F , Wu C , Li P , Li N , Deng J , Zhu G , Ren W , Peng Y ((2018) ) Betaine in inflammation: Mechanistic aspects and applications. Front Immunol 9: , 1070. |
[48] | Dai W , Li D , Cai Y , Qiu E , Xu J , Li J , Wang Y , Guo Y , Li Y , Jiang B , Zhang Y , Ge J , Yao C , Zhang R , Liu G , Yao G , Cai J , Zhao X ((2019) ) Association between homocysteine and multivascular atherosclerosis in stroke-related vascular beds determined by three-dimensional magnetic resonance vessel wall imaging. J Clin Neurosci 70: , 72–78. |
[49] | Seshadri S , Beiser A , Selhub J , Jacques PF , Rosenberg IH , D’Agostino RB , Wilson PWF , Wolf PA ((2002) ) Plasma homocysteine as a risk factor for dementia and Alzheimer’s disease. N Engl J Med 346: , 476–483. |
[50] | Chen H , Liu S , Ji L , Wu T , Ma F , Ji Y , Zhou Y , Zheng M , Zhang M , Huang G ((2015) ) Associations between Alzheimer’s disease and blood homocysteine, vitamin B12, and folate: A case-control study. Curr Alzheimer Res 12: , 88–94. |
[51] | Sun J , Wen S , Zhou J , Ding S ((2017) ) Association between malnutrition and hyperhomocysteine in Alzheimer’s disease patients and diet intervention of betaine. J Clin Lab Anal 31: , e22090. |
[52] | Li P , Marshall L , Oh G , Jakubowski JL , Groot D , He Y , Wang T , Petronis A , Labrie V ((2019) ) Epigenetic dysregulation of enhancers in neurons is associated with Alzheimer’s disease pathology and cognitive symptoms. Nat Commun 10: , 2246. |
[53] | Madrid A , Hogan KJ , Papale LA , Clark LR , Asthana S , Johnson SC , Alisch RS ((2018) ) DNA hypomethylation in blood links B3GALT4 and ZADH2 to Alzheimer’s disease. J Alzheimers Dis 66: , 927–934. |
[54] | Mahajan UV , Varma VR , Griswold ME , Blackshear CT , An Y , Oommen AM , Varma S , Troncoso JC , Pletnikova O , O’Brien R , Hohman TJ , Legido-Quigley C , Thambisetty M ((2020) ) Dysregulation of multiple metabolic networks related to brain transmethylation and polyamine pathways in Alzheimer disease: A targeted metabolomic and transcriptomic study. PLoS Med 17: , e1003012. |
[55] | Pegg AE ((2014) ) The function of spermine: Function of Spermine. IUBMB Life 66: , 8–18. |
[56] | Ivanov SM , Atanasova M , Dimitrov I , Doytchinova IA ((2020) ) Cellular polyamines condense hyperphosphorylated tau, triggering Alzheimer’s disease. Sci Rep 10: , 10098. |
[57] | Yatin SM , Yatin M , Varadarajan S , Ain KB , Butterfield DA ((2001) ) Role of spermine in amyloid beta-peptide-associated free radical-induced neurotoxicity. J Neurosci Res 63: , 395–401. |
[58] | Cervelli M , Leonetti A , Duranti G , Sabatini S , Ceci R , Mariottini P ((2018) ) Skeletal muscle pathophysiology: The emerging role of spermine oxidase and spermidine. Med Sci (Basel) 6: , 14. |
[59] | Burns JM , Johnson DK , Watts A , Swerdlow RH , Brooks WM ((2010) ) Reduced lean mass in early Alzheimer disease and its association with brain atrophy. Arch Neurol 67: , 428–433. |
[60] | Poehlman ET , Dvorak RV ((1998) ) Energy expenditure in Alzheimer’s disease. J Nutr Health Aging 2: , 115–118. |
[61] | Kölker S , Ahlemeyer B , Krieglstein J , Hoffmann GF ((1999) ) 3-Hydroxyglutaric and glutaric acids are neurotoxic through NMDA receptors in vitro. J Inherit Metab Dis 22: , 259–262. |
[62] | Schlegel P , Novotny M , Klimova B , Valis M ((2019) ) “Muscle-gut-brain axis”: Can physical activity help patients with Alzheimer’s disease due to microbiome modulation? J Alzheimers Dis 71: , 861–878. |
[63] | Lv W , Du N , Liu Y , Fan X , Wang Y , Jia X , Hou X , Wang B ((2016) ) Low testosterone level and risk of Alzheimer’s disease in the elderly men: A systematic review and meta-analysis. Mol Neurobiol 53: , 2679–2684. |
[64] | Rosario ER , Chang L , Stanczyk FZ , Pike CJ ((2004) ) Age-related testosterone depletion and the development of Alzheimer disease. JAMA 292: , 1431–1432. |
[65] | Martín AI , Priego T , López-Calderón A ((2018) ) Hormones and muscle atrophy. Adv Exp Med Biol 1088: , 207–233. |
[66] | Zheng B , Tal R , Yang Z , Middleton L , Udeh-Momoh C ((2020) ) Cortisol hypersecretion and the risk of Alzheimer’s disease: A systematic review and meta-analysis. Ageing Res Rev 64: , 101171. |
[67] | Aldred S , Mecocci P ((2010) ) Decreased dehydroepiandrosterone (DHEA) and dehydroepiandrosterone sulfate (DHEAS) concentrations in plasma of Alzheimer’s disease (AD) patients. Arch Gerontol Geriatr 51: , e16–8. |
[68] | Pistollato F , Sumalla Cano S , Elio I , Masias Vergara M , Giampieri F , Battino M ((2016) ) Associations between sleep, cortisol regulation, and diet: Possible implications for the risk of Alzheimer disease. Adv Nutr 7: , 679–689. |
[69] | Bennett S , Thomas AJ ((2014) ) Depression and dementia: Cause, consequence or coincidence? Maturitas 79: , 184–190. |
[70] | Marzetti E , Calvani R , Cesari M , Buford TW , Lorenzi M , Behnke BJ , Leeuwenburgh C ((2013) ) Mitochondrial dysfunction and sarcopenia of aging: From signaling pathways to clinical trials. Int J Biochem Cell Biol 45: , 2288–2301. |
[71] | Maruszak A , Żekanowski C ((2011) ) Mitochondrial dysfunction and Alzheimer’s disease. Prog Neuropsychopharmacol Biol Psychiatry 35: , 320–330. |
[72] | Lee J , Kim Y , Liu T , Hwang YJ , Hyeon SJ , Im H , Lee K , Alvarez VE , McKee AC , Um S-J , Hur M , Mook-Jung I , Kowall NW , Ryu H ((2018) ) SIRT3 deregulation is linked to mitochondrial dysfunction in Alzheimer’s disease. Aging Cell 17: , e12679. |
[73] | Nisr RB , Shah DS , Ganley IG , Hundal HS ((2019) ) Proinflammatory NFkB signalling promotes mitochondrial dysfunction in skeletal muscle in response to cellular fuel overloading. Cell Mol Life Sci 76: , 4887–4904. |
[74] | Shieh JC-C , Huang P-T , Lin Y-F ((2020) ) Alzheimer’s disease and diabetes: Insulin signaling as the bridge linking two pathologies. Mol Neurobiol 57: , 1966–1977. |
[75] | McGill MR , Li F , Sharpe MR , Williams CD , Curry SC , Ma X , Jaeschke H ((2014) ) Circulating acylcarnitines as biomarkers of mitochondrial dysfunction after acetaminophen overdose in mice and humans. Arch Toxicol 88: , 391–401. |
[76] | Kemp PR , Paul R , Hinken AC , Neil D , Russell A , Griffiths MJ ((2020) ) Metabolic profiling shows pre-existing mitochondrial dysfunction contributes to muscle loss in a model of ICU-acquired weakness. J Cachexia Sarcopenia Muscle 11: , 1321–1335. |
[77] | Jodeiri Farshbaf M , Kiani-Esfahani A ((2018) ) Succinate dehydrogenase: Prospect for neurodegenerative diseases. Mitochondrion 42: , 77–83. |
[78] | Magistretti PJ , Allaman I ((2018) ) Lactate in the brain: From metabolic end-roduct to signalling molecule. Nat Rev Neurosci 19: , 235–249. |
[79] | Haas R , Smith J , Rocher-Ros V , Nadkarni S , Montero-Melendez T , D’Acquisto F , Bland EJ , Bombardieri M , Pitzalis C , Perretti M , Marelli-Berg FM , Mauro C ((2015) ) Lactate regulates metabolic and pro-inflammatory circuits in control of T cell migration and effector functions. PLoS Biol 13: , e1002202. |
[80] | Makoroff KL , Cecil KM , Care M , Ball WS Jr ((2005) ) Elevated lactate as an early marker of brain injury in inflicted traumatic brain injury. Pediatr Radiol 35: , 668–676. |
[81] | Xiang Y , Xu G , Weigel-Van Aken KAK ((2010) ) Lactic acid induces aberrant amyloid precursor protein processing by promoting its interaction with endoplasmic reticulum chaperone proteins. PLoS One 5: , e13820. |
[82] | Law BA , Liao X , Moore KS , Southard A , Roddy P , Ji R , Szulc Z , Bielawska A , Schulze PC , Cowart LA ((2018) ) Lipotoxic very-long-chain ceramides cause mitochondrial dysfunction, oxidative stress, and cell death in cardiomyocytes. FASEB J 32: , 1403–1416. |
[83] | Jazvinšćak Jembrek M , Hof PR , Šimić G ((2015) ) Ceramides in Alzheimer’s disease: Key mediators of neuronal apoptosis induced by oxidative stress and Aβ accumulation. Oxid Med Cell Longev 2015: , 346783. |
[84] | Wigger L , Cruciani-Guglielmacci C , Nicolas A , Denom J , Fernandez N , Fumeron F , Marques-Vidal P , Ktorza A , Kramer W , Schulte A , Le Stunff H , Liechti R , Xenarios I , Vollenweider P , Waeber G , Uphues I , Roussel R , Magnan C , Ibberson M , Thorens B ((2017) ) Plasma dihydroceramides are diabetes susceptibility biomarker candidates in mice and humans. Cell Rep 18: , 2269–2279. |
[85] | Chan RB , Oliveira TG , Cortes EP , Honig LS , Duff KE , Small SA , Wenk MR , Shui G , Di Paolo G ((2012) ) Comparative lipidomic analysis of mouse and human brain with Alzheimer disease. J Biol Chem 287: , 2678–2688. |
[86] | Liu P , Zhu W , Chen C , Yan B , Zhu L , Chen X , Peng C ((2020) ) The mechanisms of lysophosphatidylcholine in the development of diseases. Life Sci 247: , 117443. |
[87] | Wong BH , Chan JP , Cazenave-Gassiot A , Poh RW , Foo JC , Galam DLA , Ghosh S , Nguyen LN , Barathi VA , Yeo SW , Luu CD , Wenk MR , Silver DL ((2016) ) Mfsd2a is a transporter for the essential ω-3 fatty acid docosahexaenoic acid (DHA) in eye and is important for photoreceptor cell development. J Biol Chem 291: , 10501–10514. |
[88] | Agarwal M , Khan S ((2020) ) Plasma lipids as biomarkers for Alzheimer’s disease: A systematic review. Cureus 12: , e12008. |
[89] | Wood PL , Medicherla S , Sheikh N , Terry B , Phillipps A , Kaye JA , Quinn JF , Woltjer RL ((2015) ) Targeted lipidomics of Fontal cortex and plasma diacylglycerols (DAG) in mild cognitive impairment and Alzheimer’s disease: Validation of DAG accumulation early in the pathophysiology of Alzheimer’s disease. J Alzheimers Dis 48: , 537–546. |
[90] | Battelli MG , Bortolotti M , Polito L , Bolognesi A ((2018) ) The role of xanthine oxidoreductase and uric acid in metabolic syndrome. Biochim Biophys Acta Mol Basis Dis 1864: , 2557–2565. |
[91] | Luchsinger JA , Mayeux R ((2004) ) Cardiovascular risk factors and Alzheimer’s disease. Curr Atheroscler Rep 6: , 261–266. |
[92] | Zhang Y , Chen X , Zhao Y , Ponnusamy M , Liu Y ((2017) ) The role of ubiquitin proteasomal system and autophagy-lysosome pathway in Alzheimer’s disease. Rev Neurosci 28: , 861–868. |
[93] | Hung COY , Livesey FJ ((2018) ) Altered γ-secretase processing of APP disrupts lysosome and autophagosome function in monogenic Alzheimer’s disease. Cell Rep 25: , 3647–3660.e2. |
[94] | Marra F , Svegliati-Baroni G ((2018) ) Lipotoxicity and the gut-liver axis in NASH pathogenesis. J Hepatol 68: , 280–295. |
[95] | Bassendine MF , Taylor-Robinson SD , Fertleman M , Khan M , Neely D ((2020) ) Is Alzheimer’s disease a liver disease of the brain? J Alzheimers Dis 75: , 1–14. |
[96] | Plassman BL , Langa KM , Fisher GG , Heeringa SG , Weir DR , Ofstedal MB , Burke JR , Hurd MD , Potter GG , Rodgers WL , Steffens DC , Willis RJ , Wallace RB ((2007) ) Prevalence of dementia in the United States: The aging, demographics, and memory study. Neuroepidemiology 29: , 125–132. |
[97] | Cheng G , Huang C , Deng H , Wang H ((2012) ) Diabetes as a risk factor for dementia and mild cognitive impairment: A meta-analysis of longitudinal studies: Diabetes and cognitive function. Intern Med J 42: , 484–491. |
[98] | Van den Brink AC , Brouwer-Brolsma EM , Berendsen AAM , van de Rest O ((2019) ) The Mediterranean, Dietary Approaches to Stop Hypertension (DASH), and Mediterranean-DASH Intervention for Neurodegenerative Delay (MIND) diets are associated with less cognitive decline and a lower risk of Alzheimer’s disease-A review. Adv Nutr 10: , 1040–1065. |


