
Stage-Dependent Cerebral Blood Flow and Leukoaraiosis Couplings in Subcortical Ischemic Vascular Disease and Alzheimer’s Disease
Abstract
Background:
Alzheimer’s disease (AD) and subcortical ischemic vascular disease (SIVD) have both been associated with white matter hyperintensities (WMHs) and altered cerebral blood flow (CBF) although the etiology of AD is still unclear.
Objective:
To test the hypothesis that CBF and WMHs have differential effects on cognition and that the relationship between CBF and WMHs changes with the subtypes and stages of dementia.
Methods:
Forty-two patients with SIVD, 50 patients with clinically-diagnosed AD, and 30 cognitively-normal subjects were included. Based on the Clinical Dementia Rating (CDR), the patients were dichotomized into early-stage (CDR = 0.5) and late-stage (CDR = 1 or 2) groups. CBF and WMH metrics were derived from magnetic resonance imaging and correlated with cognition.
Results:
Hierarchical linear regression revealed that CBF metrics had distinct contribution to global cognition, memory, and attention, whereas WMH metrics had distinct contribution to executive function (all p < 0.05). In SIVD, the WMHs in frontotemporal areas correlated with the CBF in bilateral thalami at the early stage; the correlation then became between the WMHs in basal ganglia and the CBF in frontotemporal areas at the late stage. A similar corticosubcortical coupling was observed in AD but involved fewer areas.
Conclusion:
A stage-dependent coupling between CBF and WMHs was identified in AD and SIVD, where the extent of cortical WMHs correlated with subcortical CBF for CDR = 0.5, whereas the extent of subcortical WMHs correlated with cortical CBF for CDR = 1–2.
INTRODUCTION
Cerebral blood flow (CBF) plays a critical role in maintaining brain function. Perturbed CBF has been associated with various neurological disorders such as stroke and dementia. While an acute drop of CBF commonly leads to a stroke event, a chronic reduction of CBF could result in cerebral atrophy [1] and leukoaraiosis [2] that are commonly associated with dementia formation [3, 4]. Also known as white matter hyperintensities (WMHs) due to their bright appearance in fluid-attenuated inversion recovery magnetic resonance imaging, leukoaraiosis refers to the morphological changes in white matter with the major etiopathogenesis being vascular and related to endothelial dysfunction in penetrating arterioles. However, leukoaraiosis may not always be cognitively-nocuous as its existence is prevalent among middle-aged subjects with normal cognition [5, 6], and the exact threshold of leukoaraiosis to trigger cognitive impairment remains undetermined [7, 8].
Vascular dementia is the second most common cause of dementia after Alzheimer’s disease (AD) [9]. Subcortical ischemic vascular disease (SIVD) is a subtype of vascular dementia characterized by lacunes and extensive leukoaraiosis in subcortical regions. Pathological examinations of SIVD showed lipohyalinosis and segmental arterial disorganization, suggesting the pathogenic role of incomplete infarct [10]. Therefore, CBF change may occur along the course of leukoaraiosis formation and may serve as a potential biomarker for early detection of SIVD. On the other hand, leukoaraiosis has also been reported in a considerable portion of patients with AD [7]. While current investigation of AD pathogenesis is mainly focused on the cascaded interactions with amyloid plaque and neurofibrillary tangles [11], a growing body of evidence also supports the complementary vascular hypothesis where compromised CBF may impede cognitive function through vascular-derived insults [12] or disrupted clearance pathway of beta-amyloid to synergistically cause neurotoxicity [13].
Despite the vascular pathogenesis of leukoaraiosis, the interplay of CBF alteration and leukoaraiosis has yet to be elucidated in different types of dementia. Differential imaging diagnostics of dementia have clinical relevance in that they may improve cognitive prognosis via early initiation of disease-modifying treatment. Therefore, the purpose of this study was to investigate the differential effect of CBF and WMHs on cognition, and to test the hypothesis that the relationship between CBF and WMHs is dependent on the stages as well as the subtypes of dementia (AD and SIVD).
MATERIALS AND METHODS
Participants
Forty-two patients with SIVD, 50 patients with clinically-diagnosed AD, and 30 subjects with normal cognition (NC) were consecutively and prospectively enrolled. The inclusion and exclusion criteria were similar to previously published [14]. In brief, participants with cognitive complaints and Mini-Mental State Examination (MMSE) score ≤26 [15] were considered eligible for the patient group; participants with MMSE > 26 and without cognitive complaints were included in the NC group. The patient group was further divided into SIVD and AD groups according to the Research Criteria for SIVD [16] and the diagnostic guidelines of AD issued by the National Institute on Aging-Alzheimer’s Association [17]. The Hachinski Ischemic Scale [10] was ≤4 for the SIVD group and ≥7 for the AD group in this study. Patients with mixed dementia or other dementia subtypes were excluded. Subjects whose magnetic resonance angiography showed significant intracranial artery stenosis or occlusion were excluded. This study was approved by the Institutional Review Board at Taichung Tzu Chi Hospital. Informed consents were obtained from all participants. All participants were right-handed.
Cognitive evaluation
To evaluate global cognition, the MMSE [15] and Cognitive Abilities Screening Instrument (CASI) [18] were administered, with higher scores indicating better performance. A certified clinical neuropsychologist performed the Clinical Dementia Rating (CDR) to evaluate the stage of dementia. Through a structured interview with a reliable informant, six domains of cognitive and functional performance were probed to yield an overall score: 0 for the absence of cognitive impairment; 0.5, 1, 2, and 3 for very-mild, mild, moderate, and severe dementia, respectively. All participants completed CASI, MMSE, and CDR evaluations.
Aside from global cognition, three cognitive do-mains were evaluated separately. The Chinese Version Verbal Learning Test (CVVLT) was used for the memory domain. The total score of the Taiwanese Frontal Assessment Battery [19] and digit span [20], and the time on completion of the Color Trial Test 1 and 2 were used for the executive function. The correct and error numbers of the Symbol Digit Modality Test [21], and the mean reaction time and error rate of the Attention Network Test [22] were used for the attention domain. These scores were transformed to composite z scores according to the mean and standard deviation for all participants included in this study. Composite z score transformation was adopted for its greater reliability than using a single test to determine the target cognitive construct [23]. For each domain, a higher z score indicated better cognitive performance. The number of participants (SIVD/AD/NC) who completed domain-specific evaluation was 41/48/30 in memory, 38/41/30 in executive function, and 38/44/30 in attention.
Magnetic resonance imaging protocol
All participants were requested to refrain from food containing caffeine [24] on the day of receiving brain imaging on a 3-Tesla magnetic resonance scanner (Discovery MR750, GE Medical Systems). The imaging protocol included three-dimensional T1-weighted imaging (3D-T1), T2-weighted fluid-attenuated inversion recovery imaging (T2-FLAIR), magnetic resonance angiography, and pseudo-continuous arterial spin-labeling (PCASL) imaging. For 3D-T1, fast-spoiled gradient echo was used with repetition time (TR) of 7.904 ms, echo time (TE) of 3.06 ms, inversion time (TI) of 450 ms, flip angle of 12°, and matrix size of 240×240×160 with isotropic voxel size of 1 mm3. For T2-FLAIR, TR = 12000 ms, TE = 120 ms, TI = 2200 ms, matrix size = 384×224, slice thickness = 5 mm, and 21 slices. For PCASL imaging, TR = 4500 ms, TE = 10 ms, post-labeling delay = 1525 ms, matrix size = 128×128, and slice thickness = 5 mm. Maps of quantitative CBF (ml/100 g/min) were generated on the GE workstation (version 9.4).
Assessment of WMHs and CBF
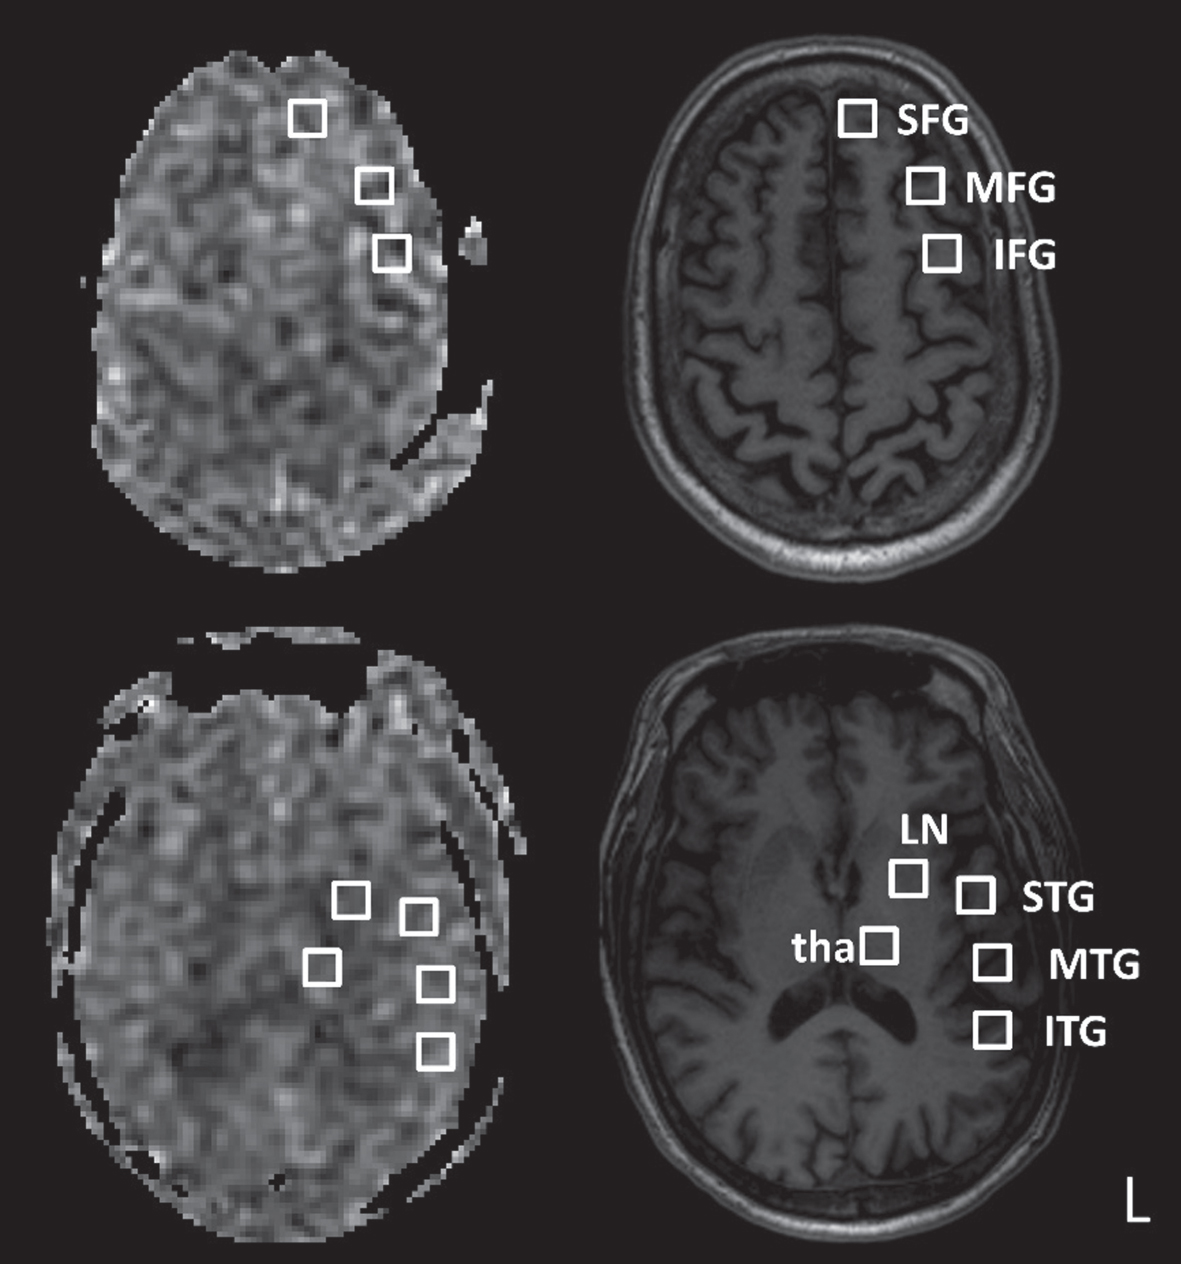
A licensed clinical neurologist assessed WMHs and CBF on the GE workstation. On T2-FLAIR images, four anatomical areas including the frontal lobe, parieto-occipital lobe, temporal lobe, and basal ganglia (BG) were rated on a scale of 0 to 3 based on the degree of confluence and/or the size/number of WMHs [25]. Two hemispheres were rated separately and then averaged for each area. The infratentorial area was excluded due to its relatively limited impact on cognition. On CBF maps, the rater manually placed 16 equal-sized square regions of interest (ROIs) for the following areas and in both hemispheres (total area = 1408 mm2 for each subject): the superior frontal gyrus (SFG), middle frontal gyrus (MFG), inferior frontal gyrus (IFG), superior temporal gyrus (STG), middle temporal gyrus (MTG), inferior temporal gyrus (ITG), lentiform nucleus (LN), and thalamus (Fig. 1). Regions containing signals from large arteries were avoided. Mean CBF was calculated for the frontal, temporal, and BG areas by averaging the ROIs within the corresponding areas. The above measurements were repeated after two weeks to test the reliability of the obtained metrics.
Fig. 1
Example regions of interest in the left hemisphere. Cerebral blood flow maps (left column) and corresponding T1-weighted images (right column) are shown for two axial slices. SFG, superior frontal gyrus; MFG, middle frontal gyrus; IFG, inferior frontal gyrus; STG, superior temporal gyrus; MTG, middle temporal gyrus; ITG, inferior temporal gyrus; LN, lentiform nucleus; tha, thalamus. The regions of interest are of equal size.
Statistical analysis
The chi-square test and one-way analysis of variance were used to compare demographics. The intra-class correlation coefficient (ICC) was used to examine the test-retest reliability of WMHs and CBF measurement, with ICC between 0.5 and 0.75, between 0.75 and 0.9, and greater than 0.90, indicating moderate, good, and excellent reliability, respectively. The analysis of covariance was used to examine between-group differences by controlling for age, education level, and symptom duration as covariates. The main effect was examined by the Bonferroni method, and the effect size estimate (partial eta-squared,
RESULTS
Demographics (Table 1)
The one-way analysis of variance revealed group differences in age, education level, and symptom duration (all p < 0.001). Post-hoc tests further showed AD > SIVD > NC in age and AD > SIVD in symptom duration; education level was higher in the NC group than patient groups, but there was no difference between the two patient groups. The effects of age, education level, and symptom duration were controlled in the following group comparisons.
Table 1
Demographics of participants
| SIVD | AD | NC | p | Post Hoc | |
| N = 42 | N = 50 | N = 30 | |||
| Age (y) | 73±8.7 | 77±5.0 | 70±6.1 | < 0.001 | AD > SIVD > NC |
| Education (y) | 6±4.4 | 5±4.6 | 9±4.1 | < 0.001 | NC > SIVD/AD |
| Duration (y) | 1.5±1.56 | 2.5±2.22 | 0±0.00 | < 0.001 | AD > SIVD > NC |
| Gender (Male/Female) | 19/23 | 16/34 | 15/15 | 0.224 |
Data are presented as mean±standard deviation. Groups are compared using the analysis of variance and chi-square test where appropriate. p values < 0.05 are marked in bold. The Tukey test is used for post-hoc analysis. SIVD, subcortical ischemic vascular disease; AD, Alzheimer’s disease; NC, normal cognition.
Cognitive construct of participants (Table 2)
The analysis of covariance revealed a significant group effect on both global and domain-specific cognitive scores (all p < 0.001). In global cognition, the SIVD and AD groups performed comparably but both did worse than the NC group. In domain-specific tests, the SIVD and AD groups performed worse than the NC group in all the domains investigated. As compared with the AD group, the SIVD group performed comparably in memory, but worse in executive function and attention.
Table 2
Group comparison of cognitive performance
| SIVD | AD | NC | ANCOVA | Post Hoc | ||
| N = 42 | N = 50 | N = 30 | p | |||
| Global Cognition Status | ||||||
| Clinical Dementia Rating sum of box | 4.6±3.71 | 5.0±2.89 | 0±0.0 | < 0.001 | 0.13 | SIVD/AD > NC |
| Mini-Mental State Exam | 19±5.0 | 19±5.4 | 28±1.0 | < 0.001 | 0.24 | SIVD/AD < NC |
| Cognitive Abilities Screening Instrument | 63±14.5 | 59±18.2 | 89±4.6 | < 0.001 | 0.24 | SIVD/AD < NC |
| Domain-specific Evaluation | ||||||
| Memory | –0.8±3.63 | –2.3±3.48 | 4.9±2.89 | < 0.001 | 0.28 | SIVD/AD < NC |
| Executive Function | –1.4±2.55 | –0.6±2.57 | 3.7±1.43 | < 0.001 | 0.32 | SIVD < AD < NC |
| Attention | –1.3±2.30 | –0.5±2.61 | 2.7±1.79 | < 0.001 | 0.21 | SIVD < AD < NC |
Data are presented as mean±standard deviation. Groups are compared using the one-way analysis of covariance (ANCOVA), controlling for age, education, and symptom duration. p values < 0.05 are marked in bold. Domain-specific evaluation is based on composite z scores: Memory = summation of (i) total immediate recall, (ii) best immediate recall, (iii) trial 4 (the last trial of recall), (iv) recall after 30 s, and (v) recall after 10 min of the Chinese Version Verbal Learning Test; Executive function = summation of (i) total score of the Taiwanese Frontal Assessment Battery, (ii) total score of the Digit Span Task, (iii) time on completion of the Color Trial Test 1, and (iv) time on completion of the Color Trial Test 2; Attention = summation of (i) number of correct answers and (ii) errors in the Symbol Digit Modality Test, and (iii) hit reaction time and (iv) number of errors in the Attention Network Test. SIVD, subcortical ischemic vascular disease; AD, Alzheimer’s disease; NC, normal cognition.
Intra-rater reliability of WMHs and CBF metrics
The ICC was 0.61–0.96 for WMHs assessment (mean = 0.83, 0.90, and 0.91 in SIVD, AD, and NC, respectively) and 0.75–0.97 for CBF measurement (mean = 0.84, 0.89, and 0.92 in SIVD, AD, and NC, respectively).
Group comparison of WMHs and CBF (Table 3)
The SIVD group had more severe WMHs than the other two groups in all the areas investigated (all p < 0.001;
Table 3
Group comparison of white matter hyperintensities and cerebral blood flow
| Right Hemisphere | SIVD | AD | NC | ANCOVA | Post Hoc | Left Hemisphere | SIVD | AD | NC | ANCOVA | Post Hoc | ||
| N = 42 | N = 50 | N = 30 | p |
| N = 42 | N = 50 | N = 30 | p |
| ||||
| White Matter Hyperintensities | |||||||||||||
| Frontal | 2±0.4 | 1±0.5 | 1±0.6 | < 0.001 | 0.62 | SIVD > AD/NC | Frontal | 2±0.5 | 1±0.5 | 1±0.7 | < 0.001 | 0.55 | SIVD > AD/NC |
| Temporal | 2±0.6 | 1±0.6 | 0±0.6 | < 0.001 | 0.58 | SIVD > AD/NC | Temporal | 2±0.6 | 1±0.5 | 0±0.7 | < 0.001 | 0.58 | SIVD > AD/NC |
| PO | 2±0.5 | 1±0.7 | 1±0.7 | < 0.001 | 0.50 | SIVD > AD/NC | PO | 2±0.5 | 1±0.6 | 1±0.8 | < 0.001 | 0.51 | SIVD > AD/NC |
| BG | 2±0.5 | 0±0.9 | 0±0.8 | < 0.001 | 0.53 | SIVD > AD/NC | BG | 2±0.6 | 0±0.9 | 0±0.8 | < 0.001 | 0.54 | SIVD > AD/NC |
| Cerebral Blood Flow | |||||||||||||
| Frontal§ | 43.5±6.75 | 46.7±9.08 | 51.8±9.24 | < 0.001 | 0.13 | SIVD < NC | Frontal§ | 46.8±7.71 | 50.7±10.38 | 54.2±10.51 | 0.005 | 0.08 | SIVD < NC |
| Temporal | 45.7±8.31 | 51.4±10.71 | 54.0±10.45 | 0.001 | 0.11 | SIVD < AD/NC | Temporal | 46.4±8.89 | 51.4±11.52 | 53.2±12.04 | 0.020 | 0.06 | SIVD < NC |
| BG¶ | 44.5±6.85 | 46.1±8.89 | 44.8±9.88 | 0.753 | 0.00 | – | BG¶ | 46.3±7.53 | 48.4±9.17 | 45.1±11.70 | 0.641 | 0.00 | – |
Data are presented as mean±standard deviation. Groups are compared using the one-way analysis of covariance (ANCOVA), controlling for age, education, and symptom duration. p values < 0.05 are marked in bold. §significant difference between hemispheres: right < left in SIVD and AD groups. ¶ indicates significant difference between hemispheres: right < left in AD group. SIVD, subcortical ischemic vascular disease; AD, Alzheimer’s disease; NC, normal cognition. PO, parieto-occipital; BG, basal ganglia.
Effect of CBF and WMHs on cognition
Hierarchical linear regression revealed that both CBF metrics (i.e., CBF in frontal area, temporal area, and BG) and WMH metrics (i.e., WMHs in frontal area, temporal area, parieto-occipital area, and BG) had significant effects on global cognition, executive function, and attention, and that CBF metrics, but not WMH metrics, had an effect on memory, accounting for additional 7.3% –15.3% variation (all p < 0.05) above and beyond demographical variables (i.e., age, education level, and symptom duration). By adjusting the entry order of CBF and WMH metrics in the model, we found that CBF metrics had additional contribution to global cognition, memory, and attention, whereas WMH metrics had additional contribution to executive function. At last, when both CBF and WMH metrics were included, the CBF in frontal area was found to positively correlate with global cognition (β= 0.304, p = 0.004) and memory (β= 0.351, p = 0.003); the CBF in BG was found to negatively correlate with global cognition (β= –0.228, p = 0.008), memory (β= –0.298, p = 0.003), and attention (β = –0.261, p = 0.010).
ROI-based group comparison of CBF (Fig. 2)
Similar to the trend in Table 3, the SIVD group showed lower CBF than the NC group in most of the ROIs in frontal and temporal areas (p = < 0.001–0.036, uncorrected) but not in the ROIs in deep nuclei (Fig. 2A). The difference remained significant in right SFG, right IFG, right STG, and left MFG after false discovery rate (FDR) correction for multiple comparisons (all p < 0.01).
Fig. 2
Group comparison of cerebral blood flow by dementia stages. Groups are compared using the analysis of covariance controlling for age, education, and symptom duration. */**/***: p-values < 0.05/0.01/0.001. SFG, superior frontal gyrus; MFG, middle frontal gyrus; IFG, inferior frontal gyrus; STG, superior temporal gyrus; MTG, middle temporal gyrus; ITG, inferior temporal gyrus; LN, lentiform nucleus; tha, thalamus; SIVD, subcortical ischemic vascular disease; AD, Alzheimer’s disease; NC, normal cognition; CDR, Clinical Dementia Rating.
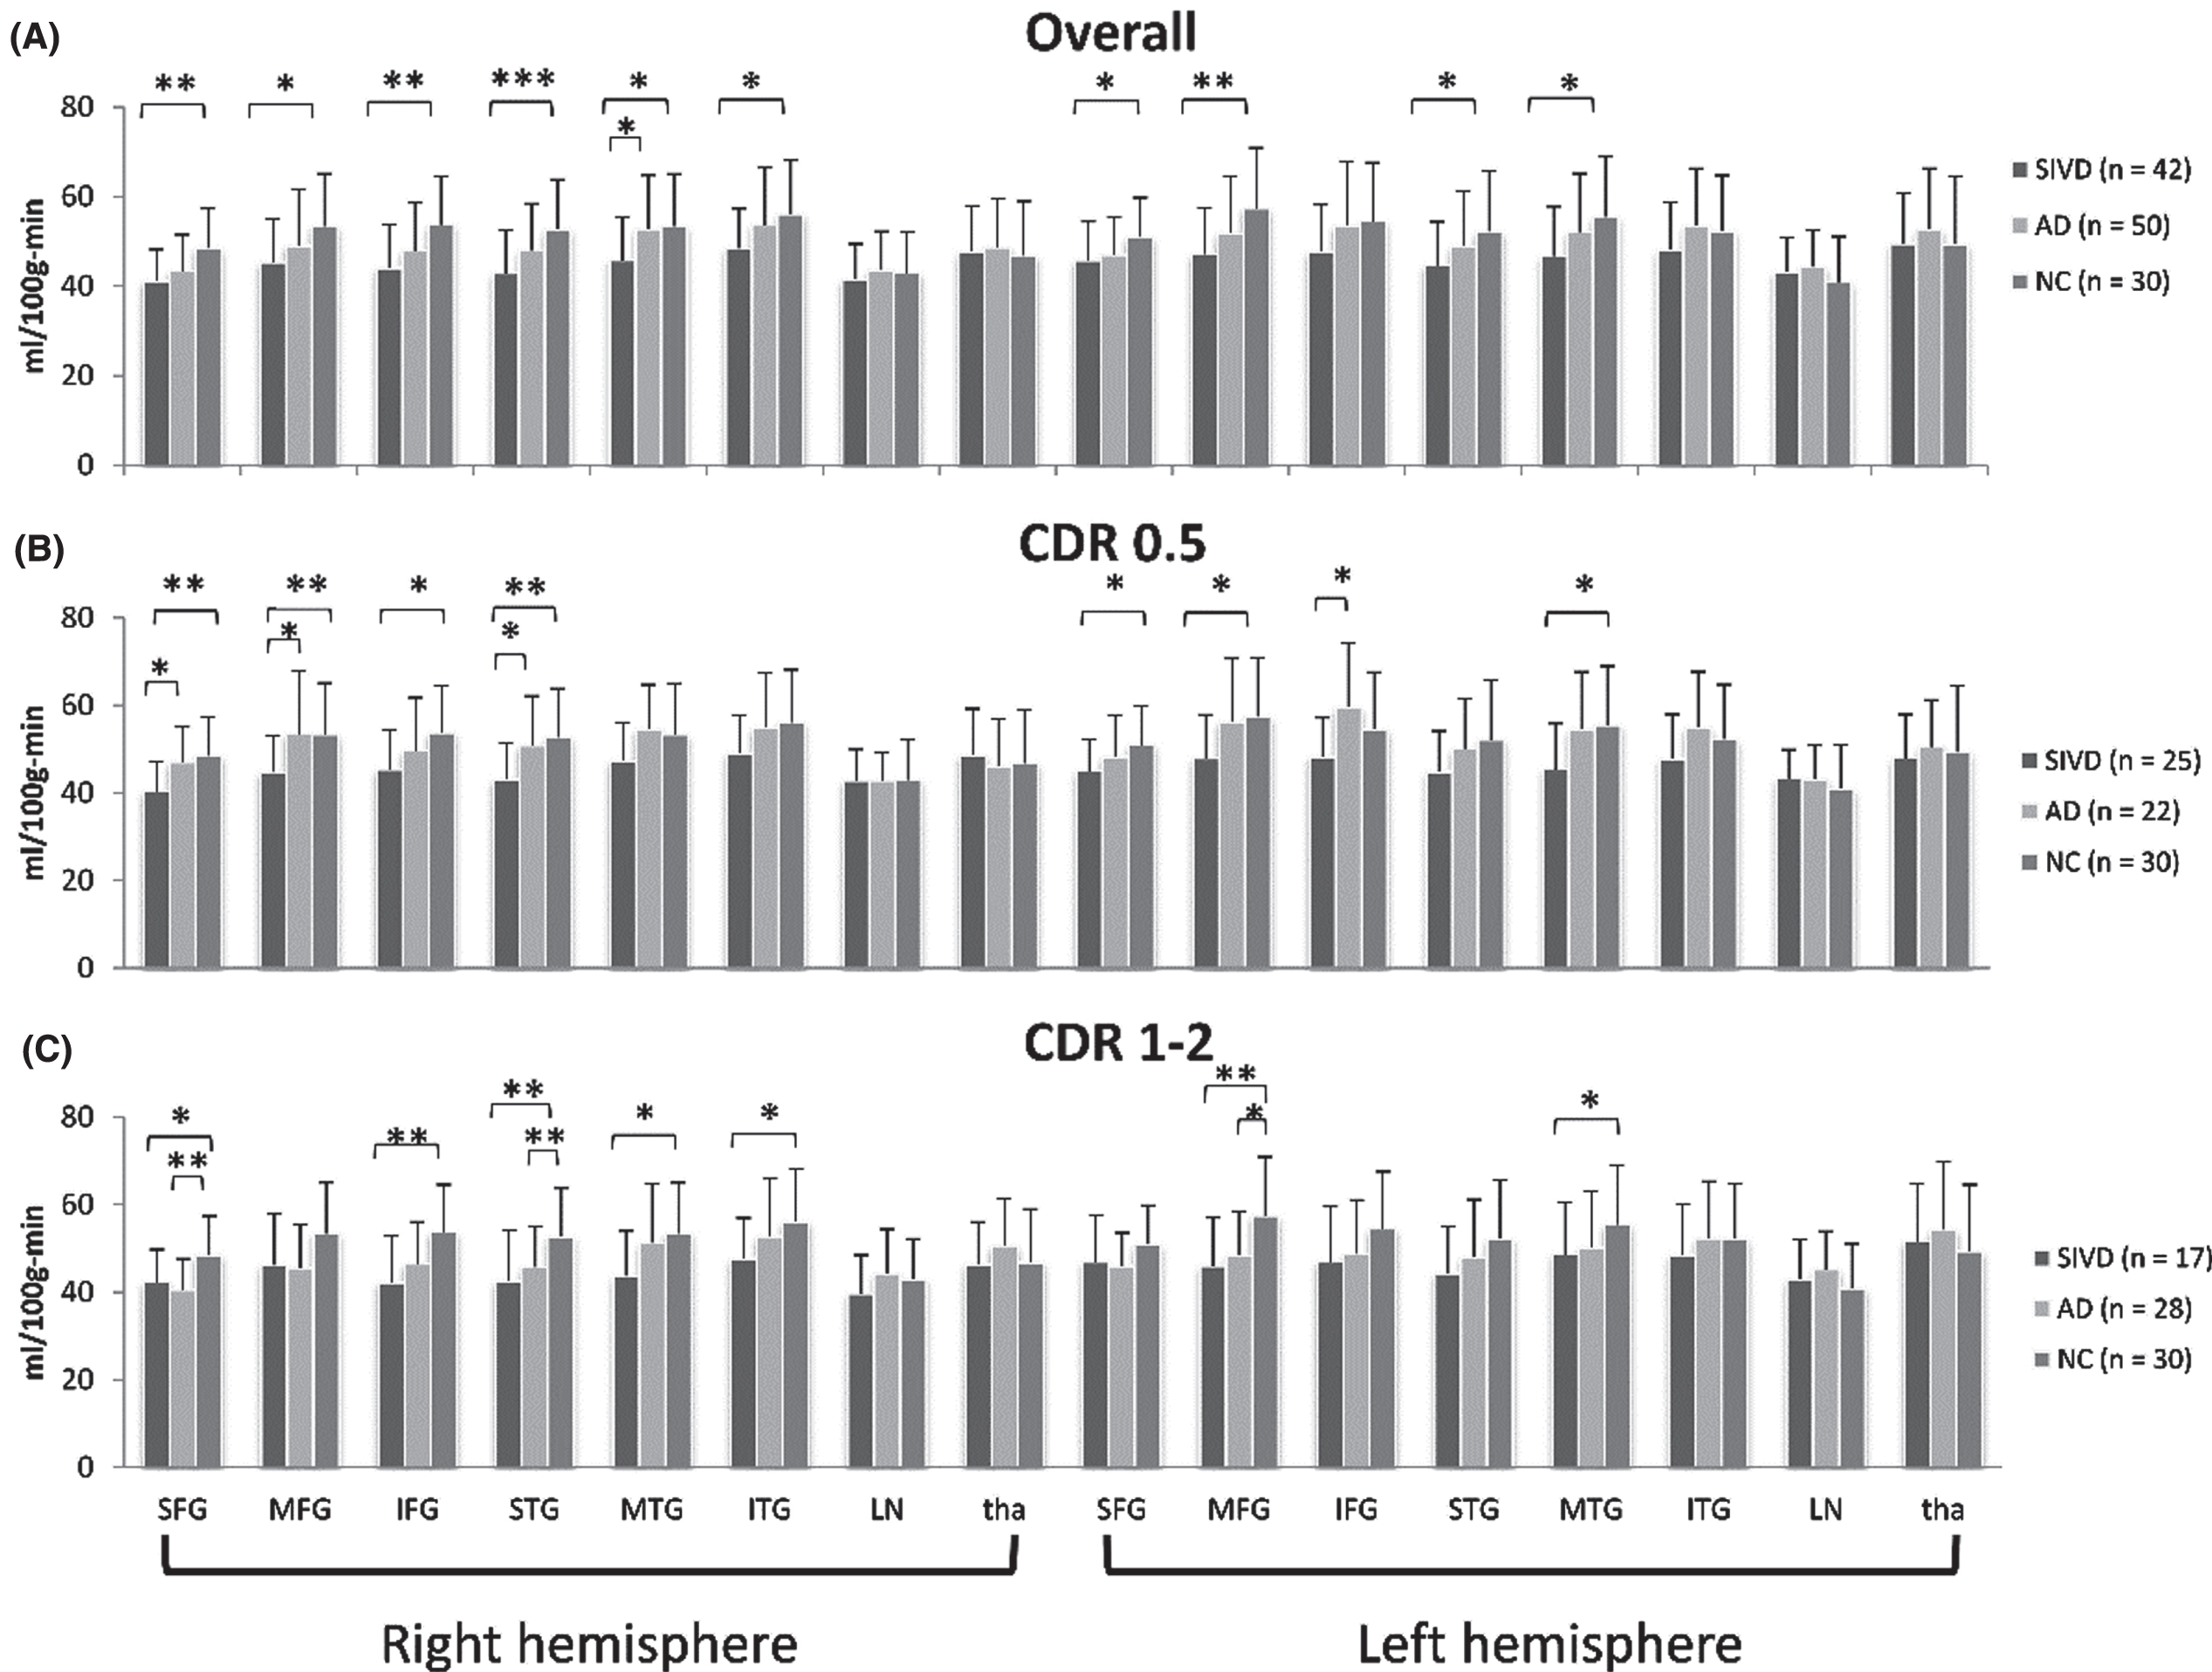
To investigate the change of CBF and WMHs along disease progression, the patient groups were respectively divided into two subgroups based on CDR-rated severity: CDR = 0.5 (case number SIVD/AD = 25/22) and CDR = 1 or 2 (case number SIVD/AD = 17/28). No patients were rated CDR 3. Similar to Fig. 1A, the SIVD subgroups had lower CBF than the NC group in frontal and temporal areas, except that more ROIs belonged to frontal area for CDR = 0.5 (Fig. 2B) and more ROIs belonged to temporal area for CDR = 1 or 2 (Fig. 2C) (p = <0.001–0.033, uncorrected). As compared with the NC group and found in multiple ROIs, the AD subgroup with CDR = 0.5 had comparable CBF whereas the subgroup with CDR = 1 or 2 had lower CBF (p = 0.004–0.041, uncorrected). However, the significance remained only for SIVD < NC in right SFG (CDR = 0.5) and right STG (CDR = 1 or 2) after FDR correction for multiple comparisons (both p = 0.01).
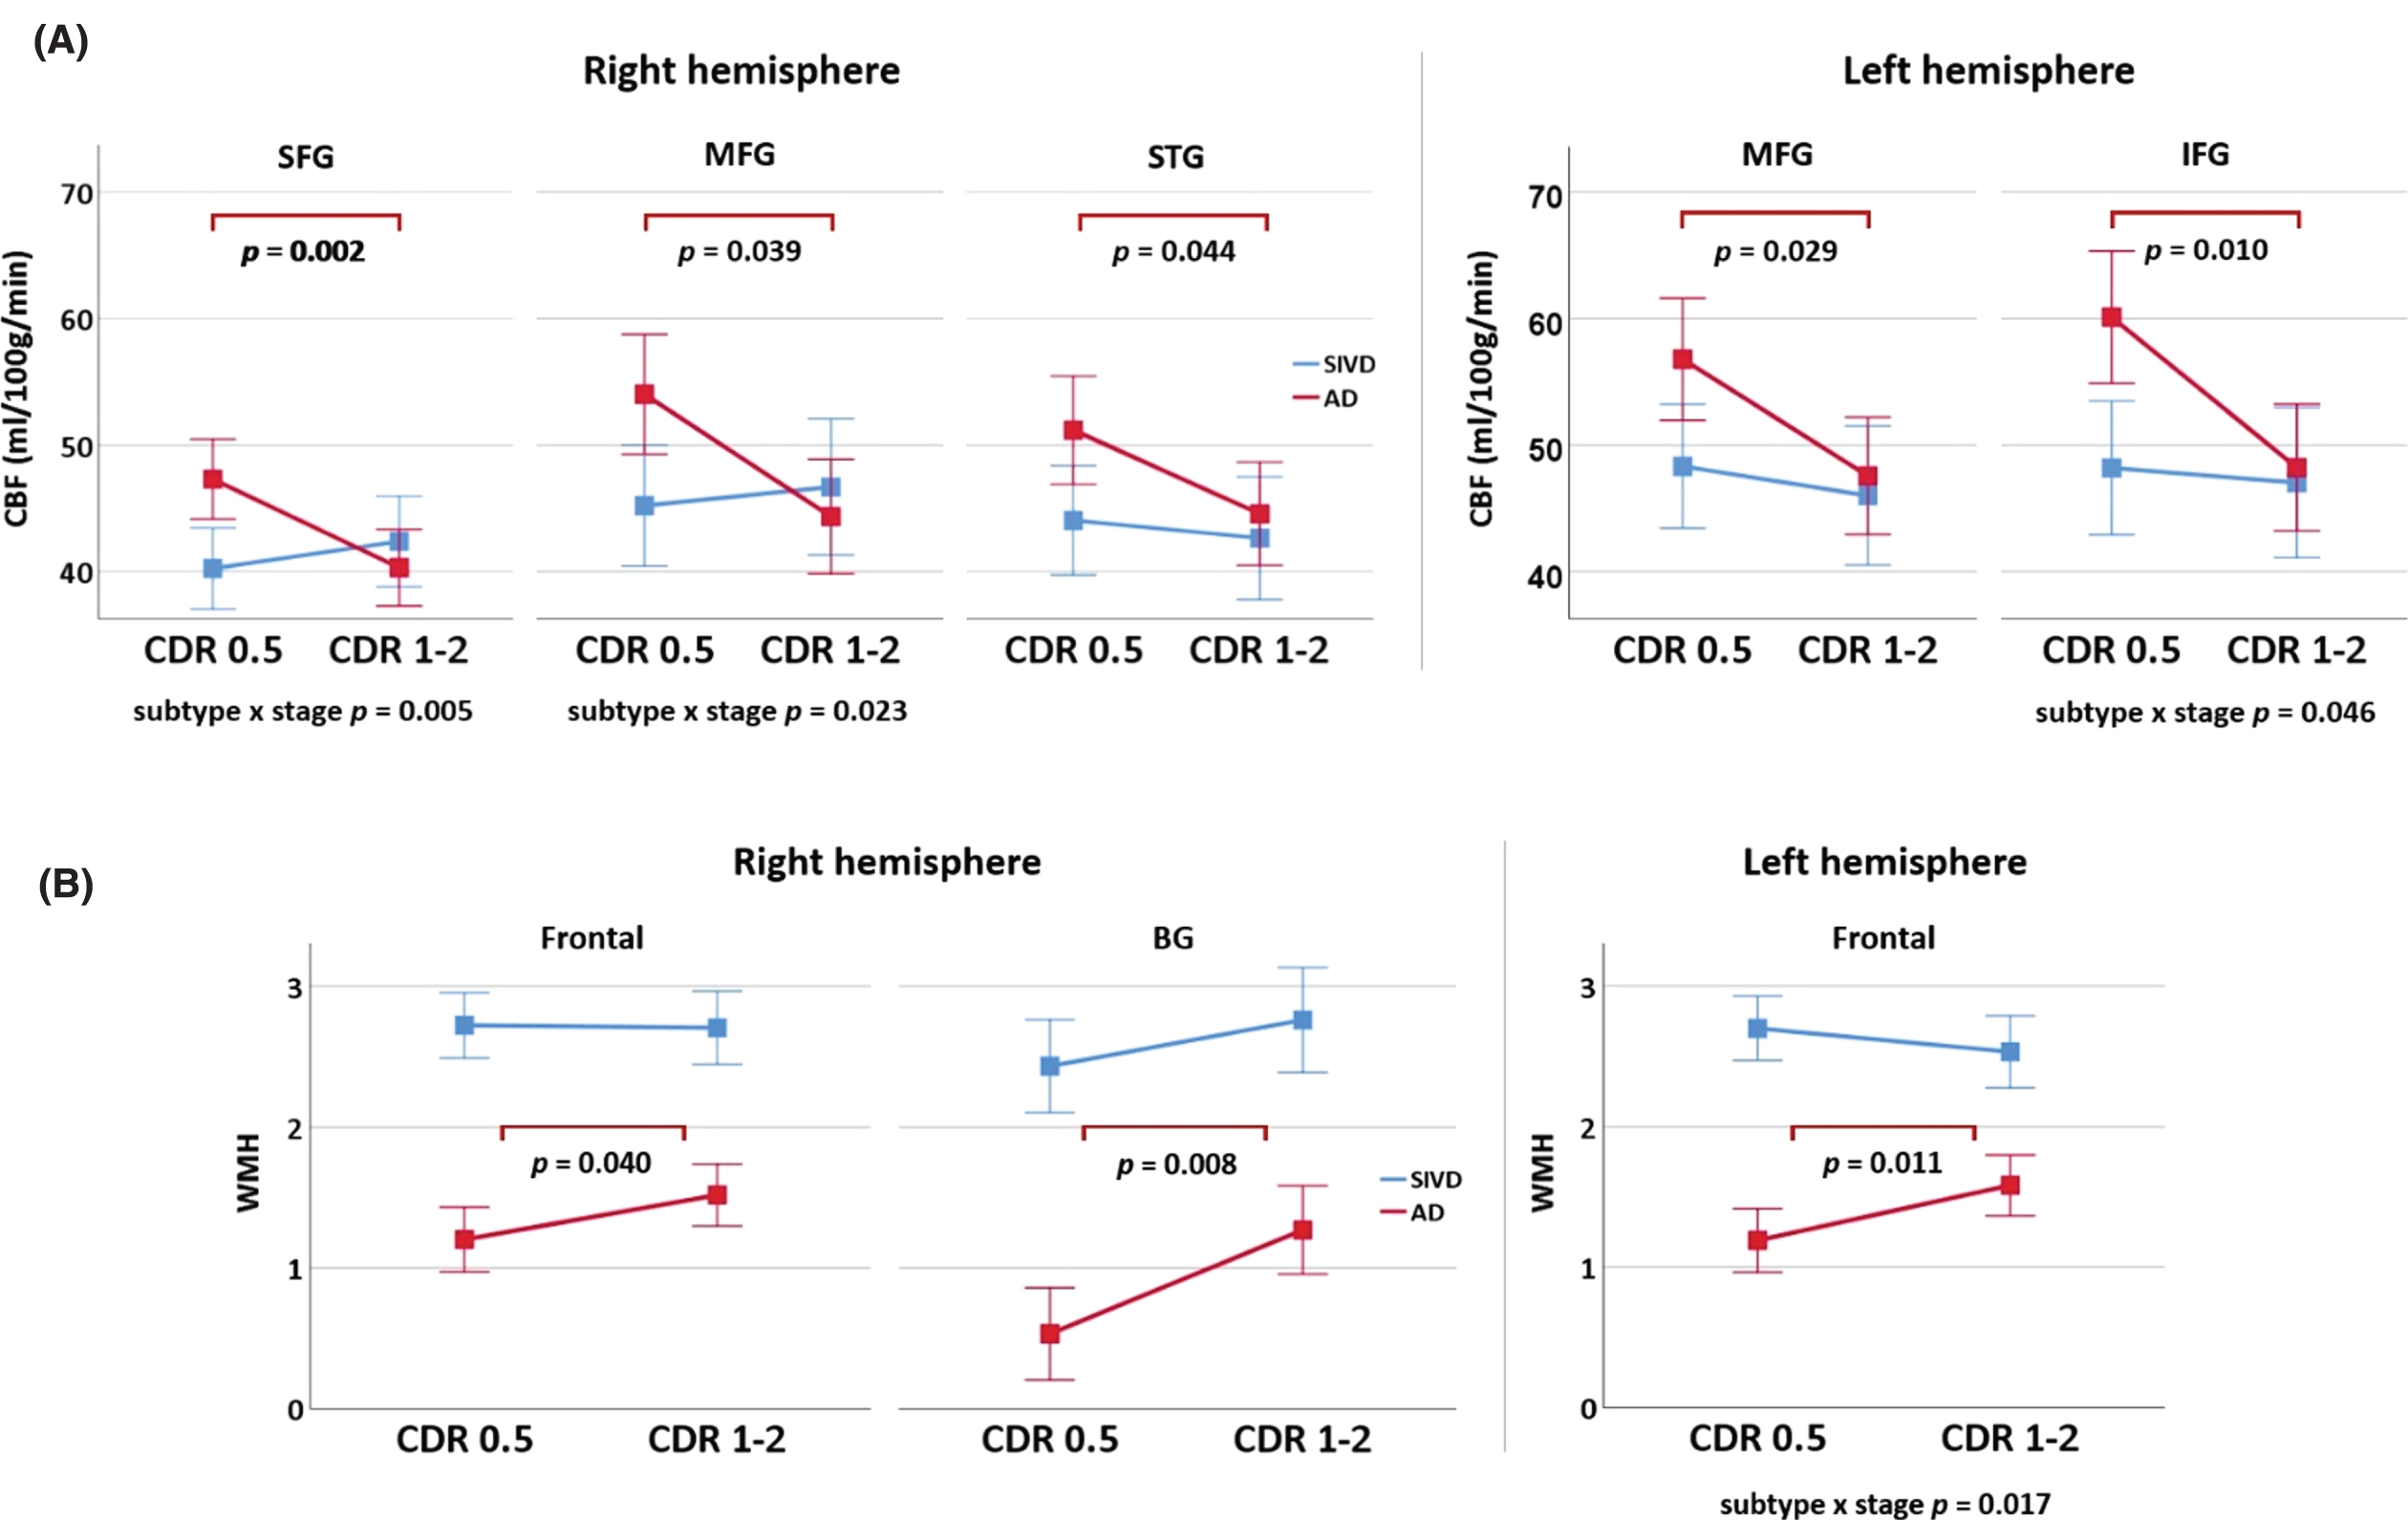
Comparison of CBF and WMHs by dementia stage (Fig. 3)
In the AD group, patients with CDR = 1 or 2 had lower CBF than those with CDR = 0.5 in frontal and temporal areas, including right SFG, bilateral MFG, right STG, and left IFG (p = 0.002 –0.044, uncorrected for multiple comparisons) (Fig. 3A). Patients with CDR = 1 or 2 had more WMHs than those with CDR = 0.5 in bilateral frontal area and right BG (p = 0.008 –0.040, uncorrected for multiple comparisons) (Fig. 3B). By contrast, no significant change in CBF and WMHs was found between SIVD subgroups. A two-way analysis of covariance revealed a statistically significant interaction between the effects of dementia subtype and dementia stage for the CBF in right SFG, right MFG, and left IFG (p = 0.005 –0.046), and the WMHs in left frontal area (p = 0.017).
Fig. 3
Dependence of cerebral blood flow (CBF) and white matter hyperintensities (WMH) on dementia stage. CBF (A) and WMH (B) are compared between dementia stages and subtypes using two-way analysis of covariance, controlling for age, education, and symptom duration. Vertical axes are the marginal means. Error bars indicate group standard deviations. SFG, superior frontal gyrus; MFG, middle frontal gyrus; IFG, inferior frontal gyrus; STG, superior temporal gyrus; BG, basal ganglia; CDR, Clinical Dementia Rating; AD, Alzheimer’s disease; SIVD, subcortical ischemic vascular disease. AD and SIVD are shown in red and blue colors, respectively.
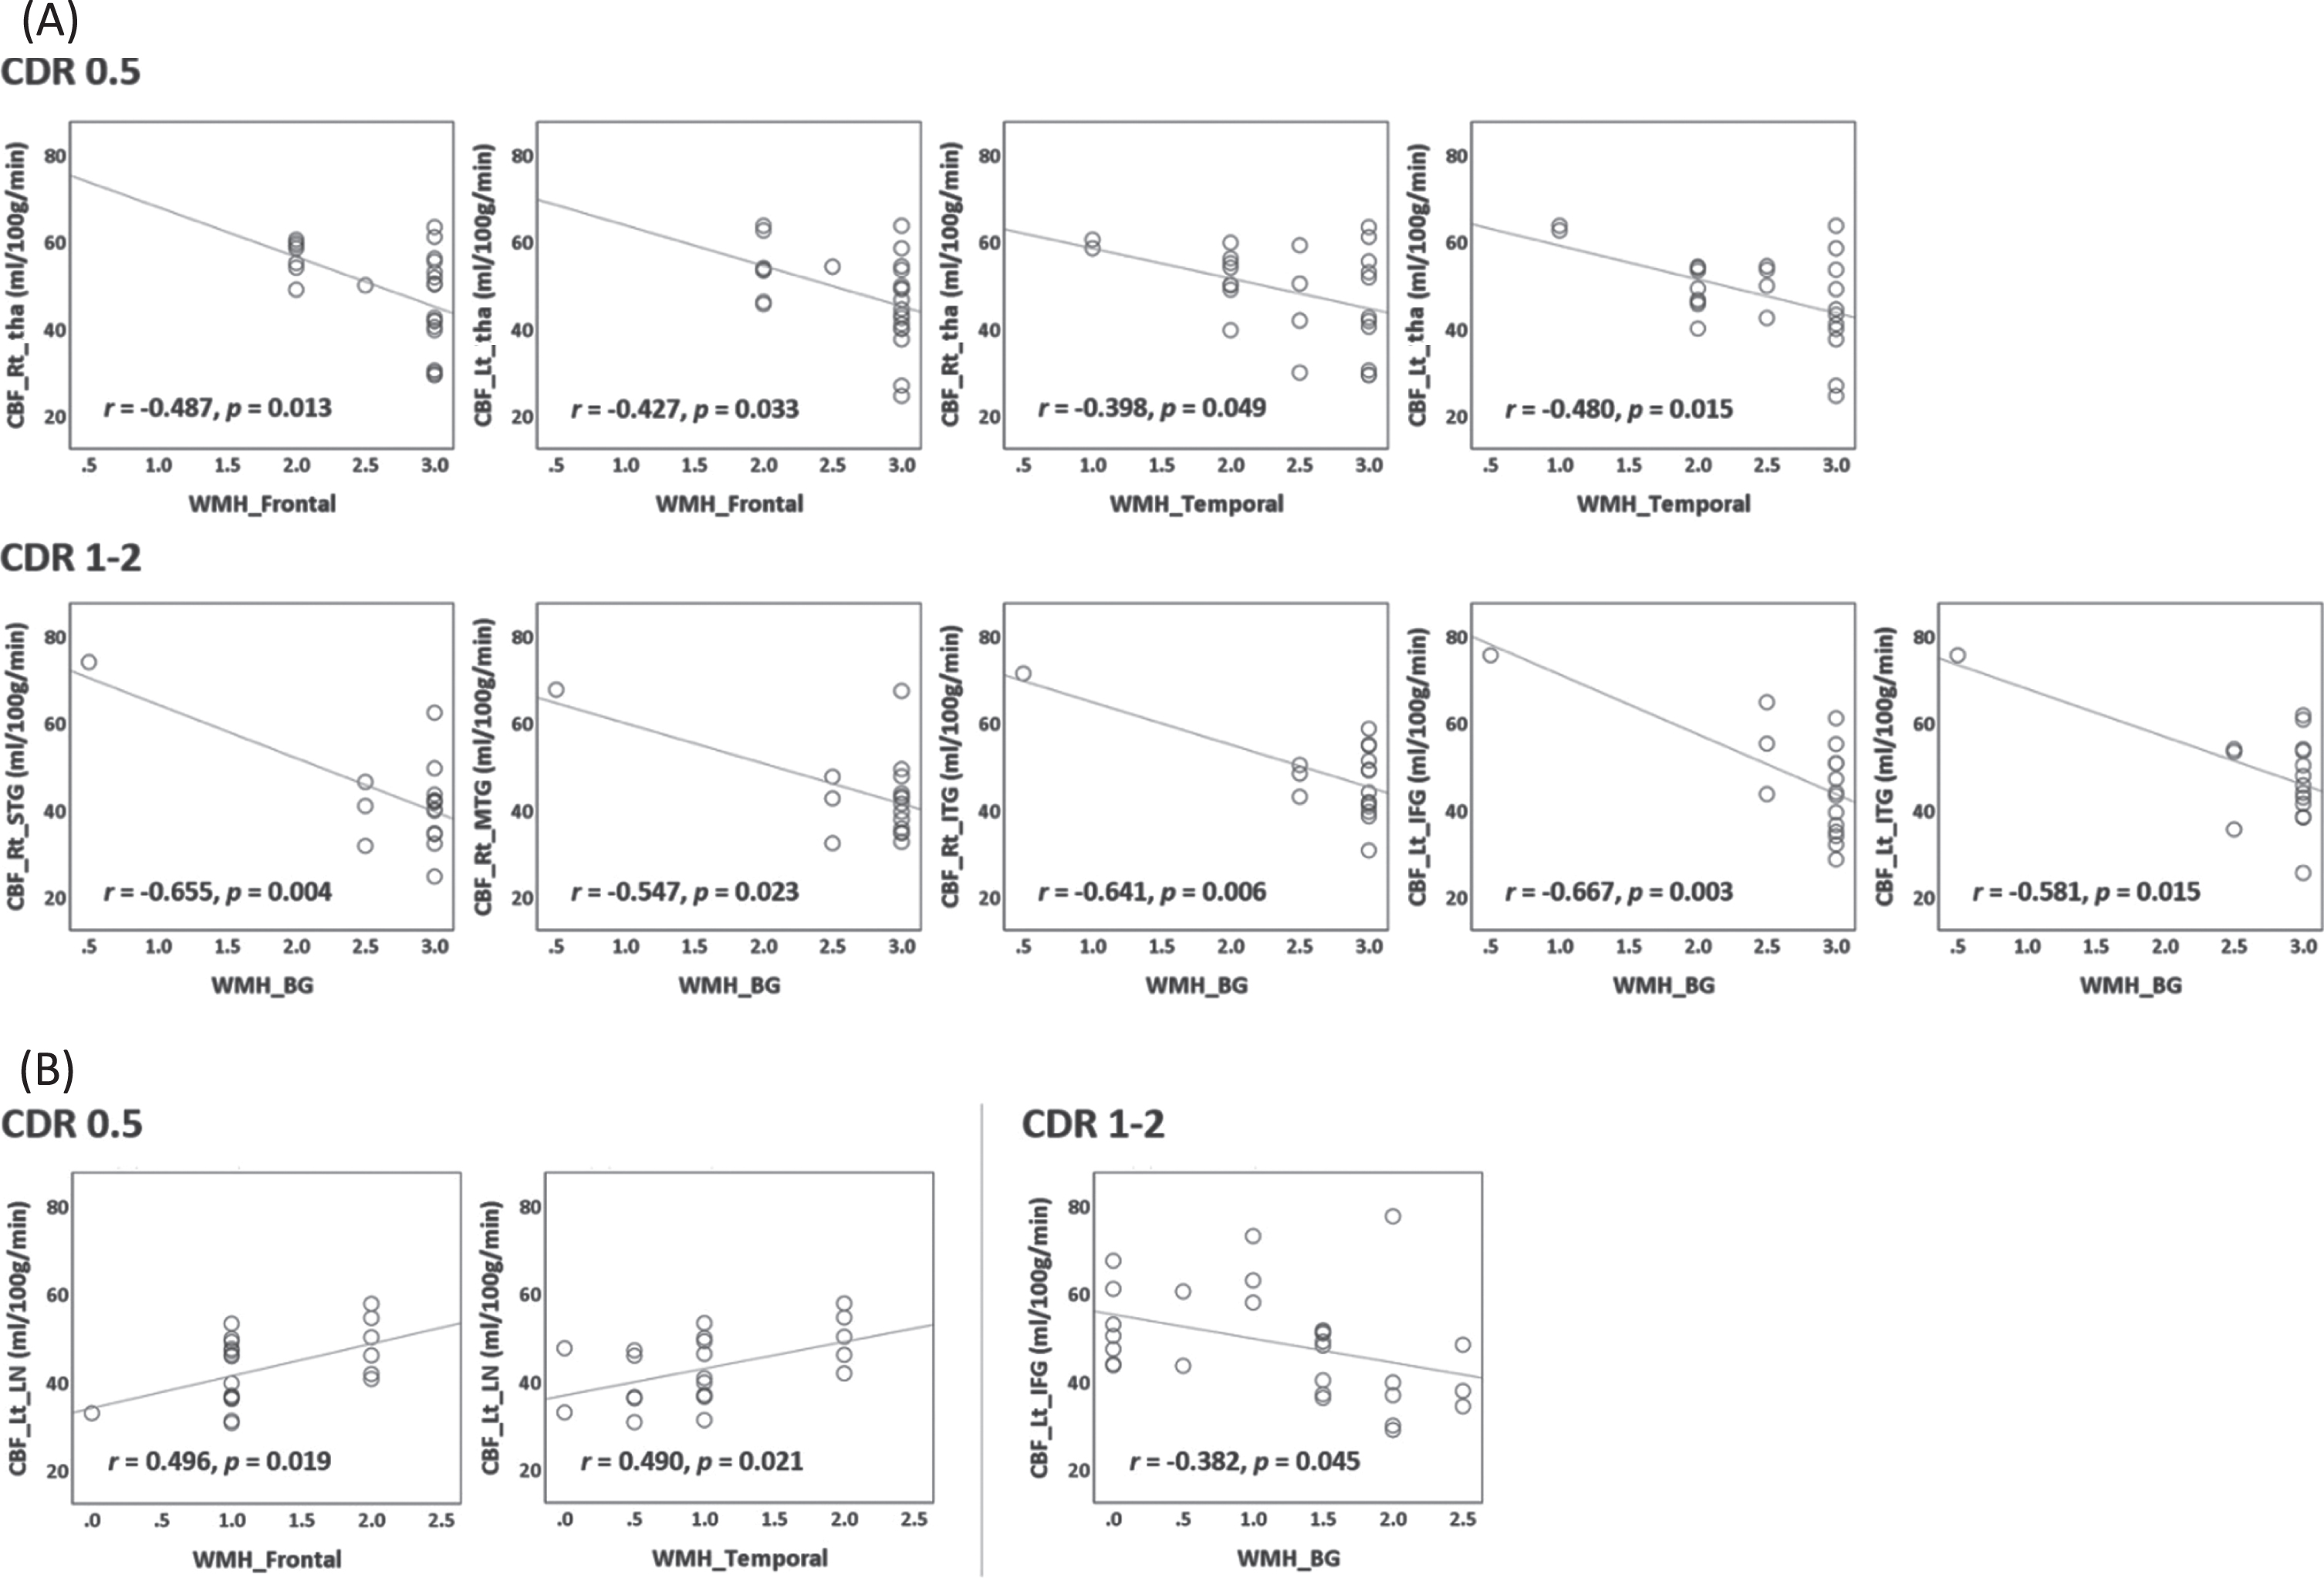
Correlation of CBF and WMHs by dementia stage (Fig. 4)
In the subgroup of SIVD with CDR = 0.5, WMHs in frontal and temporal areas negatively correlated with CBF in thalamus (r = –0.398 ––0.487, p = 0.013 –0.049). In the subgroup of SIVD with CDR = 1 or 2, WMHs in BG negatively correlated with CBF in right STG, right MTG, bilateral ITG, and left IFG (r = –0.547 ––0.667, p = 0.003–0.023).
In the subgroup of AD with CDR = 0.5, WMHs in frontal and temporal areas positively correlated with CBF in left LN (r = 0.496 and 0.490, p = 0.019 and 0.021, respectively). In the subgroup of AD with CDR = 1 or 2, WMHs in BG negatively correlated with CBF in left IFG (r = –0.382, p = 0.045).
Fig. 4
Correlation between cerebral blood flow (CBF) and white matter hyperintensities (WMH). Subplots (A) and (B) show subcortical ischemic vascular disease (SIVD) and Alzheimer’s disease (AD), respectively. Each circle is a patient. The Pearson’s correlation coefficient (r) and linear regression line are shown. Rt, right; Lt, left; tha, thalamus; BG, basal ganglia; LN, lentiform nucleus; STG, superior temporal gyrus; MTG, middle temporal gyrus; ITG, inferior temporal gyrus; IFG, inferior frontal gyrus; CDR, Clinical Dementia Rating.
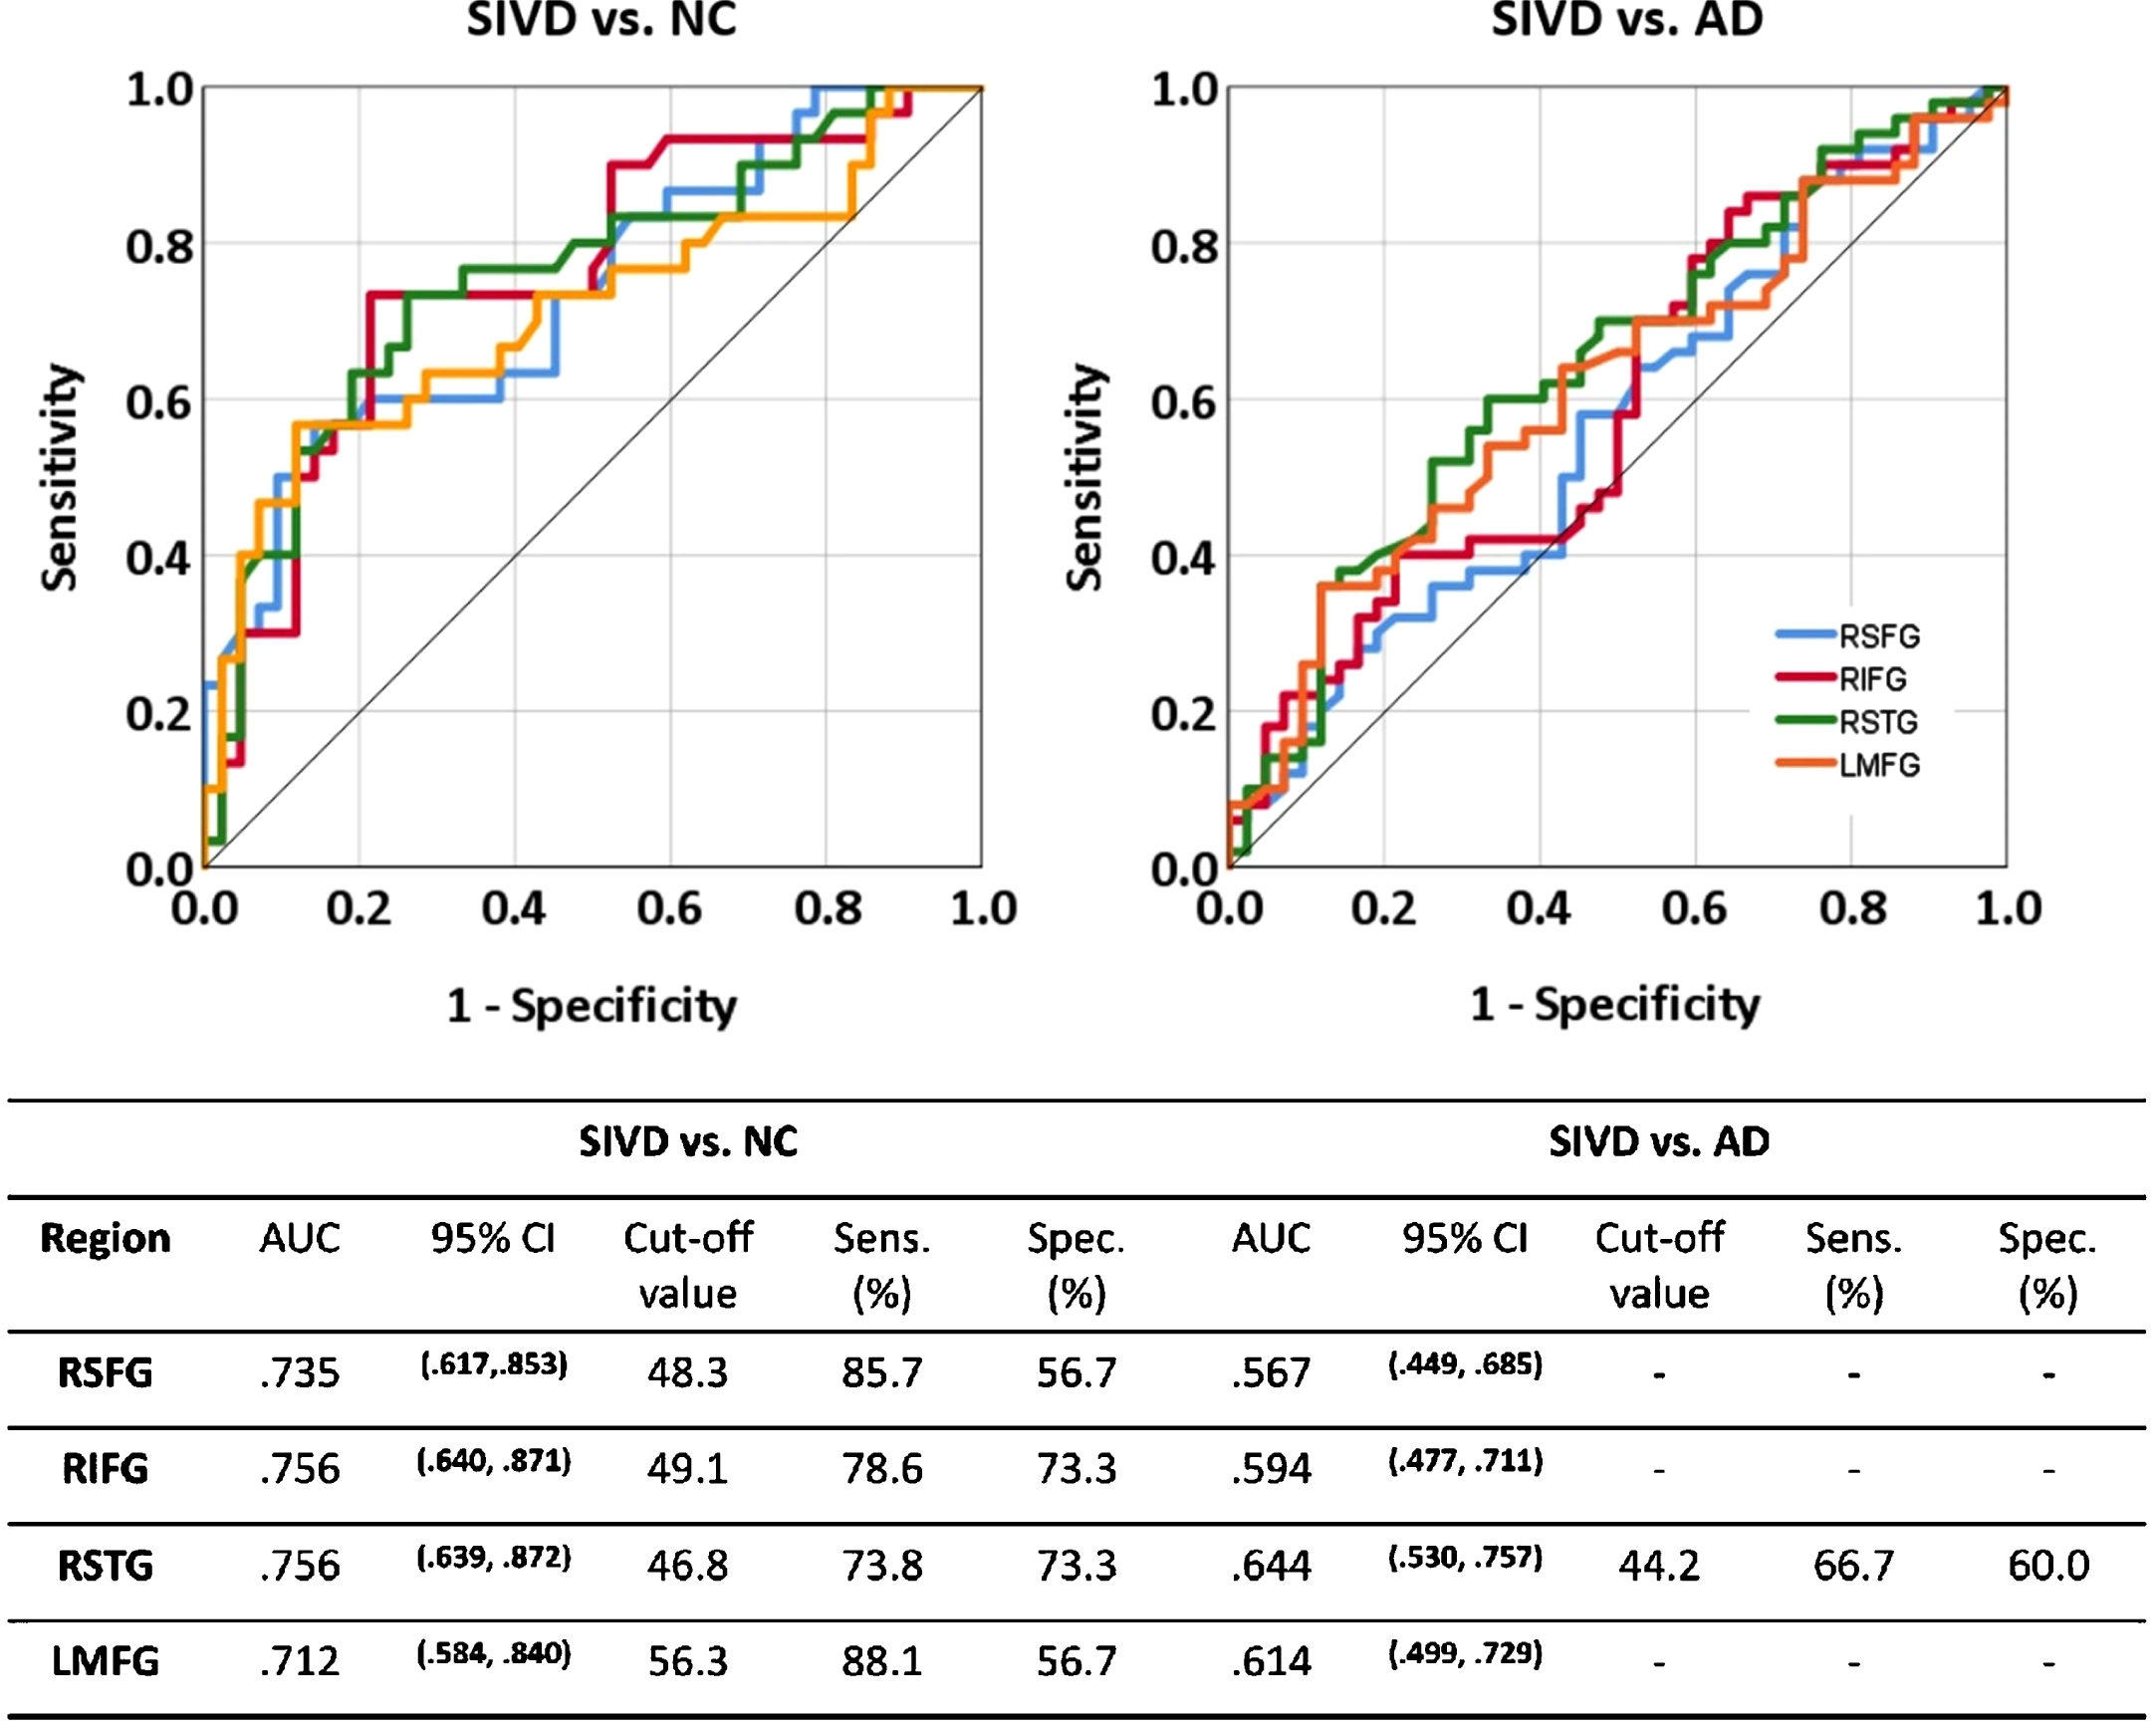
CBF-based group separation (Fig. 5)
The four areas (right SFG, right IFG, right STG, left MFG) that passed FDR-corrected tests in Fig. 2A were all able to differentiate the SIVD group from the NC group (AUC = 0.712–0.756, all p < = 0.002). Among them, only right STG was able to differentiate the SIVD group from the AD group (AUC = 0.644, p = 0.019).
Fig. 5
Receiver operating characteristic curve of cerebral blood flow in distinguishing subcortical ischemic vascular disease (SIVD) from normal cognition (NC) and Alzheimer’s disease (AD). RSFG, right superior frontal gyrus; RIFG, right inferior frontal gyrus; RSTG, right superior temporal gyrus; LMFG, left middle frontal gyrus; AUC, area under the curve; CI, confidence interval; Sens., sensitivity; Spec., specificity. Cut-off value, sentivity, and specificity are reported when AUC is significant.
DISCUSSION
The present study demonstrated that CBF and WMHs were associated with different cognitive domains in SIVD and AD (please see Effect of CBF and WMHs on Cognition in RESULTS). While SIVD and AD both exhibited hypoperfusion in the right hemisphere (Table 3), SIVD presented right hypofrontality at an earlier stage and in more extensive areas (Fig. 2). Additionally, a corticosubcortical coupling between CBF and WMHs was found in both SIVD and AD (Fig. 4), although more noticeable in SIVD, particularly at the later stage.
Global hypoperfusion has been known to associate with the development of cognitive deficits in SIVD [26] and post-stroke dementia [27]. Also by using ASL imaging, several studies reported decreased CBF in AD [28–32] when compared with cognitively normal elderly. Our results reasonably agreed with previous studies and further identified the most affected areas, including right SFG/IFG/STG and left MFG (Fig. 2). While the right SFG was postulated to relate with impulse control of human [33], the right IFG was considered to be a critical hub for executive function, attention, and motor control [34]. STG was suggested to govern sensory (e.g., auditory and visual) processing [35, 36]. MFG was regarded as a neural correlate for literacy and numeracy [37]. Our data showed decreased CBF in the right hemisphere in both SIVD and AD (Fig. 2). One plausible explanation for the laterality could be the retrogenesis hypothesis that posits late myelination region (e.g., right frontal and temporal areas) to be most vulnerable to degenerative process [38, 39].
Our data revealed a spatial coupling between CBF and WMHs that varied with dementia types and stages (Fig. 4). In SIVD, the coupling was reciprocal between subcortical and cortical areas. Specifically, the WMHs in frontotemporal areas correlated with the CBF in bilateral thalami at the early stage. The correlation then became between the WMHs in basal ganglia and the CBF in frontotemporal areas at the later stage. This finding echoes the study by Huynh et al. [40] where the CBF in subcortical white matter was found to correlate with global WMHs in patients with transient ischemic attack. This could be explained by the centrifugal elements in the deep intracerebral blood supply [41]. Most leptomeningeal arteries are centripetal, whereas some branches of striate arteries appear to be centrifugal. Following the notion that leptomeningeal anastomosis [42] may give subcortical and cortical regions different tolerance to hypoperfusion, the watershed of the centripetal/centrifugal supplies may be more susceptible to vascular/hypoxic insults. A similar coupling was also observed in our AD patients but involved fewer areas. Further, it is worth noting that in SIVD all the CBF-WMHs correlations were negative, whereas in AD the correlation was positive at the early stage and then became negative at the later stage. Given that our data showed delayed CBF decrease in AD patients (Fig. 3A) in comparison with SIVD patients, the positive correlation at the early stage could suggest a compensatory response.
As mentioned, the WMHs in BG appeared to undermine the integrity of corticosubcortical circuits in both SIVD and AD. The effect, however, was noticeably smaller in AD (Fig. 4B). The WMHs in BG was shown to correlate with age and total WMHs [43], but its prevalence was disproportionately lower than in frontal regions among patients with acute lacunar infarct [44]. Taken together, WMHs might have to exceed a threshold before its clinical significance occurs. As far as AD is concerned, other pathogeneses such as amyloidogenesis and tauopathy need to be considered. Nonetheless, the CBF-WMHs coupling could serve as a composite biomarker for differentiating SIVD from AD, or possibly, assessing the stage of dementia.
Our data suggested that CBF could be a useful biomarker in predicting cognitive construct (please see Effect of CBF and WMHs on Cognition in RESULTS). While the CBF in frontal areas positively correlated with global cognition and memory, the CBF in BG negatively correlated with global cognition, memory, and attention, which might be the consequence of diaschisis process [45] in response to frontal CBF changes, or vice versa. On the other hand, WMHs provided predictive information of executive function beyond CBF and demographics, suggesting a dissociable relationship with CBF despite the vascular pathogenesis of leukoaraiosis.
A few limitations of this study need to be men-tioned. First, the AD patients were included according to clinical diagnosis rather than laboratory data or molecular imaging (e.g., amyloid [46] or tau [47] scans). We used standard neuropsychological battery tests, previously reported guidelines, and radiological features. Some recent imaging features may warrant inclusion to further explore the pathogenic processes, such as diffusion kurtosis coefficient (a surrogate marker of white matter integrity [48]) and enlarged perivascular space (associated with amyloid-β pathology in AD [49]). Second, manual ROI placement was employed, which might be subject to rater bias. Although automatic segmentation and template-based measurement could be an alternative, nonlinear spatial transformation might not be able to fully account for brain atrophy. High ASL signal intensities from large arteries might be miscalculated as parenchymal perfusion. The test-retest results showed reasonable reproducibility in our measurements. Third, partial volume correction was not conducted in CBF calculation. As an alternative, we used small ROIs to avoid noticeable atrophy. Nonetheless, there could be residual partial volume effect in our CBF data as even within gray matter, non-atrophic changes might occur during disease progression. Fourth, CBF was reported only in gray matter because our data could not afford reliable flow measurement in white matter [50]. As white matter is the preferential area for SIVD-caused damage, white matter related flow changes might have been missed in our study.
In conclusion, CBF had distinct contribution to global cognition, memory, and attention, whereas WMHs had distinct contribution to executive function. A stage-dependent corticosubcortical coupling between CBF and WMHs was identified in both SIVD and AD. The coupling was more spatially extensive in SIVD and suggested an early-stage CBF compensation in AD.
ACKNOWLEDGMENTS
MC Tu was supported by Grant TTCRD 108-03 (Taichung Tzu Chi Hospital). WC Wu was supported by Grant 109-2314-B-002-031-MY3 (Taiwan Ministry of Science and Technology).
Authors’ disclosures available online (https://www.j-alz.com/manuscript-disclosures/21-5405r2).
REFERENCES
[1] | Appelman AP , van der Graaf Y , Vincken KL , Tiehuis AM , Witkamp TD , Mali WP , Geerlings MI ; SMART Study Group ((2008) ) Total cerebral blood flow, white matter lesions and brain atrophy: The SMART-MR study. J Cereb Blood Flow Metab 28: , 633–639. |
[2] | Hainsworth AH , Markus HS ((2008) ) Do in vivo experimental models reflect human cerebral small vessel disease? A systematic review. J Cereb Blood Flow Metab 28: , 1877–1891. |
[3] | Prins ND , Scheltens P ((2015) ) White matter hyperintensities, cognitive impairment and dementia: An update. Nat Rev Neurol 11: , 157–165. |
[4] | Johnson NA , Jahng GH , Weiner MW , Miller BL , Chui HC , Jagust WJ , Gorno-Tempini ML , Schuff N ((2005) ) Pattern of cerebral hypoperfusion in Alzheimer disease and mild cognitive impairment measured with arterial spin-labeling MR imaging: Initial experience. Radiology 234: , 851–859. |
[5] | Soldan A , Pettigrew C , Zhu Y , Wang MC , Moghekar A , Gottesman RF , Singh B , Martinez O , Fletcher E , DeCarli C ((2020) ) White matter hyperintensities and CSF Alzheimer disease biomarkers in preclinical Alzheimer disease. Neurology 94: , e950–e960. |
[6] | Salvadó G , Brugulat-Serrat A , Sudre CH , Grau-Rivera O , Suárez-Calvet M , Falcon C , Fauria K , Cardoso MJ , Barkhof F , Molinuevo JL ((2019) ) Spatial patterns of white matter hyperintensities associated with Alzheimer’s disease risk factors in a cognitively healthy middle-aged cohort. Alzheimers Res Ther 11: , 12. |
[7] | Damulina A , Pirpamer L , Seiler S , Benke T , Dal-Bianco P , Ransmayr G , Struhal W , Hofer E , Langkammer C , Duering M , Fazekas F , Schmidt R ((2019) ) White matter hyperintensities in Alzheimer’s disease: A lesion probability mapping study. J Alzheimers Dis 68: , 789–796. |
[8] | Tubi MA , Feingold FW , Kothapalli D , Hare ET , King KS , Thompson PM , Braskie MN ; Alzheimer’s Disease Neuroimaging Initiative ((2020) ) White matter hyperintensities and their relationship to cognition: Effects of segmentation algorithm. Neuroimage 206: , 116327. |
[9] | Rizzi L , Rosset I , Roriz-Cruz M ((2014) ) Global epidemiology of dementia: Alzheimer’s and vascular types. Biomed Res Int 2014: , 908915. |
[10] | Hachinski VC , Iliff LD , Zilhka E , Du Boulay GH , McAllister VL , Marshall J , Russell RW , Symon L ((1975) ) Cerebral blood flow in dementia. Arch Neurol 32: , 632–637. |
[11] | Jack CR Jr, Knopman DS , Jagust WJ , Shaw LM , Aisen PS , Weiner MW , Petersen RC , Trojanowski JQ ((2010) ) Hypothetical model of dynamic biomarkers of the Alzheimer’s pathological cascade. Lancet Neurol 9: , 119–128. |
[12] | Zlokovic BV ((2011) ) Neurovascular pathways to neurodegeneration in Alzheimer’s disease and other disorders. Nat Rev Neurosci 12: , 723–738. |
[13] | ElAli A , Thériault P , Préfontaine P , Rivest S ((2013) ) Mild chronic cerebral hypoperfusion induces neurovascular dysfunction, triggering peripheral beta-amyloid brain entry and aggregation. Acta Neuropathol Commun 1: , 75. |
[14] | Tu MC , Lo CP , Huang CF , Hsu YH , Huang WH , Deng JF , Lee YC ((2017) ) Effectiveness of diffusion tensor imaging in differentiating early-stage subcortical ischemic vascular disease, Alzheimer’s disease and normal ageing. PloS One 12: , e0175143. |
[15] | Shyu YI , Yip PK ((2001) ) Factor structure and explanatory variables of the Mini-Mental State Examination (MMSE) for elderly persons in Taiwan. J Formos Med Assoc 100: , 676–683. |
[16] | Erkinjuntti T , Inzitari D , Pantoni L , Wallin A , Scheltens P , Rockwood K , Roman G , Chui H , Desmond DW ((2000) ) Research criteria for subcortical vascular dementia in clinical trials. In Advances in Dementia Research, Springer, pp. 23–30. |
[17] | McKhann GM , Knopman DS , Chertkow H , Hyman BT , Jack CR Jr, Kawas CH , Klunk WE , Koroshetz WJ , Manly JJ , Mayeux R , Mohs RC , Morris JC , Rossor MN , Scheltens P , Carrillo MC , Thies B , Weintraub S , Phelps CH ((2011) ) The diagnosis of dementia due to Alzheimer’s disease: Recommendations from the National Institute on Aging-Alzheimer’s Association workgroups on diagnostic guidelines for Alzheimer’s disease. Alzheimers Dement 7: , 263–269. |
[18] | Lin KN , Wang PN , Liu HC , Teng EL ((2012) ) [Cognitive Abilities Screening Instrument, Chinese Version 2.0 (CASI C-2.0): Administration and clinical application]. Acta Neurol Taiwan 21: , 180–189. |
[19] | Wang TL , Hung YH , Yang CC ((2016) ) Psychometric properties of the Taiwanese (traditional Chinese) version of the frontal assessment battery: A preliminary study. Appl Neuropsychol Adult 23: , 11–20. |
[20] | Wechsler D ((1997) ) Wechsler memory scale (WMS-III), Psychological Corporation, San Antonio, TX. |
[21] | Hinton-Bayre A , Geffen G ((2005) ) Comparability, reliability, and practice effects on alternate forms of the Digit Symbol Substitution and Symbol Digit Modalities tests. Psychol Assess 17: , 237–241. |
[22] | Fan J , McCandliss BD , Sommer T , Raz A , Posner MI ((2002) ) Testing the efficiency and independence of attentional networks. J Cogn Neurosci 14: , 340–347. |
[23] | Anastasi A , Urbina S ((1997) ) Psychological testing, Prentice Hall/Pearson Education. |
[24] | Wu WC , Lien SH , Chang JH , Yang SC ((2014) ) Caffeine alters resting-state functional connectivity measured by blood oxygenation level-dependent MRI. NMR Biomed 27: , 444–452. |
[25] | Wahlund LO , Barkhof F , Fazekas F , Bronge L , Augustin M , Sjogren M , Wallin A , Adèr H , Leys D , Pantoni L ((2001) ) A new rating scale for age-related white matter changes applicable to MRI and CT. Stroke 32: , 1318–1322. |
[26] | Sun Y , Cao W , Ding W , Wang Y , Han X , Zhou Y , Xu Q , Zhang Y , Xu J ((2016) ) Cerebral blood flow alterations as assessed by 3D ASL in cognitive impairment in patients with subcortical vascular cognitive impairment: A marker for disease severity. Front Aging Neurosci 8: , 211. |
[27] | Firbank M , He J , Blamire A , Singh B , Danson P , Kalaria R , O’Brien J ((2011) ) Cerebral blood flow by arterial spin labeling in poststroke dementia. Neurology 76: , 1478–1484. |
[28] | Bangen KJ , Thomas KR , Sanchez DL , Edmonds EC , Weigand AJ , Delano-Wood L , Bondi MW ; Alzheimer’s Disease Neuroimaging Initiative ((2021) ) Entorhinal perfusion predicts future memory decline, neurodegeneration, and white matter hyperintensity progression in older adults. J Alzheimers Dis 81: , 1711–1725. |
[29] | Schuff N , Matsumoto S , Kmiecik J , Studholme C , Du A , Ezekiel F , Miller BL , Kramer JH , Jagust WJ , Chui HC ((2009) ) Cerebral blood flow in ischemic vascular dementia and Alzheimer’s disease, measured by arterial spin-labeling magnetic resonance imaging. Alzheimers Dement 5: , 454–462. |
[30] | Camargo A , Wang Z ; Alzheimer’s Disease Neuroimaging Initiative ((2021) ) Longitudinal cerebral blood flow changes in normal aging and the Alzheimer’s disease continuum identified by arterial spin labeling MRI. J Alzheimers Dis 81: , 1727–1735. |
[31] | Duan W , Sehrawat P , Balachandrasekaran A , Bhumkar AB , Boraste PB , Becker JT , Kuller LH , Lopez OL , Gach HM , Dai W ((2020) ) Cerebral blood flow is associated with diagnostic class and cognitive decline in Alzheimer’s disease. J Alzheimers Dis 76: , 1103–1120. |
[32] | Mak HK , Chan Q , Zhang Z , Petersen ET , Qiu D , Zhang L , Yau KK , Chu LW , Golay X ((2012) ) Quantitative assessment of cerebral hemodynamic parameters by QUASAR arterial spin labeling in Alzheimer’s disease and cognitively normal elderly adults at 3-tesla. J Alzheimers Dis 31: , 33–44. |
[33] | Hu S , Ide JS , Zhang S , Chiang-shan RL ((2016) ) The right superior frontal gyrus and individual variation in proactive control of impulsive response. J Neurosci 36: , 12688–12696. |
[34] | Sebastian A , Jung P , Neuhoff J , Wibral M , Fox PT , Lieb K , Fries P , Eickhoff SB , Tüscher O , Mobascher A ((2016) ) Dissociable attentional and inhibitory networks of dorsal and ventral areas of the right inferior frontal cortex: A combined task-specific and coordinate-based meta-analytic fMRI study. Brain Struct Funct 221: , 1635–1651. |
[35] | Shah-Basak PP , Chen P , Caulfield K , Medina J , Hamilton RH ((2018) ) The role of the right superior temporal gyrus in stimulus-centered spatial processing. Neuropsychologia 113: , 6–13. |
[36] | Ding H , Ming D , Wan B , Li Q , Qin W , Yu C ((2016) ) Enhanced spontaneous functional connectivity of the superior temporal gyrus in early deafness. Sci Rep 6: , 23239. |
[37] | Koyama MS , O’Connor D , Shehzad Z , Milham MP ((2017) ) Differential contributions of the middle frontal gyrus functional connectivity to literacy and numeracy. Sci Rep 7: , 17548. |
[38] | Stricker NH , Schweinsburg B , Delano-Wood L , Wierenga CE , Bangen KJ , Haaland K , Frank LR , Salmon DP , Bondi MW ((2009) ) Decreased white matter integrity in late-myelinating fiber pathways in Alzheimer’s disease supports retrogenesis. Neuroimage 45: , 10–16. |
[39] | Deoni SC , Dean DC 3rd, Remer J , Dirks H , O’Muirch-eartaigh J ((2015) ) Cortical maturation and myelination in healthy toddlers and young children. Neuroimage 115: , 147–161. |
[40] | Huynh T , Murphy B , Pettersen J , Tu H , Sahlas D , Zhang L , Symons S , Black S , Lee TY , Aviv R ((2008) ) CT perfusion quantification of small-vessel ischemic severity. AJNR Am J Neuroradiol 29: , 1831–1836. |
[41] | Van den Bergh R ((1969) ) Centrifugal elements in the vascular pattern of the deep intracerebral blood supply. Angiology 20: , 88–94. |
[42] | Brozici M , van der Zwan A , Hillen B ((2003) ) Anatomy and functionality of leptomeningeal anastomoses: A review. Stroke 34: , 2750–2762. |
[43] | Charidimou A , Boulouis G , Haley K , Auriel E , van Etten ES , Fotiadis P , Reijmer Y , Ayres A , Vashkevich A , Dipucchio ZY , Schwab KM , Martinez-Ramirez S , Rosand J , Viswanathan A , Greenberg SM , Gurol ME ((2016) ) White matter hyperintensity patterns in cerebral amyloid angiopathy and hypertensive arteriopathy. Neurology 86: , 505–511. |
[44] | Wen HM , Mok VC , Fan YH , Lam WW , Tang WK , Wong A , Huang RX , Wong KS ((2004) ) Effect of white matter changes on cognitive impairment in patients with lacunar infarcts. Stroke 35: , 1826–1830. |
[45] | Saré RM ((2016) ) Diaschisis: An old concept brought to new life. J Neurosci 36: , 1051–1052. |
[46] | Grothe MJ , Barthel H , Sepulcre J , Dyrba M , Sabri O , Teipel SJ ; Alzheimer’s Disease Neuroimaging Initiative ((2017) ) In vivo staging of regional amyloid deposition. Neurology 89: , 2031–2038. |
[47] | Schöll M , Maass A , Mattsson N , Ashton NJ , Blennow K , Zetterberg H , Jagust W ((2019) ) Biomarkers for tau pathology. Mol Cell Neurosci 97: , 18–33. |
[48] | Struyfs H , Van Hecke W , Veraart J , Sijbers J , Slaets S , De Belder M , Wuyts L , Peters B , Sleegers K , Robberecht C , Van Broeckhoven C , De Belder F , Parizel PM , Engelborghs S ((2015) ) Diffusion kurtosis imaging: A possible MRI biomarker for AD diagnosis? J Alzheimers Dis 48: , 937–948. |
[49] | Boespflug EL , Simon MJ , Leonard E , Grafe M , Woltjer R , Silbert LC , Kaye JA , Iliff JJ ((2018) ) Targeted assessment of enlargement of the perivascular space in Alzheimer’s disease and vascular dementia subtypes implicates astroglial involvement specific to Alzheimer’s disease. J Alzheimers Dis 66: , 1587–1597. |
[50] | Van Gelderen P , De Zwart J , Duyn J ((2008) ) Pittfalls of MRI measurement of white matter perfusion based on arterial spin labeling. Magn Reson Med 59: , 788–795. |


