
Association of SPI1 Haplotypes with Altered SPI1 Gene Expression and Alzheimer’s Disease Risk
Abstract
Background:
Genetic studies reveal that single-nucleotide polymorphisms (SNPs) of SPI1 are associated with Alzheimer’s disease (AD), while their effects in the Chinese population remain unclear.
Objective:
We aimed to examine the AD-association of SPI1 SNPs in the Chinese population and investigate the underlying mechanisms of these SNPs in modulating AD risk.
Methods:
We conducted a genetic analysis of three SPI1 SNPs (i.e., rs1057233, rs3740688, and rs78245530) in a Chinese cohort (n = 333 patients with AD, n = 721 normal controls). We also probed public European-descent AD cohorts and gene expression datasets to investigate the putative functions of those SNPs.
Results:
We showed that SPI1 SNP rs3740688 is significantly associated with AD in the Chinese population (odds ratio [OR] = 0.72 [0.58–0.89]) and identified AD-protective SPI1 haplotypes β (tagged by rs1057233 and rs3740688) and γ (tagged by rs3740688 and rs78245530). Specifically, haplotypes β and γ are associated with decreased SPI1 gene expression level in the blood and brain tissues, respectively. The regulatory roles of these haplotypes are potentially mediated by changes in miRNA binding and the epigenetic landscape. Our results suggest that the AD-protective SPI1 haplotypes regulate pathways involved in immune and neuronal functions.
Conclusion:
This study is the first to report a significant association of SPI1 with AD in the Chinese population. It also identifies SPI1 haplotypes that are associated with SPI1 gene expression and decreased AD risk.
INTRODUCTION
The pathophysiological mechanisms of Alzheimer’s disease (AD), a progressive neurodegenerative disease, remain largely unclear. AD has a strong hereditary component, estimated at 74–79% [1, 2], suggesting its progression is highly influenced by genetic factors. The coding mutation APOE ɛ4 is the most well-accepted AD risk genetic factor: having the APOE ɛ4 coding mutation(s) increases AD risk 3–15 fold [3]. Meanwhile, non-coding mutations also modulate AD risk [4–6], likely through modifying gene expression. For example, genome-wide association studies (GWASs) suggest that SPI1—which encodes PU.1, a transcription factor that regulates the expression of immune-related genes in myeloid cells [7], is associated with AD [4–6]. Specifically, three single-nucleotide polymorphisms (SNPs) of SPI1—rs3740688, rs1057233, and rs78245530—protect against AD risk in populations of European descent [4–6]. Interestingly, while elevated brain SPI1 transcript level is associated with AD [8], rs1057233 tags a common haplotype that lowers SPI1 transcript level in myeloid cells [5]. Meanwhile, rs78245530 is associated with altered DNA methylation states in the frontal cortex, suggesting it regulates SPI1 gene expression through altering the epigenetic landscape [6]. Hence, SPI1 can contribute to AD pathogenesis, and its genetic factors may modify AD risk through affecting SPI1 gene expression.
It is unclear whether SPI1 genetic factors modulate AD risk in populations of non-European descent, as related studies have only been conducted in populations of European descent. Accordingly, we conducted an AD-association analysis of the previously reported AD-protective SPI1 SNPs (i.e., rs1057233, rs3740688, and rs78245530) in a Hong Kong Chinese AD cohort. Among these three SPI1 SNPs, only rs3740688 exhibits significant AD-protective effects in Chinese patients with AD. Moreover, we identified AD-protective SPI1 haplotypes β (tagged by rs1057233 and rs3740688) and γ (tagged by rs3740688 and rs78245530). Specifically, haplotypes β and γ are associated with decreased SPI1 gene expression levels in the blood and brain tissues, respectively. Interestingly, in silico analysis suggests that haplotype β alters the binding of miRNAs with the three prime untranslated region (3’-UTR) of the SPI1 gene, while brain epigenetic profiling shows that the haplotype γ tagging SNP resides in the regulatory region. In addition, Gene Ontology (GO) and network analyses suggest that haplotype γ regulates key pathways involved in immune response and learning-related neuronal activity in the cerebral cortex. Thus, we identified AD-protective SPI1 haplotypes that are associated with decreased SPI1 gene expression, revealing a possible regulatory role of SPI1 in AD pathogenesis.
MATERIALS AND METHODS
Hong Kong Chinese Alzheimer’s disease cohort
The Hong Kong Chinese AD cohort in our study comprised 333 patients with AD and 721 normal controls (NCs). First, we recruited 333 patients with AD and 319 NCs from the Specialist Outpatient Department at the Prince of Wales Hospital, the Chinese University of Hong Kong. We then examined all participants (aged≥65 years) using the Montreal Cognitive Assessment [9] and diagnosed patients with AD using the American Psychiatric Association’s Diagnostic and Statistical Manual of Mental Disorders, 5th Edition (DSM–5) [10]. We further genotyped these participants by TaqMan assay. We also obtained whole-genome sequencing (WGS) data of 402 independent elderly NCs from the Specialist Outpatient Department at the Prince of Wales Hospital. This study was approved by the Prince of Wales Hospital, the Chinese University of Hong Kong, and The Hong Kong University of Science and Technology. All participants provided written informed consent for both study enrolment and sample collection.
DNA extraction and genotyping
We took 3 mL whole blood from each participant using K3EDTA tubes (VACUETTE), followed by centrifugation at 2,000×g for 15 min at 4°C. Next, we sent 420μL cell pellet (lower part) from each sample to the Centre for PanorOmic Science (CPOS) (Genomics and Bioinformatics Cores, LKS Faculty of Medicine, University of Hong Kong) where DNA extraction was performed. The extraction was done mechanically by QIAsymphony SP (QIAGEN) using the QIAsymphony DSP DNA Midi Kit (QIAGEN). Genomic DNA was eluted with 100μL Elution Buffer ATE (QIAGEN). Genotyping of the extracted genomic DNA was then conducted by TaqMan assay or WGS.
SNP genotyping of 333 patients with AD and 319 NCs was conducted by TaqMan Assay (SPI1 rs1057233, C___1301007_20; SPI1 rs3740688, C___30888031_10; SPI1 rs78245530, C___27834508_10; APOE rs429358, C___3084793_20; APOE rs7412, C___904973_10; Cat No.: 4351374 for all probes; Thermo Fisher Scientific). Reaction mixture (10μL) was prepared by adding 10 ng each DNA sample to 5μL TaqPath ProAmp Master Mix (A30867, Applied Biosystems) and 0.5μL TaqMan Assays, then topping it up with nuclease-free water. Real-time quantitative PCR was performed using the 7500 Fast Real-Time PCR System.
Variant calling of whole-genome sequencing data
High-coverage 40×WGS of 402 NCs was performed by Novogene. The genomic DNA libraries were sequenced using the Illumina NovaSeq 6000 System, generating 150 bp paired-end reads. We then subjected the raw reads to fastp for quality control, reads trimming, and filtration [11] and aligned the cleaned data to the GRCh37 reference genome using BWA-mem [12]. Subsequently, we performed variant calling using the Genome Analysis Toolkit (GATK) best practices [13], which included duplicate removal, base quality score recalibration, germline joint calling, and variant quality score recalibration. The phase of the genotypes were determined by Beagle 4.0 [14].
Additional datasets
For our replication analysis of AD risk effects, we obtained genetic and clinical information from the Alzheimer’s Disease Neuroimaging Initiative (ADNI) dataset (http://adni.loni.usc.edu) [15], the National Institute on Aging (NIA) Alzheimer’s Disease Centers (ADC) Cohort (phs000372.v2.p1) [16], and the NIA Late Onset Alzheimer’s Disease (LOAD) Family Study (phs000168.v2.p2) [17]. To investigate genotype-expression association, we also retrieved genetic and transcriptomic data from the Genotype-Tissue Expression (GTEx) Project (phs000424.v8.p2) [18], the BRAINEAC database [19], and the Cardiogenics Study (EGAC00001000088) [20]. Please see the Supplementary Material for descriptions of these datasets.
Data preprocessing
We imputed and phased genetic data generated from SNP microarrays using the TOPMed imputation server [21, 22]. To conduct a principal component analysis (PCA) of whole genomes, we pruned variants using the command “–indep-pairwise 50 5 0.2” and then computed the first 5 principal components (PCs) using the “–pca” argument from PLINK 1.90b [23]. For the RNA-sequencing (RNA-seq) data, we filtered the genes by median transcripts per kilobase million (TPM) > 1 in each tissue and applied rank-based inverse normal transformation across individuals using the rankNorm function from the RNOmni package in R [24].
Association analysis of SPI1 single-nucleotide polymorphisms with Alzheimer’s disease
We evaluated the Hardy–Weinberg equilibrium of the SPI1 SNPs using the HWExact function from the HardyWeinberg package in R [25]. Next, we compared the genotypic and allelic frequencies between NCs and patients with AD using the fisher.test from the stats package in R. To eliminate the effects of confounding factors, we performed logistic regression on SNP dosage (i.e., 0, 1, or 2) adjusted for age and sex using the glm function in R.
Association analysis of SPI1 haplotypes with Alzheimer’s disease
For the TaqMan genotyping data from our Hong Kong Chinese AD cohort, we identified the SPI1 haplotypes using the haplo.em function from the haplo.stats package in R. Meanwhile, we obtained the haplotypes of Hong Kong Chinese WGS data or European descent cohort data from phased VCF files using the bcftools convert --hapsample function [26]. We then generated a M×(N + 1) haplotype matrix for the study cohort with M participants and N common haplotypes (excluding the reference haplotype; frequency > 1%). The first N columns of the matrix contained the dosage (i.e., 0, 1, or 2) of each common haplotype, while the last column (labeled “others”) denoted the dosage of other rare haplotypes (frequency < 1%).
Next, we performed a multivariate regression by simultaneously feeding the allele dosage of the N common haplotypes and “others” haplotypes as input with AD diagnosis as the outcome. We then conducted a logistic regression using the glm function in R, adjusted for age and sex for all cohorts as well as the first three PCs for the ADC, ADNI, and LOAD cohorts.
Association analysis of SPI1 haplotypes with endophenotypes
We evaluated the additive effects of the haplotype dosage on age of AD onset, cognition, and gene expression by regression analysis. For our survival analysis, we applied a Cox proportional hazards regression to the age of AD onset data from the LOAD cohort using the coxph function from the survival package in R, adjusted for sex and the first three PCs [27]. To examine the association of the SPI1 haplotypes with cognition, we applied the rank-based inverse normal transformation to the Mini–Mental State Examination (MMSE) scores from the ADNI cohort using the rankNorm function from the RNOmni package in R [24]. We then fitted the normalized scores using the lm function in R, adjusted for age, sex, education, and the first three PCs. To examine the association of the SPI1 haplotypes with transcriptome in the GTEx dataset, we used the linear model from the MatrixEQTL package in R [28], adjusted for age, sex, the first three PCs, and RNA integrity number. We removed genes annotated as “pseudogenes” or “long non-coding RNA” by the Ensembl database from a subsequent analysis. For our association analyses of microarray data from the Cardiogenics study and BRAINEAC database, we subjected the normalized signal intensity data to robust linear regression using the lmrob function from the robustbase package in R [29]. Analyses of the Cardiogenics data were adjusted for age, gender, center, and the first three PCs.
Meta-analysis
To examine the AD risk of SPI1 haplotypes in populations of Chinese and European descent, we subjected beta and standard error (SE) data from each AD cohort to a meta-analysis using METASOFT (v2.0.0) [30]. We used a random effects (RE) model to estimate the effect size and Han and Eskin’s Random Effects (RE2) model to calculate the p-value.
Gene Ontology and network analyses
We subjected significantly downregulated (Beta <0, p < 0.05) and upregulated (Beta > 0, p < 0.05) genes associated with SPI1 haplotypes to the enrichGO function from the clusterProfiler package in R [31]. For the analysis, we used GO terms categorized as “biological process.” We subsequently queried the STRING database for the protein–protein interaction (PPI) network of genes enriched in different biological processes [32]. The gene network was visualized by Cytoscape 3.8.2 [33].
Genetic annotation and data visualization
We used IGV 2.8.0 to annotate the SPI1 locus with candidate cis-regulatory elements obtained from the SCREEN database [34]. We queried DNase sequencing (DNase-seq) and chromatin immunoprecipitation sequencing (ChIP-seq) data of the epigenetic markers H3K4me3 and H3K27ac, derived from the mononuclear cell and frontal cortex data in the EpiMap database [35], as well as single-cell assay for transposase-accessible chromatin using sequencing (scATAC-seq) data of the human cortex [36]. We visualized the sequencing data using the WashU Epigenome Browser. All annotations were based on the human reference genome GRCh37. We also visualized linkage disequilibrium (LD) among the SPI1 SNPs using Haploview 4.2 [37]. A forest plot for our meta-analysis was generated by ForestPMPlot [38]. We generated all bar, box, and survival plots using GraphPad Prism 8.0.2. For box plots, boxes extend from the 25th to 75th quartiles, and whiskers mark the 10th and 90th quartiles.
RESULTS
Association between SPI1 and Alzheimer’s disease in the Chinese population
To investigate whether SPI1 is associated with AD in the Chinese population, we conducted a genetic analysis of 3 SPI1 SNPs (i.e., rs1057233, rs3740688, and rs78245530) in a Hong Kong Chinese AD cohort [39] (n = 333 patients with AD, n = 721 NCs; Supplementary Table 1). The frequencies of the rs1057233 g-allele and rs3740688 g-allele were significantly lower in patients with AD than in NCs (p = 0.0115 and 0.0002 for rs1057233 and rs3740688, respectively; Supplementary Table 2), suggesting their inverse associations with AD in the Chinese population. We then examined their inverse associations with AD after controlling for the confounding effects of age and sex. Among the three SNPs, only the rs3740688 g-allele exhibited a significant AD-protective effect (Beta = –0.326±0.109; p = 0.003; Table 1). As APOE is the most common genetic risk factor for AD, we further conducted an association analysis controlling for APOE genotypes and found that the significant AD-protective effect of the rs3740688 g-allele remained (Beta = –0.350±0.113; p = 0.002; Table 1). Notably, the inverse association between rs3740688 and AD passed the multiple testing correction threshold (0.05 / 9 = 0.0056). Meanwhile, among APOE ɛ3 homozygous (i.e., APOE33) participants, we also observed a lower frequency of the rs3740688 g-allele in patients with AD when compared to NCs (Table 1, Supplementary Table 2). Hence, these results corroborate previous findings that SPI1 is associated with AD and its SNP rs3740688 also exerts an AD-protective effect in the Chinese population.
Table 1
Associations between SPI1 single-nucleotide polymorphisms and Alzheimer’s disease in the Chinese population
| All participants (n = 333 AD, 721 NC) | |||||||
| SNP | EA | Betaa | SE | Z | p | EAF (NC) | EAF (AD) |
| rs1057233 | g | –0.212 | 0.111 | –1.914 | 0.056 | 0.274 | 0.231 |
| rs3740688 | g | –0.326 | 0.109 | –2.982 | 0.003 | 0.314 | 0.252 |
| rs78245530 | t | –0.247 | 0.270 | –0.914 | 0.361 | 0.038 | 0.033 |
| All participants with APOE adjustment (n = 333 AD, 721 NC) | |||||||
| SNP | EA | Beta | SE | Z | p | EAF (NC) | EAF (AD) |
| rs1057233 | g | –0.242 | 0.115 | –2.108 | 0.035 | 0.274 | 0.231 |
| rs3740688 | g | –0.350 | 0.113 | –3.085 | 0.002 | 0.314 | 0.252 |
| rs78245530 | t | –0.230 | 0.282 | –0.814 | 0.416 | 0.038 | 0.033 |
| APOE33 participants (n = 180 AD, 493 NC) | |||||||
| SNP | EA | Beta | SE | Z | p | EAF (NC) | EAF (AD) |
| rs1057233 | g | –0.124 | 0.145 | –0.857 | 0.392 | 0.273 | 0.243 |
| rs3740688 | g | –0.328 | 0.146 | –2.239 | 0.025 | 0.317 | 0.253 |
| rs78245530 | t | –0.306 | 0.363 | –0.843 | 0.399 | 0.041 | 0.031 |
aEstimated effect size. AD, Alzheimer’s disease; EA, effect allele; EAF, effect allele frequency; NC, normal control; SE, standard error; SNP, single-nucleotide polymorphism.
Identification of Alzheimer’s disease-protective SPI1 haplotypes
As multiple variants residing in different haplotypes can modify the effects of AD-associated loci, we can expand our understanding of the genetic basis of AD by examining the roles of individual haplotypes in disease pathogenesis. Accordingly, we performed a haplotype analysis on the three SPI1 SNPs. Linkage disequilibrium (LD) analysis showed that the AD-protective SNP rs3740688 was in LD with both rs1057233 (D’ = 0.92) and rs78245530 (D’ = 1.00) in the Chinese population (Fig. 1a). Of note, we identified four common haplotypes (frequency > 1%) defined by the three SNPs. We denoted the major haplotype as α and minor haplotypes as β (tagged by rs1057233 and rs3740688), γ (tagged by rs3740688 and rs78245530), and δ (tagged by rs3740688 only) in descending order of frequency (Fig. 1a, Supplementary Table 3). Interestingly, haplotypes β and γ had lower frequencies in patients with AD (frequency = 0.204 and 0.019 for β and γ, respectively) than in NCs (frequency = 0.259 and 0.030 for β and γ, respectively), suggesting that these haplotypes have AD-protective effects (Table 2). We subsequently examined the association of these haplotypes with AD by simultaneously subjecting their genotypes to multivariate logistic regression. Interestingly, both haplotypes β and γ exerted a significant AD-protective effect (Beta = –0.337±0.118, p = 0.004 for β; Beta = –0.726±0.342, p = 0.034 for γ; Table 2) that remained significant after controlling for the APOE genotype (Beta = –0.368±0.122, p = 0.003 for β; Beta = –0.709±0.359, p = 0.049 for γ; Table 2). Of note, only the AD-protective effect of haplotype β passed the multiple testing correction threshold (0.05/9 = 0.0056). Meanwhile, among APOE33 participants, both haplotypes β and γ exhibited a lower frequency in patients with AD as compared to NCs. Thus, these results demonstrate that the identified SPI1 haplotypes are associated with decreased risk of AD in the Chinese population.
Fig. 1
Identification of Alzheimer’s disease-protective SPI1 haplotypes. a) Linkage disequilibrium plot and haplotypes identified in the Hong Kong Chinese Alzheimer’s disease (AD) cohort. Cell color and labeled numbers in the upper and lower panels represent D’ and Pearson’s correlation coefficients (r2) between single-nucleotide polymorphisms (SNPs), respectively. Letters in upper and lower case denote major and minor alleles, respectively. b) AD-protective effects of the identified haplotypes in populations of Chinese and European descent. Dot size and filled color represent – log10(P) and Beta, respectively. **p < 0.01, *p < 0.05. c) Associations between haplotype γ and age of AD onset in APOE33 participants from the Late Onset Alzheimer’s Disease (LOAD) cohort. d) Associations between haplotype γ and Mini–Mental State Examination (MMSE) score in APOE33 participants from the Alzheimer’s Disease Neuroimaging Initiative (ADNI) dataset. **p < 0.01. CHN, Chinese; EUR, European descent; HR, hazard ratio.
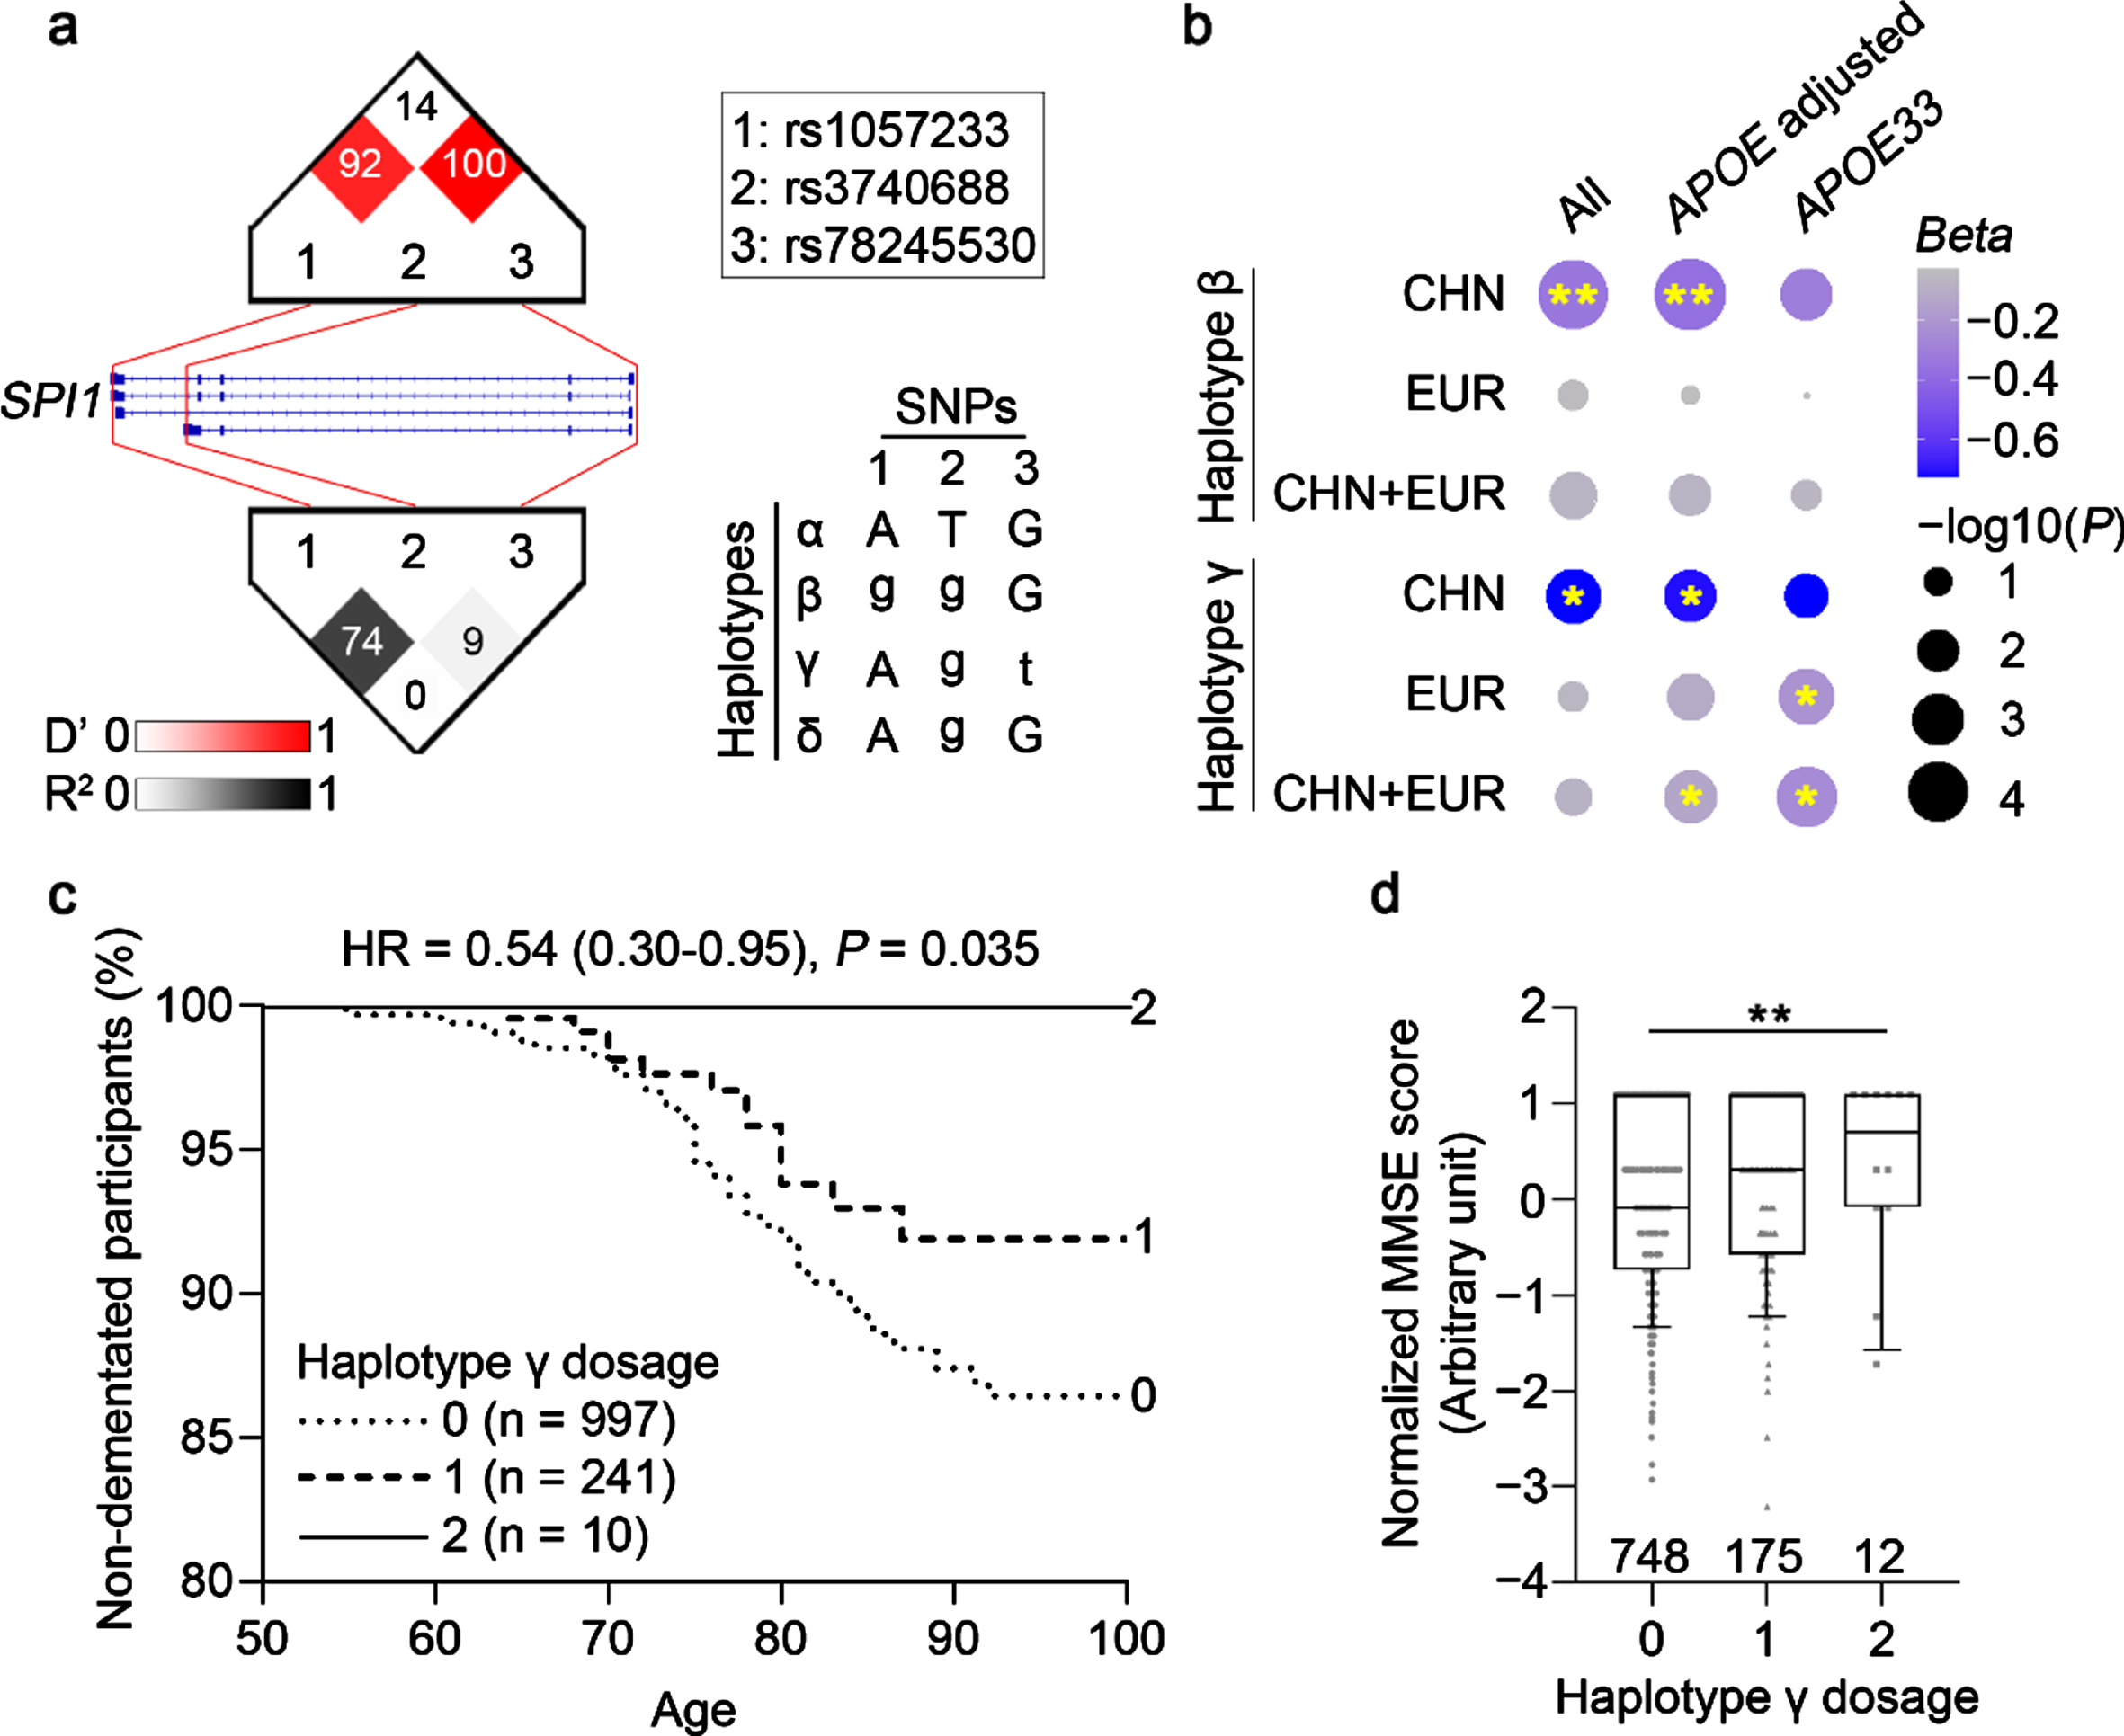
Table 2
Associations between SPI1 haplotypes and Alzheimer’s disease in the Chinese population
| All participants (n = 333 AD, 721 NC) | |||||||
| Name | rs1057233–rs3740688–rs78245530 | Betaa | SE | Z | p | EAF (NC) | EAF (AD) |
| α | A-T-G | 0.678 | 0.735 | ||||
| β | g-g-G | –0.337 | 0.118 | –2.860 | 0.004 | 0.259 | 0.204 |
| γ | A-g-t | –0.726 | 0.342 | –2.127 | 0.034 | 0.030 | 0.019 |
| δ | A-g-G | –0.291 | 0.403 | –0.722 | 0.470 | 0.017 | 0.015 |
| All participants with APOE adjustment (n = 333 AD, 721 NC) | |||||||
| Name | rs1057233–rs3740688–rs78245530 | Beta | SE | Z | p | EAF (NC) | EAF (AD) |
| α | A-T-G | 0.678 | 0.735 | ||||
| β | g-g-G | –0.368 | 0.122 | –3.014 | 0.003 | 0.259 | 0.204 |
| γ | A-g-t | –0.709 | 0.359 | –1.974 | 0.049 | 0.030 | 0.019 |
| δ | A-g-G | –0.233 | 0.414 | –0.564 | 0.573 | 0.017 | 0.015 |
| APOE33 participants (n = 180 AD, 493 NC) | |||||||
| Name | rs1057233–rs3740688–rs78245530 | Beta | SE | Z | p | EAF (NC) | EAF (AD) |
| α | A-T-G | 0.678 | 0.724 | ||||
| β | g-g-G | –0.308 | 0.158 | –1.954 | 0.051 | 0.259 | 0.208 |
| γ | A-g-t | –0.727 | 0.455 | –1.598 | 0.111 | 0.031 | 0.019 |
| δ | A-g-G | –0.412 | 0.555 | –0.741 | 0.459 | 0.017 | 0.015 |
aEstimated effect size. Letters in upper and lower case denote major and minor alleles, respectively. AD, Alzheimer’s disease; EA, effect allele; EAF, effect allele frequency; NC, normal control; SE, standard error.
To further examine whether the identified SPI1 haplotypes are associated with AD in populations of European descent, we performed a haplotype analysis of AD cohorts of European descent (n = 5,094 patients with AD, n = 4,663 NCs; Supplementary Table 1). Among the three minor haplotypes identified in the Chinese population, haplotype δ exhibited a very low prevalence in populations of European descent (frequency < 1%; Supplementary Table 3) and was thus excluded from the subsequent analysis. While we found that neither haplotype β nor γ was significantly associated with AD in all participants (p > 0.05), haplotype γ exhibited a significant AD-protective effect in APOE33 participants (Beta = –0.213±0.137, p = 0.030; Fig. 1b; Supplementary Table 4). Accordingly, a meta-analysis showed that haplotype γ also exhibited a significant AD-protective effect in APOE33 participants from both populations of Chinese and European descent (Beta = –0.248±0.133, p = 0.015; Fig. 1b; Supplementary Table 5), although this result did not pass the multiple testing correction threshold (0.05/6 = 0.0083). To examine the possible AD-protective effect of haplotype γ, we investigated its association with AD-related phenotypes in AD cohorts of European descent. First, we examined the association between haplotype γ and age of AD onset in the APOE33 participants from the LOAD cohort (n = 1,248; mean age = 82.3±10.6 years). Surprisingly, all homozygous carriers of haplotype γ (n = 10, mean age = 86.9±8.7 years) were free of dementia (Fig. 1c). Furthermore, participants who carried haplotype γ exhibited a delayed onset of AD (hazard ratio = 0.54 [0.30–0.95], p = 0.035; Fig. 1c; Supplementary Table 6). Next, we examined the association between haplotype γ and cognitive performance (measured by the MMSE) in the APOE33 participants from the ADNI cohort (n = 935) and found that haplotype γ was associated with better cognitive performance (Beta = 0.173±0.066, p = 0.009; Fig. 1d; Supplementary Table 7). These results collectively suggest that SPI1 haplotype γ could protect against AD risk only in APOE33 individuals for European descent.
Association between SPI1 haplotypes and SPI1 gene expression
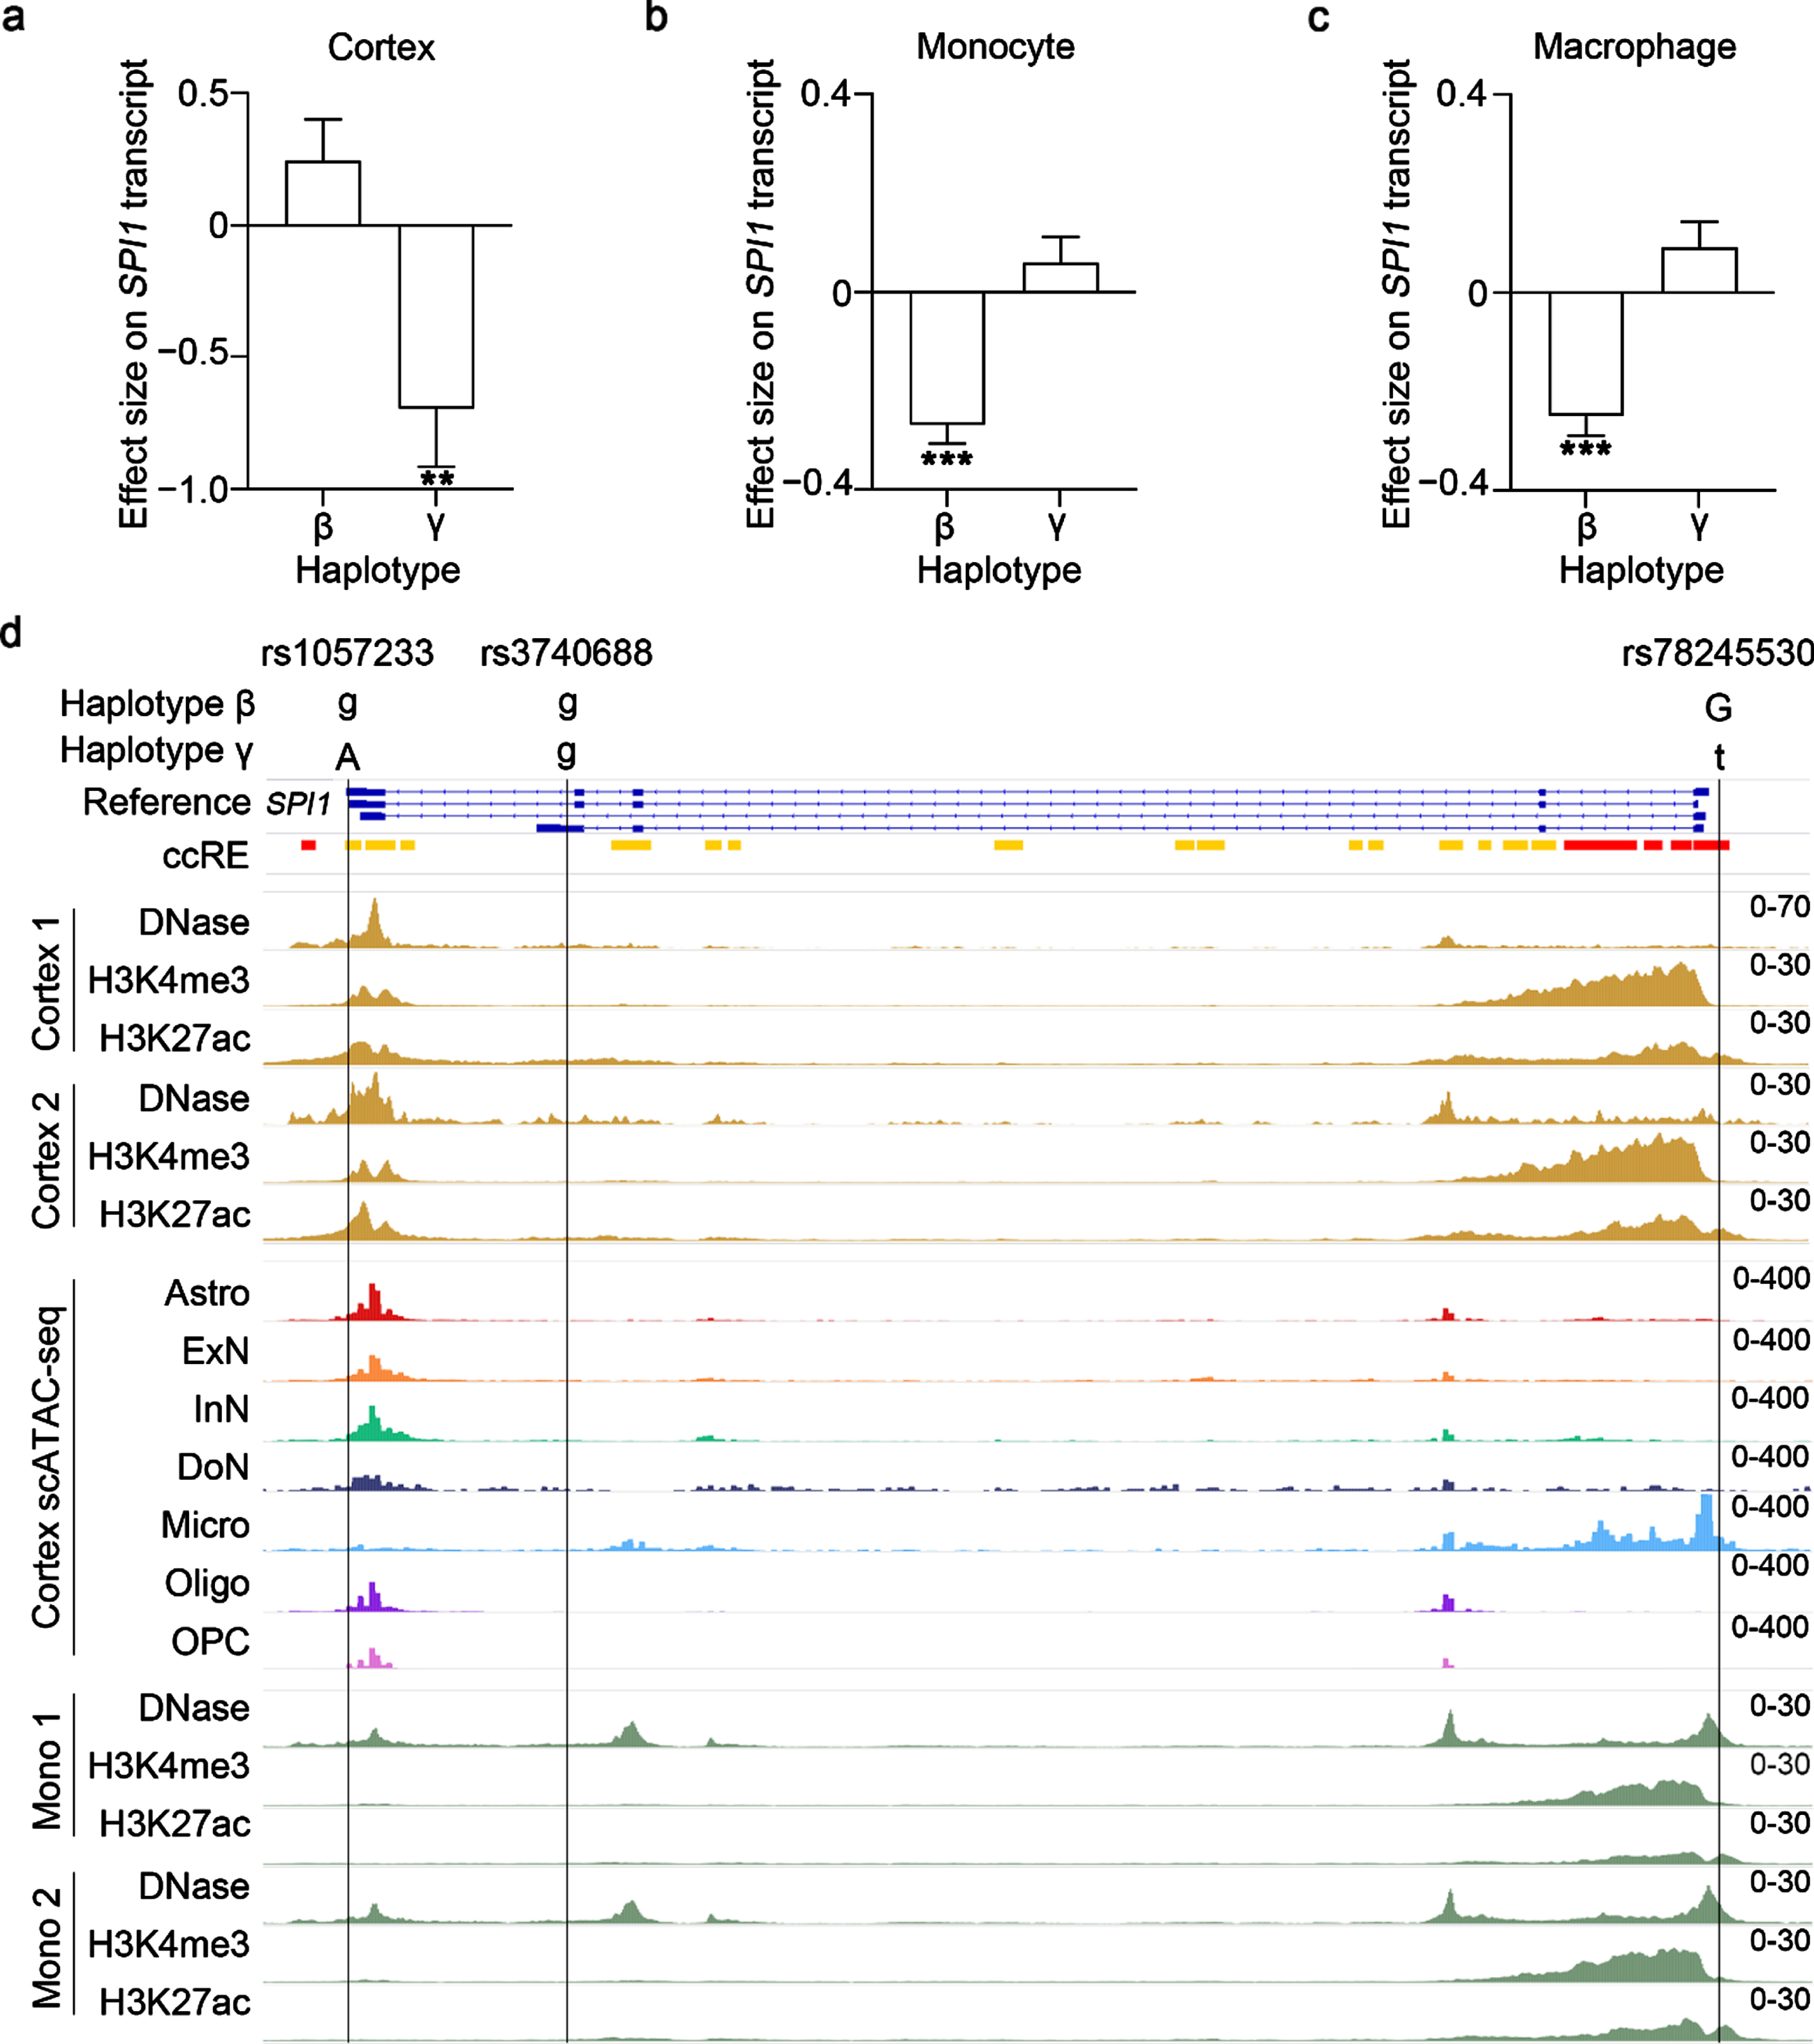
Since changes in SPI1 brain transcript level are associated with AD [8], we investigated whether the AD-protective SPI1 haplotypes modulate SPI1 transcript level in human tissues. We queried the GTEx dataset (84.6% of the donors are of European descent) for SPI1 transcript level quantified by RNA-seq in 47 human tissues [18] and found that most human tissues express SPI1 transcript (TPM: 2.0–934.7; Supplementary Table 8). To investigate the possible functions of the identified haplotypes in the AD context, we first examined the genotype-expression association in brain tissues. Interestingly, haplotype γ was significantly associated with SPI1 transcript level in the brain tissues, specifically in the cerebral cortex (Beta = –0.447±0.166, p = 0.008) and frontal cortex (Beta = –0.361±0.174, p = 0.039; Supplementary Table 9). As haplotype γ only exhibited a significant AD-protective effect among APOE33 participants in AD cohorts of European descent, we conducted an association analysis in the brain tissues of APOE33 donors. We found that haplotype γ was significantly associated with decreased SPI1 transcript level in the cortex tissues from APOE33 donors in the GTEx dataset (Beta = –0.693±0.223, p = 0.002; Fig. 2a; Supplementary Table 10) and in the frontal cortex tissues from the BRAINEAC database (Beta = –0.146±0.071, p = 0.042; European descent; Supplementary Table 11). Together, these findings suggest that haplotype γ plays a regulatory role in SPI1 gene expression in the brain tissues of APOE33 donors of European descent. Meanwhile, haplotype β was associated with increased SPI1 transcript level in the cerebellum, which is usually unaffected in AD (Beta = 0.258±0.109, p = 0.019; Supplementary Table 9) [40].
Fig. 2
Effects of SPI1 haplotypes on the regulation of SPI1 transcript level. a–c) Associations between SPI1 haplotypes and SPI1 transcript level in (a) the cortex, (b) monocytes, and (c) macrophages from APOE33 donors. Rectangles and error bars denote the effect size and standard error, respectively. ***p < 0.001, **p < 0.01, *p < 0.05. d) Epigenetic modification of the SNP-harboring region for the SPI1 haplotypes’ tag SNPs. Panels from top to bottom are the gene structure and coordinates of SPI1. Boxes and lines denote exons and introns, respectively. Red and yellow bars represent candidate cis-regulatory elements (ccREs) with high H3K4me3 and H3K27ac signals, respectively. Signals of DNase sequencing (DNase-seq), H3K4me3 chromatin immunoprecipitation sequencing (ChIP-seq), and H3K27ac ChIP-seq in the cerebral cortex. Signals of single-cell assay for transposase-accessible chromatin using sequencing (scATAC-seq) in the cerebral cortex. Signals of DNase-seq, H3K4me3 ChIP-seq, and H3K27ac ChIP-seq in blood mononuclear cells. Please refer to Supplementary Figure 2 for all available biological replicates. Astro, astrocyte. ExN, excitatory neuron; InN, Inhibitory neuron; Micro, microglia; Oligo, oligodendrocyte; OPC, oligodendrocyte progenitor cell.
To examine whether haplotype γ affects SPI1 gene expression in specific brain cell types, we analyzed a previously reported single-nucleus RNA sequencing (snRNA-seq) dataset of the human frontal cortex [41]. SPI1 transcripts were mainly expressed by microglia (Supplementary Figure 1a), suggesting the association between haplotype γ and SPI1 transcript level in the brain was primarily contributed by microglia. As altered brain SPI1 transcript level can represent changes of microglia number or microglial SPI1 gene expression, we performed a cell-type deconvolution analysis of GTEx brain tissues by CIBERSORTx using brain snRNA-seq data as the reference [42]. Interestingly, after controlling for the proportion of microglia in the cortex tissues from APOE33 donors, we found that haplotype γ was still associated with decreased SPI1 transcript level (Beta = –0.468±0.180, p = 0.010; Supplementary Table 10); indeed, haplotype γ did not seem to affect microglia number in the cortex tissues from APOE33 donors (p = 0.233; Supplementary Figure 1b). These results collectively suggest that haplotype γ could modulate SPI1 gene expression in the cerebral cortex.
As blood plays a key role in the peripheral immune system and expresses the highest level of SPI1 transcript as compared to other tissues (median TPM = 934.7; Supplementary Table 8), we examined the association between the SPI1 haplotypes and SPI1 transcript level in the blood. Interestingly, only haplotype β was associated with lower SPI1 transcript level in the whole blood (Beta = –0.119±0.060, p = 0.047; Supplementary Table 9). We conducted a subsequent analysis of monocytes and macrophages probed from the Cardiogenics study that was conducted in European [20] (n = 758 and 599 monocytes and macrophages, respectively) and found that haplotype β was strongly associated with decreased SPI1 gene expression in monocytes and macrophages from both all donors and only APOE33 donors (p < 2×10⁻⁹; Fig. 2b, c; Supplementary Table 12). Hence, these results suggest that haplotype β modulates SPI1 gene expression in the blood, specifically in monocytes and macrophages.
Non-coding variants may regulate gene expression by altering binding with miRNAs or altering epigenetic landscapes. To explore the underlying regulatory mechanisms of haplotypes β and γ, we examined the putative regulatory functions of their tag SNPs (i.e., rs1057233, rs3740688, and rs78245530). Interestingly, we found that rs1057233 and rs78245530 reside in the candidate cis-regulatory element of SPI1 as revealed by the SCREEN database (Fig. 2d) [34]. Moreover, rs1057233 resides in the 3’-UTR of SPI1, which is a target binding site of miRNAs [43]. Accordingly, we queried the miRNASNP database and found that rs1057233 may alter the binding affinity of the 3’-UTR of SPI1 with multiple miRNAs (Supplementary Table 13) [44]. Among those miRNAs, we identified hsa-miR–569, whose binding with the 3’-UTR of SPI1 is reportedly affected by rs1057233 [43]. To further dissect the regulatory roles of rs1057233- and rs78245530-harboring regions in the brain and blood tissues, we queried the epigenetic profiles from the EpiMap database [35]. In the cerebral cortex, rs1057233- and rs78245530-harboring regions exhibited enhancer activity (indicated by the low H3K4me3 signal and high H3K27ac signal [45]) (Fig. 2d). We further queried scATAC-seq data in the cortex and found that only the rs78245530-harboring region exhibited high DNA accessibility, specifically in microglia (Fig. 2d) [36]. Meanwhile, in mononuclear cells, the rs78245530-harboring region also exhibited chromatin accessibility (indicated by the DNase-seq signal) and enhancer activity (indicated by the low H3K4me3 signal and high H3K27ac signal) (Fig. 2d; Supplementary Figure 2). Therefore, these results suggest that haplotypes β and γ could modulate SPI1 gene expression by altering miRNA binding or the regulatory activities of the tag SNP-harboring regions.
Association between SPI1 haplotypes and biological pathways
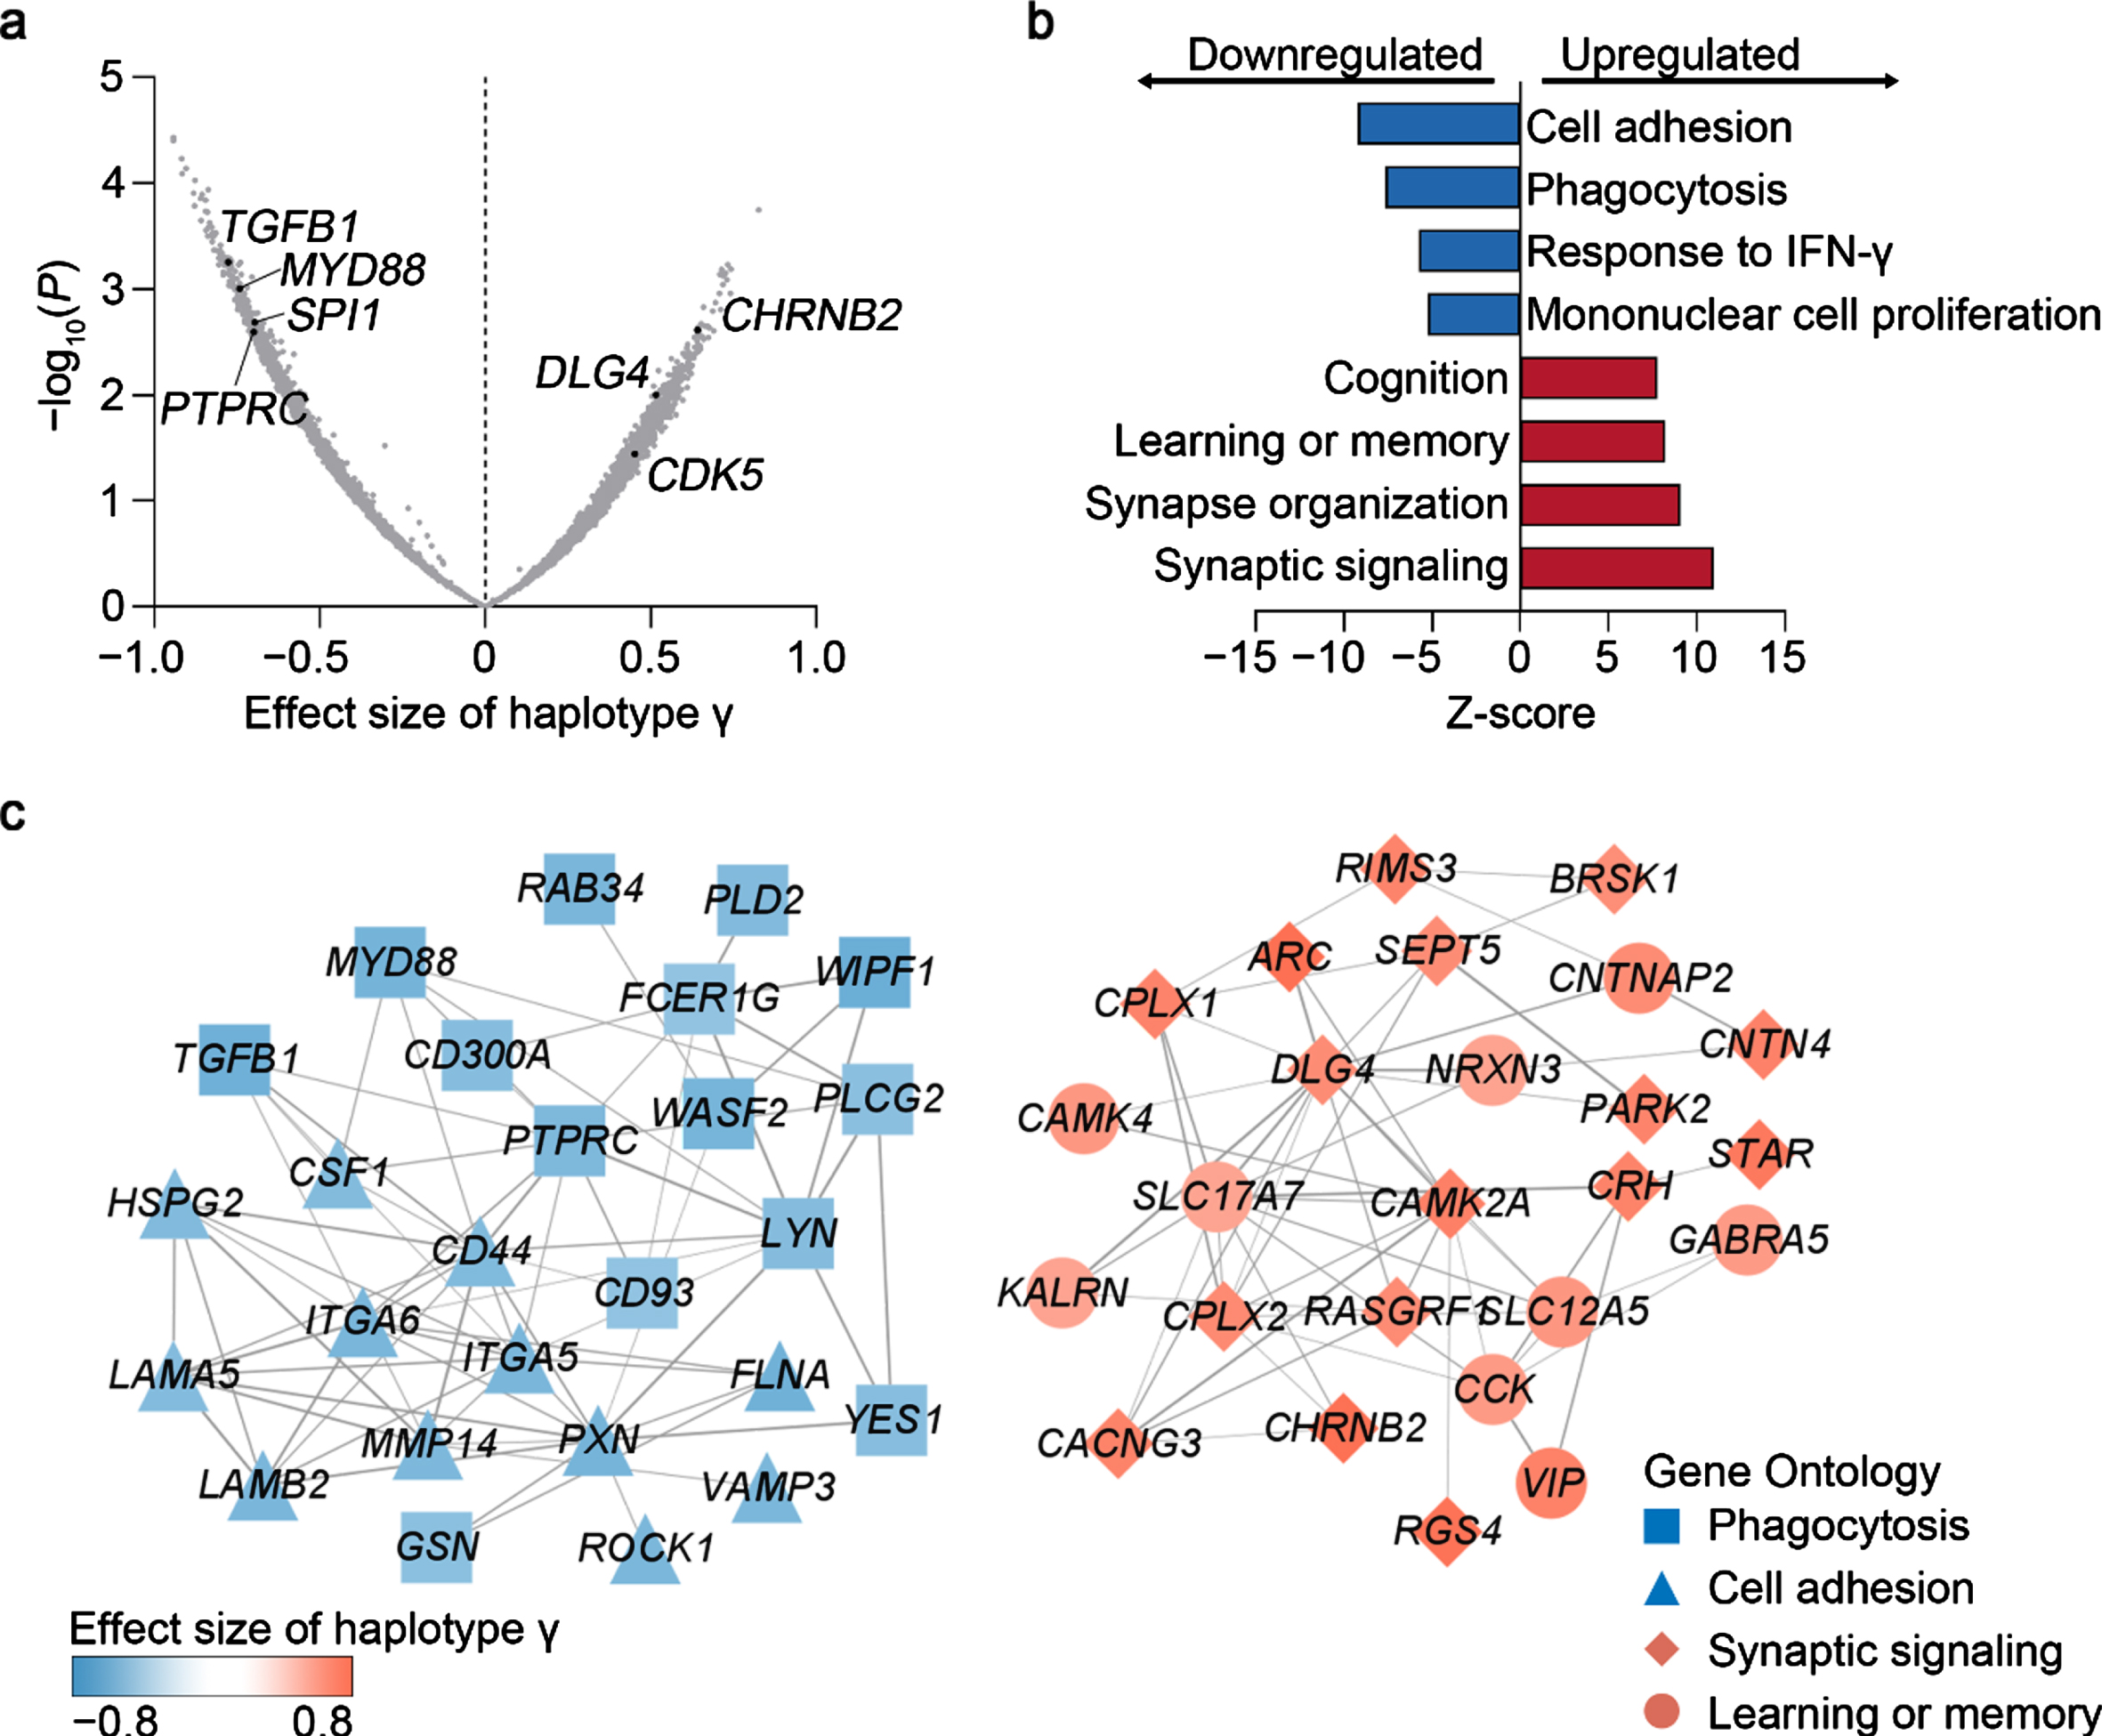
Given that haplotype γ is associated with better cognitive performance in APOE33 participants of European descent (Fig. 1d), it may modulate brain functions. Accordingly, we examined the genes and/or pathways potentially modulated by haplotype γ using the transcriptomic data of cortex tissues obtained from APOE33 donors in the GTEx dataset. Interestingly, we found that haplotype γ was associated with the brain expression level of specific genes involved in innate immunity response (e.g., TGFB1, MYD88, and PTPRC) and neuronal functions (e.g., CHRNB2, DLG4, and CDK5), suggesting that haplotype γ has a regulatory effect on these pathways (Fig. 3a). Specifically, the downregulated genes are involved in “cell adhesion” (false discovery rate [FDR] = 3.2×10⁻²⁰) and “phagocytosis” (FDR = 2.1×10⁻¹⁴; Fig. 3b), while the upregulated genes are involved in “synaptic signaling” (FDR = 4.2×10⁻²⁸) and “learning or memory” (FDR = 1.8×10⁻¹⁶; Fig. 3b). Protein–protein interaction (PPI) network analysis revealed strong interactions among dysregulated genes (PPI enrichment p < 1×10–16; Fig. 3c), which again confirmed the possible regulatory role of haplotype γ in the aforementioned pathways. Meanwhile, we also examined the association between haplotype β and transcriptomic changes in the cerebral cortex and monocytes. We found that haplotype β was associated with decreased gene expression of immune response pathways, including “Fc-γ receptor signaling” in the cerebral cortex (FDR = 0.002; Supplementary Figure 3a, b) and “pattern cognition receptor signaling” in monocytes (FDR = 0.049; Supplementary Figure 3c, d). These results collectively suggest that SPI1 haplotypes exert AD-protective effect by modulating immune and neuronal functions.
Fig. 3
Associations between haplotype γ and transcriptomic changes in the cerebral cortex in APOE33 donors. a) Volcano plot showing the associations between haplotype γ and cortical gene expression. b) Gene Ontology analysis of genes modulated by haplotype γ in the cerebral cortex. c) Protein–protein interaction network of genes involved in immune and neuronal functions. Nodes and edges denote genes and their interactions. Node shapes represent the ontology of corresponding genes. Node colors denote the effect size of haplotype γ on transcript level.
DISCUSSION
Here, we conducted the first genetic analysis of SPI1 haplotypes tagged by three previously reported SPI1 SNPs (i.e., rs1057233, rs3740688, and rs78245530) that are associated with AD in both populations of Chinese and European descent. Corroborating previous observations found in populations of European descent, we demonstrated that the rs3740688 g-allele exerts an AD-protective effect in the Chinese population. Interestingly, we identified that AD-protective SPI1 haplotypes β and γ can modulate SPI1 gene expression. Specifically, haplotype β is associated with decreased SPI1 gene expression in blood monocytes and macrophages, while haplotype γ is associated with decreased SPI1 gene expression in the cerebral cortex. Moreover, GO analysis shows that the AD-protective haplotype γ is associated with transcriptomic changes involved in immune and neuronal functions in the cerebral cortex, suggesting that haplotype γ regulates these pathways in the brain tissues. Therefore, our results identified AD-protective SPI1 haplotypes and reveal their possible roles in AD pathogenesis, suggesting SPI1 as a target for AD intervention.
Compared to SNP-based studies, haplotype analysis can increase the statistical power of genetic analysis and identify key disease-associated SNPs or haplotypes [46]. For example, a genome-wide haplotype association analysis in populations of European descent identified new AD risk haplotypes in the FRMD4A locus [47]. Meanwhile, a haplotype analysis in the APOE locus identified risk haplotypes that are independent of the APOE ɛ4 allele [48]. In the SPI1 locus, a common haplotype tagged by SNP rs1057233 (denoted as SPI1 haplotype β in this study) was shown to protect against AD risk [5]. Here, we identified another SPI1 haplotype, haplotype γ, that exerts an AD-protective effect independent of haplotype β. Interestingly, as haplotype γ exhibits different frequencies in different ethnic populations (frequency > 0.106 in European descent; frequency = 0.027 in Chinese), it may have an ethnic-specific effect on AD risk. Thus, haplotype analysis may not only expand our understanding of the disease risk of known disease-associated loci, but conducting such haplotype analysis in a genome-wide manner is a critical step in uncovering the genetic basis of human diseases.
GWAS studies reveal that most disease-associated variants are non-coding variants. Non-coding DNA comprise most of the human genome (> 98%) and are vital in the regulation of gene expression [49]. For example, a genome-wide fine-mapping study revealed that 27 of 36 AD risk loci colocalized with expression quantitative trait loci in multiple tissues [50]. Interestingly, our analysis shows that the non-coding variants of SPI1 could modulate SPI1 gene expression in a tissue-specific manner—haplotype β decreases blood SPI1 gene expression, while haplotype γ decreases brain SPI1 gene expression. Moreover, our study indicates that haplotypes β and γ may exert distinct regulatory mechanisms on gene expression through altering miRNA binding and the epigenetic landscape, respectively. Thus, to dissect the pathological mechanisms of disease-associated genes, it is important to conduct fine-mapping analyses of non-coding variants of those genes and examine their roles in the gene expression regulation.
Given that SPI1 encodes a transcription factor (i.e., PU.1) that regulates the expression of immune-related genes [7], SPI1 dysregulation may alter the expression of those genes and thus modulate immune function. For example, manipulation of SPI1 gene expression can change the gene expression of microglia and modify phagocytic activity [5]. Accordingly, the AD-protective SPI1 haplotype γ is associated with lower brain transcript level of immune-related genes, including microglial activation signatures (e.g., TGFB1, MYD88, and PTPRC; Fig. 3a). Notably, we also observed that haplotype γ is associated with higher brain transcript level of key genes involved in neuronal functions, including CDK5, DLG4, and CHRIN2B (Fig. 3a). For instance, CDK5 is essential for synaptic plasticity and neurodegeneration [51]. Hence, further studies are required to understand the role of SPI1 in the central nervous system, especially in microglial and neuronal functions, to help dissect the mechanisms underlying AD pathogenesis.
This study investigated the role of SPI1 haplotypes (tagged by known AD-protective SNPs) in modulating AD risk in populations of Chinese and European descent. However, further analyses—including those that examine a larger cohort to assess the association between the identified SPI1 haplotypes and AD as well as validate the modulatory effects of the SPI1 haplotypes on disease-associated phenotypes (including age of onset and cognitive performance) in additional independent cohorts—will help confirm the observations of this study. Moreover, while the epigenetic profiles of specific SPI1 genetic variant-harboring regions provide insights into the functions of those regions, functional studies may help elucidate the mechanisms by which the SPI1 haplotypes modulate SPI1 gene expression and hence alter AD-associated functions of microglia [52, 53].
ACKNOWLEDGMENTS
We thank Pauline Kwan, Hazel Mok, Dr. Phillip Y.C. Chan, Choi Ying Ling, and Bonnie W. Wong for coordinating the clinical data collection. We also thank Ka Chun Lok, Cara Wing Si Kwong, Tiffany Tze Wing Mak, Yolanda Yuen Tung Li, Yan Ma, and Saijuan Liu for their excellent technical assistance. We also thank Shun Fat Lau, Wei Wu, and other members of the Ip Laboratory for their many helpful discussions. This work was supported in part by the National Key R&D Program of China (2018YFE0203600), the Research Grants Council of Hong Kong (the Theme-Based Research Scheme [T13-607/12R] and the Collaborative Research Fund [C6027-19GF]), the Areas of Excellence Scheme of the University Grants Committee (AoE/M-604/16), the Innovation and Technology Commission (ITCPD/17–9), the Guangdong Provincial Fund for Basic and Applied Basic Research (2019B1515130004), the NSFC-RGC Joint Research Scheme (32061160472), the Guangdong Provincial Key S&T Program (2018B030336001), the Shenzhen Knowledge Innovation Program (JCYJ20180507183642005 and JCYJ20200109115631248), and the Guangdong–Hong Kong–Macao Greater Bay Area Center for Brain Science and Brain-Inspired Intelligence Fund (2019001 and 2019003).
Please refer to the Supplementary Material for acknowledgments corresponding to the Alzheimer’s Disease Neuroimaging Initiative (ADNI) dataset, the Alzheimer’s Disease Genetics Consortium (ADGC) Genome Wide Association Study–National Institute on Aging (NIA) Alzheimer’s Disease Centers (ADC) Cohort dataset, the NIA–Late Onset Alzheimer’s Disease (LOAD) Family Study dataset, the Genotype-Tissue Expression (GTEx) Project dataset, the BRAINEAC database, and the Cardiogenics Study dataset.
Authors’ disclosures available online (https://www.j-alz.com/manuscript-disclosures/21-5311r1).
SUPPLEMENTARY MATERIAL
[1] The supplementary material is available in the electronic version of this article: https://dx.doi.org/10.3233/JAD-215311.
REFERENCES
[1] | Gatz M , Reynolds CA , Fratiglioni L , Johansson B , Mortimer JA , Berg S , Fiske A , Pedersen NL ((2006) ) Role of genes and environments for explaining Alzheimer disease. Arch Gen Psychiatry 63: , 168–174. |
[2] | Gatz M , Pedersen NL , Berg S , Johansson B , Johansson K , Mortimer JA , Posner SF , Viitanen M , Winblad B , Ahlbom A ((1997) ), Heritability for Alzheimer’s Disease: The Study of Dementia in Swedish Twins. |
[3] | Yamazaki Y , Zhao N , Caulfield TR , Liu CC , Bu G ((2019) ) Apolipoprotein E and Alzheimer disease: Pathobiology and targeting strategies. Nat Rev Neurol 15: , 501–518. |
[4] | Kunkle BW , Grenier-Boley B , Sims R , Bis JC , Damotte V , Naj AC , Boland A , Vronskaya M , van der Lee SJ , Amlie-Wolf A , et al. ((2019) ) Genetic meta-analysis of diagnosed Alzheimer’s disease identifies new risk loci and implicates Aβ, tau, immunity and lipid processing. Nat Genet 51: , 414–430. |
[5] | Huang KL , Marcora E , Pimenova AA , Di Narzo AF , Kapoor M , Jin SC , Harari O , Bertelsen S , Fairfax BP , Czajkowski J , Chouraki V , Grenier-Boley B , Bellenguez C , Deming Y , McKenzie A , Raj T , Renton AE , Budde J , Smith A , Fitzpatrick A , Bis JC , DeStefano A , Adams HHH , Ikram MA , Van Der Lee S , Del-Aguila JL , Fernandez MV , Ibañez L , Sims R , Escott-Price V , Mayeux R , Haines JL , Farrer LA , Pericak-Vance MA , Lambert JC , Van Duijn C , Launer L , Seshadri S , Williams J , Amouyel P , Schellenberg GD , Zhang B , Borecki I , Kauwe JSK , Cruchaga C , Hao K , Goate AM ((2017) ) A common haplotype lowers PU.1 expression in myeloid cells and delays onset of Alzheimer’s disease. Nat Neurosci 20: , 1052–1061. |
[6] | Marioni RE , Harris SE , Zhang Q , McRae AF , Hagenaars SP , Hill WD , Davies G , Ritchie CW , Gale CR , Starr JM , Goate AM , Porteous DJ , Yang J , Evans KL , Deary IJ , Wray NR , Visscher PM ((2018) ) GWAS on family history of Alzheimer’s disease. Transl Psychiatry 8: , 99. |
[7] | McKercher SR , Torbett BE , Anderson KL , Henkel GW , Vestal DJ , Baribault H , Klemsz M , Feeney AJ , Wu GE , Paige CJ , Maki RA ((1996) ) Targeted disruption of the PU.1 gene results in multiple hematopoietic abnormalities. EMBO J 15: , 5647–5658. |
[8] | Morabito S , Miyoshi E , Michael N , Swarup V ((2020) ) Integrative genomics approach identifies conserved transcriptomic networks in Alzheimer’s disease. Hum Mol Genet 29: , 2899–2919. |
[9] | Nasreddine ZS , Phillips NA , Bédirian V , Charbonneau S , Whitehead V , Collin I , Cummings JL , Chertkow H ((2005) ) The Montreal Cognitive Assessment, MoCA: A brief screening tool for mild cognitive impairment. J Am Geriatr Soc 53: , 695–699. |
[10] | American Psychological Association (APA) ((2013) ) Diagnostic and Statistical Manual of Mental Disorders, 5th Edition: DSM-5, American Psychiatric Publishing, Inc. |
[11] | Chen S , Zhou Y , Chen Y , Gu J ((2018) ) fastp: An ultra-fast all-in-one FASTQ preprocessor. Bioinformatics 34: , i884–i890. |
[12] | Li H , Durbin R ((2009) ) Fast and accurate short read alignment with Burrows-Wheeler transform. Bioinformatics 25: , 1754–1760. |
[13] | DePristo MA , Banks E , Poplin R , Garimella K V , Maguire JR , Hartl C , Philippakis AA , del Angel G , Rivas MA , Hanna M , McKenna A , Fennell TJ , Kernytsky AM , Sivachenko AY , Cibulskis K , Gabriel SB , Altshuler D , Daly MJ ((2011) ) A framework for variation discovery and genotyping using next-generation DNA sequencing data. Nat Genet 43: , 491–498. |
[14] | Browning SR , Browning BL ((2007) ) Rapid and accurate haplotype phasing and missing-data inference for whole-genome association studies by use of localized haplotype clustering. Am J Hum Genet 81: , 1084. |
[15] | Weiner MW , Aisen PS , Jack CR , Jagust WJ , Trojanowski JQ , Shaw L , Saykin AJ , Morris JC , Cairns N , Beckett LA , Toga A , Green R , Walter S , Soares H , Snyder P , Siemers E , Potter W , Cole PE , Schmidt M ((2010) ) The Alzheimer’s Disease Neuroimaging Initiative: Progress report and future plans. Alzheimers Dement 6: , 202–211.e7. |
[16] | Morris JC , Weintraub S , Chui HC , Cummings J , DeCarli C , Ferris S , Foster NL , Galasko D , Graff-Radford N , Peskind ER , Beekly D , Ramos EM , Kukull WA ((2006) ) The Uniform Data Set (UDS): Clinical and cognitive variables and descriptive data from Alzheimer disease centers. Alzheimer Dis Assoc Disord 20: , 210–216. |
[17] | Lee JH , Cheng R , Graff-Radford N , Foroud T , Mayeux R ((2008) ) Analyses of the national institute on aging late-onset Alzheimer’s disease family study: Implication of additional loci. Arch Neurol 65: , 1518–1526. |
[18] | Aguet F , Barbeira AN , Bonazzola R , Brown A , Castel SE , Jo B , Kasela S , Kim-Hellmuth S , Liang Y , Oliva M , et al. ((2020) ) The GTEx Consortium atlas of genetic regulatory effects across human tissues. Science 369: , 1318–1330. |
[19] | Ramasamy A , Trabzuni D , Guelfi S , Varghese V , Smith C , Walker R , De T , Consortium UBE , Consortium NABE , Coin L , Silva R de , Cookson MR , Singleton AB , Hardy J , Ryten M , Weale ME ((2014) ) Genetic variability in the regulation of gene expression in ten regions of the human brain. Nat Neurosci 17: , 1418. |
[20] | Garnier S , Truong V , Brocheton J , Zeller T , Rovital M , Wild PS , Ziegler A , Munzel T , Tiret L , Blankenberg S , Deloukas P , Erdmann J , Hengstenberg C , Samani NJ , Schunkert H , Ouwehand WH , Goodall AH , Cambien F , Trégouët D-A ((2013) ) Genome-wide haplotype analysis of Cis expression quantitative trait loci in monocytes. PLoS Genet 9: , e1003240. |
[21] | Taliun D , Harris DN , Kessler MD , Carlson J , Szpiech ZA , Torres R , Taliun SAG , Corvelo A , Gogarten SM , Kang HM , et al. ((2021) ) Sequencing of 53,831 diverse genomes from the NHLBI TOPMed Program. Nature 590: , 290–299. |
[22] | Das S , Forer L , Schönherr S , Sidore C , Locke AE , Kwong A , Vrieze SI , Chew EY , Levy S , McGue M , Schlessinger D , Stambolian D , Loh PR , Iacono WG , Swaroop A , Scott LJ , Cucca F , Kronenberg F , Boehnke M , Abecasis GR , Fuchsberger C ((2016) ) Next-generation genotype imputation service and methods. Nat Genet 48: , 1284–1287. |
[23] | Chang CC , Chow CC , Tellier LC , Vattikuti S , Purcell SM , Lee JJ ((2015) ) Second-generation PLINK: Rising to the challenge of larger and richer datasets. Gigascience 4: , 7. |
[24] | McCaw ZR , Lane JM , Saxena R , Redline S , Lin X ((2020) ) Operating characteristics of the rank-based inverse normal transformation for quantitative trait analysis in genome-wide association studies. Biometrics 76: , 1262–1272. |
[25] | Graffelman J ((2015) ) Exploring diallelic genetic markers: The HardyWeinberg package. J Stat Softw 64: , 1–23. |
[26] | Danecek P , Bonfield JK , Liddle J , Marshall J , Ohan V , Pollard MO , Whitwham A , Keane T , McCarthy SA , Davies RM , Li H ((2021) ) Twelve years of SAMtools and BCFtools. Gigascience 10: , 1–4. |
[27] | Therneau TM , Grambsch PM ((2000) ) Modeling Survival Data: Extending the Cox Model, Springer New York, New York, NY. |
[28] | Shabalin AA ((2012) ) Matrix eQTL: Ultra fast eQTL analysis via large matrix operations. Bioinformatics 28: , 1353–1358. |
[29] | Todorov V , Filzmoser P ((2010) ) An object-oriented framework for robust multivariate analysis. J Stat Softw 32: , 1–47. |
[30] | Han B , Eskin E ((2011) ) Random-effects model aimed at discovering associations in meta-analysis of genome-wide association studies. Am J Hum Genet 88: , 586–598. |
[31] | Yu G , Wang LG , Han Y , He QY ((2012) ) ClusterProfiler: An R package for comparing biological themes among gene clusters. Omi A J Integr Biol 16: , 284–287. |
[32] | Szklarczyk D , Gable AL , Lyon D , Junge A , Wyder S , Huerta-Cepas J , Simonovic M , Doncheva NT , Morris JH , Bork P , Jensen LJ , Von Mering C ((2019) ) STRING v11: Protein–protein association networks with increased coverage, supporting functional discovery in genome-wide experimental datasets. Nucleic Acids Res 47: , D607–D613. |
[33] | Shannon P , Markiel A , Ozier O , Baliga NS , Wang JT , Ramage D , Amin N , Schwikowski B , Ideker T ((2003) ) Cytoscape: A software Environment for integrated models of biomolecular interaction networks. Genome Res 13: , 2498–2504. |
[34] | Abascal F , Acosta R , Addleman NJ , Adrian J , Afzal V , Aken B , Akiyama JA , Jammal O Al , Amrhein H , Anderson SM , et al. ((2020) ) Expanded encyclopaedias of DNA elements in the human and mouse genomes. Nature 583: , 699–710. |
[35] | Boix CA , James BT , Park YP , Meuleman W , Kellis M ((2021) ) Regulatory genomic circuitry of human disease loci by integrative epigenomics. Nature 590: , 300–307. |
[36] | Corces MR , Shcherbina A , Kundu S , Gloudemans MJ , Frésard L , Granja JM , Louie BH , Eulalio T , Shams S , Bagdatli ST , Mumbach MR , Liu B , Montine KS , Greenleaf WJ , Kundaje A , Montgomery SB , Chang HY , Montine TJ ((2020) ) Single-cell epigenomic analyses implicate candidate causal variants at inherited risk loci for Alzheimer’s and Parkinson’s diseases. Nat Genet 52: , 1158–1168. |
[37] | Barrett JC , Fry B , Maller J , Daly MJ ((2005) ) Haploview: Analysis and visualization of LD and haplotype maps. Bioinformatics 21: , 263–265. |
[38] | Kang EY , Park Y , Li X , Segrè AV , Han B , Eskin E ((2016) ) ForestPMPlot: A flexible tool for visualizing heterogeneity between studies in meta-analysis. G3 (Bethesda) 6: , 1793–1798. |
[39] | Zhou X , Chen Y , Ip FCF , Lai NCH , Li YYT , Jiang Y , Zhong H , Chen Y , Zhang Y , Ma S , Lo RMN , Cheung K , Tong EPS , Ko H , Shoai M , Mok KY , Hardy J , Mok VCT , Kwok TCY , Fu AKY , Ip NY ((2020) ) Genetic and polygenic risk score analysis for Alzheimer’s disease in the Chinese population. Alzheimers Dement (Amst) 12: , e12074. |
[40] | Hirano A , Zimmerman HM ((1962) ) Alzheimer’s neurofibrillary changes: A topographic study. Arch Neurol 7: , 227–242. |
[41] | Lau SF , Cao H , Fu AKY , Ip NY ((2020) ) Single-nucleus transcriptome analysis reveals dysregulation of angiogenic endothelial cells and neuroprotective glia in Alzheimer’s disease. Proc Natl Acad Sci U S A 117: , 25800–25809. |
[42] | Newman AM , Steen CB , Liu CL , Gentles AJ , Chaudhuri AA , Scherer F , Khodadoust MS , Esfahani MS , Luca BA , Steiner D , Diehn M , Alizadeh AA ((2019) ) Determining cell type abundance and expression from bulk tissues with digital cytometry. Nat Biotechnol 37: , 773–782. |
[43] | Hikami K , Kawasaki A , Ito I , Koga M , Ito S , Hayashi T , Matsumoto I , Tsutsumi A , Kusaoi M , Takasaki Y , Hashimoto H , Arinami T , Sumida T , Tsuchiya N ((2011) ) Association of a functional polymorphism in the 3’-untranslated region of SPI1 with systemic lupus erythematosus. Arthritis Rheum 63: , 755–763. |
[44] | Liu CJ , Fu X , Xia M , Zhang Q , Gu Z , Guo AY ((2021) ) MiRNASNP-v3: A comprehensive database for SNPs and disease-related variations in miRNAs and miRNA targets. Nucleic Acids Res 49: , D1276–D1281. |
[45] | Creyghton MP , Cheng AW , Welstead GG , Kooistra T , Carey BW , Steine EJ , Hanna J , Lodato MA , Frampton GM , Sharp PA , Boyer LA , Young RA , Jaenisch R ((2010) ) Histone H3K27ac separates active from poised enhancers and predicts developmental state. Proc Natl Acad Sci U S A 107: , 21931–21936. |
[46] | Morris RW , Kaplan NL ((2002) ) On the advantage of haplotype analysis in the presence of multiple disease susceptibility alleles. Genet Epidemiol 23: , 221–233. |
[47] | Lambert JC , Grenier-Boley B , Harold D , Zelenika D , Chouraki V , Kamatani Y , Sleegers K , Ikram MA , Hiltunen M , Reitz C , Mateo I , Feulner T , Bullido M , Galimberti D , Concari L , Alvarez V , Sims R , Gerrish A , Chapman J , Deniz-Naranjo C , Solfrizzi V , Sorbi S , Arosio B , Spalletta G , Siciliano G , Epelbaum J , Hannequin D , Dartigues JF , Tzourio C , Berr C , Schrijvers EMC , Rogers R , Tosto G , Pasquier F , Bettens K , Van Cauwenberghe C , Fratiglioni L , Graff C , Delepine M , Ferri R , Reynolds CA , Lannfelt L , Ingelsson M , Prince JA , Chillotti C , Pilotto A , Seripa D , Boland A , Mancuso M , Bossù P , Annoni G , Nacmias B , Bosco P , Panza F , Sanchez-Garcia F , Del Zompo M , Coto E , Owen M , O’Donovan M , Valdivieso F , Caffara P , Scarpini E , Combarros O , Buée L , Campion D , Soininen H , Breteler M , Riemenschneider M , Van Broeckhoven C , Alpérovitch A , Lathrop M , Trégouët DA , Williams J , Amouyel P ((2013) ) Genome-wide haplotype association study identifies the FRMD4A gene as a risk locus for Alzheimer’s disease. Mol Psychiatry 18: , 461–470. |
[48] | Zhou X , Chen Y , Mok KY , Kwok TCY , Mok VCT , Guo Q , Ip FC , Chen Y , Mullapudi N , Giusti-Rodríguez P , Sullivan PF , Hardy J , Fu AKY , Li Y , Ip NY ((2019) ) Non-coding variability at the APOE locus contributes to the Alzheimer’s risk. Nat Commun 10: , 3310. |
[49] | Craig Venter J , Adams MD , Myers EW , Li PW , Mural RJ , Sutton GG , Smith HO , Yandell M , Evans CA , Holt RA , et al. ((2001) ) The sequence of the human genome. Science 291: , 1304–1351. |
[50] | Schwartzentruber J , Cooper S , Liu JZ , Barrio-Hernandez I , Bello E , Kumasaka N , Young AMH , Franklin RJM , Johnson T , Estrada K , Gaffney DJ , Beltrao P , Bassett A ((2021) ) Genome-wide meta-analysis, fine-mapping and integrative prioritization implicate new Alzheimer’s disease risk genes. Nat Genet 53: , 392–402. |
[51] | Cheung ZH , Ip NY ((2012) ) Cdk5: A multifaceted kinase in neurodegenerative diseases. Trends Cell Biol 22: , 169–175. |
[52] | Lau SF , Chen C , Fu WY , Qu JY , Cheung TH , Fu AKY , Ip NY ((2020) ) IL-33-PU.1 Transcriptome reprogramming drives functional state transition and clearance activity of microglia in Alzheimer’s disease. Cell Rep 31: , 107530. |
[53] | Pimenova AA , Herbinet M , Gupta I , Machlovi SI , Bowles KR , Marcora E , Goate AM ((2021) ) Alzheimer’s-associated PU.1 expression levels regulate microglial inflammatory response. Neurobiol Dis 148: , 105217. |


