
Data-Driven Analyses of Longitudinal Hippocampal Imaging Trajectories: Discrimination and Biomarker Prediction of Change Classes
Abstract
Background:
Hippocampal atrophy is a well-known biomarker of neurodegeneration, such as that observed in Alzheimer’s disease (AD). Although distributions of hippocampal volume trajectories for asymptomatic individuals often reveal substantial heterogeneity, it is unclear whether interpretable trajectory classes can be objectively detected and used for prediction analyses.
Objective:
To detect and predict hippocampal trajectory classes in a computationally competitive context using established AD-related risk factors/biomarkers.
Methods:
We used biomarker/risk factor and longitudinal MRI data in asymptomatic adults from the AD Neuroimaging Initiative (n = 351; Mean = 75 years; 48.7% female). First, we applied latent class growth analyses to left (LHC) and right (RHC) hippocampal trajectory distributions to identify distinct classes. Second, using random forest analyses, we tested 38 multi-modal biomarkers/risk factors for their relative importance in discriminating the lower (potentially elevated atrophy risk) from the higher (potentially reduced risk) class.
Results:
For both LHC and RHC trajectory distribution analyses, we observed three distinct trajectory classes. Three biomarkers/risk factors predicted membership in LHC and RHC lower classes: male sex, higher education, and lower plasma Aβ1–42. Four additional factors selectively predicted membership in the lower LHC class: lower plasma tau and Aβ1–40, higher depressive symptomology, and lower body mass index.
Conclusion:
Data-driven analyses of LHC and RHC trajectories detected three classes underlying the heterogeneous distributions. Machine learning analyses determined three common and four unique biomarkers/risk factors discriminating the higher and lower LHC/RHC classes. Our sequential analytic approach produced evidence that the dynamics of preclinical hippocampal trajectories can be predicted by AD-related biomarkers/risk factors from multiple modalities.
INTRODUCTION
Hippocampal atrophy is a well-documented anatomical process that typically occurs during brain aging [1–4]. However, aged individuals may vary in several indicators of hippocampal atrophy, including level (e.g., overall volume loss), slope (e.g., rate of volume loss), and associated clinical outcomes (e.g., memory impairment, Alzheimer’s disease (AD)) [1, 5–7]. In a distribution of cognitively normal (i.e., unimpaired or asymptomatic) older adults, hippocampal volume trajectories characterized by relatively lower levels and steeper decline may be suggestive of elevated risk for subsequent clinical transitions to mild cognitive impairment (MCI) or AD [8–10]. Given its heterogeneity in level and change, further studies are required to ascertain and disentangle important features that characterize hippocampal atrophy in cognitively normal aging. Among the considerations are accumulating evidence of hippocampal hemispheric differences that are reflected in volume trajectories and various clinical outcomes [11–13]. For example, left and right hippocampal trajectories have been found to be differentially moderated by sex and APOE (McFall et al., unpublished data). Hemispheric differences in hippocampal subfields have also been observed between clinical cohorts (i.e., normal controls, subjective cognitive decline, MCI, and AD) [14]. We investigated this issue by deploying a sequence of two data-driven analytic approaches (i.e., latent class growth analysis, random forest classification) in parallel for the left (LHC) and right (RHC) hippocampi: 1) objectively discriminating classes within a distribution of individualized volume longitudinal trajectories, and 2) identifying key biomarkers and risk factors that discriminated between the observed classes.
Previous hippocampal atrophy research has been conducted with both cross-sectional (comparing age or clinical groups at one time point) and longitudinal (following groups over two or more time points) designs [3, 7, 9, 15, 16]. Although useful for determining average group differences or mean-level change in multiple domains of asymptomatic brain and cognitive aging, these variable-oriented approaches (i.e., focused on relationships between variables in assumed homogeneous populations) are not typically aimed at scrutinizing the well-established individual heterogeneity in either the level or slope of trajectories [3, 17–19] as compared to person-oriented approaches (i.e., focused on similarities and patterns among individuals in an assumed heterogeneous population) [20]. Recently, the growing interest in examining heterogeneity in brain aging and dementia [21, 22] has led to a corresponding effort to adapt data-driven technologies to the 1) examination of individualized trajectories of cognitive changes in older adults and 2) determination of possible underlying classes of trajectory patterns [19, 21, 23]. These latent classes, which are determined via application of algorithms based on performance intercept (level) and slope (rate of change) parameters [20], may later be clarified by identifying predictors most associated with reduced or exacerbated risk for cognitive decline or clinical impairment [21].
A growing body of neurocognitive aging and dementia research has demonstrated the viability of applying data-driven technologies to model heterogeneity in both cross-sectional and longitudinal (trajectory) distributions, including the identification of detectable asymptomatic classes and the determination of differential biomarker predictors [19, 21, 24]. One such longitudinal example in an AD sample identified atrophy subtypes associated with differing degrees of memory performance [25]. In asymptomatic individuals, three cross-sectional biomarker profile subtypes were extracted from a combination of magnetic resonance imaging (MRI) data and cerebrospinal fluid (CSF) biomarkers [26]. One of these subtypes, similar in biomarker profile to a comparative AD group, was associated with accelerated cognitive decline and lower baseline scores on cognitive tests [26]. Although few studies have explored longitudinal data-driven subtypes [21], separate cross-sectional studies of cognitively unimpaired older adults have previously reported distinct imaging subtypes [27–32]. As both cognitively unimpaired aging and AD are characterized by progressive hippocampal atrophy, the possible presence of detectable longitudinal subtypes of hippocampal trajectories in cognitively normal older adults and their potential associations with AD-related risk factors merit further investigation.
Research on early detection of AD risk in asymptomatic older adults has identified a large number of modifiable and non-modifiable factors (e.g., APOE genetic risk, education, metabolic health, sex) which are associated with increased risk of (or protection from) accelerated cognitive decline, MCI, and AD [33–35]. Similarly, previous studies of normal aging and hippocampal atrophy in normal aging and clinical groups have identified predictors from multiple domains. For example, both traditional CSF AD-related biomarkers, such as baseline p-tau181p and Aβ1–42 [36, 37], and disparate lifestyle risk factors as smoking [38] and complex mental activity [39], have been associated with hippocampal atrophy. In addition, three CSF biomarkers [37] have been previously used in a multiple linear regression model to predict longitudinal hippocampal atrophy. Although some recent biomarker reports have featured data-driven technologies applied to large numbers of predictors of AD outcomes [40], longitudinal studies of hippocampal atrophy in cognitively unimpaired older adults have not included a large number of biomarkers or biomarker domains. Previous reports have emphasized the need to include biomarkers from multiple modalities in prediction models over the use of a single biomarker or domain in order to achieve increased prediction accuracy [41, 42].
We aimed to address a knowledge gap regarding hippocampal volume trajectories in cognitively asymptomatic aging. Specifically, the gap refers to the extent to which the heterogeneity of trajectory distributions can be clarified by the detection of underlying longitudinal latent classes and the determination of leading risk factor and biomarker predictors. Because hippocampal hemispheric atrophy differences have been reported both cross-sectionally [13, 43] and longitudinally [44–46], we implemented this aim by testing two main research goals, both of which included parallel analyses of LHC and RHC. For the first research goal (RG1), we analyzed distributions of hippocampal volume trajectories (up to six time points, maximum of 7.2 years) for predominantly cognitively normal (asymptomatic) participants from the Alzheimer’s Disease Neuroimaging Initiative (ADNI). We used latent class growth analyses (LCGA) to detect discriminable classes of trajectories. LCGA is a data-driven longitudinal quantitative modeling technology that applies an algorithm of level and slope to identify statistically separable trajectory classes. Our study focused on a brain aging phase not yet characterized by clinical impairment. Despite normal cognitive function, some individuals may exhibit relatively lower and declining hippocampal volume likely associated with increased risk of future cognitive decline or AD. Notably, membership in higher volume trajectory classes may indicate reduced risk for (or protection from) age-typical morphological shrinkage, membership in lower volume trajectory classes may indicate elevated risk for impending pathological changes. For our second research goal (RG2), we compiled a large, multi-modal set of 38 AD-related biomarkers and risk factors (e.g., CSF Aβ1–42, body mass index, hypertension, sex) from the ADNI database. Whereas most studies have investigated these factors independently or in relatively small clusters, we examine them simultaneously in the context of a competitive quantitative model. We used random forest analyses (RFA), a machine-learning technology for evaluating the relative importance of multiple biomarker and risk factors predictors to the discrimination of higher and lower classes of LHC and RHC atrophy trajectories.
METHODS
Alzheimer’s Disease Neuroimaging Initiative
Data used in preparation of this article were obtained and downloaded from the ADNI database (http://adni.loni.usc.edu on June 30, 2020). The ADNI was launched in 2003 as a public-private partnership, led by Principal Investigator Michael W. Weiner, MD. The primary goal of ADNI has been to test whether serial MRI, positron emission tomography, other biological markers, and clinical and neuropsychological assessment can be combined to measure the progression of MCI and early AD. For up-to-date information, see http://www.adni-info.org.
Participants
From the ADNI database, we used a subsample of older adults who were cognitively normal at baseline with at least one wave of successful MRI data that were processed with the longitudinal imaging pipeline by UCSF (files: UCSFFSL_02_01_16.csv, UCSFFSL51Y1_08_01_16.csv, and UCSFFSL51ALL_08_01_16.csv). The final sample consisted of 351 participants who were 1) cognitively unimpaired at baseline (Mean [M] age at baseline = 74.8, SD = 5.7, baseline range = 59.8–90.6 years, Mini-Mental State Examination [MMSE] M = 29.1; ADAS-Cog M = 9.2, 48.7% Female, 14% ɛ2+, 25% ɛ4+) and 2) followed for up to six times points (M interval between successive time points = 0.91 years [SD = 0.53]). The full distribution analyzed in this study populated a 35-year band of aging (ranging from 59.8 to 94.6 years). The total wave observations in this study were overwhelmingly cognitively normal (96.3%), with only 3.7% and 0.56% of observations being persons with MCI or AD respectively. As such, the present sample was uniformly CN at the outset of the study and predominantly CN throughout the remainder of the study period. Baseline participant characteristics and demographic information can be found in Table 1. Individuals were considered cognitively unimpaired at baseline if they: 1) had no memory complaints, 2) scored between 24–30 on the MMSE, 3) had a Clinical Dementia Rating (CDR) score of 0, and 4) scored equal to or above a cut-off based on years of education (3, 5, or 9 for 0–7, 8–15, and 16 or more) on the Logical Memory II subscale of the Wechsler Memory Scale-Revised [47]. The ADNI data collection procedures were in certified compliance with prevailing human ethics guidelines and boards. All participants or authorized representatives provided informed written consent.
Table 1
Baseline characteristics for entire sample (n = 351)
| Whole | LHC (Highest) | LHC (Middle) | LHC (Lowest) | RHC (Highest) | RHC (Middle) | RHC (Lowest) | |
| N | 351 | 100 | 173 | 78 | 96 | 167 | 88 |
| n in ADNI-1 | 214 | 60 | 113 | 41 | 55 | 105 | 54 |
| n in ADNI-2 | 137 | 40 | 60 | 37 | 41 | 62 | 34 |
| Sex (% Female) | 48.7 | 64.0 | 46.8 | 33.3 | 69.8 | 45.5 | 31.8 |
| Age M (SD) | 74.8 (5.7) | 75. 1 (5.9) | 75.0 (2.6) | 73.9 (5.6) | 74.6 (6.2) | 75.1 (5.5) | 74.5 (5.4) |
| Education M (SD) | 16.3 (2.7) | 15.7 (2.6) | 16.3 (2.9) | 17.2 (2.4) | 15.3 (2.8) | 16.5 (2.7) | 17.2 (2.4) |
| MMSE M (SD) | 29.1 (1.0) | 29.1 (1.2) | 29.1 (1.0) | 29.0 (1.1) | 29.2 (1.2) | 29.1 (1.1) | 29.1 (1.0) |
| ADAS-Cog M (SD) | 9.3 (4.3) | 8.5 (3.9) | 9.7 (4.4) | 9.2 (4.6) | 9.0 (4.0) | 9.3 (4.4) | 9.5 (4.7) |
MMSE, Mini-Mental State Examination; ADAS-Cog, Alzheimer’s Disease Assessment Scale – Cognition.
MRI acquisition and image processing
MRI data were provided by the ADNI neuroimaging team and full details about the image processing can be found on adni.loni.usc.edu in the following file: UCSF_FreeSurfer_Methods_and_QC_OFFICIAL_20140131.pdf. Briefly, cortical reconstruction and volumetric segmentation was performed with the FreeSurfer image analysis suite, which is documented and freely available for download online (http://surfer.nmr.mgh.harvard.edu/). We used longitudinal pipelines (freesurfer.net) which uses each subject as their own control and processed the data using FreeSurfer 4.4 (1.5T) and FreeSurfer 5.1 (3T) [48]. The technical details of these procedures are described in prior publications [49–60]. Briefly, this processing includes motion correction and averaging [61] of multiple volumetric T1 weighted images, removal of non-brain tissue using a hybrid watershed/surface deformation procedure [59], automated Talairach transformation, segmentation of the subcortical white matter and deep gray matter volumetric structures (including hippocampus, amygdala, caudate, putamen, ventricles) [52, 53] intensity normalization [62], tessellation of the gray matter white matter boundary, automated topology correction [54, 63], and surface deformation following intensity gradients to optimally place the gray/white and gray/cerebrospinal fluid borders at the location where the greatest shift in intensity defines the transition to the other tissue class [49, 55, 60]. ADNI protocols have ensured that MRI harmonization is performed by using 1) a standardized protocol, harmonized across all three vendors (GE Healthcare, Siemens Medical Systems, Philips Healthcare); 2) the use of a geometric phantom for distortion evaluation; and 3) manual quality control of the image data [64, 65].
Quality control was conducted by the ADNI neuroimaging team. We removed all failed segmentations, indicating a global failure due to extremely poor image quality, registration issues, gross misestimation of the hippocampus, or a processing error. In the present sample, 60.1% of the images were processed with the FreeSurfer 4.4 (1.5T) and 39.9% with the FreeSurfer 5.1 (3T) pipelines. Hippocampal volumes and estimated intracranial volume from the aseg file were used. We corrected LHC and RHC volume for head size at the individual level (and at each time point) using the following formula [66]:
Magnetic field strength (coded as 1.5T, 3T, or change from 1.5T to 3T) was used as a covariate for hippocampal volume level and slope within each class in the LCGA.
Biomarkers and risk factors
Based on previous literature and availability, we identified 38 biomarkers and risk factors available at baseline which have been identified to be associated with increased risk of AD. We included these biomarkers and risk factors in the machine learning prediction models for RG2 (see Table 2). For interpretive convenience, we sorted the biomarkers and risk factors into eight modalities: biospecimen (e.g., CSF t-tau; n = 6), demographic (e.g., sex; n = 3), genetic (APOE, coded as ɛ2 + [ɛ2/ɛ2, ɛ2/ɛ3], ɛ3/ɛ3, and ɛ4 + [ɛ3/ɛ4, ɛ4/ɛ4] with ɛ2/ɛ4 carriers removed; n = 1), vascular and metabolic (e.g., systolic blood pressure; n = 5), lifestyle (e.g., smoking history; n = 2), comorbidities (e.g., cardiovascular disease; n = 17), familial background (e.g., paternal dementia history; n = 2), and cognitive status (e.g., MMSE; n = 2).
Table 2
Predictors by modality and measurement characteristics
| Modalities | Biomarkers | Metric | % Missing for LHC | % Missing for RHC |
| Biospecimen | Plasma Aβ1–401 | pg/mL | 47.2 | 44.6 |
| Plasma Aβ1–421 | pg/mL | 46.6 | 44.0 | |
| CSF Aβ1–422 | pg/mL | 38.2 | 35.3 | |
| CSF total-tau2 | pg/mL | 38.8 | 35.9 | |
| CSF p-tau2 | pg/mL | 38.2 | 35.3 | |
| Plasma tau3 | pg/mL | 55.6 | 50.0 | |
| Demographic | Age | Years | 0 | 0 |
| Sex | Female/Male | 0 | 0 | |
| Education | Years | 0 | 0 | |
| Genetic | APOE | ɛ2+, ɛ3/ɛ3, ɛ4+ | 0 | 0 |
| Vascular/Metabolic | Systolic blood pressure | mm Hg | 0 | 0 |
| Diastolic blood pressure | mm Hg | 0 | 0 | |
| Hypertension | 140/90 mm Hg | 0 | 0 | |
| Subjective report of diabetes | Yes / no | 0 | 0 | |
| Glucose level at baseline | mg/dL | 3.9 | 2.2 | |
| Lifestyle | Body mass index | kg/m2 | 1.1 | 0.5 |
| History of smoking | Yes / no | 0 | 0 | |
| Co-morbidities | Geriatric depression scale score | Mild (5–8), moderate (9–11), severe (12–15) | 0 | 0 |
| Cardiovascular, alcoholism, psychiatric, neurological, head/eyes/ears/nose/throat, respiratory, hepatic, dermatologic connective tissue, musculoskeletal, endocrine-metabolic, gastrointestinal, hematopoietic-lymphatic, renal-genitourinary, allergies/drug sensitivities, malignancy, and/or major surgeries | Yes / no | 0 | 0 | |
| Familial background | Maternal dementia history | Yes / no | 0.6 | 0 |
| Paternal dementia history | Yes / no | 1.7 | 2.6 | |
| Cognitive status | MMSE | 0–30, > 24 indicates no dementia | 0 | 0 |
| ADAS-Cog | 0–70, ≥18 indicates cognitive impairment | 0 | 0 |
1Plasma collection - University of Pennsylvania (UPENNPLASMA.csv); 2CSF collection - University of Pennsylvania (UPENNBIOMK_MASTER.csv, median re-scaled values); 3Plasma collection – Blennow Lab (BLENNOWPLASMATAU.csv).
Statistical analyses
RG1. Classes of LHC and RHC
We analyzed the longitudinal data with chronological age as the metric of change. Accordingly, age is included directly into the analyses and is essentially co-varied. We used LCGA, which implements an algorithm based on individual level (i.e., intercept) and slope, to identify differentiable classes of individual trajectories within the overall distribution of trajectories [67]. Analyses were conducted in Mplus 8.2 [68] and performed separately for LHC and RHC volume change data. The analysis plan specified the development of the most parsimonious one class (baseline) model, followed by the testing and comparison of four alternative k-class models to the k-1 models. LCGA can model non-linear trajectories; however, quadratic models were tested and removed from consideration due to poorer model fit. Thus, all tested models were random intercept, random slope linear growth models with the variance fully constrained within each class. We evaluated model fit in three steps only for models with entropy values greater than 0.8, which confirm that the model has satisfactory class separation and classification precision. Higher entropy is the best indicator of model separation, with values of 1 indicating perfect classification precision and separation between classes [20]. First, we considered models which had lower values (compared to the baseline model) of the following recommended statistical fit indices: Akaike information criterion (AIC), Bayesian information criterion (BIC), and sample-size adjusted BIC (SABIC) [20]. For this step, we plotted the values of fit indices (i.e., AIC, BIC, SABIC) on the number of classes in a scree or elbow plot [20, 69] to identify a possible inflection point (i.e., the point at which the values the slope changes). Second, as is recommended for LCGA research in which classes will be used for subsequent analyses [70], we applied an a priori cut-off criterion for model selection which stipulated that candidate models would have greater than 10% of the sample in each class. This ensured that the subsequent prediction analyses (in the second research goal) would have sufficient participants in each identified class for stable and robust multiple-group analyses and solutions. As a consequence of this model selection criterion, possible low prevalence classes of potential clinical interest were not identified or studied. We aimed to represent as much as possible the broader distribution of initially cognitively normal aging adults and account for any existing heterogeneity using this recommended approach [20]. Third, we consulted related and neighboring literature to ensure that class parameters for the final model were consistent with theoretical expectations. Based on complementary findings in the episodic memory literature, we expected to find a three class model for hippocampal volume trajectories [19].
RG2. Important predictors of LHC and RHC class membership
Prediction analyses were also conducted separately for LHC and RHC and used the full pool of 38 AD-related biomarkers and risk factors. Using RFA (R 3.2.5, “Party” package) [71], we simultaneously tested these biomarkers and risk factors for relative importance in discriminating the lowest versus highest hippocampal trajectory classes. We used the conditional probabilities provided in the LCGA to determine class membership for individuals. Specifically, the models determined each individual’s LHC and RHC volume at every wave (i.e., level) and the slope of volume change [72] and then assigned them to the class to which they had the highest probability of membership. The conditional probabilities for membership assignment were very high for both LHC (M = 0.96; % > 0.8 = 92.3) and RHC (M = 0.97, % > 0.8 = 92.8).
Due to its robustness to overfitting and ability to accommodate a large number of predictors, RFA was selected as the optimal technique for simultaneous testing of a large number of mixed-type (i.e., categorical and continuous) variables [19]. Unlike conventional statistical methods (e.g., multinomial logistic regression), which require conservative correction approaches, RF prediction models are equipped with provisions that lead to accurate and stable prediction solutions with many predictors [73, 74]. Combining multiple classification predictions and regression trees (ntree) based on a random sample of participants and predictor variables (mtry), RFA is a recursive partitioning multivariate data exploration technique. Each forest was comprised of ntree = 1000 (sufficient for good model stability) and each potential split evaluated a random sample of the square root of the total number of predictors (biomarkers and risk factors; mtry = 6) [19]. We utilized the cforest function in the “Party” package to determine biomarker and risk factor importance based on their conditional permutation accuracy importance (varimp function; conditional = TRUE), utilizing an algorithm that averages the prediction weight of each of the variable across all 1000 permutations [73–75]. Interactions between predictors are taken into account with each permutation when variable importance is determined, although specific interactions are not reported [74]. Specifically, conditional permutation importance provides a measure of the association between the outcome (i.e., hippocampal trajectory class) and each predictor based on the values of other predictors [76]. The conditional variable importance method is especially advantageous in that it accounts for potentially correlated predictors to avoid typically occurring multicollinearity issues [76–78]. As such, results regarding ranked predictor importance are presented and discussed in the context of all included predictors. After removing biomarkers and risk factors that were of lowest importance, the final RFA consisted of 16 variables (mtry = 4). Important variables were determined based on observation of an ‘elbow’ in the RFA plot. The cforest function also computes out-of-bag estimates, which can be used in place of cross-validation procedures [79]. For both LHC and RHC volume trajectory models, we reported the concordance statistic (C), which is equivalent to the area under the curve. In non-medical prediction analyses an area under the curve or C value of 0.5 is considered to be chance, between 0.6 and 0.7 is considered to be a medium effect size, and 0.8 or greater is considered a strong effect size [19]. In order to clarify the direction of relationship between the identified important predictors and hippocampal trajectory class membership, we report post-hoc correlational analyses as well as group means frequencies. These were interpreted independently from other predictors and do not represent formal probabilities of risk.
Missing biomarker and risk factor data was addressed as follows. Across the biomarker and risk factor modalities, with one exception, missing data rates were very low (range = 0 to 3.9% for LHC; 0 to 2.6% for RHC). The exception was the biospecimen modality (range = 38.2–55.6% for LHC; 35.3–50.0% for RHC). Details by biomarker and risk factor are provided in Table 2. Missing data were imputed using the “missForest” package as recommended in R [80, 81]. This package is especially recommended in the case of mixed-type missing data. Used together with the “RandomForest” package in R, the “missForest” package utilizes a random forest trained on the data matrix for missing value prediction [80, 82].
RESULTS
RG1: LHC and RHC trajectory classes
Left hippocampal volume trajectories
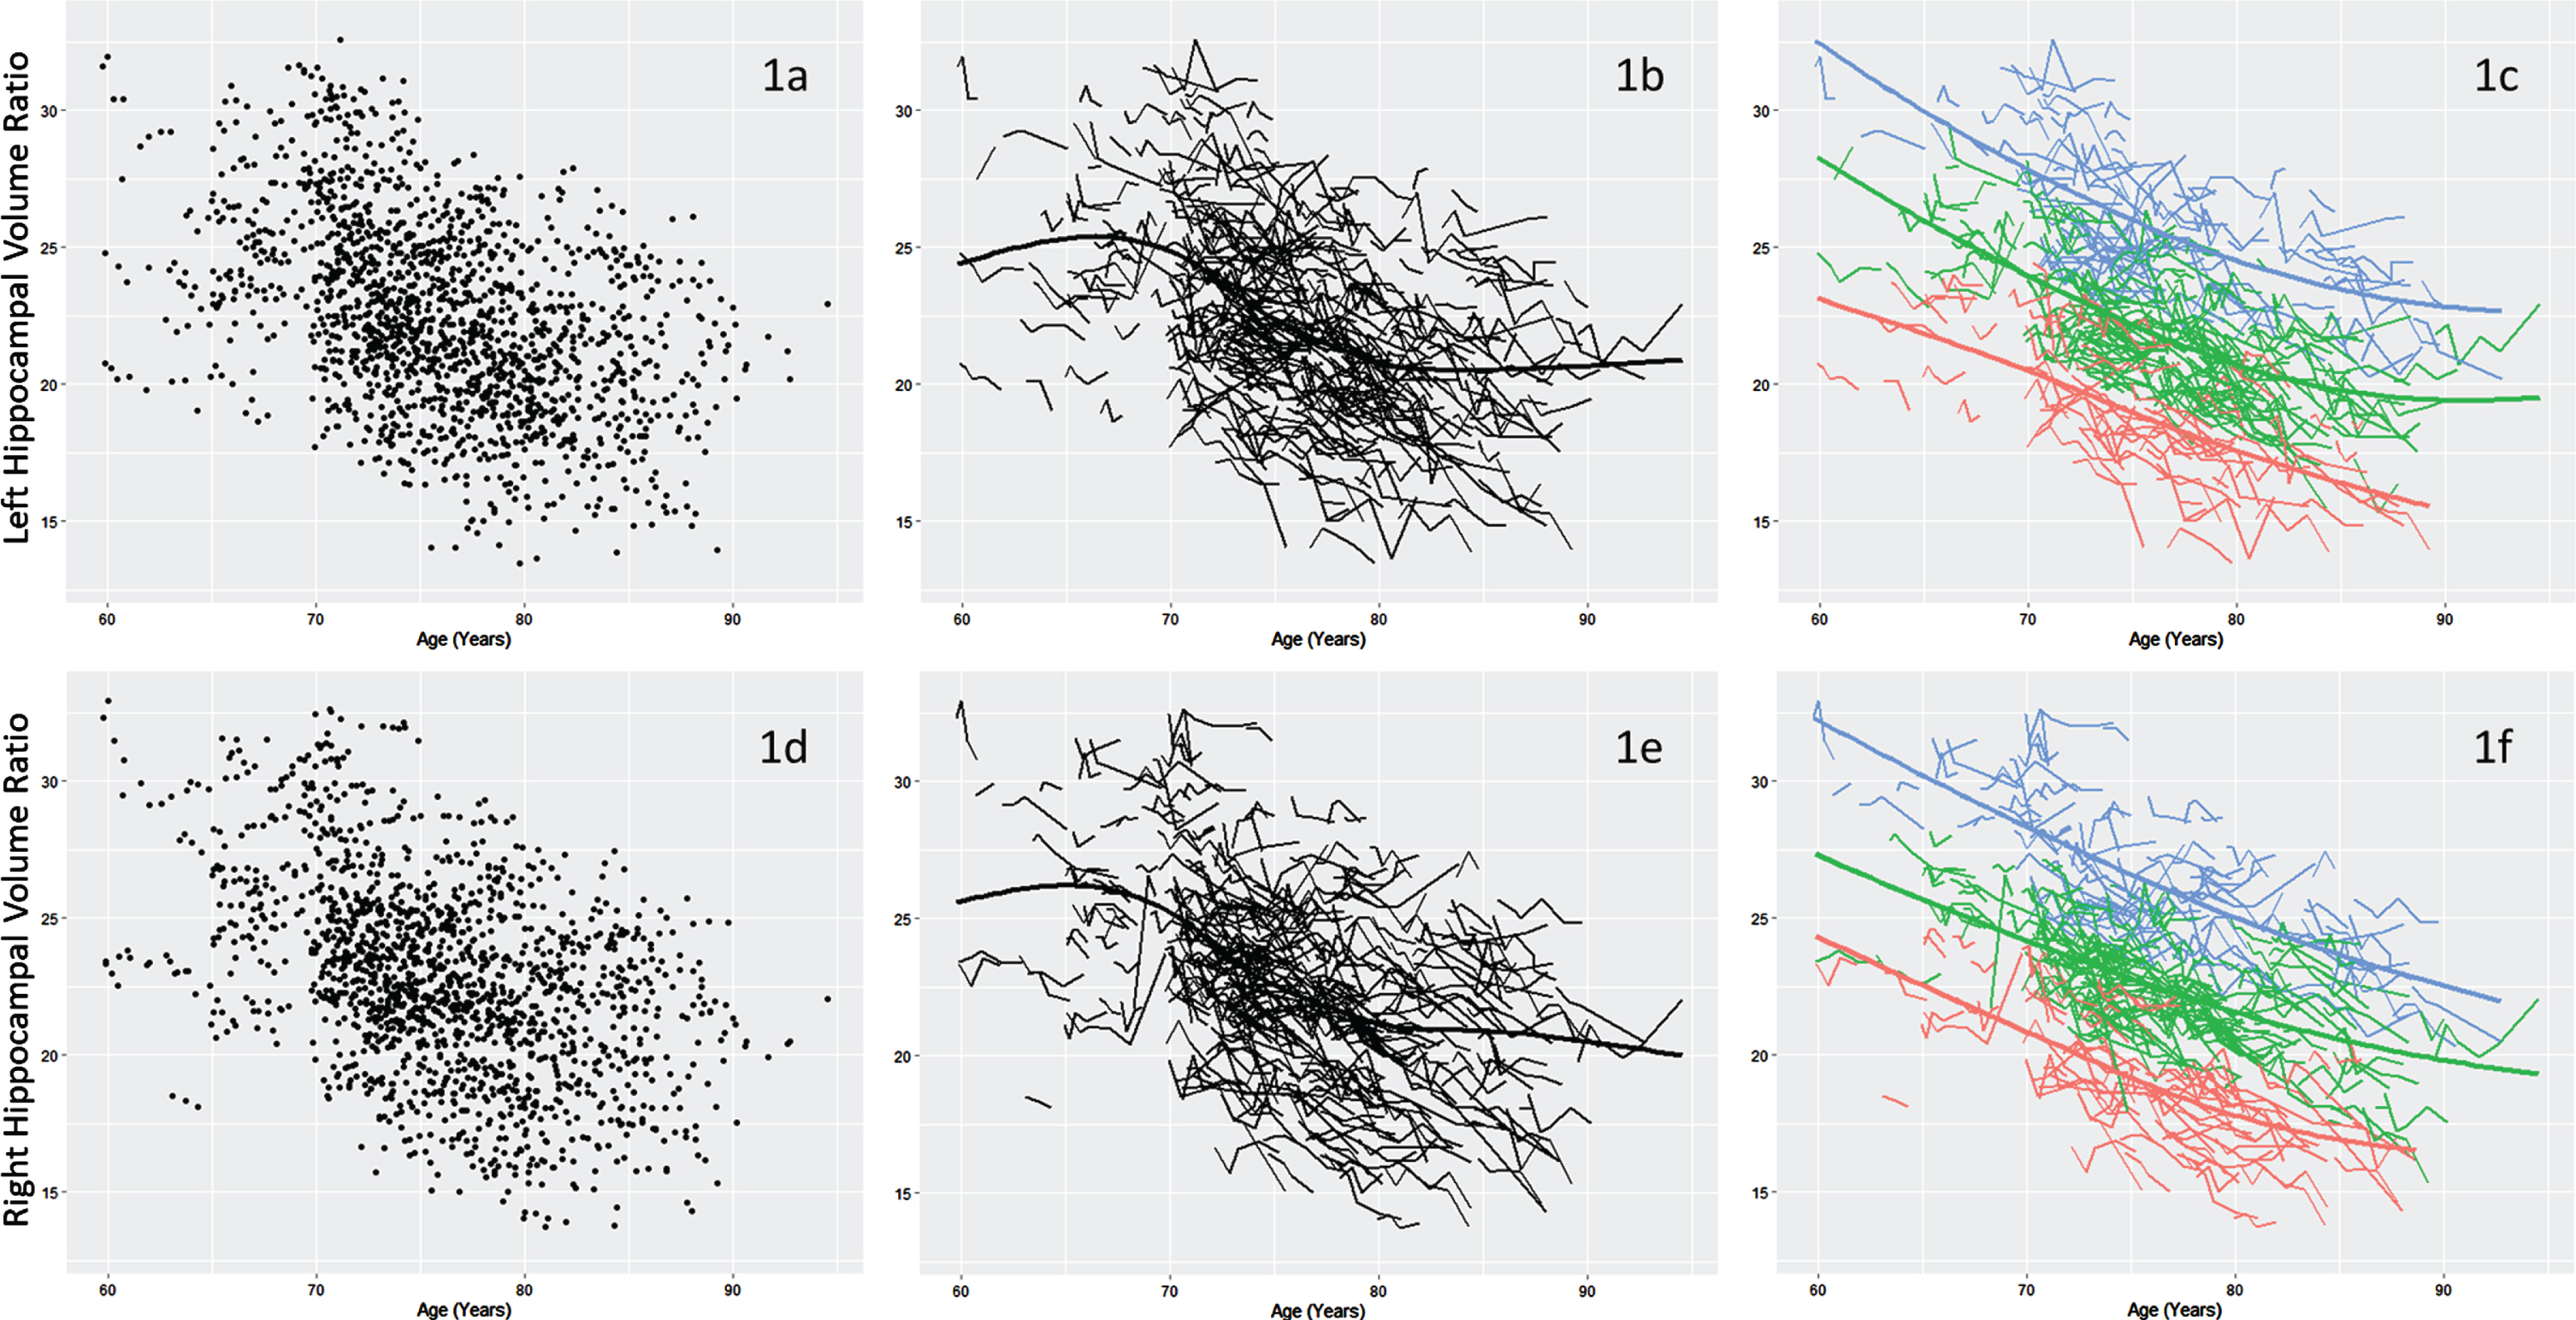
Model fit statistics for all analyses are presented by number of classes in Table 3. All tested models had acceptable entropy values (i.e., > 0.8). The two-, three-, and five-class models were selected as possible candidate models as they had lower AIC, BIC and SABIC values than the baseline model and sufficient participants in each class. We selected the three-class model as the final model following the inspection of a scree plot (see Supplementary Figure 1) and in the context of past findings in the related domain of memory aging trajectory analyses [19]. The three-class model is portrayed in Fig. 1c, with parameter means (level and slope) reported in Table 4. Discriminated and ranked by a combination of both level and slope, from highest to lowest volume in the trajectory distribution, the three classes can be characterized as follows. Class 1 (n = 100; the group at the top of the distribution) was characterized by the highest combination of level and slope, followed by Class 2 (n = 173), the group in the middle of the distribution, and Class 3 (n = 78), the group at the bottom of the distribution. Informally, the classes appear to differ more in level than in slope (with Class 2 and 3 having the steeper slopes), but both parameters contributed to the latent class solution. Specifically, the LCGA algorithm identifies distinguishable trajectory classes based on simultaneous consideration of level and slope, both of which are essential parameters in model identification. It is important to note that the resulting trajectory classes are statistically differentiated even though they may not appear visually as dramatically distinct at their edges. This between-class distinction is clearly indicated by the entropy values (revealing good class separation) and the level and slope parameters (and 95% confidence intervals) for each class (see Table 4).
Table 3
Latent class growth analyses model fit statistics and class proportions for left and right hippocampal volume
| Volumetric variable | Number of classes | Class proportions | AIC | BIC | SABIC | Entropy |
| Left hippocampus | 1 | – | 403.50 | 442.12 | 410.39 | – |
| 2 | 0.49/0.51 | –909.04 | –851.13 | –898.71 | 0.90 | |
| 3* | 0.49/0.29/0.22 | –1907.10 | –1829.88 | –1893.33 | 0.92 | |
| 4 | Did not replicate | – | – | – | – | |
| 5 | 0.10/0.26/0.22/0.13/0.30 | –2707.13 | –2591.31 | –2686.48 | 0.89 | |
| Right hippocampus | 1 | – | 399.19 | 437.80 | 506.08 | – |
| 2 | 0.46/0.54 | –885.82 | –827.91 | –875.49 | 0.90 | |
| 3* | 0.25/0.27/0.48 | –1997.35 | –1920.14 | –1983.58 | 0.93 | |
| 4 | 0.12/0.34/0.23/0.31 | –2450.80 | –2354.28 | –2433.59 | 0.92 | |
| 5 | 0.12/0.09/0.36/0.22/0.21 | –2765.27 | –2649.45 | –2744.62 | 0.90 |
AIC, Akaike information criteria; BIC, Bayesian information criteria; SABIC, Sample-size adjusted BIC. * Identified as best model fit based on low AIC, BIC, SABIC and no class proportion less than 10%.
Table 4
Final latent class growth analyses models statistics and parameters
| Volumetric variable | Class | n (%) | Level (intercept) [95% CI] | Slope [95% CI] |
| Left hippocampus | 1 | 100 (28.5) | 2.50 [2.50–2.51] | –0.02 [–0.025—0.021] |
| 2 | 173 (49.3) | 2.14 [2.13–2.14] | –0.03 [–0.028—0.024] | |
| 3 | 78 (22.2) | 1.79 [1.78–1.80] | –0.03 [–0.030—0.022] | |
| Right hippocampus | 1 | 96 (27.4) | 2.53 [2.53–2.54] | –0.02 [–0.025—0.021] |
| 2 | 167 (47.6) | 2.21 [2.20–2.21] | –0.03 [–0.028—0.023] | |
| 3 | 88 (25.1) | 1.83 [1.83–1.84] | –0.03 [–0.027—0.023] |
Class 1 refers to the higher group; Class 2 refers to the middle group; Class 3 refers to the lower group.
Fig. 1
Distribution of left (1a) and right (1d) hippocampus volume data. Individual trajectories of left (1b) and right (1e) hippocampal volume. Three classes were identified within left (1c) and right (1f) hippocampal volume trajectories: Class 1 (Blue; highest, least atrophied), Class 2 (Green; middle), and Class 3 (Red; lowest, most atrophied). Hippocampal volume was corrected for head size using (hippocampal volume / intra cranial volume) x 103.
Right hippocampal volume trajectories
Model fit statistics for all analyses are presented by number of classes in Table 3. Similar to the LHC models, all tested models had acceptable entropy values (> 0.8). The four-class model was removed from consideration as the loglikelihood failed to replicate, indicating that no global solution was reached. The five-class model was removed from consideration due to insufficient participants in one class (9%). The two- and three-class models were selected as possible candidate models as they had lower AIC, BIC, and SABIC values than the baseline model and sufficient participants in each class. As with LHC trajectories, we selected the three-class model as the final model based on past findings and inspection of the scree plot of relative fit indices for the inflection point (see Supplementary Figure 2). Thus, we identified three unique classes of RHC volume trajectories within the overall sample (Fig. 1f). Parameter means (level and slope) are reported in Table 4. Discriminated and ranked by a combination of level and slope, from highest to lowest volume in the trajectory distribution, the classes can be characterized as follows. Class 1 (n = 96; the group at the top of the distribution) was characterized by the highest combination of level and decline, followed by Class 2 (n = 167), the group in the middle of the distribution, and Class 3 (n = 88), the group at the bottom of the distribution. Comparable to the LHC trajectory class distribution, the classes appear to differ in level more than slope; however, both parameters contributed to the latent class solution. Informally, the level (but not slope) of each RHC class appears to be consistently higher than that of the corresponding LHC class.
RG2: Important predictors of LHC and RHC class membership
We performed RFA to identify biomarkers and risk factors that best discriminated between the highest (Class 1) and lowest (Class 3) trajectory classes within LHC and RHC volume separately.
Left hippocampal volume trajectory classes
The higher and lower LHC volume trajectory classes were discriminated by seven biomarkers and risk factors from four modalities: biospecimen (plasma Aβ1–40, plasma tau, plasma Aβ1–42), demographic (sex, education), co-morbidities (geriatric depression scale [GDS] score), and lifestyle (body mass index; C = 0.80; Fig. 2a). As informed by post-hoc correlational analyses, we found that individuals belonging to the lower LHC volume trajectory class were more likely to have lower levels of plasma Aβ1–40, Aβ1–42, and tau, greater number of years of education, higher GDS scores (indicating more depressive symptoms), a lower BMI, and be male (see Table 5 for biomarker/risk factor frequencies and means per class).
Fig. 2
Variable importance (permutation accuracy) in the discrimination of the (2a) lowest (n = 78) versus highest (n = 100) classes of left hippocampal volume trajectories (C = 0.80, ntree = 1000, mtry = 4), and (2b) lowest (n = 88) versus highest (n = 96) classes of right hippocampal volume trajectories (C = 0.78, ntree = 1000, mtry = 4). GDS, Geriatric Depression Scale score; BMI, body mass index; APOE, Apolipoprotein E genotype; MH, medical history; ADAS-Cog, Alzheimer’s Disease Assessment Scale-Cognitive Subscale; CSF Aβ1–42, cerebrospinal fluid amyloid β1–42; CSF t-tau, cerebrospinal fluid total tau; CSF p-tau, cerebrospinal fluid phosphorylated tau; MMSE, Mini-Mental State Examination score.
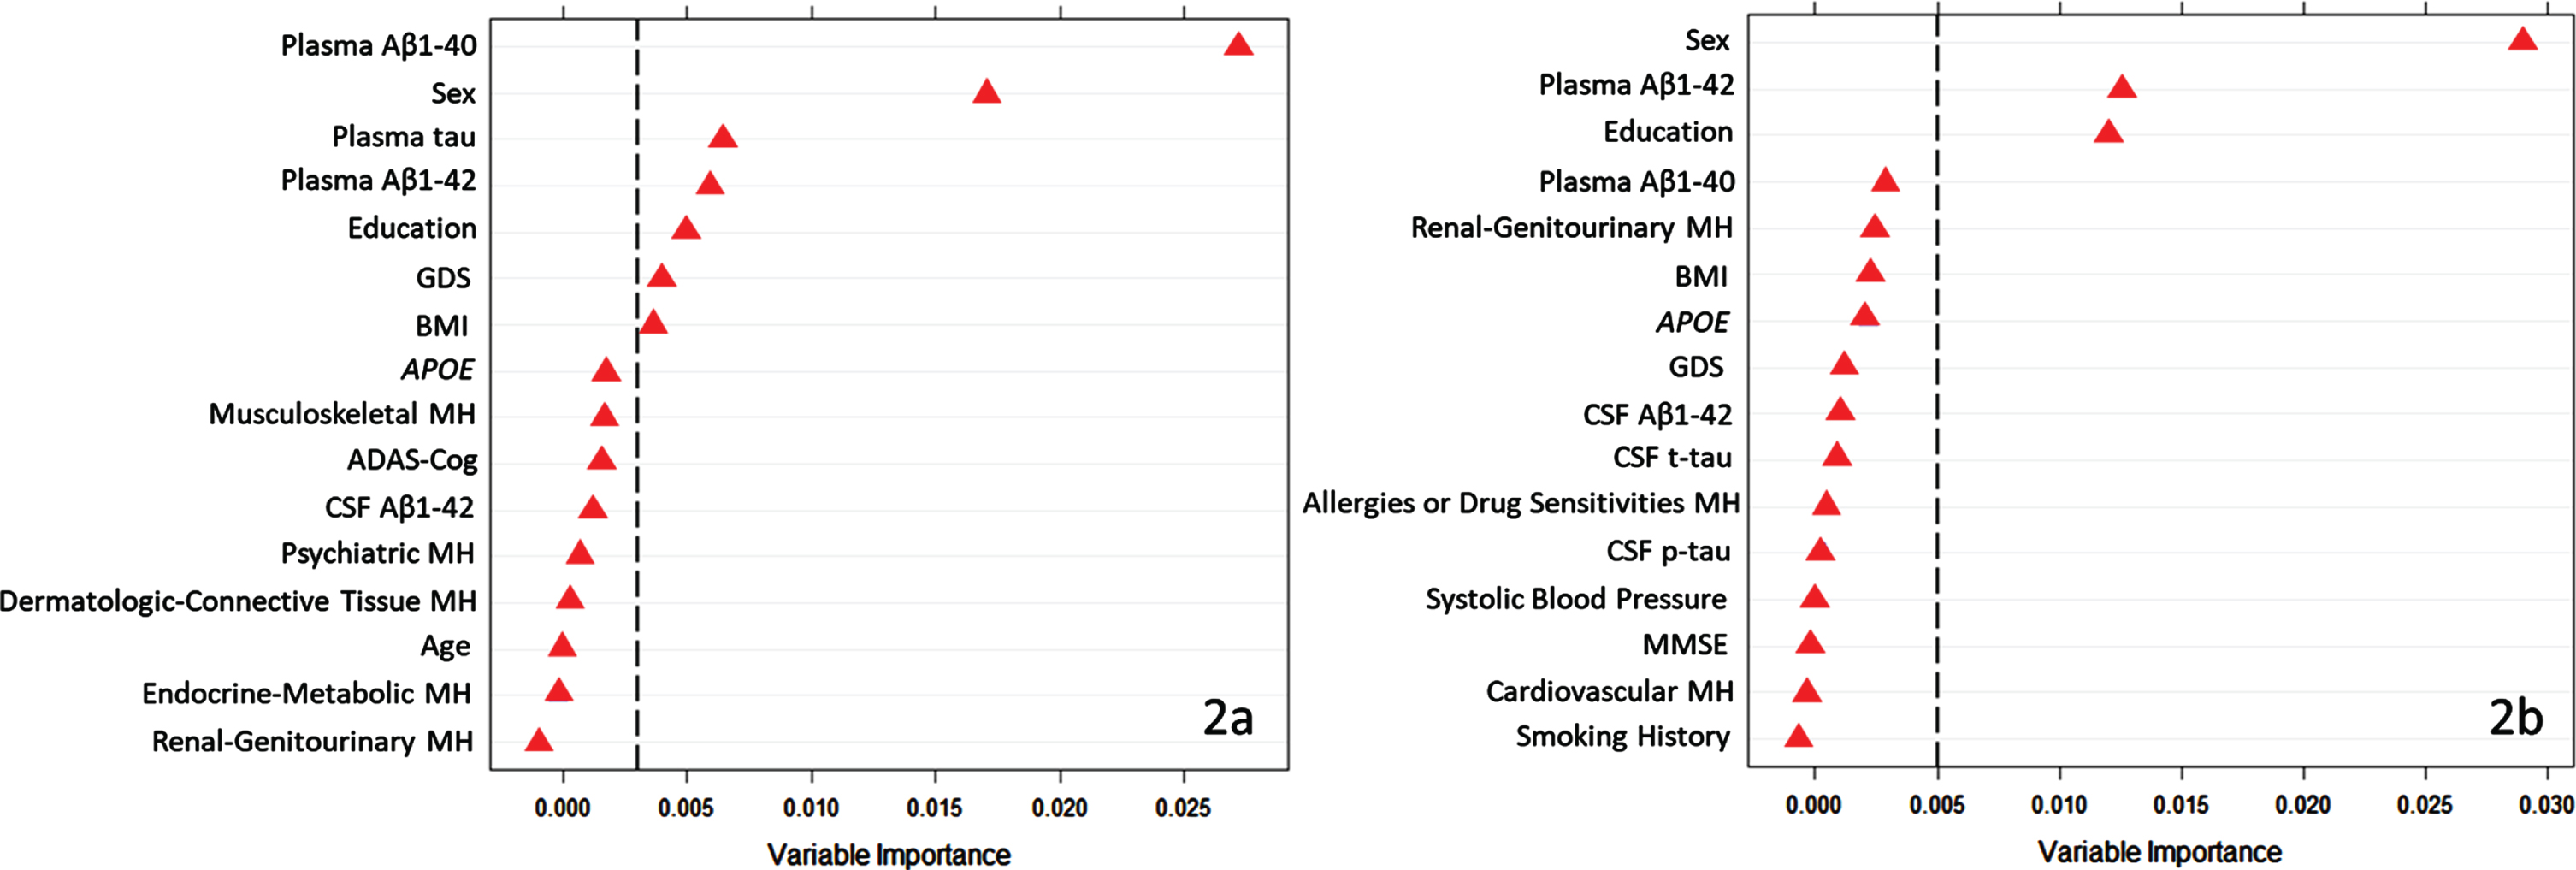
Table 5
Biomarker and risk factor means and frequencies for LHC and RHC trajectory classes
| Significant biomarker | Lowest LHC trajectory class | Highest LHC trajectory class | Lowest RHC trajectory class | Highest RHC trajectory class |
| N | 78 | 100 | 88 | 96 |
| Plasma Aβ1–40 | 139.72 (56.78) | 171.46 (47.03) | 142.23 (47.19) | 168.31 (45.30) |
| Sex (%, female) | 33.33 | 64.0 | 31.82 | 69.80 |
| Plasma t-tau | 2.41 (0.94) | 2.65 (1.05) | 2.50 (1.42) | 2.55 (1.07) |
| Plasma Aβ1–42 | 34.71 (10.58) | 41.00 (14.62) | 34.35 (10.13) | 42.04 (14.52) |
| Education, y (SD) | 17.15 (2.42) | 15.73 (2.56) | 17.17 (2.43) | 15.33 (2.73) |
| GDS | 0.91 (1.27) | 0.52 (0.88) | 0.81 (1.19) | 0.67 (1.01) |
| BMI | 26.06 (4.47) | 27.35 (4.69) | 26.11 (4.43) | 27.36 (5.07) |
| Follow-up cognitive status documentation | ||||
| # of person-waves (observations) | 398 | 496 | 442 | 473 |
| % of person-waves that are non-AD | 98.2 | 99.8 | 98.6 | 100 |
| % of person-waves that are non-AD and non-MCI | 93.0 | 98.6 | 92.5 | 98.7 |
Right hippocampal volume trajectory classes
The higher and lower RHC volume trajectory classes were discriminated by three biomarkers and risk factors from the following two modalities: demographic (sex, education) and biospecimen (plasma Aβ1–42; C = 0.78; Fig. 2b). As informed by post-hoc correlational analyses, we found that individuals belonging to the lower RHC trajectory class were more likely to be male, have lower levels of plasma Aβ1–42, as well as have greater number of years of education (see Table 5 for biomarker frequencies and means per class).
DISCUSSION
This study applied data-driven technologies to longitudinal imaging data to 1) extract computationally separable classes based on individual level and slope from LHC and RHC trajectory distributions and 2) subsequently identify key AD-related biomarkers and risk factors that discriminate between the higher and lower trajectory classes. To our knowledge, no previous study has used these technologies to 1) identify trajectory classes based on separate LHC and RHC volume change in a sample of predominantly cognitively normal older adults and 2) assemble and test a large pool of putative biomarker and risk factor predictors of trajectory class.
Overall, the class structures (number and membership) and constituent trajectory characteristics (levels and slopes) for the two hemispheres were similar. One exception is that RHC volumes appeared consistently higher (in level) for each corresponding class. This RHC advantage is consistent with previous research indicating that RHC volumes are generally more preserved at corresponding ages than LHC volumes in cognitively normal older adults [43, 46, 83]. Our results provide a new and discriminating indicator of this advantage; namely, the advantage can be observed at all corresponding classes (higher, middle, and lower) of aging change. For both hemispheres, the slope means across classes were relatively similar; however, the two lowest classes (middle, lowest) exhibited steeper slopes than the highest class. This pattern was expected as the current sample consisted of uniformly cognitively normal older adults at baseline and who remained clinically non-impaired over 96% of the analyzed longitudinal observations. Notably, even in the more limited heterogeneity of a cognitively unimpaired older adult sample (as compared to a more clinically diverse sample), our analytic approach detected discriminable classes of HC volumetric change. In addition, although there was some overlap between the participants classified into the LHC and RHC classes, there were a substantial number of individuals (n = 93) who were uniquely classified (e.g., were in the lowest LHC but not the lowest RHC) in the two hemispheric analyses. These findings provide further evidence for the consideration of LHC and RHC differences in future research.
As increasing hippocampal atrophy is associated with incipient clinical progression [8, 9, 84], two potential implications of our data-driven latent class approach could be considered. First, these classes of hippocampal trajectories could be provisionally considered as “secondary phenotypes” of brain aging in that they 1) differ in objective and salient brain aging trajectory characteristics and 2) may be associated with differential outcomes or clinical phenotypes such as cognitive impairment or AD. A post-hoc informal check of the current data revealed that cognitive performance over time decreased in a stepwise manner across hippocampal trajectory classes (see the Supplementary Material for ADAS-Cognition and ADNI Memory Composite scores by wave). In addition, higher scores on the CDR were somewhat more prevalent in the lowest classes and none of the participants with a CDR of 1 were classified in the highest trajectory classes. Similarly, a recent study identifying four spatiotemporal trajectory subtypes of tau deposition found that longitudinal MMSE outcomes differed between subtypes [85]. The interpretation was that data-driven groups based on other AD-related biomarkers (tau) have also identified differences in cognitive trajectories [85]. Taken together, the present and complementary findings chart an important direction for future research, in which studies with comprehensive clinical outcome information could provide insights into AD or impairment risk based on long-term pre-clinical trajectory class membership. Second, members of higher trajectory classes may have lower exposure to AD risk factors. We investigated these implications in the next research goal by testing associations with AD biomarkers and risk factors.
Accordingly, we tested predictor importance for a roster of 38 multi-modal AD risk factors and biomarkers. The machine learning technology (RFA) evaluated the relative importance of all of the predictors in a quantitatively competitive context. The leading predictors of extreme classes (higher versus lower) were thus identified for their prediction importance with both independent and interactional contributions considered. The present prediction models do not establish mechanisms of association, but instead identify the risk factors that emerge in data-driven analyses from a large panel of potential predictors and thereby point to promising future directions of both validation and mechanistic research. The full roster of predictors was presented earlier and listed (by modality) in Table 2. Three aspects of the results are discussed: 1) the subset of predictors that were observed for both LHC and RHC, 2) any predictors that were selectively associated with either hemisphere, and 3) notable predictors (e.g., factors that have been associated in candidate biomarker studies) that did not emerge in the present analyses. In all cases, we refer to any available candidate biomarker and risk factor literature to establish the context. Three important predictors from two modalities were robust across the hemispheres: demographic (sex, education) and biospecimen (plasma Aβ1–42). Four additional predictors were observed selectively in the LHC analyses. We characterize the three common predictors briefly and then discuss the unique predictors for LHC.
Regarding predictors in common for LHC and RHC classes, the sex factor indicated that being male was associated with membership in the lower trajectory classes. For hippocampal atrophy in cognitively unimpaired aging, a common result is that, for given ages, males experience more overall atrophy than females [86]. Our results conducted separately on LHC and RHC extend this pattern to both hemispheres. As an illustration, for both LHC and RHC we noted that membership of the upper (less atrophied) class was predominantly female (64–70%) whereas the lower class membership was predominantly male (66.7–68.2%). Notably, our current multimodal approach highlights the importance of sex relative to other established AD biomarkers and risk factors in predicting differential hippocampal atrophy. This female advantage is concordant with 1) findings in the cognitively asymptomatic aging literature, whereby cognitively normal females often perform at higher the levels than males, and 2) our post-hoc check regarding cognitive trajectories for this sample (see Supplementary Material). Specifically, mean memory scores for the lowest HC trajectory classes (predominantly male) were lower than for the highest trajectory classes (predominantly female), which is consistent with the growing evidence of a male disadvantage in asymptomatic memory aging [24, 87, 88]. However, it should be noted that this female advantage may be reversed in persons living with AD or even preclinical AD. For example, studies have found that females with AD exhibit more rapid hippocampal atrophy [89] and similar associations have been reported for females with AD-related neuropathology [44]. In contrast, we found that in predominantly cognitively unimpaired individuals, men made up a higher proportion of the hippocampal trajectory class characterized by the lowest level and steepest decline (i.e., most atrophy). Thus, future research can aim to resolve whether there is 1) a selectively accelerated rate of hippocampal volume loss for preclinical and clinical (where AD-related neuropathology, such as low CSF Aβ42 levels, would be evident) females or 2) some other factor accounts for the contrasting observations.
More years of education was associated with the lowest (most atrophied) classes of both LHC and RHC volume trajectories. In cognitively unimpaired older adults, non-significant cross-sectional associations between hippocampal size (volume and thickness) and education have been reported [90, 91]. In contrast, education has been previously identified as a potential protective factor in the AD epidemiological literature [92]. Longitudinal findings regarding associations with cognitive reserve (including education) have also been mixed [93, 94]. These inconsistencies may originate from a number of study-related differences, including: 1) design (cross-sectional versus longitudinal), 2) measurement (years of schooling versus attainment), 3) cohort (education differing across generations), 4) study sample (cognitively normal versus clinical; higher versus lower education), 5) analytic approaches (most often single variable versus multi-variable prediction models), 6) study role (correlate, covariate, and even AD protective factor), and 7) outcome (cognitive differences/changes, brain differences/changes). In the current ADNI sample, the majority of participants were relatively highly educated (M years of total schooling at baseline = 16.3). Previous findings regarding the moderation of hippocampal volume by education [95] indicate that these effects are diminished among those with higher education attainment. A relevant previous result [96] led us to explore whether the commonly used proportional approach to correcting for head size [97–99] could lead to potential overcorrections in volume estimates for highly educated samples. Specifically, the common approach corrects the numerator (hippocampal volume) by the denominator (intracranial volume). In a post-hoc check we observed a positive correlation between intracranial volume and education [96]. We suggest (a) careful monitoring of education effects in cognitively normal brain aging, (b) further specific attention to intracranial HC volume corrections when education levels are high, and (c) increasing attention to education effects in research on other brain regions and related biomarkers (e.g., hippocampal to cortex atrophy ratio [94]).
Lower levels of plasma Aβ1–42 were associated with the lower trajectory classes for both LHC and RHC. Although a conventional biomarker of AD, Aβ1–42 has been found to be more strongly related to overall neurodegeneration (versus AD specifically) as increased levels in the brain and decreased levels in CSF also occur in other neurodegenerative diseases [34]. Evidence for brain atrophy associations with plasma levels of Aβ1–42 have been mixed. For example, higher plasma Aβ1–42 levels and lower volumes of hippocampal subfields have been linked in older adults with, but not those without, subjective complaints [100]. In a separate study using a large sample of cognitively normal older adults, decreased levels of plasma Aβ1–42 were associated with smaller hippocampal volumes and increased risk of dementia [101]. Similarly, plasma levels of Aβ1–42 were found to be lower in amnesic MCI individuals as compared to cognitively normal older adults [102]. Our results contribute to the existing and emerging evidence that 1) lower Aβ1–42 levels are a detectable biomarker of emerging neurodegeneration (hippocampal trajectory classes) in initially cognitively normal individuals and 2) less invasive biomarker collection procedures (e.g., plasma) provide reliable indicators of this early trend toward neurodegeneration [34, 103].
Four additional predictors discriminated LHC trajectory classes only. From the biospecimen modality, plasma Aβ1–40 and plasma tau predicted class membership uniquely for the LHC. Specifically, lower levels of both plasma Aβ1–40 and plasma t-tau were associated with membership to the lowest LHC trajectory class. Our findings support and extend previous reports of lower levels of plasma Aβ1–40 in preclinical AD and AD-related neurodegeneration [101, 102]. Specifically, our results indicate that lower baseline levels of plasma Aβ1–40 predict trajectories associated with more left (but not right) hippocampal atrophy prior to detectable disease stages. For plasma t-tau, increased levels have been associated with lower gray matter volumes in Aβ+ (but not Aβ-) older adults [104] as well as higher risk of incident dementia [105]. However, our results suggest that lower plasma t-tau may be differentially associated with “secondary phenotypes” of clustered individuals representing different patterns of longitudinal atrophy in cognitively normal adults. A possible explanation is the potential effect of age on plasma t-tau levels. In a recent study, older adults (compared to middle-aged adults) were found to have higher levels of plasma t-tau after controlling for sex and APOE. Although not directly testable in the present data, the average age of the lowest class LHC class (MW1 = 73.9, MW2 = 74.3, MW3 = 74.8, MW4 = 75.7, MW5 = 77.0, MW6 = 78.6) was somewhat lower than that of the highest LHC class (MW1 = 75.1, MW2 = 75.6, MW3 = 75.9, MW4 = 76.7, MW5 = 78.2, MW6 = 79.5) at each time point. It is possible that the reported age-related effects extend to a higher age range and to subtler age differences, representing an important area of future investigation.
Depressive symptoms (at a non-clinical level) were a selective predictor of LHC trajectory classes, with higher mean GDS score associated with the lowest trajectory class. This result is concordant with previous literature in which depression has been linked with increased AD risk [33]. Similarly, depressive symptoms have been associated with increased limbic and prefrontal atrophy over a four-year follow-up in cognitively normal older adults [107]. The left hippocampus (but not the right hippocampus) has also been found to be reduced in major depression disorder in adults [108]. In our sample, only 2% of individuals were considered mildly depressed at baseline and no individuals had GDS scores indicating moderate or severe depression. The present findings suggest that the association between mild depressive symptomology and prefrontal/limbic atrophy also extends to the left hippocampus. Although the mechanism of this relationship remains largely unknown, it is possible that such mood or affect symptomology is associated with the subtle changes in cognition as a function of emerging hippocampal and cortical atrophy [109]. Another perspective is that hippocampal atrophy may be directly affecting networks that are associated with mood and impact depressive symptomology through numerous mechanisms such as estrogen depletion and deregulation of certain neural circuits [110].
A lower body mass index (BMI) was associated with the lower LHC, but not RHC, trajectory class. BMI associations with brain and cognitive aging are complex [111–113]. A previous studying using BMI as a predictor of HC volumetric change reported a negative association between hippocampal volume (across hemispheres, but with stronger effects for the LHC) and BMI [114]. Participants of that study were, on average, a decade younger than those of the current study. Our findings indicate that a protective effect of higher BMI persists in an older cohort, and further support that this effect occurs more strongly in the LHC. Potential protective effects of increased BMI in older age (versus midlife or young-old cohort) have been reported in the context of AD risk [115, 116] and cognitive decline [117] and may act similarly for risk reduction for hippocampal atrophy. Notably, it appears that higher BMI might be an important AD risk factor in midlife, but this association reverses towards protection or risk-reduction in later life and older age, perhaps due to weight changes occurring in preclinical AD phases [118, 119].
We tested 38 biomarkers and risk factors as potential predictors of trajectory class membership. Our analytic approach considered all predictors simultaneously in a computationally competitive context. In addition to the seven predictors of trajectory classes, we note that there were 31 AD-related predictors that did not successfully emerge in either (LHC or RHC) of the analyses. Within the biospecimen modality, plasma measures of Aβ and tau outperformed CSF Aβ and tau to discriminate between hippocampal trajectories. Although CSF measures of Aβ have been consistently reported as sensitive biomarkers of MCI and AD, recent developments have identified less invasive and lower cost alternatives such as blood-based biomarkers [103]. Potentially, these peripheral biomarkers are more useful in predicting specific pathological changes and broader neurodegeneration, such as hippocampal atrophy. Alternatively, it is possible that the present plasma markers are better suited as predictors of non-clinical aging outcomes (i.e., hippocampal classes representing a dynamic distribution of cognitively normal longitudinal trajectories) as compared to related findings for CSF markers and associations with AD diagnosis and clinical progression patterns. For the genetic modality, although APOE genetic risk is the most important genetic risk factor for sporadic AD [120], it did not appear as one of the important or leading predictors of the lowest HC atrophy class (although it was among the lesser contributing predictors). This may point to an attenuated importance of single genetic factors within an interactive network of wide-ranging AD risk factors. The inclusion of a polygenic AD-related risk score may have revealed more predictive utility in the context of other risk-related AD predictors and should be investigated in future research [22]. Within the vascular/metabolic modality, no factors reached sufficient variable importance to be considered important predictors despite past findings suggesting possible associations [17, 121]. For the demographic modality, chronological age was not found to be an important predictor of the lowest hippocampal trajectory class membership. Instead, our findings indicate that, when available, certain aging-related mechanistic predictors may be more important than age per se for predicting adverse brain aging outcomes in predominantly cognitively normal samples. This provides additional support to the growing evidence that markers of biological age (versus chronological age) are important to consider in predictions of exacerbated decline in non-demented aging [122–125]. Given the current analytic approach and the use of a conditional variable importance measure, we identified the most prominent predictors of hippocampal trajectory classes in the context of other previously identified and often closely related AD-related biomarkers and risk factors.
There were several limitations to the present study. First, previous reports have acknowledged some limited generalizability of the ADNI cohort due to convenience sampling and possible biases in recruited participants (e.g., familial history of AD) [126]. However, these potentially at-risk individuals are key targets of clinical trials and prevention efforts. As our study aimed to identify biomarkers and risk factors associated with morphometric change in cognitively normal older adults, we have identified biomarker associations in individuals that are likely to be targeted for these purposes. Second, although variables included in the current study had few missing data (0–3.9%), there was a notable exception for biomarkers in the biospecimen modality. For the biospecimen biomarkers, missing data ranged from 35 to 51.3%. Missing data were imputed using the ‘missForest’ package in R which utilizes a random forest to iteratively predict missing values. The present imputation procedure and RFA models allowed for the inclusion of many predictors from multiple modalities despite some with higher rates of missing data. We consider this a notable strength of our approach, as previous studies predicting AD risk have often employed fewer biomarker or risk factor predictors, possibly due to analytical restrictions (e.g., multiple comparison issues) [127–129]. Replicating and validating these findings using additional biomarker data would be an important future step. Third, because of data limitations we were unable to investigate whether preclinical trajectory class membership would predict clinical diagnostic outcomes such as MCI or AD. As shown in Table 5, 96.3% of the analyzed longitudinal observations were with participants who were free of MCI or AD and over 99% included persons who were non-AD. In total, there were very few participants who transitioned to AD (n = 8) or MCI (n = 32, with 5 reverting back to CN) within the six waves under study—and together they contributed data for only 3.7% of the analyzed longitudinal observations (AD = 0.56%). By design, the present sample was selected initially to be cognitively asymptomatic (all were cognitively normal at baseline) and remained predominantly so throughout the study. The very small number of observations that could be characterized as impaired was appropriate for our objectives and expected in our design. No separate machine learning prediction analysis of this small cluster is possible due to severely imbalanced groups. However, a post-hoc check revealed that, in general, most of the individuals transitioning to impairment status were members of the lower trajectory classes. Accordingly, we suggest future work aimed at testing whether lower HC trajectory class membership is a reliable precursor condition for impairment and AD diagnosis. Fourth, the correlational analyses to clarify predictor directionality were focused more on describing associations with predictor variables than interpreting potential underlying mechanisms. Specific mechanisms should be further explored in future studies. Fifth, due to the ADNI MRI methods and protocols, almost all participants from ADNI1 were scanned using 1.5T scanners and all participants from ADNI2 were scanned using 3T scanners. However, we found no significant associations between scanner strength and hippocampal trajectory classes. This indicates that scanner strength was properly corrected for at the modelling stage, as has been done in previous studies [44]. Sixth, other (non-AD specific) pathologies and risk factors unavailable in this study may have contributed to the observed hippocampal volume and atrophy trajectories.
Conclusions
We used multi-wave MRI data from ADNI to identified three data-driven trajectory classes of left and right hippocampal volume in asymptomatic older adults. Our analytic approach, based on an algorithm of level and slope, revealed that the vast individual variability in hippocampal atrophy could be clustered into trajectory classes which capture the heterogeneous and dynamic nature of brain aging in cognitively normal older adults. We then applied machine learning technology to a large, multi-modal set of AD-related biomarkers and risk factors and identified the best predictors that discriminated lower versus higher hippocampal trajectory classes. The current findings identify several emerging and prominent risk factors and biomarkers associated with early stages of hippocampal atrophy, all of which merit further investigation in future mechanistic and clinical research.
ACKNOWLEDGMENTS
Roger A. Dixon, Simon Duchesne, and Pierre Bellec acknowledge support from the Canadian Consortium on Neurodegeneration in Aging to Team 9 (Biomarkers of Neurodegeneration), which is funded by Alberta Innovates in partnership with the Canadian Institutes of Health Research (CIHR; #163902). SD and OP acknowledge data contribution from ADNI and a CIHR Operating Grant (#119923). GPM acknowledges support from the Alberta SynAD grant (ASABNT/UHF). SMD acknowledges funding from Alberta Innovates (Data-Enabled Innovation Graduate Scholarship).
Data collection and sharing for this project was funded by the Alzheimer’s Disease Neuroimaging Initiative (ADNI) (National Institutes of Health Grant U01 AG024904) and DON ADNI (Department of Defense award number W81XWH-12-2-0012). ADNI is funded by the National Institute on Aging, The National Institute of Biomedical Imaging and Bioengineering, and through generous contributions from the following: AbbVie; Alzheimer’s Association; Alzheimer’s Drug Discovery Foundation; Araclon Biotech, BioClinica, Inc.; Biogen; Bristo-Myers Squibb Company; CerSpir, Inc.; Cogstate; Eisai Inc.; Elan Pharmaceuticals, Inc.; Eli Lilly and Company; Eurolmmun; F. Hoffmann-Fa Roche Ltd and its affiliated company Genetech, Inc.; Fujirebio; GE Healthcare; IXICO Ltd.; Janssen Alzheimer Immunotherapy Research & Development, LLC.; Johnson & Johnson Pharmaceutical Research & Development LLC.; Lumosity; Lundbeck; Merck & Co., Inc.; Meso Scale Diagnostics, LLC.; NeuroRx Research; Neurotrack Technologies; Novartis Pharmaceuticals Corporation; Pfizer Inc.; Piramal Imaging; Servier; Takeda Pharmaceutical Company; and Transition Therapeutics. The Canadian Institutes of Health Research is providing funds to support ADNI clinical sites in Canada. Private sector contributions are facilitated by the Foundation for the National Institutes of Health (http://www.fnih.org). The grantee organization is the Northern California Institute for Research and Education, and the study is coordinated by the Alzheimer’s Therapeutic Research Institute at the University of Southern California. ADNI data are disseminated by the Laboratory for Neuro Imaging at the University of Southern California.
Authors’ disclosures available online (https://www.j-alz.com/manuscript-disclosures/21-5289r1).
SUPPLEMENTARY MATERIAL
[1] The supplementary material is available in the electronic version of this article: https://dx.doi.org/10.3233/JAD-215289.
REFERENCES
[1] | Rusinek H , De Santi S , Frid D , Tsui W-H , Tarshish CY , Convit A , de Leon MJ ((2003) ) Regional brain atrophy rate predicts future cognitive decline: 6-year longitudinal MR imaging study of normal aging. Radiology 229: , 691–696. |
[2] | De Leon M , George A , Golomb J , Tarshish C , Convit A , Kluger A , De Santi S , Mc Rae T , Ferris S , Reisberg B ((1997) ) Frequency of hippocampal formation atrophy in normal aging and Alzheimer’s disease. Neurobiol Aging 18: , 1–11. |
[3] | Raz N , Ghisletta P , Rodrigue KM , Kennedy KM , Lindenberger U ((2010) ) Trajectories of brain aging in middle-aged and older adults: Regional and individual differences. Neuroimage 51: , 501–511. |
[4] | Potvin O , Mouiha A , Dieumegarde L , Duchesne S , Alzheimer’s Disease Neuroimaging Initiative ((2016) ) Normative data for subcortical regional volumes over the lifetime of the adult human brain. Neuroimage 137: , 9–20. |
[5] | Fox NC , Schott JM ((2004) ) Imaging cerebral atrophy: Normal ageing to Alzheimer’s disease. Lancet 363: , 392–394. |
[6] | Fox N , Scahill R , Crum W , Rossor M ((1999) ) Correlation between rates of brain atrophy and cognitive decline in AD. Neurology 52: , 1687–1687. |
[7] | Jack CR , Petersen RC , Xu Y , O’Brien P , Smith GE , Ivnik RJ , Boeve BF , Tangalos EG , Kokmen E ((2000) ) Rates of hippocampal atrophy correlate with change in clinical status in aging and AD. Neurology 55: , 484–490. |
[8] | Byun MS , Kim SE , Park J , Yi D , Choe YM , Sohn BK , Choi HJ , Baek H , Han JY , Woo JI ((2015) ) Heterogeneity of regional brain atrophy patterns associated with distinct progression rates in Alzheimer’s disease. PLoS One 10: , e0142756. |
[9] | Apostolova LG , Green AE , Babakchanian S , Hwang KS , Chou Y-Y , Toga AW , Thompson PM ((2012) ) Hippocampal atrophy and ventricular enlargement in normal aging, mild cognitive impairment and Alzheimer’s disease. Alzheimer Dis Assoc Disord 26: , 17–27. |
[10] | Pini L , Pievani M , Bocchetta M , Altomare D , Bosco P , Cavedo E , Galluzzi S , Marizzoni M , Frisoni GB ((2016) ) Brain atrophy in Alzheimer’s disease and aging. Ageing Res Rev 30: , 25–48. |
[11] | Ardekani B , Hadid S , Blessing E , Bachman A ((2019) ) Sexual dimorphism and hemispheric asymmetry of hippocampal volumetric integrity in normal aging and Alzheimer disease. AJNR Am J Neuroradiol 40: , 276–282. |
[12] | Wachinger C , Salat DH , Weiner M , Reuter M , Alzheimer’s Disease Neuroimaging Initiative ((2016) ) Whole-brain analysis reveals increased neuroanatomical asymmetries in dementia for hippocampus and amygdala. Brain 139: , 3253–3266. |
[13] | Minkova L , Habich A , Peter J , Kaller CP , Eickhoff SB , Klöppel S ((2017) ) Gray matter asymmetries in aging and neurodegeneration: A review and meta-analysis. Hum Brain Mapp 38: , 5890–5904. |
[14] | Zhao W , Wang X , Yin C , He M , Li S , Han Y ((2019) ) Trajectories of the hippocampal subfields atrophy in the Alzheimer’s disease: A structural imaging study. Front Neuroinform 13: , 13. |
[15] | Zhang Y , Qiu C , Lindberg O , Bronge L , Aspelin P , Bäckman L , Fratiglioni L , Wahlund L-O ((2010) ) Acceleration of hippocampal atrophy in a non-demented elderly population: The SNAC-K study. Int Psychogeriatr 22: , 14–25. |
[16] | Jack CR , Shiung M , Weigand S , O’Brien P , Gunter J , Boeve BF , Knopman DS , Smith G , Ivnik R , Tangalos EG ((2005) ) Brain atrophy rates predict subsequent clinical conversion in normal elderly and amnestic MCI. Neurology 65: , 1227–1231. |
[17] | McFall GP , Wiebe SA , Vergote D , Westaway D , Jhamandas J , Bäckman L , Dixon RA ((2015) ) ApoE and pulse pressure interactively influence level and change in the aging of episodic memory: Protective effects among epsilon2 carriers. Neuropsychology 29: , 388–401. |
[18] | Glisky EL ((2007) ) Changes in cognitive function in human aging. In Brain Aging: Models, Methods, and Mechanisms, GliskyEL, RiddleDR, Eds. CRC Press/Taylor & Francis, pp. 3–20. |
[19] | McFall GP , McDermott KL , Dixon RA ((2019) ) Modifiable risk factors discriminate memory trajectories in non-demented aging: Precision factors and targets for promoting healthier brain aging and preventing dementia? J Alzheimers Dis 70: , S101–S118. |
[20] | Masyn KE ((2013) ) Latent class analysis and finite mixture modeling. In The Oxford Handbook of Quantitative Methods in Psychology: Vol.2: Statistical Analysis. Little TD, Ed. Oxford University Press, Oxford, pp. 551–611. |
[21] | Habes M , Grothe MJ , Tunc B , McMillan C , Wolk DA , Davatzikos C ((2020) ) Disentangling heterogeneity in Alzheimer’s disease and related dementias using data-driven methods. Biol Psychiatry 88: , 70–82. |
[22] | Badhwar A , McFall GP , Sapkota S , Black SE , Chertkow H , Duchesne S , Masellis M , Li L , Dixon RA , Bellec P ((2020) ) A multiomics approach to heterogeneity in Alzheimer’s disease: Focused review and roadmap. Brain 143: , 1315–1331. |
[23] | Melis RJF , Haaksma ML , Muniz-Terrera G ((2019) ) Understanding and predicting the longitudinal course of dementia. Curr Opin Psychiatry 32: , 123–129. |
[24] | McDermott KL , McFall GP , Andrews SJ , Anstey KJ , Dixon RA ((2017) ) Memory resilience to Alzheimer’s genetic risk: Sex effects in predictor profiles. J Gerontol B Psychol Sci Soc Sci 72: , 937–946. |
[25] | Ferreira D , Verhagen C , Hernández-Cabrera JA , Cavallin L , Guo C-J , Ekman U , Muehlboeck J-S , Simmons A , Barroso J , Wahlund L-O ((2017) ) Distinct subtypes of Alzheimer’s disease based on patterns of brain atrophy: Longitudinal trajectories and clinical applications. Sci Rep 7: , 46263. |
[26] | Nettiksimmons J , Harvey D , Brewer J , Carmichael O , DeCarli C , Jack CR Jr , Petersen R , Shaw LM , Trojanowski JQ , Weiner MW ((2010) ) Subtypes based on cerebrospinal fluid and magnetic resonance imaging markers in normal elderly predict cognitive decline. Neurobiol Aging 31: , 1419–1428. |
[27] | Jung N-Y , Seo SW , Yoo H , Yang J-J , Park S , Kim YJ , Lee J , San Lee J , Jang YK , Lee JM ((2016) ) Classifying anatomical subtypes of subjective memory impairment. Neurobiol Aging 48: , 53–60. |
[28] | Eavani H , Habes M , Satterthwaite TD , An Y , Hsieh M-K , Honnorat N , Erus G , Doshi J , Ferrucci L , Beason-Held LL ((2018) ) Heterogeneity of structural and functional imaging patterns of advanced brain aging revealed via machine learning methods. Neurobiol Aging 71: , 41–50. |
[29] | Tam A , Dansereau C , Iturria-Medina Y , Urchs S , Orban P , Sharmarke H , Breitner J , Bellec P , Alzheimer’s Disease Neuroimaging Initiative ((2019) ) A highly predictive signature of cognition and brain atrophy for progression to Alzheimer’s dementia. Gigascience 8: , giz055. |
[30] | Malpas CB ((2016) ) Structural neuroimaging correlates of cognitive status in older adults: A person-oriented approach. J Clin Neurosci 30: , 77–82. |
[31] | Dong A , Honnorat N , Gaonkar B , Davatzikos C ((2015) ) CHIMERA: Clustering of heterogeneous disease effects via distribution matching of imaging patterns. IEEE Trans Med Imaging 35: , 612–621. |
[32] | Orban P , Tam A , Urchs S , Savard M , Madjar C , Badhwar A , Dansereau C , Vogel J , Schmuel A , Dagher A ((2017) ) Subtypes of functional brain connectivity as early markers of neurodegeneration in Alzheimer’s disease. BioRxiv, 195164. |
[33] | Livingston G , Sommerlad A , Orgeta V , Costafreda SG , Huntley J , Ames D , Ballard C , Banerjee S , Burns A , Cohen-Mansfield J ((2017) ) Dementia prevention, intervention, and care. Lancet 390: , 2673–2734. |
[34] | Jack CR Jr , Bennett DA , Blennow K , Carrillo MC , Dunn B , Haeberlein SB , Holtzman DM , Jagust W , Jessen F , Karlawish J ((2018) ) NIA-AA research framework: Toward a biological definition of Alzheimer’s disease. Alzheimers Dement 14: , 535–562. |
[35] | Sapkota S , Huan T , Tran T , Zheng J , Camicioli R , Li L , Dixon RA ((2018) ) Alzheimer’s biomarkers from multiple modalities selectively discriminate clinical status: Relative importance of salivary metabolomics panels, genetic, lifestyle, cognitive, functional health and demographic risk markers. Front Aging Neurosci 10: , 296. |
[36] | Stricker NH , Dodge HH , Dowling NM , Han SD , Erosheva EA , Jagust WJ , Alzheimer’s Disease Neuroimaging Initiative ((2012) ) CSF biomarker associations with change in hippocampal volume and precuneus thickness: Implications for the Alzheimer’s pathological cascade. Brain Imaging Behav 6: , 599–609. |
[37] | Henneman W , Vrenken H , Barnes J , Sluimer I , Verwey N , Blankenstein M , Klein M , Fox N , Scheltens P , Barkhof F ((2009) ) Baseline CSF p-tau levels independently predict progression of hippocampal atrophy in Alzheimer disease. Neurology 73: , 935–940. |
[38] | Durazzo TC , Meyerhoff DJ , Nixon SJ ((2013) ) Interactive effects of chronic cigarette smoking and age on hippocampal volumes. Drug Alcohol Depend 133: , 704–711. |
[39] | Valenzuela MJ , Sachdev P , Wen W , Chen X , Brodaty H ((2008) ) Lifespan mental activity predicts diminished rate of hippocampal atrophy. PLoS One 3: , e2598. |
[40] | Beltrán JF , Wahba BM , Hose N , Shasha D , Kline RP , Alzheimer’s Disease Neuroimaging Initiative ((2020) ) Inexpensive, non-invasive biomarkers predict Alzheimer transition using machine learning analysis of the Alzheimer’s Disease Neuroimaging (ADNI) database. PloS One 15: , e0235663. |
[41] | Falahati F , Westman E , Simmons A ((2014) ) Multivariate data analysis and machine learning in Alzheimer’s disease with a focus on structural magnetic resonance imaging. J Alzheimers Dis 41: , 685–708. |
[42] | Ritter K , Schumacher J , Weygandt M , Buchert R , Allefeld C , Haynes J-D , Alzheimer’s Disease Neuroimaging Initiative ((2015) ) Multimodal prediction of conversion to Alzheimer’s disease based on incomplete biomarkers. Alzheimers Dement (Amst) 1: , 206–215. |
[43] | Cherbuin N , Réglade-Meslin C , Kumar R , Sachdev P , Anstey KJ ((2010) ) Mild cognitive disorders are associated with different patterns of brain asymmetry than normal aging: The PATH through Life Study. Front Psychiatry 1: , 11. |
[44] | Koran MEI , Wagener M , Hohman TJ ((2017) ) Sex differences in the association between AD biomarkers and cognitive decline. Brain Imaging Behav 11: , 205–213. |
[45] | Bernard C , Helmer C , Dilharreguy B , Amieva H , Auriacombe S , Dartigues J-F , Allard M , Catheline G ((2014) ) Time course of brain volume changes in the preclinical phase of Alzheimer’s disease. Alzheimers Dement 10: , 143–151.e141. |
[46] | Barnes J , Scahill RI , Schott JM , Frost C , Rossor MN , Fox NC ((2005) ) Does Alzheimer’s disease affect hippocampal asymmetry? Evidence from a cross-sectional and longitudinal volumetric MRI study. Dement Geriatr Cogn Disord 19: , 338–344. |
[47] | Petersen RC , Aisen P , Beckett LA , Donohue M , Gamst A , Harvey DJ , Jack C , Jagust W , Shaw L , Toga A ((2010) ) Alzheimer’s Disease Neuroimaging Initiative (ADNI): Clinical characterization. Neurology 74: , 201–209. |
[48] | Reuter M , Schmansky NJ , Rosas HD , Fischl B ((2012) ) Within-subject template estimation for unbiased longitudinal image analysis. Neuroimage 61: , 1402–1418. |
[49] | Dale A , Fischl B , Sereno MI ((1999) ) Cortical surface-based analysis: I. Segmentation and surface reconstruction. Neuroimage 9: , 179–194. |
[50] | Han X , Jovicich J , Salat D , van der Kouwe A , Quinn B , Czanner S , Busa E , Pacheco J , Albert M , Killiany R , Maguire P , Rosas D , Makris N , Dale A , Dickerson B , Fischl B ((2006) ) Reliability of MRI-derived measurements of human cerebral cortical thickness: The effects of field strength, scanner upgrade and manufacturer. Neuroimage 32: , 180–194. |
[51] | Fischl B , van der Kouwe A , Destrieux C , Halgren E , Ségonne F , Salat DH , Busa E , Seidman LJ , Goldstein J , Kennedy D , Caviness V , Makris N , Rosen B , Dale AM ((2004) ) Automatically parcellating the human cerebral cortex. Cereb Cortex 14: , 11–22. |
[52] | Fischl B , Salat DH , van der Kouwe AJW , Makris N , Ségonne F , Quinn BT , Dale AM ((2004) ) Sequence-independent segmentation of magnetic resonance images. Neuroimage 23: , S69–S84. |
[53] | Fischl B , Salat DH , Busa E , Albert M , Dieterich M , Haselgrove C , van der Kouwe A , Killiany R , Kennedy D , Klaveness S , Montillo A , Makris N , Rosen B , Dale AM ((2002) ) Whole brain segmentation: Automated labeling of neuroanatomical structures in the human brain. Neuron 33: , 341–355. |
[54] | Fischl B , Liu A , Dale AM ((2001) ) Automated manifold surgery: Constructing geometrically accurate and topologically correct models of the human cerebral cortex. IEEE Med Imaging 20: , 70–80. |
[55] | Fischl B , Dale AM ((2000) ) Measuring the thickness of the human cerebral cortex from magnetic resonance images. Proc Natl Acad Sci U S A 97: , 11050–11055. |
[56] | Fischl B , Sereno MI , Tootell RBH , Dale AM ((1999) ) High-resolution intersubject averaging and a coordinate system for the cortical surface. Hum Brain Mapp 8: , 272–284. |
[57] | Fischl B , Sereno MI , Dale A ((1999) ) Cortical surface-based analysis: II: Inflation, flattening, and a surface-based coordinate system. Neuroimage 9: , 195–207. |
[58] | Jovicich J , Czanner S , Greve D , Haley E , van der Kouwe A , Gollub R , Kennedy D , Schmitt F , Brown G , MacFall J , Fischl B , Dale A ((2006) ) Reliability in multi-site structural MRI studies: Effects of gradient non-linearity correction on phantom and human data. Neuroimage 30: , 436–443. |
[59] | Segonne F , Dale AM , Busa E , Glessner M , Salat D , Hahn HK , Fischl B ((2004) ) A hybrid approach to the skull stripping problem in MRI. Neuroimage 22: , 1060–1075. |
[60] | Dale AM , Sereno MI ((1993) ) Improved localizadon of cortical activity by combining EEG and MEG with MRI cortical surface reconstruction: A linear approach. J Cogn Neurosci 5: , 162–176. |
[61] | Reuter M , Rosas HD , Fischl B ((2010) ) Highly accurate inverse consistent registration: A robust approach. Neuroimage 53: , 1181–1196. |
[62] | Sled JG , Zijdenbos AP , Evans AC ((1998) ) A nonparametric method for automatic correction of intensity nonuniformity in MRI data. IEEE Trans Med Imaging 17: , 87–97. |
[63] | Segonne F , Pacheco J , Fischl B ((2007) ) Geometrically accurate topology-correction of cortical surfaces using nonseparating loops. IEEE Trans Med Imaging 26: , 518–529. |
[64] | Jack CR Jr , Bernstein MA , Fox NC , Thompson P , Alexander G , Harvey D , Borowski B , Britson PJ , L. Whitwell J , Ward C ((2008) ) The Alzheimer’s disease neuroimaging initiative (ADNI): MRI methods. J Magn Reson Imaging 27: , 685–691. |
[65] | Gunter JL , Bernstein MA , Borowski BJ , Ward CP , Britson PJ , Felmlee JP , Schuff N , Weiner M , Jack CR ((2009) ) Measurement of MRI scanner performance with the ADNI phantom. Med Phys 36: , 2193–2205. |
[66] | Sundermann EE , Tran M , Maki PM , Bondi MW , Alzheimer’s Disease Neuroimaging Initiative ((2018) ) Sex differences in the association between apolipoprotein E ɛ4 allele and Alzheimer’s disease markers. Alzheimers Dement (Amst) 10: , 438–447. |
[67] | Ram N , Grimm KJ ((2009) ) Growth mixture modeling: A method for identifying differences in longitudinal change among unobserved groups. Int J Behav Dev 33: , 565–576. |
[68] | Muthén L , Muthén B ((2018) ) Mplus users guide and Mplus version 8.2. Retrieved January 10, 2019. |
[69] | Nylund KL , Asparouhob T , Muthén BO ((2007) ) Deciding on the number of classes in latent class analysis and growth mixture modeling: A Monte Carlo simulation study. Struct Equ Modeling 14: , 535–569. |
[70] | Little TD ((2013) ) Longitudinal Structural Equation Modeling, Guilford Press, New York, NY. |
[71] | HothornT, BuehlmannP, DudoitS, MolinaroA, Van Der LaanM ((2006) ) Survival ensembles. Biostatistics 7: , 355–373. |
[72] | Lanza ST , Collins LM , Lemmon DR , Schafer JL ((2007) ) PROC LCA: A SAS procedure for latent class analysis. Struct Equ Modeling 14: , 671–694. |
[73] | Couronné R , Probst P , Boulesteix A-L ((2018) ) Random forest versus logistic regression: A large-scale benchmark experiment. BMC Bioinformatics 19: , 270. |
[74] | Hapfelmeier A , Ulm K ((2013) ) A new variable selection approach using random forests. Comput Stat Data Anal 60: , 50–69. |
[75] | Strobl C , Boulesteix AL , Zeileis A , Hothorn T ((2007) ) Bias in random forest variable mportance measures: Illustrations, sources and a solution. BMC Bioinformatics 8: , 1–21. |
[76] | Strobl C , Boulesteix A-L , Kneib T , Augustin T , Zeileis A ((2008) ) Conditional variable importance for random forests. BMC Bioinformatics 9: , 1–11. |
[77] | Toloşi L , Lengauer T ((2011) ) Classification with correlated features: Unreliability of feature ranking and solutions. Bioinformatics 27: , 1986–1994. |
[78] | Gregorutti B , Michel B , Saint-Pierre P ((2017) ) Correlation and variable importance in random forests. Stat Comput 27: , 659–678. |
[79] | Hastie T , Tibshirani R , Friedman J ((2009) ) The Elements of Statistical Learning: Data Mining, Inference, and Prediction, Springer Science & Business Media. |
[80] | Stekhoven DJ , Bühlmann P ((2012) ) MissForest—non-parametric missing value imputation for mixed-type data. Bioinformatics 28: , 112–118. |
[81] | Waljee AK , Mukherjee A , Singal AG , Zhang Y , Warren J , Balis U , Marrero J , Zhu J , Higgins PD ((2013) ) Comparison of imputation methods for missing laboratory data in medicine. BMJ Open 3: , e002847. |
[82] | Stekhoven DJ ((2011) ) Using the missForest package. R package, 1–11. |
[83] | Cherbuin N , Sargent-Cox K , Easteal S , Sachdev P , Anstey KJ ((2015) ) Hippocampal atrophy is associated with subjective memory decline: The PATH Through Life study. Am J Geriatr Psychiatry 23: , 446–455. |
[84] | Apostolova LG , Mosconi L , Thompson PM , Green AE , Hwang KS , Ramirez A , Mistur R , Tsui WH , de Leon MJ ((2010) ) Subregional hippocampal atrophy predicts Alzheimer’s dementia in the cognitively normal. Neurobiol Aging 31: , 1077–1088. |
[85] | Vogel JW , Young AL , Oxtoby NP , Smith R , Ossenkoppele R , Strandberg OT , La Joie R , Aksman LM , Grothe MJ , Iturria-Medina Y ((2021) ) Four distinct trajectories of tau deposition identified in Alzheimer’s disease. Nat Med 27: , 871–881. |
[86] | Fraser MA , Shaw ME , Cherbuin N ((2015) ) A systematic review and meta-analysis of longitudinal hippocampal atrophy in healthy human ageing. Neuroimage 112: , 364–374. |
[87] | Drouin SM , McFall GP , Dixon RA ((2022) ) Subjective memory concerns, poor vascular health, and male sex predict exacerbated memory decline trajectories: An integrative data-driven class and prediction analysis. Neuropsychology 36: , 128–139. |
[88] | Laws KR , Irvine K , Gale TM ((2016) ) Sex differences in cognitive impairment in Alzheimer’s disease. World J Psychiatry 6: , 54–65. |
[89] | Ardekani BA , Convit A , Bachman AH ((2016) ) Analysis of the MIRIAD data shows sex differences in hippocampal atrophy progression. J Alzheimers Dis 50: , 847–857. |
[90] | Seo SW , Im K , Lee J-M , Kim ST , Ahn HJ , Go SM , Kim S-H , Na DL ((2011) ) Effects of demographic factors on cortical thickness in Alzheimer’s disease. Neurobiol Aging 32: , 200–209. |
[91] | Shpanskaya KS , Choudhury KR , Hostage C Jr , Murphy KR , Petrella JR , Doraiswamy PM , Alzheimer’s Disease Neuroimaging Initiative ((2014) ) Educational attainment and hippocampal atrophy in the Alzheimer’s disease neuroimaging initiative cohort. J Neuroradiol 41: , 350–357. |
[92] | Livingston G , Huntley J , Sommerlad A , Ames D , Ballard C , Banerjee S , Brayne C , Burns A , Cohen-Mansfield J , Cooper C ((2020) ) Dementia prevention, intervention, and care: 2020 report of the Lancet Commission. Lancet 396: , 413–446. |
[93] | Dixon RA , Lachman ME ((2019) ) Risk and protective factors in cognitive aging: Advances in assessment, prevention, and promotion of alternative pathways. In The Aging Brain: Functional Adaptation Across Adulthood. Samanez-LarkinGR, ed. APA Books, Washington, DC, pp. 217–263. |
[94] | Whitwell JL , Dickson DW , Murray ME , Weigand SD , Tosakulwong N , Senjem ML , Knopman DS , Boeve BF , Parisi JE , Petersen RC ((2012) ) Neuroimaging correlates of pathologically defined subtypes of Alzheimer’s disease: A case-control study. Lancet Neurol 11: , 868–877. |
[95] | Noble KG , Grieve SM , Korgaonkar MS , Engelhardt LE , Griffith EY , Williams LM , Brickman AM ((2012) ) Hippocampal volume varies with educational attainment across the life-span. Front Hum Neurosci 6: , 307. |
[96] | Piras F , Cherubini A , Caltagirone C , Spalletta G ((2011) ) Education mediates microstructural changes in bilateral hippocampus. Hum Brain Mapp 32: , 282–289. |
[97] | Shen S , Zhou W , Chen X , Zhang J ((2019) ) Sex differences in the association of APOE ɛ4 genotype with longitudinal hippocampal atrophy in cognitively normal older people. Eur J Neurol 26: , 1362–1369. |
[98] | Sundermann EE , Tran M , Maki PM , Bondi MW ((2018) ) Sex differences in the association between apolipoprotein E ɛ4 allele and Alzheimer’s disease markers. Alzheimers Dement (Amst) 10: , 438–447. |
[99] | Voevodskaya O , Simmons A , Nordenskjöld R , Kullberg J , Ahlström H , Lind L , Wahlund L-O , Larsson E-M , Westman E , Alzheimer’s Disease Neuroimaging Initiative ((2014) ) The effects of intracranial volume adjustment approaches on multiple regional MRI volumes in healthy aging and Alzheimer’s disease. Front Aging Neurosci 6: , 264. |
[100] | Cantero JL , Iglesias JE , Van Leemput K , Atienza M ((2016) ) Regional hippocampal atrophy and higher levels of plasma amyloid-beta are associated with subjective memory complaints in nondemented elderly subjects. J Gerontol A Biol Sci Med Sci 71: , 1210–1215. |
[101] | Hilal S , Wolters FJ , Verbeek MM , Vanderstichele H , Ikram MK , Stoops E , Ikram MA , Vernooij MW ((2018) ) Plasma amyloid-β levels, cerebral atrophy and risk of dementia: A population-based study. Alzheimers Res Ther 10: , 63. |
[102] | Shi Y , Lu X , Zhang L , Shu H , Gu L , Wang Z , Gao L , Zhu J , Zhang H , Zhou D ((2019) ) Potential value of plasma amyloid-β, total tau, and neurofilament light for identification of early Alzheimer’s disease. ACS Chem Neurosci 10: , 3479–3485. |
[103] | Hampel H , O’Bryant SE , Molinuevo JL , Zetterberg H , Masters CL , Lista S , Kiddle SJ , Batrla R , Blennow K ((2018) ) Blood-based biomarkers for Alzheimer disease: Mapping the road to the clinic. Nat Rev Neurol 14: , 639–652. |
[104] | Deters KD , Risacher SL , Kim S , Nho K , West JD , Blennow K , Zetterberg H , Shaw LM , Trojanowski JQ , Weiner MW ((2017) ) Plasma tau association with brain atrophy in mild cognitive impairment and Alzheimer’s disease. J Alzheimers Dis 58: , 1245–1254. |
[105] | Pase MP , Beiser AS , Himali JJ , Satizabal CL , Aparicio HJ , DeCarli C , Chêne G , Dufouil C , Seshadri S ((2019) ) Assessment of plasma total tau level as a predictive biomarker for dementia and related endophenotypes. JAMA Neurol 76: , 598–606. |
[106] | Chiu M-J , Fan L-Y , Chen T-F , Chen Y-F , Chieh J-J , Horng H-E ((2017) ) Plasma tau levels in cognitively normal middle-aged and older adults. Front Aging Neurosci 9: , 51. |
[107] | Lebedeva A , Sundström A , Lindgren L , Stomby A , Aarsland D , Westman E , Winblad B , Olsson T , Nyberg L ((2018) ) Longitudinal relationships among depressive symptoms, cortisol, and brain atrophy in the neocortex and the hippocampus. Acta Psychiatr Scand 137: , 491–502. |
[108] | Bremner JD , Narayan M , Anderson ER , Staib LH , Miller HL , Charney DS ((2000) ) Hippocampal volume reduction in major depression. Am J Psychiatry 157: , 115–118. |
[109] | Mosti CB , Rog LA , Fink JW ((2019) ) Differentiating mild cognitive impairment and cognitive changes of normal aging. In Handbook on the Neuropsychology of Aging and Dementia.. Springer, pp. 445–463. |
[110] | Elbejjani M , Fuhrer R , Abrahamowicz M , Mazoyer B , Crivello F , Tzourio C , Dufouil C ((2014) ) Hippocampal atrophy and subsequent depressive symptoms in older men and women: Results from a 10-year prospective cohort. Am J Epidemiol 180: , 385–393. |
[111] | Bischof GN , Park DC ((2015) ) Obesity and aging: Consequences for cognition, brain structure and brain function. Psychosom Med 77: , 697–709. |
[112] | Anstey K , Cherbuin N , Budge M , Young J ((2011) ) Body mass index in midlife and late-life as a risk factor for dementia: A meta-analysis of prospective studies. Obes Rev 12: , e426–e437. |
[113] | Alosco ML , Duskin J , Besser LM , Martin B , Chaisson CE , Gunstad J , Kowall NW , McKee AC , Stern RA , Tripodis Y ((2017) ) Modeling the relationships among late-life body mass index, cerebrovascular disease, and Alzheimer’s disease neuropathology in an autopsy sample of 1,421 subjects from the National Alzheimer’s Coordinating Center Data Set. J Alzheimers Dis 57: , 953–968. |
[114] | Cherbuin N , Sargent-Cox K , Fraser M , Sachdev P , Anstey K ((2015) ) Being overweight is associated with hippocampal atrophy: The PATH Through Life Study. Int J Obes 39: , 1509–1514. |
[115] | Atti AR , Palmer K , Volpato S , Winblad B , De Ronchi D , Fratiglioni L ((2008) ) Late-life body mass index and dementia incidence: Nine-year follow-up data from the Kungsholmen Project. J Am Geriatr Soc 56: , 111–116. |
[116] | Luchsinger JA , Mayeux R ((2007) ) Adiposity and Alzheimer’s disease. Curr Alzheimer Res 4: , 127–134. |
[117] | Bohn L , McFall GP , Wiebe SA , Dixon RA ((2020) ) Body mass index predicts cognitive aging trajectories selectively for females: Evidence from the Victoria Longitudinal Study. Neuropsychology 34: , 388–403. |
[118] | Suemoto CK , Gilsanz P , Mayeda ER , Glymour MM ((2015) ) Body mass index and cognitive function: The potential for reverse causation. Int J Obes 39: , 1383–1389. |
[119] | Dye L , Boyle NB , Champ C , Lawton C ((2017) ) The relationship between obesity and cognitive health and decline. Proc Nutr Soc 76: , 443–454. |
[120] | Michaelson DM ((2014) ) APOE ɛ4: The most prevalent yet understudied risk factor for Alzheimer’s disease. Alzheimers Dement 10: , 861–868. |
[121] | Cooper LL , Woodard T , Sigurdsson S , van Buchem MA , Torjesen AA , Inker LA , Aspelund T , Eiriksdottir G , Harris TB , Gudnason V , Launer LJ , Mitchell GF ((2016) ) Cerebrovascular damage mediates relations between aortic stiffness and memory. Hypertension 67: , 176–182. |
[122] | DeCarlo CA , Tuokko HA , Williams D , Dixon RA , MacDonald SW ((2014) ) BioAge: Toward a multi-determined, mechanistic account of cognitive aging. Ageing Res Rev 18: , 95–105. |
[123] | Levine ME , Lu AT , Quach A , Chen BH , Assimes TL , Bandinelli S , Hou L , Baccarelli AA , Stewart JD , Li Y ((2018) ) An epigenetic biomarker of aging for lifespan and healthspan. Aging (Albany NY) 10: , 573–591. |
[124] | Wu JW , Yaqub A , Ma Y , Koudstaal W , Hofman A , Ikram MA , Ghanbari M , Goudsmit J ((2021) ) Biological age in healthy elderly predicts aging-related diseases including dementia. Sci Rep 11: , 15929. |
[125] | MacDonald SW , DeCarlo CA , Dixon RA ((2011) ) Linking biological and cognitive aging: Toward improving characterizations of developmental time. J Gerontol B Psychol Sci Soc Sci 66: , i59–70. |
[126] | Whitwell JL , Wiste HJ , Weigand SD , Rocca WA , Knopman DS , Roberts RO , Boeve BF , Petersen RC , Jack CR , Alzheimer’s Disease Neuroimaging Initiative ((2012) ) Comparison of imaging biomarkers in the Alzheimer disease neuroimaging initiative and the Mayo Clinic Study of Aging. Arch Neurol 69: , 614–622. |
[127] | Gomar JJ , Bobes-Bascaran MT , Conejero-Goldberg C , Davies P , Goldberg TE , Alzheimer’s Disease Neuroimaging Initiative ((2011) ) Utility of combinations of biomarkers, cognitive markers, and risk factors to predict conversion from mild cognitive impairment to Alzheimer disease in patients in the Alzheimer’s Disease Neuroimaging Initiative. Arch Gen Psychiatry 68: , 961–969. |
[128] | Shaffer JL , Petrella JR , Sheldon FC , Choudhury KR , Calhoun VD , Coleman RE , Doraiswamy PM , Alzheimer’s Disease Neuroimaging Initiative ((2013) ) Predicting cognitive decline in subjects at risk for Alzheimer disease by using combined cerebrospinal fluid, MR imaging, and PET biomarkers. Radiology 266: , 583–591. |
[129] | Kwon G-R , Gupta Y , Lama RK ((2019) ) Prediction and classification of Alzheimer’s disease based on combined features from apolipoprotein-E genotype, cerebrospinal fluid, MR, and FDG-PET imaging biomarkers. Front Comput Neurosci 13: , 72. |


