
B Vitamins Prevent Iron-Associated Brain Atrophy and Domain-Specific Effects of Iron, Copper, Aluminum, and Silicon on Cognition in Mild Cognitive Impairment
Abstract
Background:
Metals, silicon, and homocysteine are linked to Alzheimer’s disease. B vitamin therapy lowers homocysteine and slows brain atrophy and cognitive decline in mild cognitive impairment (MCI).
Objective:
Examine metals and silicon as predictors of cognition/brain atrophy in MCI, their interaction with homocysteine and cysteine, and how B vitamins affect these relationships.
Methods:
MCI participants (n = 266, 77.6-year-old, 60.7% female) in VITACOG trial were randomized to receive daily folic acid (0.8 mg)/vitamin B12 (0.5 mg)/vitamin B6 (20 mg) (n = 133) or placebo for two years. At baseline and end-of-study, cranial MRIs were obtained from 168 participants, cognition was analyzed by neuropsychological tests, and serum iron, copper, arsenic, aluminum, and silicon quantified by inductively-coupled plasma mass spectrometry in 196 participants. Data were analyzed by bivariate and multiple regression.
Results:
Baseline iron, cysteine, and homocysteine were significantly associated with brain atrophy rate. Homocysteine effects on brain atrophy rate were modified by iron and cysteine. At baseline, iron, copper, aluminum, and silicon were significantly associated with one or more domains of cognition: semantic memory, verbal episodic memory, attention/processing speed, and executive function. At end-of-study, baseline iron, copper, aluminum, and silicon predicted cognition in at least one domain: semantic memory, verbal episodic memory, visuospatial episodic memory, attention/processing speed, and global cognition in the placebo but not the B vitamin group.
Conclusion:
Disparate effects of serum iron, copper, aluminum, silicon, and homocysteine on cognition and brain atrophy in MCI suggest that cognitive impairment is independent of brain atrophy. These factors showed domain-specific associations with cognition, which were abrogated by B vitamin therapy.
INTRODUCTION
Dementia is a major public health issue in aging modern societies that affects 50 million individuals worldwide (as of 2017) and continues to increase [1]. Brain atrophy occurs during normal aging and is a feature of neurodegeneration that becomes more prominent in individuals with mild cognitive impairment (MCI) and is further accelerated in Alzheimer’s disease (AD) [2]. As no effective treatment for dementia is available, identification of modifiable risk factors that affect the rate of brain atrophy and cognitive decline is important for the development of preventive and treatment strategies [3, 4]. Reducing the rate of brain atrophy is likely to slow the conversion of individuals with MCI to AD [2].
Homocysteine (Hcy) is an emerging risk factor for dementia and AD (reviewed in [5]). Elevated plasma total Hcy (tHcy) is associated with brain atrophy in healthy elderly [6] and in AD patients [7]. Brain atrophy in patients with MCI can be reduced by tHcy-lowering B vitamin therapy [8] which also improves global cognition, episodic memory, and semantic memory [9].
Homeostasis of metals has been linked to neurodegenerative diseases, including AD (reviewed in [10]). For example, copper (Cu) [11] and iron (Fe) levels [12] are elevated in AD brains. Brain Fe accumulation is associated with accumulation of amyloid-β, tau, accelerated neurodegeneration, and cognitive decline in AD patients [13, 14]. Aluminum (Al) accumulates in senile plaques [15] and a high daily intake of Al is associated with increased risk of dementia [16]. Silicon (Si) has been shown to prevent gastrointestinal absorption of Al [17], its deleterious effects on cognition, and to reduce the risk of AD [18]. In the general population, plasma levels of Fe and Cu [19, 20] are associated with cognitive function, while arsenic (As) can cause learning and memory disorders and mood deficits [21].
Although homeostasis of iron and other elements has been linked to neurodegenerative diseases, their influence on structural and functional aspects of cognition in MCI has not been examined. For this reason, we quantified serum levels on Fe, Cu, As, Al, and Si in a cohort of MCI patients from the VITACOG trial, studied associations of these elements with brain atrophy rate and cognition, their interaction with tHcy and Cys, and effects of B vitamin therapy on these associations.
MATERIALS AND METHODS
Participants
We analyzed stored serum samples from individuals with MCI who fulfilled the Petersen criteria [22] and participated in a randomized controlled trial registered as VITACOG, ISRCTN 94410159 (http://www.controlled-trials.com) [8]. MCI patients had Mini-Mental State Examination (MMSE) scores of > 24/30 and no evidence of dementia. Other patients’ characteristics were collected at baseline and have been previously described, as was the study protocol [8]. Briefly, the study included 77.6±4.8-year-old patients (n = 266, 60.7%female) some of whom (n = 168) had MRI scans at baseline and at 24.3±0.7 months of follow-up. Participants were randomly assigned to the B vitamin treatment and placebo groups. Each participant received a daily oral TrioB Plus® supplement tablet (folic acid, 0.8 mg; vitamin B12 - cyanocobalamin, 0.5 mg; vitamin B6 - pyridoxine·HCl, 20 mg) or a placebo tablet for an average of two years. At baseline, 15.3 to 18.1%participants had history of stroke, transient ischemic attack, or MRI infarct, 4.7 to 12.0%had diabetes, and 7.1 to 7.3%had myocardial infarction (in the B vitamin treatment and placebo group, respectively); 49.4 to 43.4%, 30.6 to 33.7%, and 16.5 to 20.5%participants used cardiovascular disease drugs, aspirin, and B vitamins, respectively, at baseline (see Table 1 in [8]). Blood samples were collected at baseline and at the 2-year follow-up. All participants gave written informed consent. The study was carried out according to the principles of the Declaration of Helsinki and was approved by the Oxfordshire National Health Service research ethics committee (COREC 04/Q1604/100).
Table 1
Baseline determinants of the Ln[brain atrophy rate] –placebo group
| Variable (n = 68–81) | Pearson correlation# (n = 68–81) | Multiple regression* | ||||||||||||
| Model 1 | Model 2 | Model 3 | Model 4 | Model 5 | Model 6 | |||||||||
| β | p | β | p | β | p | β | p | β | p | β | p | β | p | |
| LnFe_1 | 0.28 | 0.011 | 0.26 | 0.025 | 0.29 | 0.010 | 0.24 | 0.038 | 0.41 | 0.009 | ||||
| 0.28 | 0.012† | 0.36‡ | 0.003‡ | |||||||||||
| LnCys_1 | 0.30 | 0.004 | 0.28 | 0.050 | 0.37 | 0.004 | 0.18 | 0.144 | 0.25 | 0.088 | ||||
| 0.29 | 0.042† | 0.29‡ | 0.013‡ | |||||||||||
| LntHcy_1 | 0.41 | 0.000 | 0.19 | 0.208 | 0.33 | 0.013 | 0.27 | 0.052 | 0.37 | 0.003 | 0.22 | 0.161 | ||
| 0.22 | 0.194† | 0.30 | 0.042† | |||||||||||
| LnSi_1 | 0.15 | 0.116 | –0.26 | 0.140 | ||||||||||
| LnAl_1 | –0.05 | 0.352 | –0.01 | 0.942 | ||||||||||
| LnAs_1 | –0.08 | 0.249 | –0.11 | 0.353 | ||||||||||
| LnCu_1 | 0.00 | 0.485 | –0.10 | 0.400 | ||||||||||
| LnBrain_Volume_1 | –0.24 | 0.014 | –0.27 | 0.055 | –0.34 | 0.009 | NS | NS | NS | –0.26 | 0.073 | |||
| 0.050† | ||||||||||||||
| Age | 0.23 | 0.021 | NS | NS | NS | NS | NS | NS | ||||||
| Sex | 0.12 | 0.153 | NS | NS | NS | NS | NS | NS | ||||||
| F = 4.9, | F = 5.5, | F = 4.9, | F = 3.3, | F = 4.3, | F = 3.3, | |||||||||
| p = 0.000, | p = 0.000, | p = 0.001, | p = 0.006, | p = 0.003, | p = 0.002, | |||||||||
| Adjusted | Adjusted | Adjusted | Adjusted | Adjusted | Adjusted | |||||||||
| R2 = 0.26 | R2 = 0.25 | R2 = 0.22; | R2 = 0.15; | R2 = 0.14 | R2 = 0.25 | |||||||||
| 0.14‡ | 0.12‡ | |||||||||||||
*Adjusted for LnBrain_Volume_1, age, and sex. NS, not significant; _1, baseline. †Additionally adjusted for creatinine_1, and taurine_1. #One-sided T-test. ‡Model w/o tHcy.
MRI scans
High-resolution T1-weighted images were ac-quired at baseline and at 2-year follow-up on a 1.5T Sonata MRI system (Siemens Medical Systems) and analyzed as previously described [8, 23].
Cognitive testing
At baseline and at the end of study at 2 years, neuropsychological tests were carried out by trained research nurses and psychologists blind to patient’s clinical dementia rating, as previously described in the trial protocol [8]. The tests are representative of cognitive domains affected in MCI: global cognition (MMSE [24], Telephone Inventory for Cognitive Status modified (TICS-m) [25]); episodic memory (Hopkins Verbal Learning Test-revised (HVLT-R) with delayed recall (HVLT-DR) [26]); selective attention/processing speed (Map Search) [27]; visual tracking/speed (Trail Making A) [28]; attention/executive function (Symbol Digits Modalities Test, SDMT); executive function (Trail Making B, CLOX); and semantic memory (Graded Naming, Category Fluency). The CANTAB Paired Associate Learning (PAL total errors score) and Spatial Recognition Memory (SRM) tests were also used as outcome measures [9]. Higher accuracy scores indicate better performance in all tests except the Trail Making Test A and B, where longer time taken indicates poorer performance, the CLOX test, based on subtraction of 2 scores on the test (as described in [9]), and the PAL total errors where more errors indicate worse performance.
Serum Iron, copper, arsenic, aluminum, and silicon quantification by inductively coupled plasma-mass spectrometry
Serum (100μL) samples were mineralized with a mixture of redistilled nitric acid (70%, 300μL), hydrogen peroxide (25–35%for ultra-trace analysis, 100μL), and hydrochloric acid (30%suprapure, 100μL) for 24 h. Serial dilutions of ICP-MS single Al, As, Cu, Fe, and Si standard solutions were used for calibration. Additionally, for ICP-MS Sc, Rh, Be, and Ge in 1%HNO3≥99.999%trace metals basis were used as internal standards (automatically added during analysis through T-piece). Reagents and standards for mineralization were purchased from the Sigma Aldrich Merck group, Poznań, Poland. Deionized water was obtained from the Milli-Q Direct 8 Water Purification System (Merck Millipore). Standard Reference Material (SRM) 909c was used for serum Fe measurements. Certified reference materials BCR 637 (Institute for Reference Materials and Measurements) and ERM-DA120 (European Reference Materials) were analyzed to validate the calibration for Cu and Al, respectively. Analyses were in agreement with the certified values, with recoveries from 93 to 104%. Analyses were carried out using model 2030 ICP-MS instrument from Shimadzu, Japan. The intra-assay analytical variability, determined with six assays of the same sample in one run, was 1.3%and 6.4%for Cu and Fe, respectively. The inter-assay variability, determined with 20 samples assayed on different days was for 20.1%, 13.1%, 1.7%, 13.2%, and 2.1%for Al, As, Cu, Fe, and Si, respectively. Serum metal and Si test results were available for 95 B vitamin-treated and 101 placebo participants.
Metabolite and other variable assays
Values for serum total homocysteine (tHcy), total cysteine (Cys), creatinine, taurine, folate, vitamins B6 and B12, and other variables were obtained from analyses reported previously [8, 29].
Statistical analysis
Normality of a variable distribution was tested with the Shapiro-Wilk’s statistic. For normally distributed variables, mean±standard deviation (SD) was calculated. For non-normally distributed variables, medians were calculated. An unpaired two-sided t-test was used for comparisons between two groups of variables with normal distribution. A Mann-Whitney rank sum test was used for comparisons between two groups of non-normally distributed variables. Associations between brain atrophy rate or cognitive performance and other variables were examined by bivariate and multiple linear regression. In multiple regression analysis, variables that have been included in each model are indicated by numerical entries in tables (a variable that has not been included in a model does not have an entry in the β and p value columns). Models were adjusted for age, sex, and other variables as described in the legend to each table. Statistical software packages PSPP, version 1.0.1 (www.gnu.org) and Statistica, version 13 (TIBCO Software Inc., Palo Alto, CA, USA, http://statistica.io) were used. Probability values were 2-sided and p value < 0.05 was considered statistically significant.
RESULTS
Serum levels of metals and Si at baseline and end of study
Previous studies showed that supplementation with B vitamins for 2 years slowed the rate of brain atrophy in individuals with MCI and that the effect was associated with the reduction in plasma tHcy levels [8]. To identify other factors, in addition to tHcy, which might affect brain atrophy, we quantified serum metals (Fe, Al, As, Cu), Si, and cysteine (Cys) at baseline, and examined their relationships with brain atrophy rate in these individuals. To examine possible effects of B vitamin therapy on serum Fe, Al, As, Cu, Si, and Cys, we also quantified their levels at the end of study.
We found that levels of serum Fe were significantly decreased both in the placebo (3.7-fold, p = 4.E-26) and B vitamin groups (3.2-fold, p = 2.E-22) at the end of study compared to baseline. Levels of serum Al and As were also were significantly decreased: 2.1–to 3.2-fold for Al, and 3.7–to 8.1-fold for As. In contrast, levels of serum Cu and Si were significantly increased (1.1–and 1.3- fold, respectively; p < 0.000) in the placebo and B vitamin groups (Supplementary Table 1). Similar changes of serum Fe [12] and Cu [11] levels were previously reported in AD patients compared to healthy controls.
However, there was no significant difference in levels of serum Fe, Cu, As, Al, Si, and Cys between B vitamin and placebo groups at the end of study (Supplementary Table 1).
Determinants of serum Fe, Cu, As, Al, and Si at baseline
Associations between serum Fe and other variables at baseline are shown in Supplementary Table 2. In Pearson correlation analysis, serum Fe was significantly positively associated with Si (β=0.59, p = 0.000), Al (β= 0.27, p = 0.000), tHcy (β= 0.19, p = 0.004), creatinine (β= 0.14, p = 0.025), and age (β= 0.15, p = 0.021), and negatively with cystathionine (β= –0.15, p = 0.020), taurine (β= –0.24, p = 0.000), and phenylacetate hydrolase activity of PON1 (PhAcase) (β= –0.32, p = 0.000). In multiple regression analysis, baseline serum Fe was positively associated with serum Si (β= 0.57, p = 0.000), As (β= 0.17, p = 0.003), and negatively with cystathionine (β= –0.20, p = 0.000), taurine (β= –0.18, p = 0.001), and PhAcase (β= –0.21, p = 0.000); the adjusted R2 was 0.46 (Supplementary Table 2). Although serum Fe was associated with Al, tHcy, and creatinine in the bivariate analysis, there was no association between Fe and Al, tHcy, or creatinine in the multiple regression analysis.
In Pearson correlation analysis, baseline serum Si was significantly positively associated with serum Fe (β= 0.59, p = 0.000), Al (β= 0.33, p = 0.000), Cu (β= 0.13, p = 0.040), and tHcy (β= 0.24, p = 0.000), and negatively with As (β= –0.28, p = 0.000) and PhAcase (β= –0.20, p = 0.003). In multiple regression analysis, baseline serum Si was positively associated with baseline serum Fe (β= 0.56, p = 0.000), Cu (β= 0.14, p = 0.010), Al (β= 0.15, p =0.006), and cystathionine (β= 0.15, p = 0.007), and negatively with As (β= –0.27, p = 0.000); the adjusted R2 was 0.46 (Supplementary Table 2). Although serum Si was associated with tHcy and PhAcase in the bivariate analysis, there was no association between Si and tHcy or PhAcase in the multiple regression analysis.
Baseline serum Cu was significantly positively associated with baseline serum Si, taurine, and sex (higher Cu in men) both in Pearson correlation and multiple regression analysis; the adjusted R2 was 0.21 (Supplementary Table 2).
Baseline serum Al was positively associated with baseline serum Si and negatively with PhAcase, both in Pearson correlation and multiple regression analysis; the adjusted R2 was 0.11. Although Al was positively associated with serum Fe in the bivariate analysis, there was no association between Al and Fe in the multiple regression analysis (Supplementary Table 2).
In multiple regression analysis, baseline serum As was positively associated with baseline serum Fe (β= 0.28, p = 0.003) and Cys (β= 0.18, p = 0.009), negatively with Si (β= –0.43, p = 0.000), and there was a tendency for a positive association with cystathionine (β= 0.12, p = 0.089); the adjusted R2 was 0.14 (Supplementary Table 2). In Pearson correlation analysis, As was positively associated with cystationine and Cys, negatively with Si, but not with Fe.
Brain atrophy rate is associated with baseline serum Fe and Cys
In Pearson correlation analysis for the placebo group, we found that baseline serum Fe_1 (Fig. 1A) and Cys_1 (Fig. 1B) were positively associated with the rate of brain atrophy. These associations are reminiscent of the relationship between baseline tHcy and brain atrophy rate, which was previously identified in the same cohort [8] and is shown for comparison in Fig. 1C. In contrast, we found no correlations between brain atrophy rate and baseline serum Cu, As, or Al (not shown).
Fig. 1
Relationships between brain atrophy rate over two years and baseline concentrations of serum iron (Fe_1: A, D), cysteine (Cys_1: B, E), and homocysteine (tHcy_1: C, F) in MCI individuals. A, B, C) Placebo group; D, E, F) B vitamin group.
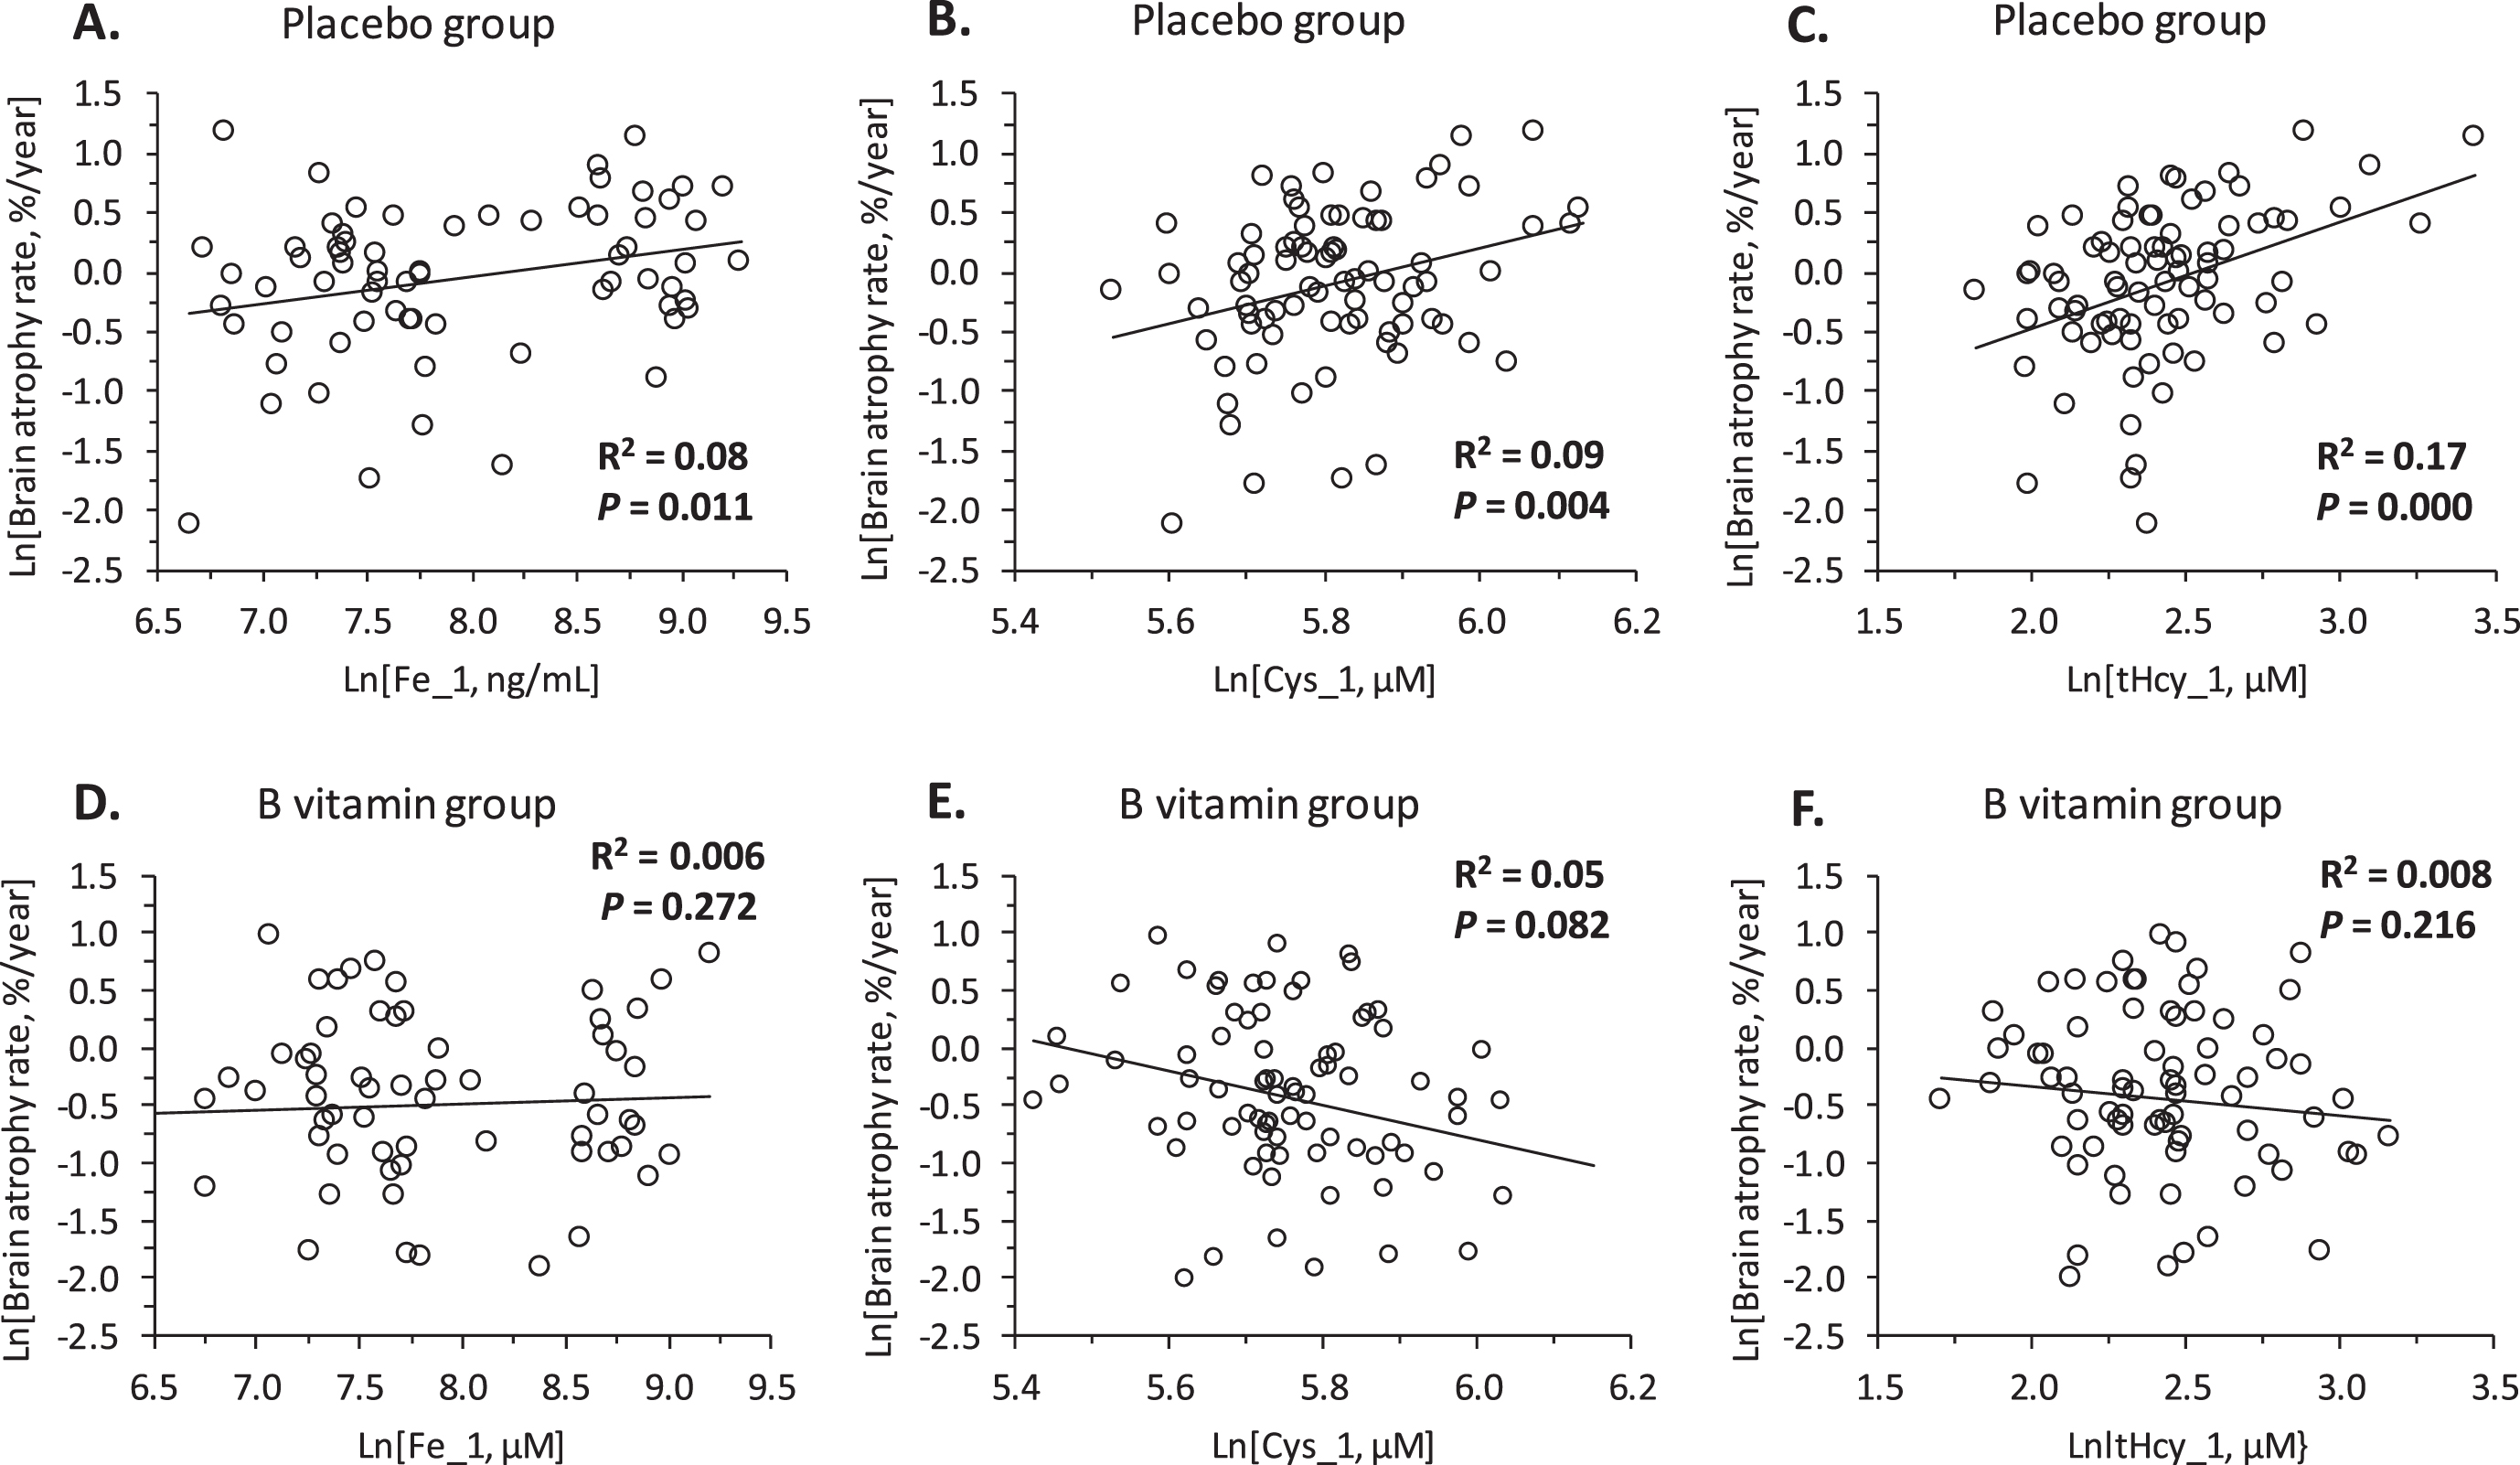
In multiple regression analysis for the placebo group, brain atrophy rate was significantly associated with serum Fe_1 and Cys_1 (Table 1: Model 1 and 2). Notably, brain atrophy rate was not associated with tHcy (Model 1). However, brain atrophy rate was associated with tHcy_1 in models without Cys_1 (Model 3 and 5) (Table 1).
Baseline serum Cys_1 was a significant predictor of brain atrophy rate in models with (Model 1) or without tHcy_1 (Model 2 and Model 4) as well as in a model without Fe_1 (Model 4). In contrast, baseline tHcy_1 was a significant predictor of brain atrophy rate only in models without Cys_1 (Model 3 and 5) (Table 1). However, predictive values of models without Cys_1 (Model 3, R2 = 0.22; Model 5, R2 = 0.14) were lower than the predictive value of a model with Cys_1 (Model 1: R2 = 0.26). In contrast, R2 = 0.25 for a model without tHcy (Model 2) was similar to R2 = 0.26 for a model with tHcy (Model 1).
In models without baseline Fe_1, brain atrophy rate was significantly associated with Cys_1 (Model 4) or with tHcy_1 (Model 5) (Table 1). However, the adjusted R2 values for Model 4 (R2 = 0.12–0.15) and Model 5 (R2 = 0.14) were lower than for Model 1 (R2 = 0.26), suggesting that Fe accounts for a significant proportion (11–13%) of the variation in brain atrophy rate.
Other baseline metals (Al_1, As_1, Cu_1) and Si_1 were not associated with the rate of brain atrophy in the placebo group and did not affect the association between brain atrophy rate and baseline Fe_1 (Model 6, Fe_1: β= 0.41, p = 0.009; adjusted R2 = 0.25).
Taken together, these findings identify baseline serum Fe_1 as a major determinant of the brain atrophy rate.
B vitamin treatment abrogates associations of brain atrophy rate with Fe and Cys
Bivariate associations of brain atrophy rate with baseline Fe_1 and Cys_1, observed in the placebo group (Fig. 1A, B), were absent in the B vitamin group (Fig. 1D, E). The nullifying effects of B vitamin treatment on the associations between brain atrophy rate and baseline Fe_1 and Cys-1 are reminiscent of a similar effect of B vitamins on the association between baseline tHcy_1 and brain atrophy rate previously reported in the same cohort [8], shown in Fig. 1C, F for comparison.
In multiple regression analysis, associations of the brain atrophy rate with Fe_1 and/or Cys_1 (Model 1, 2, 3, 4, 6), and with tHcy_1 in models w/o Cys_1 (Models 3, 5) observed in the placebo group (Table 1) were absent in the B vitamin group (not shown).
Baseline Fe, Al, Cu, and Si are associated with baseline neuropsychological measures of cognition
Previous studies showed that supplementation with B vitamins for two years improved executive function (CLOX_2) in individuals with MCI and that the effect was associated with the reduction in plasma tHcy levels. B vitamin treatment also improved global cognition (MMSE_2), episodic memory (HVLT-DR_2), and semantic memory (Category_Fluency_2) in participants with elevated tHcy [9]. To identify other factors, in addition to tHcy, which might affect brain function, and assess their predictive values, we examined relationships between baseline serum metals (Fe, Al, As, Cu), Si and Cys, and cognitive performance assessed by neuropsychological testing at baseline and 2 years later at the end of study. Effects of a 2-year B vitamin therapy on these relationships were also examined.
In Pearson correlation analysis, baseline Fe_1 was significantly negatively associated with baseline neuropsychological measures in three domains of cognition: semantic memory (Category_Fluency_1, Fig. 2A; Graded_Naming_1), verbal episodic memory (HVLT-TR_1), and attention/processing speed (Map_Search_1) (Supplementary Table 3). Baseline Si_1 was significantly associated with baseline neuropsychological measures in five domains of cognition: semantic memory (Category_Fluency_1, Fig. 2B; Graded_Naming_1); verbal episodic memory (HVLT-TR_1), attention/processing speed (Trail_Making_A_1, Trail_Making_B_1, Map_Search_1, LnSDMT_1), executive function (CLOX_1), and global cognition (MMSE_1) (Supplementary Table 3). Baseline Cu_1 was significantly positively associated with verbal episodic memory (HVLT-DR_1, Figure 2D; HVLT-TR_1) while baseline Al_1 was significantly negatively associated with attention/processing speed (Trail_Making_A_1, Fig. 2E) and there was a tendency for negative association with executive function (CLOX_1) (Supplementary Table 3).
Fig. 2
Pearson correlations between baseline sematic memory (Category_Fluency_1), episodic memory (HVLT-DR_1), attention/processing speed (SDMT 1, Trail Making A) and baseline metals, silicon, tHcy, Cys. Higher scores indicate better performance in all tests except Trail_Making_A, where longer time taken indicates poorer performance.
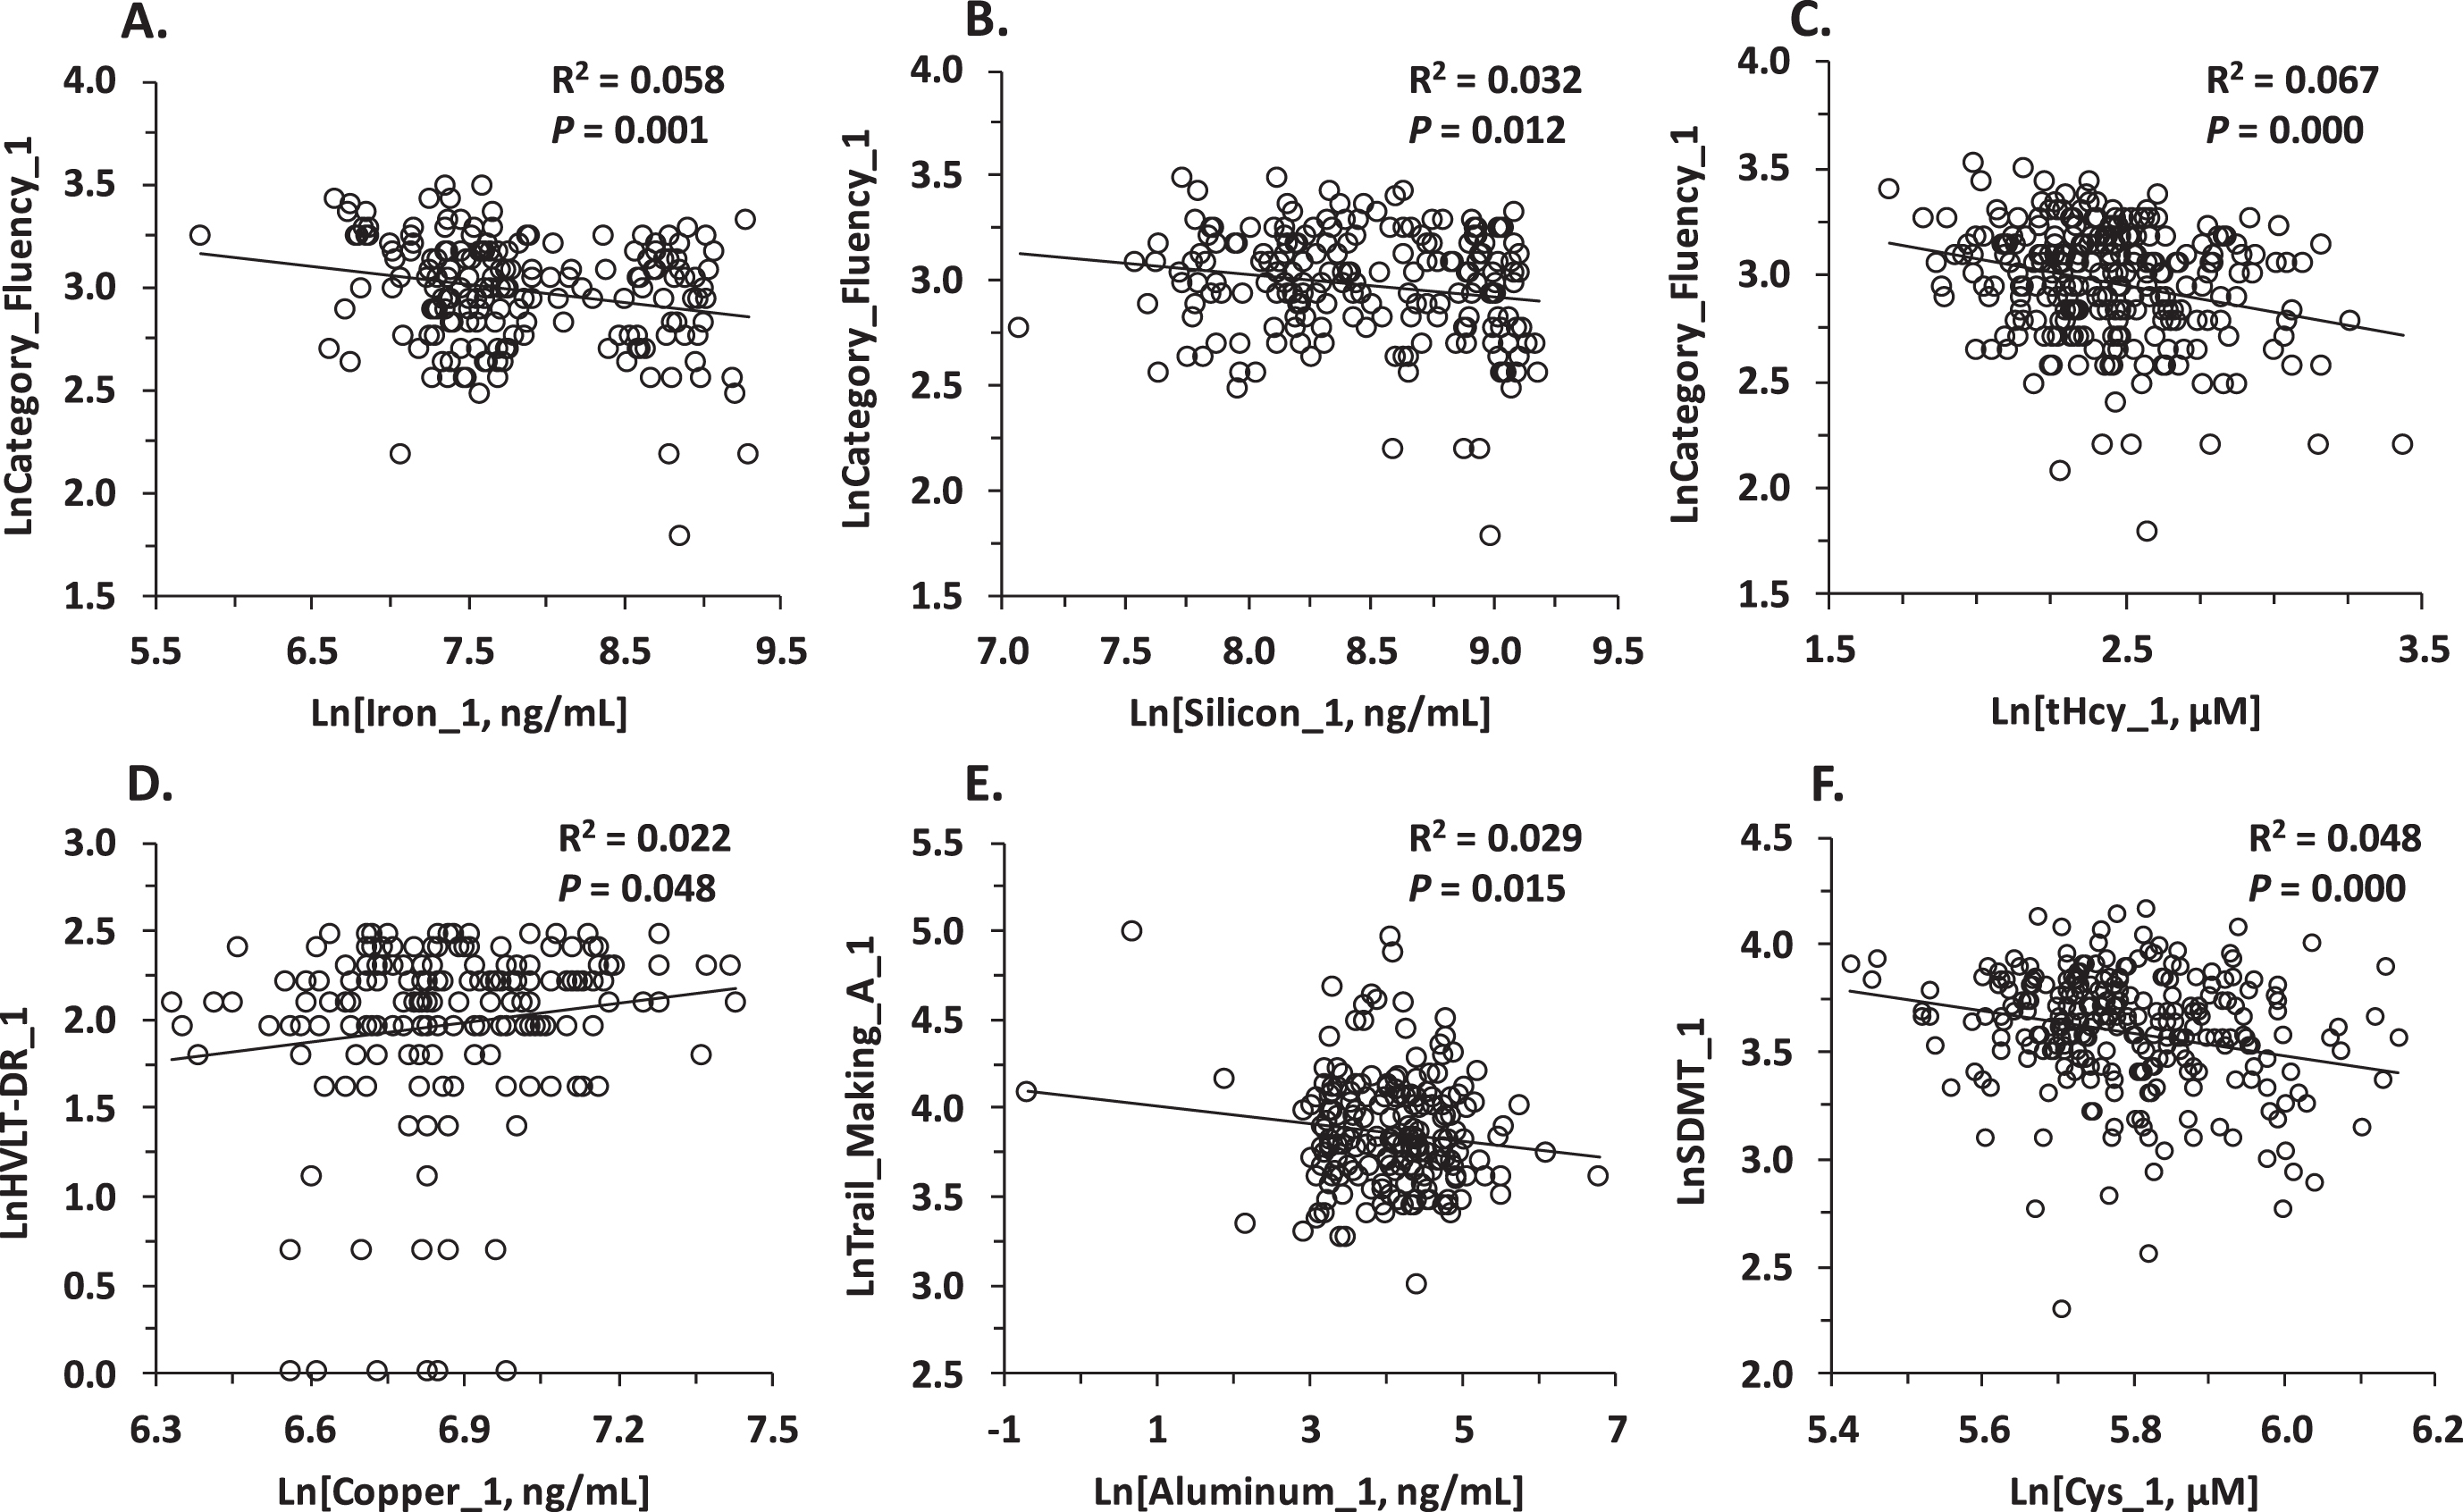
We also found that cognition was significantly associated with several other variables in Pearson analysis. Specifically, attention/processing speed was negatively associated with Cys_1 (SDMT_1, Fig. 2F) and tHcy_1 (Map_Search_1, SDMT_1) (Supplementary Table 3) while tHcy_1 was negatively associated also with semantic memory (Category_Fluency_1, Fig. 2C), verbal episodic memory (HVLT-TR_1, HVLT-DR_1), and executive function (CLOX_1) (Supplementary Table 3). Brain_Volume_1 was associated with better performance in all neuropsychological tests, except the CLOX test, which was not affected by brain volume; age—with poorer performance in all tests; and sex—with semantic memory (Category_Fluency_1, Graded_Naming_1) and verbal episodic memory (HVLT-TR_1; HVLT-DR_1), both better in men (Supplementary Table 3).
In multiple regression analysis, controlling for age, sex, and Brain_Volume_1, baseline Fe_1 remained significantly negatively associated with baseline neuropsychological measures in three domains of cognition: semantic memory (Category_Fluency_1), verbal episodic memory (HVLT-TR_1), and attention/processing speed (Map_Search_1) (Supplementary Table 4). Other baseline metals and Si_1 were either positively or negatively associated with different domains of cognition. Baseline Si_1 was significantly associated with baseline neuropsychological measures in four domains of cognition: verbal episodic memory (HVLT-TR_1), attention/processing speed (Trail_Making_A_1, Map_Search_1, SDMT_1), and executive function (CLOX_1), with higher Si_1 associated with worse cognition. Baseline Al_1 was significantly associated with baseline semantic memory (Category_Fluency_1), verbal episodic memory (HVLT-TR_1), and attention/processing speed (Trail_Making_A_1, SDMT_1), with higher Al_1 associated with better cognition. Baseline Cu_1 was positively associated with baseline verbal episodic memory (HVLT-DR_1) (Supplementary Table 4).
In contrast to baseline metals and Si_1, baseline tHcy_1 only retained association with executive function (CLOX_1) after controlling for age, sex, and Brain_Volume_1, while Cys_1 was not associated with any of the measures of cognition at baseline. Brain_Volume_1, age, and sex contributed to the variance of some but not all measures of cognition (Supplementary Table 4).
Baseline Fe, Al, and Cys predict cognition at the end of study –Pearson correlation
The placebo group
In Pearson correlation analysis for the placebo group, baseline Fe_1 was significantly associated with worse cognitive performance assessed by neuropsychological measures in three domains of cognition at the end of study: semantic memory (Graded_Naming_2), verbal episodic memory (HVLT-DR_2), and visuospatial episodic memory (Pal_Totter_2) (Table 2). In addition, Fe_1 showed a trend for a negative association with verbal episodic memory, HVLT-TR_2. These associations are reminiscent of the relationship between baseline tHcy (tHcy_1) and semantic (Category_Fluency_2) as well as episodic memory (HVLT-DR_2) at the end of study, where elevated tHcy was associated with worse cognition as was previously identified in the same cohort and is shown for comparison in Table 2.
Table 2
Association of cognition at the end of study with serum iron, tHcy, and Cys at baseline –Pearson correlation*
| Baseline variable (n = 92–97) | Semantic memory | Visuospatial episodic memory | Verbal episodic memory | Attention/processing speed | ||||||||||
| LnGraded_Naming_2 | LnPal_Totter_2 | LnHVLT-TR_2 | LnHVLT-DR_2 | LnSDMT_2 | LnMap_Search_2 | LnTrail_Making_A_2 | ||||||||
| β | p | β | p | β | p | β | p | β | p | β | p | β | p | |
| Placebo group | ||||||||||||||
| LnFe_1 | –0.17 | 0.049 | 0.18 | 0.041 | –0.15 | 0.072 | –0.18 | 0.045 | ||||||
| LnAl_1 | –0.19 | 0.037 | 0.18 | 0.044 | 0.21 | 0.026 | –0.20 | 0.027 | ||||||
| LnHcy_1 | –0.33 | 0.000 | 0.10 | 0.156 | –0.36 | 0.000 | –0.37 | 0.000 | –0.31 | 0.000 | –0.39 | 0.000 | 0.38 | 0.000 |
| LnCys_1 | –0.22 | 0.009 | 0.19 | 0.027 | –0.23 | 0.009 | –0.14 | 0.081 | 0.21 | 0.012 | ||||
| B vitamin group | ||||||||||||||
| LnFe_1 | 0.07 | 0.241 | 0.06 | 0.280 | –0.07 | 0.251 | –0.06 | 0.298 | ||||||
| LnAl_1 | –0.06 | 0.282 | 0.02 | 0.426 | –0.01 | 0.457 | 0.03 | 0.395 | ||||||
| LnHcy_1 | 0.09 | 0.189 | –0.04 | 0.333 | 0.03 | 0.366 | 0.07 | 0.236 | –0.21 | 0.013 | 0.07 | 0.246 | 0.01 | 0.459 |
| LnCys_1 | 0.09 | 0.189 | –0.23 | 0.008 | 0.00 | 0.489 | –0.02 | 0.415 | –0.02 | 0.431 | ||||
*Ln, natural logarithm; _1, baseline; _2, end of study; one-sided T-test. Empty β and P cells indicate no correlation. Note: higher Pal_Totter_2 and Trail_Making_A_2 scores indicate worse cognitive performance.
The bivariate correlation analysis also showed that baseline Al_1 was negatively associated with verbal episodic memory (HVLT-DR_2) but positively with attention/processing speed (SDMT_2, Map_Search_2, and Trail_Making_A_2), suggesting that Al has cognition domain-dependent effects. Baseline Cys_1 was negatively associated with attention/processing speed (SDMT_2 and Trail_Making_A_2), semantic memory (Graded_Naming_2) and visuospatial episodic memory (Pal_Totter_2), suggesting worse cognition with higher Cys_1 (Table 2). Higher baseline tHcy_1 was also associated with worse cognition in the attention/processing speed domain at the end of study. In contrast, there were no associations between baseline Cu, Si, or As, and any of these neuropsychological measures of cognition at the end of study (not shown).
The B vitamin group
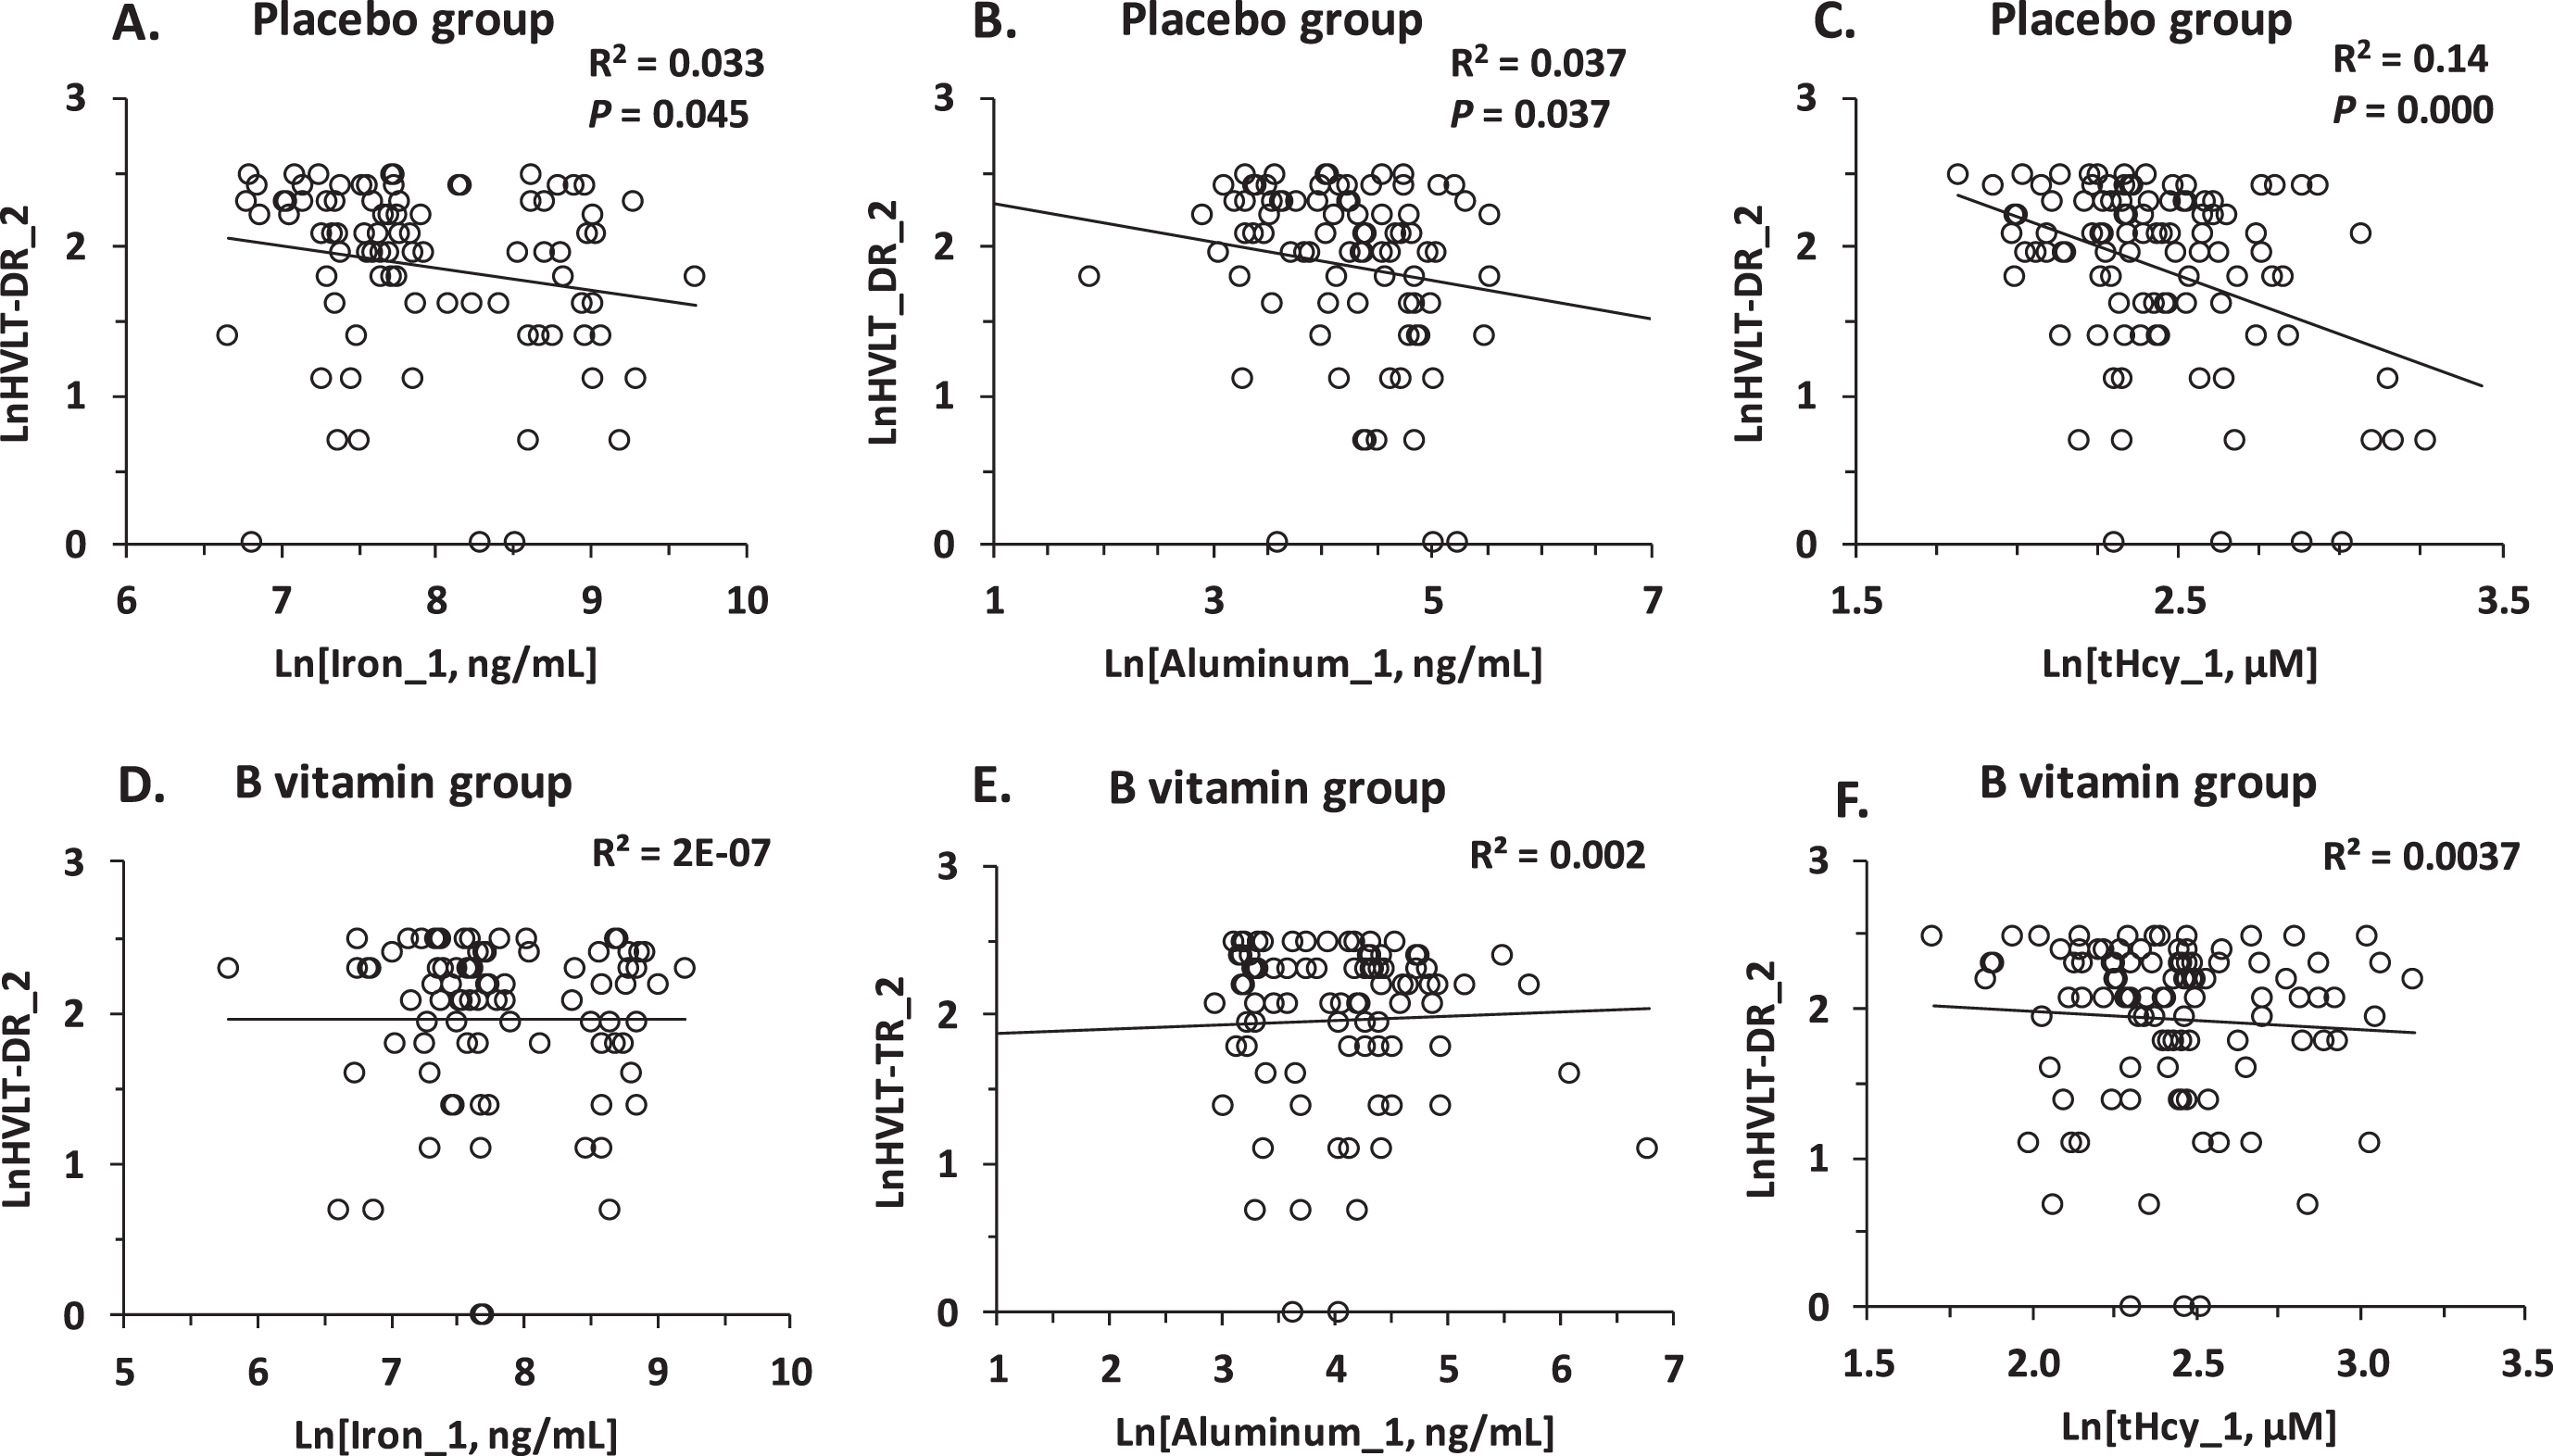
The bivariate associations between Fe_1 or Al_1 and neuropsychological measures of cognition observed in the placebo group (Fig. 3A, B) were absent in the B vitamin group (Fig. 3D, E, Table 2). The nullifying effect of B vitamin treatment on the association of Fe_1 or Al_1 with cognition is reminiscent of a similar effect of B vitamins on the tHcy-cognition relationships in the same cohort [9], shown in Fig. 3C and 3F and Table 2 for comparison.
Fig. 3
Pearson correlations between verbal episodic memory at the end of study (HVLT-DR_2) and baseline concentrations of serum iron (Fe_1) (A, D), aluminum (Al_1) (B, E), and tHcy (C, F) in MCI individuals. A, B, C) Placebo group; D, E, F) B vitamin group.
Baseline Fe, Cu, Al, and Si predict cognition in the placebo group at the end of study: multiple regression analysis
Multiple regression analysis for the placebo group in models including baseline serum Fe, Si, Al, As, Cu, Cys, tHcy, neuropsychological test score, and brain atrophy rate, controlling for age, sex, LnCreatinine_1, and LnTaurine_1, revealed that five of these baseline variables (Fe_1, Si_1, Al_1, Cu_1, and tHcy_1) predicted cognition in one or more domains at the end of study at 2 years: Fe_1 and tHcy_1 predicted global cognition (MMSE_2), semantic memory (Category_Fluency_2, Graded_Naming_2), and attention/speed (Trail_Making_ A_2); Si_1 predicted attention/processing speed in each of the three tests (Map_Search_2, Trail_Making_A_2, Trail_Making_B_2) while Cu_1 predicted attention/processing speed in the Map_Search_2 test); Al_1 predicted global cognition (MMSE_2).
Global cognition: MMSE_2
Pearson correlation analysis for the placebo group showed that global cognition at the end of study (MMSE_2 score) was associated with the brain atrophy rate, age, baseline serum tHcy_1, Cys_1, and Brain_Volume_1 (Table 3).
Table 3
Determinants of global cognition at the end of study: LnMMSE_2, placebo group*
| Variable (n = 82–112) | Pearson correlation | Multiple regression# | ||||||||||||
| Model 1 | Model 2 | Model 3 | Model 4 | Model 5 | Model 6 | |||||||||
| β | p | β | p | β | p | β | p | β | p | β | p | β | p | |
| LntHcy-_1 | –0.28 | 0.003 | –0.38 | 0.011 | –0.33 | 0.031 | –0.31 | 0.038 | –0.29 | 0.050 | –0.41 | 0.010 | ||
| LnCys_1 | –0.19 | 0.048 | ||||||||||||
| LnFe_1 | 0.05 | 0.650 | 0.25 | 0.035 | 0.19 | 0.109 | 0.17 | 0.130 | 0.24 | 0.051 | 0.32 | 0.008 | ||
| LnAl_1 | 0.08 | 0.425 | –0.20 | 0.050 | –0.13 | 0.192 | –0.13 | 0.201 | –0.17 | 0.103 | –0.19 | 0.078 | ||
| LnTG_1 | 0.09 | 0.370 | –0.21 | 0.031 | –0.19 | 0.057 | –0.07 | 0.512 | –0.19 | 0.059 | –0.20 | 0.052 | ||
| LnPhAcase_1 | –0.11 | 0.286 | –0.27 | 0.008 | –0.33 | 0.002 | –0.29 | 0.008 | –0.26 | 0.012 | –0.27 | 0.011 | ||
| LnBrain Volume_1 | 0.39 | 0.000 | 0.33 | 0.007 | 0.41 | 0.001 | 0.36 | 0.006 | 0.32 | 0.010 | 0.32 | 0.012 | 0.27 | 0.032 |
| Atrophy rate | –0.36 | 0.006 | –0.25 | 0.027 | –0.18 | 0.096 | –0.33 | 0.004 | –0.23 | 0.044 | –0.27 | 0.018 | –0.22 | 0.061 |
| LnMMSE_1 | 0.34 | 0.000 | 0.25 | 0.009 | 0.25 | 0.012 | 0.23 | 0.022 | 0.25 | 0.010 | 0.25 | 0.011 | 0.30 | 0.003 |
| Age | –0.28 | 0.003 | NS | NS | NS | NS | NS | NS | ||||||
| F = 6.3, | F = 6.0, | F = 5.6, | F = 6.2, | F = 6.0, | F = 5.5, | |||||||||
| p = 0.000, | p = 0.000, | p = 0.000, | p = 0.000, | p = 0.000, | p = 0.000, | |||||||||
| Adjusted | Adjusted | Adjusted | Adjusted | Adjusted | Adjusted | |||||||||
| R2 = 0.50 | R2 = 0.47 | R2 = 0.45 | R2 = 0.47 | R2 = 0.46 | R2 = 0.44 | |||||||||
*Ln, natural logarithm; PhAcase, phenylacetate hydrolase; TG, triglyceride; _1, baseline; _2, end of study; NS, not significant. #Adjusted for age, sex, LnCreatinine_1, and LnTaurine_1.
In multiple regression analysis for the placebo group, global cognition at the end of study (MMSE_2) was determined by baseline Fe_1, Al_1, and tHcy_1 as well as brain atrophy rate and baseline MMSE_1 score; adjusted R2 was 0.50 (Model 1, Table 3). PhAcase_1 and triglycerides (TG_1), identified in the previous study as contributing to the variance [29], were also included in the analyses (Table 3). Cys_1 and age, significantly associated with MMSE_2 in bivariate analysis, was not significant in multiple regression analysis.
The positive association of MMSE_2 with Fe_1 was significant in models without TG_1 (Model 5) and PhAcase_1 (Model 6), indicating that the effect of Fe_1 on MMSE_2 was independent of TG_1 and PhAcase_1. In contrast, the association of MMSE_2 with Fe_1 was not significant in models without tHcy_1 (Model 3) and Al_1 (Model 4), indicating that the effect of baseline Fe_1 on MMSE_2 at the end of study was dependent on tHcy_1 and Al_1 and that there was an interaction between Fe_1, Al_1, tHcy_1, which modified their effects on MMSE_2.
Models without Fe_1 (Model 2; adjusted R2 =0.47), tHcy_1 (Model 3, R2 = 0.46), Al_1 (Model 4; R2 = 0.47), TG_1 (Model 5, R2 = 0.47), or PhAcase_1 (Model 6, R2 = 0.44), all had lower R2 values compared to Model 1 (R2 = 0.51), suggesting that each of these variables independently contributed to the predictive value of Model 1 (Table 3). Because higher score in the MMSE test indicates better global cognitive performance, these findings suggest that Fe has a beneficial effect on global cognition while Al, tHcy, TG, and PhAcase are detrimental.
Semantic memory: Category Fluency_2
In Pearson correlation analysis for the placebo group, semantic memory at the end of study (Category_Fluency_2) was significantly associated with baseline tHcy_1, creatinine_1, Category_Fluency_1, Brain_Volume_1, brain atrophy rate, age, and sex (better semantic memory in women) (Table 4).
Table 4
Determinants of semantic memory at the end of study: LnCategory_Fluency_2, placebo group*
| Variable (n = 82–112) | Pearson correlation | Multiple regression# | ||||||||
| Model 1 | Model 2 | Model 3 | Model 4 | |||||||
| β | p | β | p | β | p | β | p | β | p | |
| LntHcy_1 | –0.47 | 0.000 | –0.35 | 0.004 | –0.22 | 0.046 | ||||
| LnFe_1 | –0.08 | 0.448 | 0.27 | 0.003 | 0.25 | 0.007 | ||||
| LnCreatinine_1 | –0.30 | 0.001 | NS | NS | NS | NS | ||||
| LnBrain_Volume_1 | 0.38 | 0.000 | NS | NS | NS | NS | ||||
| Atrophy rate | –0.36 | 0.006 | –0.19 | 0.058 | –0.13 | 0.194 | –0.28 | 0.005 | –0.21 | 0.038 |
| LnCategory_Fluency_1 | 0.70 | 0.000 | 0.57 | 0.000 | 0.52 | 0.000 | 0.54 | 0.000 | 0.54 | 0.000 |
| Age | –0.37 | 0.000 | NS | NS | NS | NS | ||||
| Sex | 0.19 | 0.043 | NS | NS | NS | NS | ||||
| F = 11.8, | F = 11.5, | F = 12.4, | F = 12.0, | |||||||
| p = 0.000, | p = 0.000, | p = 0.000, | p = 0.000, | |||||||
| Adjusted | Adjusted | Adjusted | Adjusted | |||||||
| R2 = 0.60 | R2 = 0.53 | R2 = 0.56 | R2 = 0.51 | |||||||
*Ln, natural logarithm; _1, baseline; _2, end of study; NS, not significant. #Adjusted for age, sex, LnCreatinine_1, and LnTaurine_1.
In multiple regression analysis, baseline Fe_1 and baseline Category_Fluency_1 were significant predictors of better semantic memory at the end of study (Category_Fluency_2), while tHcy_1 predicted worse performance (Model 1, Table 4; adjusted R2 was 0.59). The positive association of Category_Fluency_2 with baseline Fe_1 was significant in a model without tHcy_1 (Model 3), which indicates that the effect of baseline Fe_1 on Category_Fluency_2 at the end of study was independent from baseline tHcy_1. As higher score in the Category Fluency test indicates better semantic memory, these findings suggest that Fe is beneficial while elevated tHcy impairs semantic memory.
Semantic memory: Graded Naming_2
In Pearson analysis for the placebo group, semantic memory at the end of study (Graded_Naming_2) was associated with baseline tHcy_1, creatinine_1, brain_volume_1 (β= 0.29, P = 0.009), brain atrophy rate, age, and baseline Graded_Naming_1 (Table 5).
Table 5
Determinants of semantic memory at the end of study: LnGraded_Naming_2, placebo group*
| Variable (n = 82–112) | Pearson correlation | Multiple regression# | ||||||||
| Model 1 | Model 2 | Model 3 | Model 4 | |||||||
| β | p | β | p | β | p | β | p | β | p | |
| LntHcy_1 | –0.33 | 0.000 | –0.14 | 0.037 | –0.09 | 0.108 | ||||
| –0.13$ | 0.47$ | |||||||||
| LnFe_1 | –0.17 | 0.102 | 0.10 | 0.035 | 0.10 | 0.052 | ||||
| 0.09$ | 0.59$ | |||||||||
| LnCreatinine_1 | –0.23 | 0.016 | NS | NS | NS | NS | ||||
| LnBrain_Volume_1 | 0.29 | 0.009 | ||||||||
| Atrophy rate | –0.30 | 0.008 | NS | NS | –0.11 | 0.023 | NS | |||
| LnGraded_Naming_1 | 0.92 | 0.000 | 0.87 | 0.000 | 0.87 | 0.000 | 0.88 | 0.000 | 0.88 | 0.000 |
| Age | –0.33 | 0.000 | –0.09 | 0.071 | –0.13 | 0.090 | –0.14 | 0.011 | –0.13 | 0.021 |
| F = 64.8, | F = 75.5, | F = 68.7, | F = 85.6, | |||||||
| p = 0.000, | p = 0.000, | p = 0.000, | p = 0.000, | |||||||
| Adjusted | Adjusted | Adjusted | Adjusted | |||||||
| R2 = 0.89 | R2 = 0.88 | R2 = 0.88 | R2 = 0.87 | |||||||
*Ln, natural logarithm; _1, baseline; _2, end of study; NS, not significant. #Adjusted for LnCreatinine_1, LnTaurine_1, age, and sex. $Model with LnBrain_Volume_1.
Variables that significantly determined semantic memory at the end of study (Graded_Naming_2) included baseline Fe_1, tHcy_1, and baseline Graded Naming_1; adjusted R2 was 0.89 (Table 5). The positive association of Graded_Naming_2 with Fe_1 was not significant in a model without baseline tHcy_1 (Model 3). Similarly, the negative association between Graded_Naming_2 and tHcy_1 was not significant in a model without Fe_1 (Model 2). These findings indicate that the effect of baseline Fe_1 on Graded_Naming_2 at the end of study was dependent on baseline tHcy_1 and suggest that there was an interaction between baseline Fe_1 and tHcy_1, which modified their effects on semantic memory. As higher score in the Graded Naming test indicates better semantic memory, these findings suggest that Fe and tHcy have opposite effects on semantic memory: Fe_1 improves sematic memory, while tHcy_1 impairs it.
Attention/speed: Trail Making_A_2
In Pearson correlation analysis for the placebo group, attention/speed at the end of study (Trail_Making_A_2) was associated with baseline tHcy_1, Cys_1, Trail_Making_A_1, brain_volume_1, brain atrophy rate, and age (Table 6).
Table 6
Determinants of attention/speed at the end of study: LnTrail_Making_A_2, placebo group*
| Variable (n = 82–112) | Pearson correlation | Multiple regression# | ||||||||||
| Model 1 | Model 2 | Model 3 | Model 4 | Model 5 | ||||||||
| β | p | β | p | β | p | β | p | β | p | β | p | |
| LnCys_1 | 0.21 | 0.024 | NS | NS | NS | NS | NS | |||||
| LntHcy_1 | 0.38 | 0.000 | 0.25 | 0.051 | 0.24 | 0.039 | 0.25 | 0.042 | 0.27 | 0.033 | 0.26 | 0.043 |
| 0.24$ | 0.083$ | |||||||||||
| LnFe_1∧ | –0.08 | 0.457 | –0.23 | 0.026 | –0.18 | 0.086 | ||||||
| –0.22$ | 0.041$ | |||||||||||
| LnSi_1∧ | –0.02 | 0.852 | –0.18 | 0.077 | –0.21 | 0.043 | ||||||
| LnPhAcase_1 | 0.14 | 0.163 | 0.21 | 0.036 | 0.23 | 0.022 | ||||||
| LnBrain Volume_1 | –0.40 | 0.000 | –0.04$ | 0.771$ | ||||||||
| Atrophy rate | 0.34 | 0.002 | 0.28 | 0.012 | 0.18 | 0.067 | 0.32 | 0.005 | 0.28 | 0.012 | 0.23 | 0.040 |
| LnTrail_Making_A_1 | 0.52 | 0.000 | 0.31 | 0.002 | 0.35 | 0.000 | 0.33 | 0.001 | 0.35 | 0.000 | 0.34 | 0.001 |
| Age | 0.37 | 0.000 | 0.28 | 0.015 | 0.19 | 0.073 | 0.29 | 0.011 | 0.32 | 0.006 | 0.31 | 0.009 |
| F = 9.6, | F = 8.8, | F = 8.9, | F = 9.3, | F = 9.1, | ||||||||
| p = 0.000, | p = 0.000, | p = 0.000, | p = 0.000, | p = 0.000, | ||||||||
| Adjusted | Adjusted | Adjusted | Adjusted | Adjusted | ||||||||
| R2 = 0.44 | R2 = 0.46 | R2 = 0.50 | R2 = 0.48 | R2 = 0.47 | ||||||||
*Ln, natural logarithm; _1, baseline; _2, end of study; NS, not significant. #Adjusted for LnCys_1 and sex. ∧ Fe and Si were not significant when present in models together. $Model with LnBrain Volume_1. Note: Trail_Making_A_2 score indicates worse cognitive performance.
In multiple regression analysis, baseline Fe_1 was a significant predictor of better performance in the Trail_Making_A_2 test (shorter time to accomplish a task) at the end of study in models with (Model 1) and without (Model 2) brain_volume_1, while tHcy_1 was not significant. However, Fe_1 did not predict the Trail_Making_A_2 score at the end of study in a model with baseline PhAcase_1 (Model 3; adjusted R2 was 0.50) or in a model with Si_1 (Table 6).
Baseline PhAcase_1 was a significant predictor of Trail_Making_A_2 only in a model without baseline Fe_1 (Model 4), in which adjusted R2 was reduced from 0.50 to 0.48. Both Fe_1 and PhAcase_1 became not significant in a model without tHcy_1 (Model 5, Table 6; adjusted R2 was 0.47). Brain atrophy rate, Trail_Making_A_1, and age were significant predictors of Trail_Making_A_2.
Although the Trail_Making_2 was significantly associated with baseline tHcy_1, Cys_1, and brain volume_1 in bivariate analyses, these associations were absent in multiple regression analysis in a model with Fe_1 (Model 1, Table 6).
Taken together, these findings suggest interactions between Fe_1, Si_1, Hcy_1, and PhAcase_1, which modify their effects on cognition. As higher score in the Trail Making A test indicates worse cognition, these findings suggest that Fe_1 and PhAcase_1 have opposite effects on the Trail_Making_A_2 score: Fe_1 improves cognition in the attention/speed domain while PhAcase_1 impairs it.
Attention/speed: Trail Making_B_2
In Pearson correlation analysis for the placebo group, attention/speed at the end of study (Trail_Making_B_2 score) was associated with baseline tHcy_1 (β= 0.21, p = 0.033), baseline Trail_Making_B_1 score (β= 0.66, p = 0.000), brain volume (β=–0.37, p = 0.001), and age (β= 0.37, p = 0.000) (Table 7).
Table 7
Determinants of attention/speed at the end of study: LnTrail_Making_B_2, placebo group*
| Variable (n = 82–112) | Pearson correlation | Multiple regression# | ||||||||
| Model 1 | Model 2 | Model 3 | Model 4 | |||||||
| β | p | β | p | β | p | β | p | β | p | |
| LntHcy_1 | 0.21 | 0.033 | 0.08 | 0.389 | 0.11 | 0.277 | 0.11 | 0.256 | 0.08 | 0.439 |
| LnFe_1∧ | –0.10 | 0.342 | –0.21 | 0.016 | –0.13 | 0.225 | –0.08 | 0.459 | ||
| –0.11$ | 0.246$ | |||||||||
| LnSi_1∧ | –0.04 | 0.727 | –0.23 | 0.014 | –0.15 | 0.181 | –0.09 | 0.399 | ||
| –0.18$ | 0.082$ | |||||||||
| LnAl_1 | –0.03 | 0.759 | 0.18 | 0.039 | 0.19 | 0.036 | 0.21 | 0.022 | ||
| 0.19$ | 0.049$ | 0.23$ | 0.023$ | |||||||
| LnBrain Volume_1 | –0.37 | 0.001 | –0.17$ | 0.110$ | –0.16$ | 0.137$ | ||||
| LnAtrophy_rate | 0.11 | 0.327 | ||||||||
| Trail_Making_B_1 | 0.66 | 0.000 | 0.66 | 0.000 | 0.67 | 0.000 | 0.67 | 0.000 | 0.62 | 0.000 |
| Age | 0.30 | 0.002 | NS | NS | NS | NS | ||||
| F = 12.0, | F = 10.4, | F = 10.8, | F = 12.8, | |||||||
| p = 0.000, | p = 0.000, | p = 0.000, | p = 0.000, | |||||||
| Adjusted | Adjusted | Adjusted | Adjusted | |||||||
| R2 = 0.46, | R2 = 0.46, | R2 = 0.46 | R2 = 0.44 | |||||||
| 0.55$ | 0.56$ | |||||||||
*Ln, natural logarithm; _1, baseline; _2, end of study: NS, not significant. #Adjusted for LntHcy_1, LnCys_1, age, and sex. $Models with LnBrain_Volume_1. ∧ Not significant in models w/o Al. Note: Trail_Making_B_2 score indicates worse cognitive performance.
In multiple regression analysis, better Trail_Making_B_2 score (shorter time to accomplish a task) at the end of study was significantly predicted by baseline Fe_1 (Model 1), Si_1 (Model 2), Al_1 (Models 1 –3), and Trail_Making_B_1 (Models 1 –4) but not by tHcy_1 (Models 1 –4) (Table 7). Fe_1 and Si_1 were significant when included separately in models with Al_1 (Model 1 and Model 2, respectively). However, Fe_1 and Si_1 became not significant when both were included together in a model with Al_1 (Model 3) or separately in a model without Al_1. These findings suggest that interactions between Fe_1, Si_1, and Al_1 modify their effects of cognition in the attention/processing speed domain. As higher score (longer time to accomplish a task) in the Trail Making B test indicates worse cognition, these findings suggest that Fe_1, Si_1, and Al_1 have opposite effects on Trail_Making_B_2 score: Fe and Si improve cognition in the attention/speed domain while Al_1 impairs it.
Complex attention/processing speed: Map Search_2
In Pearson analysis for the placebo group, complex attention/processing speed at the end of study (Map_Search_2) was associated with age, brain atrophy rate, baseline tHcy_1, brain_volume_1, and Map_Search_1 (Table 8).
Table 8
Determinants of attention/speed at the end of study: LnMap_Search_2, placebo group*
| Variable (n = 82–112) | Pearson correlation | Multiple regression# | ||||||||
| Model 1 | Model 2 | Model 3 | Model 4 | |||||||
| β | p | β | p | β | p | β | p | β | p | |
| LntHcy_1 | –0.39 | 0.000 | NS | NS | NS | NS | ||||
| LnSi_1 | –0.02 | 0.858 | 0.27 | 0.010 | 0.25 | 0.021 | ||||
| 0.25$ | 0.022$ | 0.22$ | 0.048$ | |||||||
| LnCu_1 | –0.10 | 0.347 | –0.25 | 0.033 | –0.22 | 0.072 | ||||
| –0.22$ | 0.061$ | |||||||||
| LnBrain Volume_1 | 0.40 | 0.000 | 0.09$ | 0.490$ | 0.16$ | 0.231$ | ||||
| LnAtrophy_rate | –0.30 | 0.011 | –0.15 | 0.194 | –0.13 | 0.255 | –0.12 | 0.300 | –0.14 | 0.159 |
| LnMap_Search_1 | 0.65 | 0.000 | 0.42 | 0.000 | 0.41 | 0.001 | 0.40 | 0.001 | 0.41 | 0.000 |
| Age | –0.36 | 0.000 | –0.25 | 0.048 | –0.21 | 0.137 | –0.24 | 0.065 | –0.27 | 0.011 |
| F = 7.16, | F = 6.42, | F = 6.95, | F = 9.96, | |||||||
| p = 0.000, | p = 0.000, | p = 0.000, | p = 0.000, | |||||||
| Adjusted | Adjusted | Adjusted | Adjusted | |||||||
| R2 = 0.48 | R2 = 0.42 | R2 = 0.44 | R2 = 0.46 | |||||||
*Ln, natural logarithm; _1, baseline; _2, end of study; NS, not significant. #Adjusted for LntHcy_1, LnCys_1, LnTaurine_1, age, and sex. $Adjusted for LnBrain_Volume_1.
In multiple regression analysis, baseline Si_1 and baseline Map_Search_1 predicted better performance in the Map_Search_2 test at the end of study while baseline copper (Cu_1) and age predicted worse performance (Model 1, Table 8; adjusted R2 was 0.48). Si_1 was significant in a model without Cu_1 but adjusted R2 was reduced to 0.44 (Model 3). In contrast, Cu_1 was not a significant predictor of the Map_Search_2 score in a model without Si_1, which also had an R2 value reduced to 0.42 (Model 2), suggesting that an interaction between these two elements determines their effects on cognition. Other baseline metals (Fe_1, Al_1, As_1) did not affect associations of Si_1 and Cu_1 with Map_Search_2.
Although the Map_Search_2 score was significantly associated with baseline tHcy_1 and brain volume in bivariate analyses, these associations were absent in multiple regression analyses. As higher score in the Map Search test indicates better cognition, these findings suggest that baseline Si and Cu have opposite effects: Si improves cognition in the attention/speed domain at the end of study while Cu impairs it.
B vitamin treatment abrogates effects of Fe, Si, Al, and Cu on cognition
As illustrated in Table 2 and Fig. 2 above, Pearson analysis showed that the significant associations of Fe_1 with semantic memory (Graded_Naming_2), verbal episodic memory (HVLT-DR_2), and visuospatial episodic memory (Pal_Totter_2), and of Al_1 with attention/processing speed (SDMT_2, Map_Search_2, and Trail_Making_A_2) observed in the placebo group at the end of study were absent in the B vitamin group.
In multiple regression analysis, the associations of baseline Fe_1, Si_1, Al_1, and tHcy_1 with global cognition (MMSE_2), semantic memory (Category_Fluency_2, Graded Naming_2), and attention/processing speed (Trail_Making_A_2, Trail_Mak-ing_B_2, Map_Search_2) observed in the placebo group at the end of study were absent in the B vitamin group for any model that showed association in the placebo group (shown in Supplementary Table 5 for Model 1 from each cognitive test). The B vitamin treatment also abrogated associations of baseline Si_1 and Cu_1 with complex attention/processing speed (Map_Search_2). However, Si_1, which was not associated with semantic memory (Category_Fluency_2) in the placebo group at the end of study (Table 4), was negatively associated with Category_Fluency_2 in the B vitamin treatment group (Supplementary Table 5). These findings suggest that B vitamin treatment abrogated effects of Fe_1, Al_1, and tHcy_1 on cognition but may not ameliorate some of the effects of Si_1.
Associations between neuropsychological test scores and brain atrophy rate were also abrogated by B vitamin treatment. However, neuropsychological test scores in the B vitamin group at the end of study were still associated with the corresponding scores at baseline (Supplementary Table 5).
DISCUSSION
The present study, using a well-characterized cohort of patients with MCI, provides evidence suggesting that: 1) baseline serum Fe and Cys are independent predictors of brain atrophy rate at 24-month follow-up; 2) effects of baseline tHcy on brain atrophy were modified by Fe and Cys; 3) B vitamin therapy abrogated effects of Fe and Cys on brain atrophy rate; 4) baseline Fe, Cu, Al, Si, and tHcy were associated with cognition at baseline and predicted cognition at 24-month follow-up in the placebo group; 5) interactions between these variables modified their effect on cognition; 6) B vitamin treatment abrogated effects of Fe, Al, Si, Cu, and Hcy on cognition.
Notably, we found that associations between met-als, Si, tHcy and cognition were domain-specific. For example, in multiple regression analysis, base-line Fe_1 was associated with baseline semantic memory (Category_Fluency_1), verbal episodic memory (HVLT-TR_1), and attention/processing speed (Map_Search_1); baseline Si_1 with baseline verbal episodic memory (HVLT-TR_1), attention/processing speed (Trail_Making_A_1, Map_Search_1, SDMT_1), and executive function (CLOX_1); baseline Cu_1 with baseline verbal episodic memory (HVLT-DR_1); baseline Al_1 with all four baseline cognitive domains; in contrast, baseline tHcy was associated only with baseline executive function (CLOX_1) (Supplementary Table 4).
Further, baseline Fe_1 and tHcy_1 predicted global cognition (MMSE_2, Model 1, Table 3) and semantic memory (Category_Fluency_2, Model 1, Table 4; Graded_Naming_2, Model 1, Table 5) at the end of study. Baseline Fe_1, but not tHcy_1, predicted attention/speed (Trail_Making_A_2, Model1, Table 6; Trail_Making_B_2, Model1, Table 7), which was also predicted by Si_1 and Al_1 in the Trail_Making_B_2 test (Model 2, Table 7) and by Si_1 and Cu_1 in the Map_Search_2 test (Model 1, Table 8) at the end of study.
Our finding that baseline serum Fe predicts brain atrophy rate in MCI is consistent with previous extensive evidence suggesting that Fe contributes to dementia and AD (reviewed in [30]). For example, interaction between polymorphisms in the genes for transferrin and hemochromatosis, associated with increased iron load, is a strong risk factor for AD [31]. Furthermore, Fe was found to accumulate in AD brains and co-localize with amyloid plaques. For example, in AD patients, cortical iron levels are elevated compared to age and sex-matched healthy individuals, as measured by various methods in postmortem tissue [32–35]. Furthermore, levels of brain Fe [35] and the Fe-binding protein ferritin [36] are correlated with the extent of amyloid deposition. Similar to the postmortem findings, brain Fe, quantified by MRI in living AD patients, is elevated [37–39] and associated with the extent of Aβ deposition, quantified by PET Aβ imaging [39–41].
Although blood biomarkers of Fe metabolism, such as ferritin and transferrin, have been studied in relation to cognition and AD, the value of serum Fe as a predictor of brain atrophy rate and cognitive decline in MCI patients has not been investigated. In postmenopausal women, levels of ferritin, a blood biomarker of Fe, during midlife are known to be negatively associated with cognitive performance later in life [42]. In another study, levels of plasma transferrin, an Fe-transporting protein, have been reported to be negatively associated with the MMSE score in a control group but not in the MCI or AD group [43]. Although there was no difference in transferrin levels between the three groups, longitudinal analyses showed that higher transferrin levels were associated with faster cognitive decline in patients with MCI or AD, relative to the control group. Our present findings in MCI patients that baseline serum Fe predicted brain atrophy rate and cognition at the end of study 2 years later, suggest that serum Fe levels are linked to the progression of MCI.
In addition to Fe, other elements such as Cu [20], Al, and Si [16] have been studied in relation to cognition and AD but their role has not been fully investigated in MCI. Al has been shown to accumulate in amyloid plaques in AD brains [15] and to modulate amyloidosis through oxidative stress in APP transgenic mice [44]. Si prevents accumulation of Al [17] and thus protects against its neurotoxicity [45]. Cu has been associated with cognitive function in younger [20] and older individuals [19]. Our findings in MCI patients showing that serum Cu, Al, and Si predict cognition in a domain-specific manner, suggest that serum levels of these elements play an important role in the progression of MCI.
We found in multiple regression analyses that baseline Fe and Si were associated with better performance in several domains of cognition at the end of study: Fe_1 with global cognition (MMSE_2), semantic memory (Category_Fluency_2, Graded_Naming_2), attention/speed (Trail_Making_A_2, Trail_Making_B_2); Si with attention/speed (Trail_Making_A_2, Trail_Making_B_2, Map_Search_2). In contrast, baseline Al and Cu were associated with worse performance at the end of study: Al in global cognition (MMSE_2), attention/speed (Trail_Mak-ing_B_2); and Cu in attention/speed (Map_search_2). tHcy was also associated with worse performance in cognitive domains that were positively affected by Fe (global cognition: MMSE_2; semantic memory: Category_Fluency_2, Graded_Naming_2) and negatively by Al (global cognition: MMSE_2).
Notably, we found that baseline Fe, Cu, Al, and Si exhibited disparate effects on brain atrophy rate and cognition. Specifically, baseline Fe was associated with cognition and brain atrophy. In contrast, Cu, Al, and Si were associated with cognition but not with brain atrophy. Further, Fe was positively associated with accelerated brain atrophy both in bivariate and multiple regression analyses. However, baseline Fe was associated with worse cognition in bivariate analyses but with better cognition in multiple regression analyses. These findings show that effects of baseline Cu, Al, and Si on cognition are independent of brain atrophy and suggest that brain atrophy is independent of cognitive impairment. This suggestion is supported by our findings that in multivariate regression models, in which Cu, Al, or Si predicted cognition, brain atrophy did not predict cognition (Model 1 in Tables 7, 8). In contrast, in models in which Fe predicted cognition, brain atrophy also predicted cognition (Model 1 in Tables 3, 4, 6). When Fe was removed from those models, brain atrophy was not a predictor of cognition (Model 2 in Tables 3, 4, 6).
We found that levels of serum Fe, Al, and As significantly decreased while serum Cu and Si significantly increased during a 2-year follow-up in participants with MCI. We believe that these changes in serum elements reflect the conversion from MCI to AD in the participants. This interpretation is supported by earlier findings showing that serum Fe levels were reduced [12] and serum Cu levels were elevated [11] in AD patients compared to healthy controls.
Our present findings underscore the need for identification of factors affecting levels of metals and Si and elucidation of mechanisms involved in their interactions. In multiple regression analysis, we found that levels of serum Fe were determined by Si, As, PhAcase, and two sulfur-containing metabolites, cystathionine and taurine; serum Si was determined by four metals (Fe, Cu, Al, As) and cystathionine; serum Cu was determined by Si, taurine, and sex; serum Al was determined by Si and PhAcase; serum As was determined by Fe, Si, and Cys. Molecular bases for these associations are unclear and remain to be investigated in future studies.
In addition to Fe and Cu, Al is also known to accumulate in senile plaques [15] and a high daily intake of Al is associated with increased risk of dementia [16]. To slow the clinical progression of AD, previous studies have explored interventions targeting Fe [46, 47] or Cu [11] using chelation therapy, Al using Si(OH)4 therapy [17], or tHcy using B vitamin therapy [8, 48, 49]. Our present findings suggest that interventions aimed at enhancing cognition by targeting serum iron, copper, aluminum to restore metal homeostasis, and tHcy at the same time might be an effective strategy to reduce the risk and/or the conversion of MCI to AD.
In conclusion, we showed that baseline serum Fe predicted the rate of brain atrophy and cognition at 2-year follow-up in MCI patients. We also showed that baseline Fe and Si were predictors of better cognitive performance, baseline Al and Cu predicted worse cognition at follow-up, and that effects of baseline Cu, Al, and Si on cognition were independent of brain atrophy rate. Although Cys and tHcy were also associated with accelerated brain atrophy rate, tHcy but not Cys predicted worse cognition. Our findings support a notion that structural changes in the brain are independent of cognitive impairment. These effects on brain atrophy rate and cognition were abrogated by B vitamin treatment. Given that dementia continues to increase worldwide and no effective treatment is available, our findings have clinical and public health relevance.
ACKNOWLEDGMENTS
This work was supported in part by grants from the National Science Center, Poland (2016/23/B/NZ5/00573, 2018/29/B/NZ4/00771, 2019/33/B/NZ4/01760), and the American Heart Association (17GRNT32910002). The original VITACOG trial was supported by grants from the Medical Research Council and several charities (see [8]).
Authors’ disclosures available online (https://www.j-alz.com/manuscript-disclosures/21-5085r1).
SUPPLEMENTARY MATERIAL
[1] The supplementary material is available in the electronic version of this article: https://dx.doi.org/10.3233/JAD-215085.
REFERENCES
[1] | Livingston G , Sommerlad A , Orgeta V , Costafreda SG , Huntley J , Ames D , Ballard C , Banerjee S , Burns A , Cohen-Mansfield J , Cooper C , Fox N , Gitlin LN , Howard R , Kales HC , Larson EB , Ritchie K , Rockwood K , Sampson EL , Samus Q , Schneider LS , Selbaek G , Teri L , Mukadam N ((2017) ) Dementia prevention, intervention, and care. Lancet 390: , 2673–2734. |
[2] | Smith AD , Refsum H ((2017) ) Dementia prevention by disease-modification through nutrition. J Prev Alzheimers Dis 4: , 138–139. |
[3] | Kivipelto M , Mangialasche F , Ngandu T ((2018) ) Lifestyle interventions to prevent cognitive impairment, dementia and Alzheimer disease. Nat Rev Neurol 14: , 653–666. |
[4] | Lehtisalo J , Levalahti E , Lindstrom J , Hanninen T , Paajanen T , Peltonen M , Antikainen R , Laatikainen T , Strandberg T , Soininen H , Tuomilehto J , Kivipelto M , Ngandu T ((2019) ) Dietary changes and cognition over 2 years within a multidomain intervention trial-The Finnish Geriatric Intervention Study to Prevent Cognitive Impairment and Disability (FINGER). Alzheimers Dement 15: , 410–417. |
[5] | Smith AD , Refsum H , Bottiglieri T , Fenech M , Hooshmand B , McCaddon A , Miller JW , Rosenberg IH , Obeid R ((2018) ) Homocysteine and dementia: an international consensus statement. J Alzheimers Dis 62: , 561–570. |
[6] | Seshadri S , Wolf PA , Beiser AS , Selhub J , Au R , Jacques PF , Yoshita M , Rosenberg IH , D’Agostino RB , DeCarli C ((2008) ) Association of plasma total homocysteine levels with subclinical brain injury: cerebral volumes, white matter hyperintensity, and silent brain infarcts at volumetric magnetic resonance imaging in the Framingham Offspring Study. Arch Neurol 65: , 642–649. |
[7] | Clarke R , Smith AD , Jobst KA , Refsum H , Sutton L , Ueland PM ((1998) ) Folate, vitamin B12, and serum total homocysteine levels in confirmed Alzheimer disease. Arch Neurol 55: , 1449–1455. |
[8] | Smith AD , Smith SM , de Jager CA , Whitbread P , Johnston C , Agacinski G , Oulhaj A , Bradley KM , Jacoby R , Refsum H ((2010) ) Homocysteine-lowering by B vitamins slows the rate of accelerated brain atrophy in mild cognitive impairment: a randomized controlled trial. PLoS One 5: , e12244. |
[9] | de Jager CA , Oulhaj A , Jacoby R , Refsum H , Smith AD ((2012) ) Cognitive and clinical outcomes of homocysteine-lowering B-vitamin treatment in mild cognitive impairment: a randomized controlled trial. Int J Geriatr Psychiatry 27: , 592–600. |
[10] | Wang L , Yin YL , Liu XZ , Shen P , Zheng YG , Lan XR , Lu CB , Wang JZ ((2020) ) Current understanding of metal ions in the pathogenesis of Alzheimer’s disease. Transl Neurodegener 9: , 10. |
[11] | Ejaz HW , Wang W , Lang M ((2020) ) Copper toxicity links to pathogenesis of Alzheimer’s disease and therapeutics approaches. Int J Mol Sci 21: , 7660. |
[12] | Tao Y , Wang Y , Rogers JT , Wang F ((2014) ) Perturbed iron distribution in Alzheimer’s disease serum, cerebrospinal fluid, and selected brain regions: a systematic review and meta-analysis. J Alzheimers Dis 42: , 679–690. |
[13] | Ayton S , Wang Y , Diouf I , Schneider JA , Brockman J , Morris MC , Bush AI ((2020) ) Brain iron is associated with accelerated cognitive decline in people with Alzheimer pathology. Mol Psychiatry 25: , 2932–2941. |
[14] | Spotorno N , Acosta-Cabronero J , Stomrud E , Lampinen B , Strandberg OT , van Westen D , Hansson O ((2020) ) Relationship between cortical iron and tau aggregation in Alzheimer’s disease. Brain 143: , 1341–1349. |
[15] | Edwardson JA , Candy JM , Ince PG , McArthur FK , Morris CM , Oakley AE , Taylor GA , Bjertness E ((1992) ) Aluminium accumulation, beta-amyloid deposition and neurofibrillary changes in the central nervous system. Ciba Found Symp 169: , 165–179; discussion 179-185. |
[16] | Rondeau V , Jacqmin-Gadda H , Commenges D , Helmer C , Dartigues JF ((2009) ) Aluminum and silica in drinking water and the risk of Alzheimer’s disease or cognitive decline: findings from 15-year follow-up of the PAQUID cohort. Am J Epidemiol 169: , 489–496. |
[17] | Edwardson JA , Moore PB , Ferrier IN , Lilley JS , Newton GW , Barker J , Templar J , Day JP ((1993) ) Effect of silicon on gastrointestinal absorption of aluminium. Lancet 342: , 211–212. |
[18] | Gillette Guyonnet S , Andrieu S , Vellas B ((2007) ) The potential influence of silica present in drinking water on Alzheimer’s disease and associated disorders. J Nutr Health Aging 11: , 119–124. |
[19] | Lam PK , Kritz-Silverstein D , Barrett Connor E , Milne D , Nielsen F , Gamst A , Morton D , Wingard D ((2008) ) Plasma trace elements and cognitive function in older men and women: the Rancho Bernardo study. J Nutr Health Aging 12: , 22–27. |
[20] | Zhou G , Ji X , Cui N , Cao S , Liu C , Liu J ((2015) ) Association between serum copper status and working memory in schoolchildren. Nutrients 7: , 7185–7196. |
[21] | Tyler CR , Allan AM ((2014) ) The effects of arsenic exposure on neurological and cognitive dysfunction in human and rodent studies: a review. Curr Environ Health Rep 1: , 132–147. |
[22] | Petersen RC ((2004) ) Mild cognitive impairment as a diagnostic entity. J Intern Med 256: , 183–194. |
[23] | Douaud G , Refsum H , de Jager CA , Jacoby R , Nichols TE , Smith SM , Smith AD ((2013) ) Preventing Alzheimer’s disease-related gray matter atrophy by B-vitamin treatment. Proc Natl Acad Sci U S A 110: , 9523–9528. |
[24] | Folstein MF , Folstein SE , McHugh PR ((1975) ) “Mini-mental state”. A practical method for grading the cognitive state of patients for the clinician. J Psychiatr Res 12: , 189–198. |
[25] | Brandt J , Welsh KA , Breitner JC , Folstein MF , Helms M , Christian JC ((1993) ) Hereditary influences on cognitive functioning in older men. A study of 4000 twin pairs. Arch Neurol 50: , 599–603. |
[26] | Brandt J ((1991) ) The hopkins verbal learning test: Development of a new memory test with six equivalent forms. Clin Neuropsychol 5: , 125–142. |
[27] | Robertson I , Ward T , Ridgeway V , Nimmo-Smith I (1994) The Test of Everyday Attention, Thames Valley Test Company, Bury St Edmunds. |
[28] | Lezak MD , Howieson DB , Loring DW ((1994) ) Neurolopsychological Assessment, Oxford University Press, NewYork. |
[29] | Perla-Kajan J , Wloczkowska O , Ziola-Frankowska A , Frankowski M , Smith AD , de Jager CA , Refsum H , Jakubowski H ((2021) ) Paraoxonase 1, B vitamins supplementation, and mild cognitive impairment. J Alzheimers Dis 81: , 1211–1229. |
[30] | Nikseresht S , Bush AI , Ayton S ((2019) ) Treating Alzheimer’s disease by targeting iron. Br J Pharmacol 176: , 3622–3635. |
[31] | Lehmann DJ , Schuur M , Warden DR , Hammond N , Belbin O , Kolsch H , Lehmann MG , Wilcock GK , Brown K , Kehoe PG , Morris CM , Barker R , Coto E , Alvarez V , Deloukas P , Mateo I , Gwilliam R , Combarros O , Arias-Vasquez A , Aulchenko YS , Ikram MA , Breteler MM , van Duijn CM , Oulhaj A , Heun R , Cortina-Borja M , Morgan K , Robson K , Smith AD ((2012) ) Transferrin and HFE genes interact in Alzheimer’s disease risk: the Epistasis Project. Neurobiol Aging 33: , 202 e201–213. |
[32] | Andrasi E , Farkas E , Scheibler H , Reffy A , Bezur L ((1995) ) Al, Zn, Cu, Mn and Fe levels in brain in Alzheimer’s disease. Arch Gerontol Geriatr 21: , 89–97. |
[33] | Smith MA , Harris PL , Sayre LM , Perry G ((1997) ) Iron accumulation in Alzheimer disease is a source of redox-generated free radicals. Proc Natl Acad Sci U S A 94: , 9866–9868. |
[34] | Smith MA , Zhu X , Tabaton M , Liu G , McKeel DW Jr., Cohen ML , Wang X , Siedlak SL , Dwyer BE , Hayashi T , Nakamura M , Nunomura A , Perry G ((2010) ) Increased iron and free radical generation in preclinical Alzheimer disease and mild cognitive impairment. J Alzheimers Dis 19: , 363–372. |
[35] | Bulk M , Abdelmoula WM , Nabuurs RJA , van der Graaf LM , Mulders CWH , Mulder AA , Jost CR , Koster AJ , van Buchem MA , Natte R , Dijkstra J , van der Weerd L ((2018) ) Postmortem MRI and histology demonstrate differential iron accumulation and cortical myelin organization in early- and late-onset Alzheimer’s disease. Neurobiol Aging 62: , 231–242. |
[36] | Kwiatek-Majkusiak J , Dickson DW , Tacik P , Aoki N , Tomasiuk R , Koziorowski D , Friedman A ((2015) ) Relationships between typical histopathological hallmarks and the ferritin in the hippocampus from patients with Alzheimer’s disease. Acta Neurobiol Exp (Wars) 75: , 391–398. |
[37] | Acosta-Cabronero J , Williams GB , Cardenas-Blanco A , Arnold RJ , Lupson V , Nestor PJ ((2013) ) quantitative susceptibility mapping (QSM) in Alzheimer’s disease. PLoS One 8: , e81093. |
[38] | Hwang EJ , Kim HG , Kim D , Rhee HY , Ryu CW , Liu T , Wang Y , Jahng GH ((2016) ) Texture analyses of quantitative susceptibility maps to differentiate Alzheimer’s disease from cognitive normal and mild cognitive impairment. Med Phys 43: , 4718. |
[39] | Ayton S , Fazlollahi A , Bourgeat P , Raniga P , Ng A , Lim YY , Diouf I , Farquharson S , Fripp J , Ames D , Doecke J , Desmond P , Ordidge R , Masters CL , Rowe CC , Maruff P , Villemagne VL , Australian Imaging B , Lifestyle Research G , Salvado O , Bush AI ((2017) ) Cerebral quantitative susceptibility mapping predicts amyloid-beta-related cognitive decline. Brain 140: , 2112–2119. |
[40] | van Bergen JM , Li X , Hua J , Schreiner SJ , Steininger SC , Quevenco FC , Wyss M , Gietl AF , Treyer V , Leh SE , Buck F , Nitsch RM , Pruessmann KP , van Zijl PC , Hock C , Unschuld PG ((2016) ) Colocalization of cerebral iron with amyloid beta in mild cognitive impairment. Sci Rep 6: , 35514. |
[41] | van Bergen JMG , Li X , Quevenco FC , Gietl AF , Treyer V , Meyer R , Buck A , Kaufmann PA , Nitsch RM , van Zijl PCM , Hock C , Unschuld PG ((2018) ) Simultaneous quantitative susceptibility mapping and Flutemetamol-PET suggests local correlation of iron and beta-amyloid as an indicator of cognitive performance at high age. Neuroimage 174: , 308–316. |
[42] | Andreeva VA , Galan P , Arnaud J , Julia C , Hercberg S , Kesse-Guyot E ((2013) ) Midlife iron status is inversely associated with subsequent cognitive performance, particularly in perimenopausal women. J Nutr 143: , 1974–1981. |
[43] | Guan J , Wang P , Lu L , Zhao G ((2020) ) Association of plasma transferrin with cognitive decline in patients with mild cognitive impairment and Alzheimer’s disease. Front Aging Neurosci 12: , 38. |
[44] | Pratico D , Uryu K , Sung S , Tang S , Trojanowski JQ , Lee VM ((2002) ) Aluminum modulates brain amyloidosis through oxidative stress in APP transgenic mice. FASEB J 16: , 1138–1140. |
[45] | Frisardi V , Solfrizzi V , Capurso C , Kehoe PG , Imbimbo BP , Santamato A , Dellegrazie F , Seripa D , Pilotto A , Capurso A , Panza F ((2010) ) Aluminum in the diet and Alzheimer’s disease: from current epidemiology to possible disease-modifying treatment. J Alzheimers Dis 20: , 17–30. |
[46] | Crapper McLachlan DR , Dalton AJ , Kruck TP , Bell MY , Smith WL , Kalow W , Andrews DF ((1991) ) Intramuscular desferrioxamine in patients with Alzheimer’s disease. Lancet 337: , 1304–1308. |
[47] | Liu G , Men P , Perry G , Smith MA ((2010) ) Nanoparticle and iron chelators as a potential novel Alzheimer therapy. Methods Mol Biol 610: , 123–144. |
[48] | Ma F , Zhou X , Li Q , Zhao J , Song A , An P , Du Y , Xu W , Huang G ((2019) ) Effects of folic acid and vitamin B12, alone and in combination on cognitive function and inflammatory factors in the elderly with mild cognitive impairment: a single-blind experimental design. Curr Alzheimer Res 16: , 622–632. |
[49] | Ma F , Li Q , Zhou X , Zhao J , Song A , Li W , Liu H , Xu W , Huang G ((2019) ) Effects of folic acid supplementation on cognitive function and Abeta-related biomarkers in mild cognitive impairment: a randomized controlled trial. Eur J Nutr 58: , 345–356. |


