
Sex and Gender Differences in Environmental Influences on Dementia Incidence in Germany, 2014–2019: An Observational Cohort Study Based on Health Claims Data
Abstract
Background:
There is an ongoing debate about whether environmental characteristics influence dementia risk like individual traits do, and whether these differ by sex and gender.
Objective:
This study examines the influence of regional characteristics on the incidence of dementia and explores sex and gender differences using individual-level health information and regional characteristics.
Methods:
Using a random sample of 250,000 people aged 70 + insured through Germany’s largest German public health agency, we analyzed quarterly data about diagnoses and place of residence from 2014 to 2019. Using five-digit postal codes, we added data on various dimensions of regional characteristics offered by the INKAR database and the 2011 Census database. We used multilevel survival regressions to tease out regional incidence differences while accounting for spatial clustering.
Results:
After adjusting for multi-morbidity and relocation-related selection bias, we saw that people living in regions with the highest tertile of income (HR = 0.87, p < 0.001), and who had the highest tertile of remaining life expectancy at age 60 (HR = 0.93, p = 0.012) had lower dementia risks. There was no gender difference in the regional income effect, but the effect of education (HR = 0.91, p = 0.015) was significant only for men and remaining life-expectancy was significant only for women (HR = 0.93, p = 0.026).
Conclusion:
Environmental characteristics related to wealth and health resources of a region influence the risk of dementia among the elderly in Germany. This effect is independent of the health profiles of the individuals and differs between the two genders. Health policies need to acknowledge these modifiable risk factors and consider how they affect men and women differently.
INTRODUCTION
Dementia is a major burden in aging societies [1], and currently there are no treatment options identifying modifiable influencing factors, neither at the individual nor the neighborhood (area) levels [2]. Cognitive abilities, the cognitive (aging) process itself, and risk factors may be affected by biological sex and social gender [3]. Women in Europe have a higher risk of developing dementia, especially after age 80 [4, 5], but this is not the case in the United States [6].
Biological processes and/or the distribution of protective and risk factors differ between men and women because of social factors, cultural differences, and gender stereotypes [3]. Risk factors may be equally distributed in men and women, but may have a greater impact on one sex, e.g., there may be a sexually dimorphic response to the therapeutic and toxic effects of cholinesterase inhibitors used to treat dementia in patients with Alzheimer’s disease (AD) [7]. Risk factors may also have different frequencies, e.g., low education is consistently associated with increased risk of AD for both women and men [8], and women have had fewer opportunities for higher education over the past century. The factors may also differ in both frequency and impact, e.g., men who have never married or are widowed have a higher risk of dementia than their female counterparts [9]; or they may even be restricted to one sex. Menopause, which occurs only in women, has been associated with a decrease in verbal memory [10], and premature menopause (e.g., either natural or surgically induced) has been associated with an increased risk of dementia [11].
Glass and Belfour [12] discussed four potentially modifiable dimensions of neighborhood aspects which influence overall health and are open to intervention. These four dimensions are socioeconomic conditions (e.g., income, education), social integration (e.g., unemployment), physical aspects of place (e.g., built environment, population density), and services and resources (e.g., health services). We followed the theoretical framework of Wu and colleagues [13], which postulates that area-level socioeconomic conditions influence area-level social integration, the built environment in terms of environmental stress and environmental support, and area-level health services and resources. These area-level factors influence individual-level health, with lifestyle factors, vascular risk factors, and mental health and well-being as important determinants of cognitive function later in life. At the individual level, health trajectories and risk factors for poor health differ substantially by sex and gender [3], whereas relatively little is known about these differences in the effects of neighborhood characteristics on health [14, 15]. We therefore first present studies for men and women combined, and then turn to gender-specific results.
The four dimensions of neighborhood aspects are frequently used in studies that examine area-level factors for cognition and dementia, such as small-scale physical characteristics and social environment characteristics, e.g., the presence of community resources [16, 17], public open spaces [16, 17], green environments [13, 17, 18], neighborhood social cohesion [19], and the socioeconomic composition of the residential population [20–22]. However, the results are contradictory. A recent review [23] concluded that most studies were cross-sectional, conducted in the United States, and found at least one significant association. The wide diversity of measures and neighborhood definitions limited generalizability, but it did appear that there was a moderately strong association between neighborhood socioeconomic status and cognition, and weaker associations between neighborhood demographics and cognition. The study concluded that the evidence of an association between neighborhood characteristics and cognition is currently modest and there is strong modification of area dimensions by individual-level characteristics. For example, in England, the incidence of dementia appeared to be socioeconomically structured primarily by individual levels of affluence, but no significant differences were identified in terms of neighborhood area of deprivation [24]. Higher levels of deprivation and crime were not significantly associated with cognitive impairment and dementia after individual factors were taken into account [13, 17]. Similarly, dementia risk was higher for psychosocially precarious individuals, but no increased dementia risk was found for those living in communities with a high deprivation index [25]. On the other hand, several studies have found associations between objectively measured neighborhood disadvantage [21, 26, 27] and poorer cognitive functioning in middle-aged and older adults, and there has been a strong effect of area-level socioeconomic disadvantage on cognitive dysfunction in older adults [26].
There appears to be an independent effect of geographic variation in relation to living in rural areas and the availability of a natural environment. A meta-analysis concluded that living in rural areas is associated with an increased risk of AD, especially if one lived in rural areas early in life [28]. The likelihood of dementia and cognitive impairment in the highest quartile of natural environment availability was also increased, while those who lived in the highest quartile of land use mix, defined as a close integration of residential, commercial, and recreational uses, had a lower likelihood of dementia [13].
There is some evidence that area-level factors influencing health in general differ for men and women [14, 15], but the number of studies is still small. Knowledge of sex and gender differences in the relationship of neighborhood characteristics with dementia and cognitive function is even more limited [23], with the exception of the “Three Cities Cohort” in France, in which women living in deprived neighborhoods are at higher risk for dementia and AD, but men are not [29]. In contrast, limited activity space in deprived neighborhoods posed a risk only for men, not for women [30].
The aim of our study was to investigate the influence of environmental characteristics on dementia risk, controlling for personal health biographies and distinguishing between the two genders. Beginning in 2014, we followed individuals over a four-year period and recorded their residence, changes in residence, and physician-diagnosed conditions. Following Glass and Belfour [12] and the literature cited above, we used six indicators to capture socioeconomic conditions, social integration, physical aspects of residence, and services and resources. We hypothesized that dementia risk would depend on the socioeconomic composition of the residential environment, and that regions with higher status populations would be associated with lower dementia risk. This effect should be more pronounced for women. Although the association between dementia risk and urban or rural regions is not obvious based on previous research, environments with more activity opportunities should be more favorable for men. Environments characterized by good population health should generally have lower dementia risk. In the next sections, we refer to sex when describing data, methods, and results, and to sex and gender when discussing our findings and conclusions.
MATERIALS AND METHODS
Individual-level data
We used an age-stratified random sample of 250,000 persons at age 70 and above insured with the largest German public health insurance, the Allgemeine Ortskrankenkassen (AOK), which covers up to 50% of the older German population. In Germany, health insurance is mandatory for all citizens and permanent residents. In 2020, 88% of the population was insured under the statutory health insurance system, while the remainder, mainly high-income individuals, civil servants, and the self-employed, were covered by private health insurance plans (see [31] for details on the German healthcare system in international comparison). The sample was drawn in the first quarter of 2014 with a follow-up through the last quarter of 2019. The quarterly data contain all insurants, both living in private households and institutions, and provide information about age, sex, five-digit zip-code of the region of residence, and diagnoses from in- and out-patient medical visits coded by the German ICD-10 classification. These diagnoses are the basis of physicians’ and hospitals’ claims for financial transfers from health insurers.
Data protection declaration
The WIdO (Wissenschaftliches Institut der AOK), the scientific institute of the AOK, granted and approved our access to these data. Due to current data protection regulations, access to the complete register of all AOK insured persons was not allowed. The dataset only covered anonymized administrative claims data. Hence, no person whose record was used can be identified or affected by this study. This study complies with the tenets of the Declaration of Helsinki and no ethical approval was required.
Definition of dementia
We used the German ICD-10 codes F00.0-F00.9, F01.0-F01.9, F02.0-F02.8, F03, F05.1, G23.1, G30.0-G30.9, G31.0, and G31.82 to identify persons with dementia diagnoses. To deal with false-positive dementia diagnoses, we used the M2Q [32] criterion (minimum two quarters). The M2Q validation strategy defined the first diagnosis from a general practitioner, neurologist, or in-patient doctor as valid if at least one further diagnosis from a general practitioner, neurologist, or in-patient doctor in at least one later quarter was recorded within the observation period. Dementia diagnoses reported in the same quarter in which a person died were considered valid only if there had been another diagnosis in any of the previous quarters.
Washout period and analysis sample
To focus on incident dementia cases, we included only valid diagnoses first documented from 2015 to 2019 and excluded diagnoses made in the year 2014 (“washout period”). By the first quarter of 2015, the original sample size had been reduced to 240,406 individuals due to mortality and change of insurance. It was further reduced to 224,102 individuals, due to 16,304 ever-diagnosed persons with a dementia diagnosis in 2014. By excluding all persons younger than 70 years of age in 2014, the final sample covers data for 86,898 persons.
Individual level risk factors
We used current age in 5-year age groups (70–74, 75–79, 80–84, 85–89, 90+) and sex. We controlled for change of residence, as defined by a change of the five-digit postal code in a particular quarter compared to the prior quarter. There is no information about the date or reason for the move, or about relocation within the same postal code region. To adjust for the general health of an individual we computed a multi-morbidity score, which is a modified comorbidity score suggested by Charlson and colleagues [33]. The score measured the quarterly total number of (ever-diagnosed) severe diseases of the patients. We selected the following general severe diseases: cerebrovascular diseases (G45–G46, H34.0, I06), ischemic (I20–I25) and other heart diseases (I09.9, I11.0, I13.0–I13.2, I42.0–I42.9, I43, I50), cancer (C00-C97), kidney diseases (I12.0, I13.1–13.2, N03.2–03.7, N05.2–05.7, N11–N19, N25–N29, Z49.0–Z49.2, Z94.0, Z99.2), diabetes (E11–E14), pneumonia (J12–J18), and lung diseases (J44). We considered all ever diagnosed diseases as chronic diseases and as an irreversible persistent (absorbing) status (“ever” versus “never/not yet diagnosed with” statuses). We defined four categories: none of the severe diseases, one, two, and three or more of the selected diseases.
Macro-level data
We used publicly available data from the INKAR database of the Federal Institute for Research on Building and from the Census database of the Statistical Offices of the Federation and the Länder on level of counties (Nomenclature of Territorial Units for Statistics [NUTS]-3 level regions). We used “Average household income per person in € in 2014” as an indicator of socioeconomic conditions; “Remaining life expectancy at age 60 in 2014” (e60) as an indicator of health resources; “Persons per sqkm of total area in 2014” and “% (proportion of) area in natural state 1 [1] in total area in 2016” as indicators of the physical aspects of place; and “% (proportion of) long-term unemployed persons in all unemployed persons” 2 [2] (all INKAR database) and “% (proportion of) persons aged 65 + with higher education (defined as university entrance qualification-Hochschulreife or Fachhochschulreife) in all persons 65 + in 2011” (Census 2011 database) as measures of social integration/social deprivation. We computed tertiles for these six indicators: “average household income per person in € in 2014” (< 1,588€, 1,588€ to < 1,805€, 1,805€ and more), “remaining life expectancy at age 60 in 2014” (e60, < 23.38 years; 23.38 years to 23.96 years, 23.96 years and more), “persons per sqkm of total area in 2014” (< 132 persons, 132 to < 367 persons, 367 persons and more), “% (proportion of) area in natural state in total area in 2016” (< 3.3%; 3.3% to < 5.4%, 5.4% and more), “% (proportion of) long-term unemployed persons in all unemployed persons” (< 30.2%, 30.2% to < 37.6%, 37.6% and more), and “% (proportion of) persons aged 65 + with higher education in all persons 65 + in 2011” (<13.0%; 13.0% to < 17.4%, 17.4% and more).
We assigned the county-specific indicators to postal code regions by allocating geocodes to five-digit postal codes. There was at least one person in 8,118 of the 8,171 valid 5-digit German postal codes (excluding institutions with specific postal codes) in our AOK analysis sample. We added a missing category for persons with unclear or expired postal codes and persons living abroad.
To reduce a potential insurance selection bias, we included the proportion of persons insured with the AOK in each county. The number of insurants for the years 2006-2008 was made available by the insurance on a three-digit post code level, which was then transformed into county level and divided by the counties’ average total population in 2006-08. We categorized these shares into sextiles (< 25.5%, 25.5% to < 29.9%, 29.9% to < 34.6%, 34.6% to 40.4%, 40.4% to 49.4%, 49.4% or more) with a separate missing category for expired postal codes and persons living abroad.
Analysis strategy
First, we estimated directly age-standardized incidence rates of dementia by two-digit postal code region of living and mapped these to explore clusters of high and low incidence rates. Second, we calculated incidence rates and Kaplan-Meier failure functions for all covariates and by sex. Third, we used multi-level survival regressions to explore individual and macro level risk factors of dementia incidence. To examine the gross effects of the individual macro variables, we calculated six separate models (Model 1a to Model 1f), which controlled for age, sex, relocation, residence in East/West Germany, and the proportion of AOK insured. In the next step we estimated the effects of macro variables combined (Model 2), controlled for all covariates of Model 1a-1f, and finally, we included multi-morbidity at the individual level in Model 2 to examine the extent to which individual health biographies and macro factors are related (Model 3). To examine the modifying effect of sex, we calculated interaction effects between sex and the respective individual and macro-level factors (Model 4a-k without multi-morbidity and Model 5a-k with multi-morbidity).
Incidence rates
The incidence of dementia was defined for all persons from the start of the first quarter of 2015 through the end of the fourth quarter of 2019, or the time of death or the change of the insurer. Person-time under risk was measured in years and standardized as an annual rate. Sex (x)- and age (a)-specific incidence rates were measured as the number of persons with a valid dementia diagnosis (Event201519,x,a), divided by the person-time under risk in person-years (PYRisk) within the study time (Eq. 1).
(1)
We calculated the incidence rate by age in five-year age groups (70–74, 75–79, 80–84, 85–89, 90+), two-digit postal code regions, and by the clusters of regions. 95% binomial exact confidence intervals were estimated, and the incidence was directly age-standardized by using age-stratified population data of the 2014 German population. Age-standardized incidence rates were mapped on two-digit postal code level.
We further estimated incidence rates for all categories of the particular covariates. The incidence rates were unstandardized or unadjusted to show the raw correlations between the covariates and dementia risk.
Kaplan-Meier failure function
We computed Kaplan-Meier failure functions defined as one minus the cumulative number d of events over a defined period t to the number of individuals n who had not yet experienced an event or were censored (Eq. 2). We assumed that all events took place in the middle of a quarter.
(2)
Multilevel mixed effects parametric survival model
As the basic Cox model considers neither hierarchical structures in the data nor autocorrelation, we used multilevel mixed effects parametric survival models as displayed in Eq. 3:
(3)
where i = 1. . . N are the clusters of counties with each cluster covering j = 1. . . n persons and h0(tji) is the baseline hazard function. We used an exponential distribution to model the analysis time, which is the chronological time since January 1, 2015 in quarters. The components xji and zji are design matrices for the individual β and macro uj effects, where uj is assumed to follow a multivariate normal distribution with uj ∼ N (0, Σ).
Except for sex, all individual factors are time varying. Because of a high correlation between sex, age and multi-morbidity [3] we estimated models both without (Model 2), and with adjustment for multi-morbidity (Model 3). We conducted likelihood ratio tests to evaluate the performance and improvements of the models. We performed all analyses using Stata version 16 (Stata Corp., College Station, TX, USA) and the official Stata routine mestreg.
RESULTS
Description of the study population at baseline
Individual level
In the first quarter of 2015, there were more females (61.11%) than males (38.89%) among the 86,898 persons (Supplementary Tables 1 and 2). Most were between 75 and 79 years old (35.07%); those aged 80 and higher were also more often female (19.77%) than male (11.23%). Fewer than one percent (0.55%) of the people moved to another region during the first quarter of the study (males 0.47%, females 0.61%). Most individuals (33.17%) had three or more severe disease, and 23.02% had no severe disease (males: 21.12%, females: 16.37%). Dementia had been diagnosed in 9,882 persons (4.41%) during the first quarter of the study (females 62.8%, males 37.2%) (Supplementary Table 1).
Macro level
Turning to the macro level factors, a higher proportion of AOK insured persons in a county was reflected in a larger proportion of individuals in the AOK data (Supplementary Table 2). Considering the sample proportions within the particular specific macro factors, there were no disparities between the sexes. The correlations between macro factors were statistically significant (generally p < = 0.05), the absolute (positive or negative) values ranged between 0.0220 and 0.4602, with the highest correlation between e60 and higher education.
Crude incidence rates and Kaplan-Meier failure functions (Supplementary Tables 3 and 4)
In the total sample, the yearly crude (unadjusted) incidence was 4.18 dementia diagnoses per 100 person-years (95% CI: 4.11–4.25). Increasing significantly with age, it was higher among persons who had moved within a quarter (48.25; 95% -CI: 45.35–51.34), were multi-morbid (3 + 6.09; 95% -CI: 5.97–6.22), and who resided in eastern Germany or Berlin (4.54; 95% -CI: 4.41–4.48; Supplementary Table 3). Incidence was highest for those living in regions with the lowest household income (lowest: 4.56, 95% -CI: 4.45–4.68; highest: 3.84, 95% -CI: 3.73–3.95), a high proportion of people in long-term unemployment (lowest: 3.96, 95% -CI: 3.83–4.09; highest: 4.38, 95% -CI:44.27–4.50), low population density (lowest: 4.38, 95% -CI: 4.25–4.51, highest: 4.24, 95% -CI: 4.13–4.35), and low remaining e60 (lowest: 4.48, 95% -CI: 4.35–4.61; highest: 3.85, 95% -CI: 3.74–3.97). Living in a region with the highest proportion of natural state was associated with a slightly higher risk of dementia for females (4.58; 95% -CI: 4.43–4.74) but not for males (3.83, 95% -CI: 3.65–4.02). There was no difference in incidence by higher education. Almost all disparities in macro factors were more pronounced for males than for females, as can be seen from the Kaplan-Meier failure functions (Supplementary Figures 1 and 2).
Age-standardized incidence of dementia by sex and two-digit postal code region
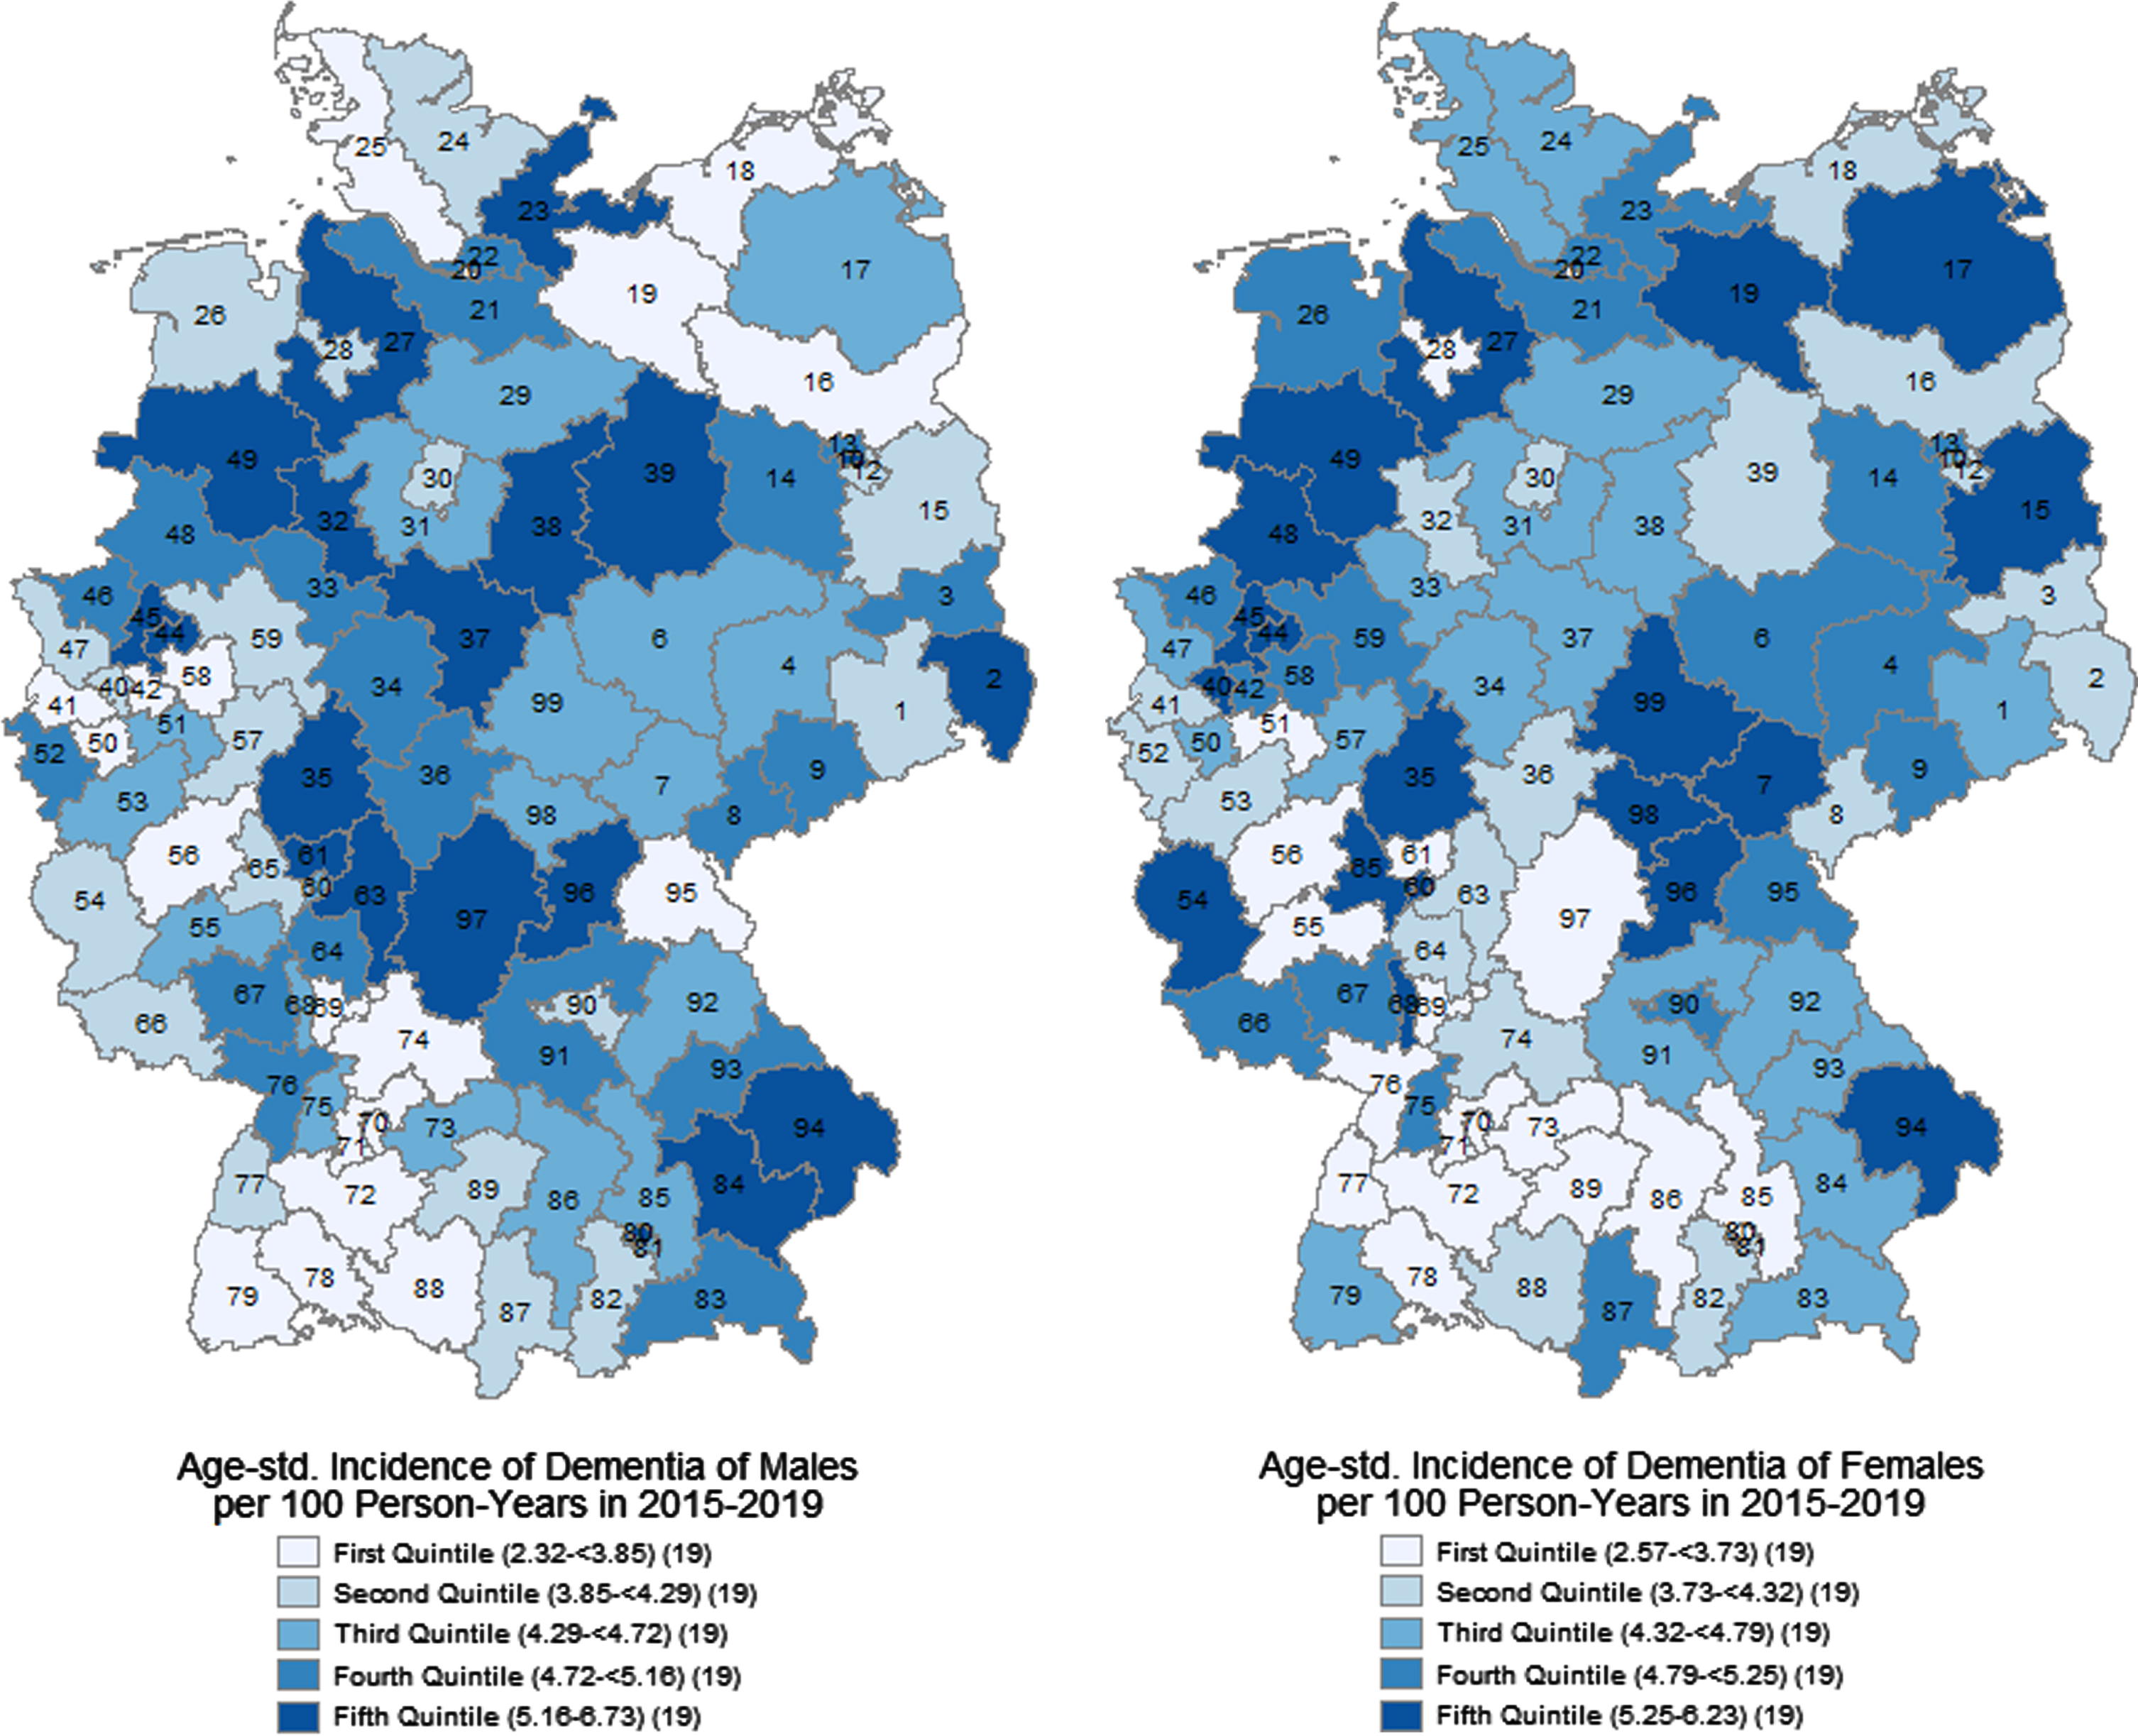
We found large regional disparities in the age-standardized incidence of dementia (Fig. 1), ranging from 2.32 to 6.73 new diagnoses per 100 person-years. There were high rates (> 5.16 persons) in central, northeastern, and northwestern Germany, in eastern Bavaria, and the Ruhr region. The lowest rates (< 3.73 persons) were concentrated in southern Germany, especially in Baden-Wurttemberg and southern and central Bavaria, in northern Germany especially in Schleswig-Holstein, but also in selected regions in other federal states. However, most of the regions were around the mean incidence rates of 4.50 for males and 4.47 for females.
Fig. 1
Age-standardized incidence of dementia at age 70+ per 100 person-years by two-digit postal code regions and sexes in 2015–2019. AOK data.
Multilevel survival regression
In the multi-variable regression models, all effects of the macro factors were adjusted for the potential associations with individual factors. The likelihood ratio test for Model 3 revealed a significantly higher adequacy of the exponential multilevel model compared to a single-level exponential model (χ2= 4.22; p = 0.0200).
Individual characteristics (Table 1)
Individual-level characteristics followed our expectations (Table 1): there was a strong increase of dementia risk with increasing age, which was profoundly lower when adjusted for multi-morbidity. Adjusting for multi-morbidity also changed the effect of sex: without controlling, females had the same risk (HR = 0.99, p = 0.413) of dementia as men; with adjustment they had an 8% (HR = 1.08, p < 0.001) higher risk. Multi-morbidity itself was highly related to dementia incidence. Persons with one severe disease had a 39% higher risk (HR = 1.39, p < 0.001), persons with two severe diseases 68% higher (HR = 1.68, p < 0.001), and persons with three and more severe diseases a 145% higher (HR = 2.45, p < 0.001) risk of dementia compared to persons without any of the selected severe diseases. Relocations were highly associated with dementia incidence; persons who had moved had about ten times (HR = 9.53, p < 0.001) the risk of dementia. Residing in east or west Germany was not significant once all other factors were controlled for. Adjusting for multi-morbidity did not change the latter two results. Interaction effects showed a significant sex difference with multi-morbidity: without any multi-morbidity, men had the same risk of dementia (HR = 0. 99; p = 0.413) as women; with multi-morbidity, the sex difference became significant (females compared to males: HR = 1.08, p < 0.001). Finally, after relocation, the increased risk of dementia was higher in men (HR = 10.35; p < 0.001)) compared to women (HR = 9.19, p < 0.001) (Supplementary Tables 5 and 7).
Table 1
Hazard ratios by individual level covariates of the multilevel survival regression models (part 1), Model 2 not adjusted for multi-morbidity, Model 3 adjusted for multi-morbidity, AOK data, bold = p < 0.10
| Model 2 | Model 3 | ||||||
| Covariates | Hazard Ratio | Std. Error | p | Hazard Ratio | Std. Error | p | |
| Age | 70–74 | 1.00 | 1.00 | ||||
| 75–79 | 1.45 | 0.06 | < 0.001 | 1.35 | 0.05 | < 0.001 | |
| 80–84 | 2.51 | 0.10 | < 0.001 | 2.20 | 0.09 | < 0.001 | |
| 85–89 | 4.06 | 0.16 | < 0.001 | 3.41 | 0.14 | < 0.001 | |
| 90+ | 6.06 | 0.25 | < 0.001 | 4.96 | 0.21 | < 0.001 | |
| Sex | Male | 1.00 | 1.00 | ||||
| Female | 0.99 | 0.02 | 0.413 | 1.08 | 0.02 | < 0.001 | |
| Comorbidity score | No severe disease | 1.00 | |||||
| One severe disease | 1.39 | 0.05 | < 0.001 | ||||
| Two severe diseases | 1.68 | 0.06 | < 0.001 | ||||
| Three and more severe diseases | 2.45 | 0.08 | < 0.001 | ||||
| Change of residence | No | 1.00 | 1.00 | ||||
| Yes | 10.15 | 0.34 | < 0.001 | 9.53 | 0.32 | < 0.001 | |
| AOK-share | First sextile (lowest) | 1.00 | 1.00 | ||||
| Second sextile | 1.01 | 0.04 | 0.691 | 1.02 | 0.04 | 0.641 | |
| Third sextile | 0.98 | 0.04 | 0.670 | 0.98 | 0.04 | 0.633 | |
| Fourth sextile | 0.95 | 0.04 | 0.161 | 0.95 | 0.04 | 0.169 | |
| Fifth sextile | 0.95 | 0.04 | 0.170 | 0.95 | 0.04 | 0.231 | |
| Sixth sextile (highest) | 0.94 | 0.04 | 0.143 | 0.94 | 0.04 | 0.194 | |
| Missing data/not in Germany | – | – | |||||
| Territory | West Germany | 1.00 | 1.00 | ||||
| East Germany/Berlin | 0.97 | 0.04 | 0.330 | 0.93 | 0.03 | 0.045 | |
| Missing data/not in Germany | – | – | |||||
Macro level Indicators (Table 2)
The gross effects of the macro-variables (Model 1a-f) revealed a significantly reduced risk of dementia for counties with the highest household income (Model 1a: HR = 0.84, p≤0.001). It was highest in counties with the highest proportion of long-term unemployed (Model 1b: HR = 1.06, p = 0.040). Counties with a high proportion of persons with high education had a significantly reduced risk (Model 1c: 2nd tertile HR = 0.92, p = 0.002; 3rd tertile: HR = 0.90, p < 0.001), as well as those with high e60 (Model 1f: 3rd tertile: HR = 0.87, p≤0.001). Counties with a high population density showed a 5% lower risk of dementia (Model 1d: 2nd tertile: HR = 0.95, p = 0.042; 3rd tertile: HR = 0.95, p = 0.100). The proportions of area in natural state were not significant. When combined in one model (Model 2), persons living in counties with the highest average household income per capita had a significantly lower risk of dementia (HR = 0.87, p < 0.001) compared to persons in the counties with the lowest income. Residents of regions with the highest e60 had a lower dementia incidence than those in regions with the lowest (HR = 0.91, p = 0.001). While population density still had no significant effect, the share of area in natural state in the living region was significantly linked with dementia. Persons in regions with the highest share showed a lower (HR = 0.95, p = 0.043) risk of dementia compared to persons in regions with the lowest share. While 9,882 persons (4.41%) a borderline significant effect of higher education did remain (3rd tertile: HR = 0.94, p = 0.051), the effect of long-term unemployment was attenuated once adjusted for average household income. Adjusting for multi-morbidity (Model 3) did not further change the effects of the macro indicators but attenuated some of the effect of higher education (3rd tertile: HR = 0.96, p = 0.069), and of a high share of area in natural state (HR = 0.96, p = 0.069).
Table 2
Hazard Ratios by macro level covariates of the multilevel survival regression models, Models 1a-1f and Model 2 not adjusted for multi-morbidity, Model 3 adjusted for multi-morbidity, AOK data, bold = p < 0.10, controlled for age, sex, relocation, AOK-share, and territory
| Model 1a-1f | Model 2 | Model 3 | ||||||||
| Covariates | Hazard Ratio | Std. Error | p | Hazard Ratio | Std. Error | p | Hazard Ratio | Std. Error | p | |
| Average household income per person in € in 2014 | First tertile (lowest) | 1.00 | 1.00 | 1.00 | ||||||
| Second tertile | 0.94 | 0.03 | 0.029 | 0.92 | 0.03 | 0.004 | 0.91 | 0.03 | 0.002 | |
| Third tertile (highest) | 0.84 | 0.03 | < 0.001 | 0.87 | 0.03 | < 0.001 | 0.87 | 0.03 | < 0.001 | |
| Missing data/not in Germany | – | – | – | |||||||
| % Long-term unemployed persons (unemployed for one year and longer) in all unemployed persons in 2014 | First tertile (lowest) | 1.00 | 1.00 | 1.00 | ||||||
| Second tertile | 1.02 | 0.03 | 0.377 | 0.99 | 0.03 | 0.810 | 1.00 | 0.03 | 0.996 | |
| Third tertile (highest) | 1.06 | 0.03 | 0.040 | 1.00 | 0.03 | 0.961 | 1.01 | 0.03 | 0.650 | |
| Missing data/not in Germany | – | – | – | |||||||
| % Persons aged 65 + with highest education in all persons 65 + in 2011 | First tertile (lowest) | 1.00 | 1.00 | 1.00 | ||||||
| Second tertile | 0.92 | 0.02 | 0.002 | 0.95 | 0.02 | 0.029 | 0.99 | 0.02 | 0.723 | |
| Third tertile (highest) | 0.90 | 0.02 | < 0.001 | 0.94 | 0.03 | 0.051 | 0.96 | 0.02 | 0.069 | |
| Missing data/not in Germany | – | – | – | |||||||
| Persons per sqkm of total area in 2014 | First tertile (lowest) | 1.00 | 1.00 | 1.00 | ||||||
| Second tertile | 0.95 | 0.02 | 0.042 | 0.98 | 0.03 | 0.394 | 0.99 | 0.03 | 0.738 | |
| Third tertile (highest) | 0.95 | 0.03 | 0.100 | 0.98 | 0.03 | 0.576 | 0.99 | 0.03 | 0.821 | |
| Missing data/not in Germany | – | – | – | |||||||
| % Area in natural state in total area in 2016 | First tertile (lowest) | 1.00 | 1.00 | 1.00 | ||||||
| Second tertile | 1.02 | 0.03 | 0.481 | 0.99 | 0.02 | 0.699 | 0.99 | 0.02 | 0.723 | |
| Third tertile (highest) | 0.99 | 0.03 | 0.577 | 0.95 | 0.02 | 0.043 | 0.96 | 0.02 | 0.069 | |
| Missing data/not in Germany | – | – | – | |||||||
| Remaining life expectancy at age 60 in 2014 | First tertile (lowest) | 1.00 | 1.00 | 1.00 | ||||||
| Second tertile | 0.98 | 0.02 | 0.381 | 1.00 | 0.02 | 0.868 | 1.02 | 0.02 | 0.506 | |
| Third tertile (highest) | 0.87 | 0.02 | < 0.001 | 0.91 | 0.03 | 0.001 | 0.93 | 0.03 | 0.012 | |
| Missing data/not in Germany | – | – | – | |||||||
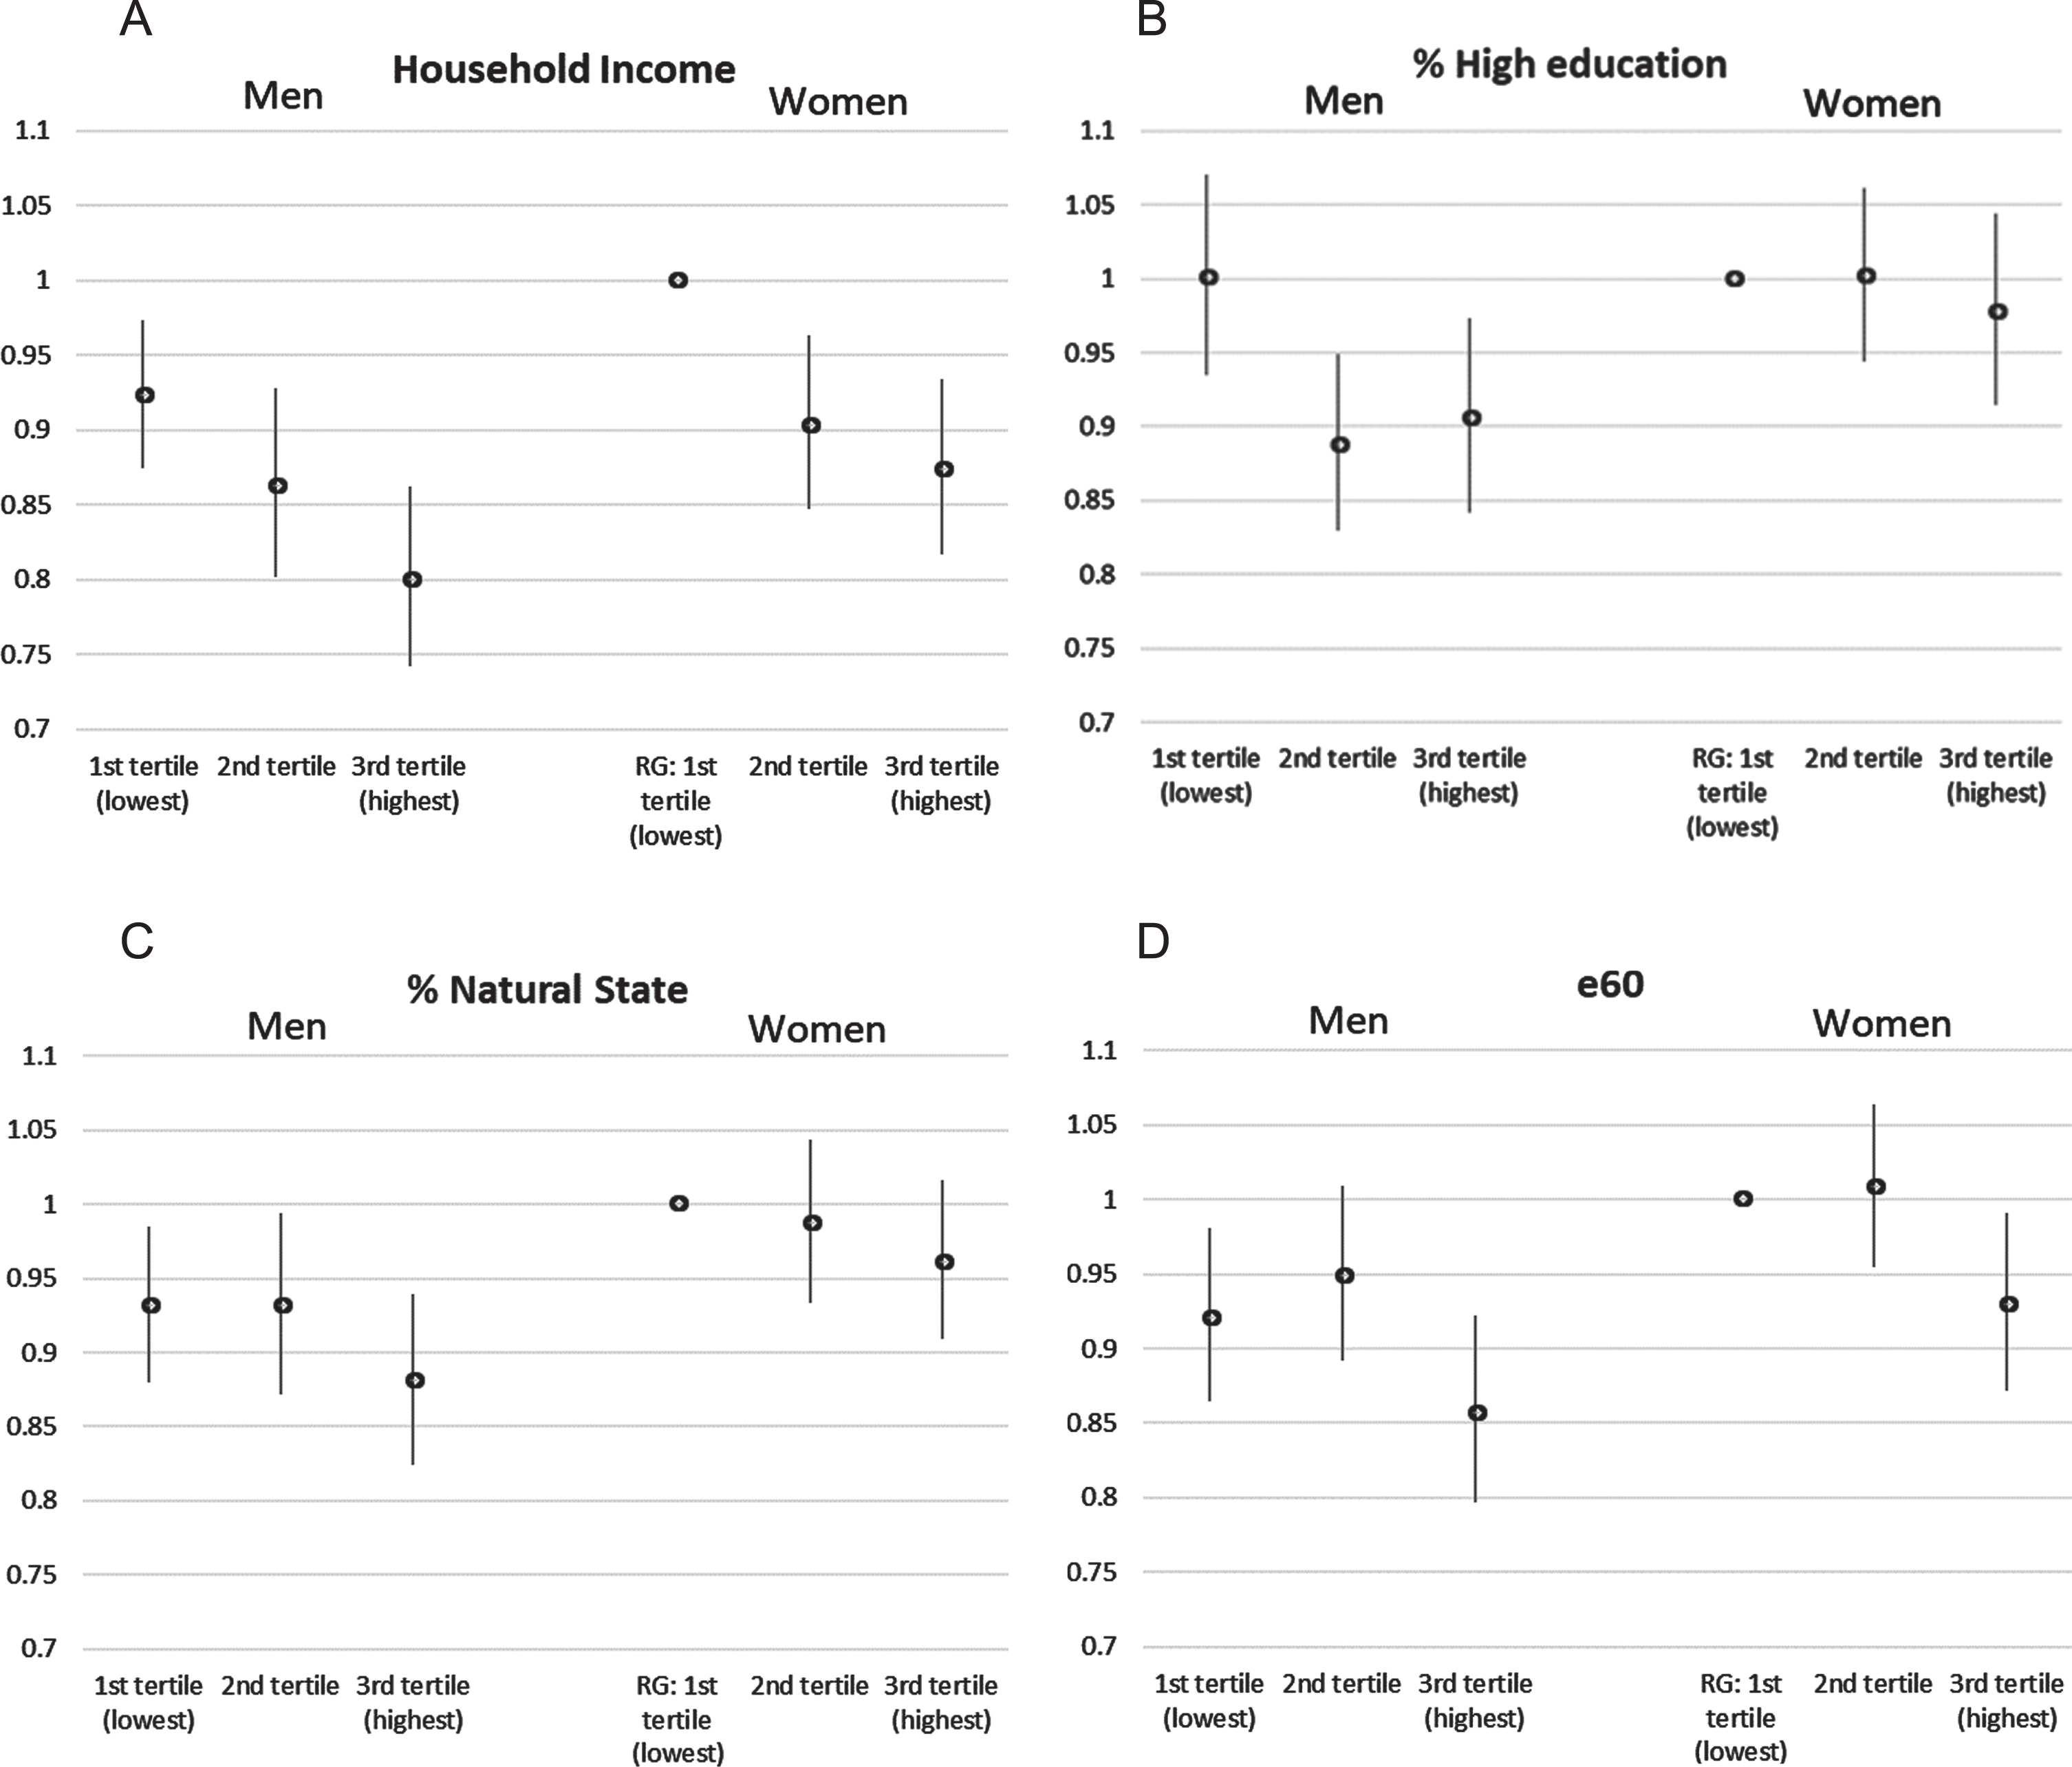
Including an interaction term by sex in Model 3, the social gradient related to household income was significant both in males and females and did not differ significantly between the two (Fig. 2A). The protective effect of high education (Fig. 2B) was highly significant in males (3rd tertile compared to 1st tertile: HR = 0.91, p = 0.015) and the protective effect of e60 (Fig. 2D) was highly significant in females (3rd tertile compared to 1st tertile: HR = 0.93, p = 0.026). The effect of the highest share of area in natural state was borderline significant among males only (HR = 0.94, p = 0.096) when not controlled for multi-morbidity (Supplementary Table 6) but turned insignificant for both sexes (Fig. 2C) when controlled for multi-morbidity (Supplementary Table 8).
Fig. 2
Interaction effects by gender: A) Household income; B) high education, C) natural state, and D) e60, AOK data, 95% -confidence interval, controlled for age, sex, multi-morbidity, relocation, AOK-share, and territory, RG = reference group.
DISCUSSION
To our knowledge, this is the first study to examine sex and gender differences in association with area-level characteristics and incident dementia in a population-based study. Previous studies (Supplementary Table 9) were limited to only urban regions [29, 30], whereas we examined a population broadly representative of the elderly German population, particularly in terms of mortality [35]. Average household income per capita in a region was significantly associated with dementia onset, and the social gradient was similar for both genders, with those living in the most affluent regions at lower risk. The protective effects of high shares of persons in higher education were highly significant only for men and the protective effect of high remaining life expectancy at age 60 were significant only for women. A similar tendency, however, existed for both genders.
Favorable environments in terms of a healthy, high-income population with abundant natural resources may be associated with higher recreational and cultural resources [29], protective lifestyles in terms of physical activity, and more cognitive stimulation, all of which have been shown to reduce cognitive impairment [36].
Although dementia is a disease of old age, the preclinical stage of dementia precludes the disease for years, even decades, before, with middle age and infancy being critical periods. Beginning in utero, favorable environmental conditions have lifelong effects on brain tissue volume and cognitive function [37]. Lower education in early life impairs cognitive reserve [38], and risk factors in midlife and later life affect cognitive reserve and may trigger neuropathological changes [39]. Although we do not have information on risk factors in midlife, our study showed that the number of chronic diseases in old age, which include the major vascular risk factors for dementia, is significantly associated with dementia risk. In addition, we showed that relocation in old age is associated with increased dementia risk. This relocation may be the consequence of poor health –and older people moving to live with their children or in a nursing home [40, 41]—or the relocation may act as a trigger for deteriorating health and cognition [42, 43]. In conclusion, across all age groups, individual risk factors and suboptimal living environments have short- and long-term negative effects on physical health [44] and cognition [45].
Regarding a region’s household income, our results support the findings of previous research [23] in that there is an association between area-socieoconomic status and cognition. However, our study differs from the findings of Letellier and colleagues [29], who found a significant correlation between area deprivation and incident dementia for men only. One reason may be that their study was confined to an urban environment, another that they used a compound indicator of deprivation, which included ten dimensions, among them median household income, unemployment rate, and the proportion without secondary education. Whereas in our study the gross effects of the indicators of unemployment and education were significant, these two dimensions became non-significant once controlled for household income, both for men and women. This is the result of high correlation between the three indicators and supports our approach of using single indicators rather than a composite measure.
Our results on the protective effect of near-natural space support Letellier and colleagues [30], who found that individuals with limited activity space have a higher risk of developing dementia. In our study, this effect is largely attenuated when controlling for multi-morbidity, suggesting that it acts through its influence on overall health. In Germany, much of the near-natural space is accessible for recreational use by the public and thus can be used for physical activities. A recent review showed that more men than women walk in their leisure time at age 60 and older [46], which may explain the findings in the study by Letellier and colleagues [30] that the effect was particularly strong in men living in disadvantaged neighborhoods but was not found in women. Also in our study, the effect of near-natural space was stronger for men and always not significant for women.
It has been shown that people with limited activity space are more likely to be exposed to risk factors of cognitive decline, such as depressive symptoms [47–50]. In addition, near-natural space is associated with lower levels of air pollution, which is associated with a reduction in dementia diagnosis.
In our study, near-natural space is not synonymous with rural space or green space, as it is defined as land that is not used for agriculture or industry (e.g., cliffs and rocks, beach shores, bogs, and marshes). This differs from the definition used by Wu and colleagues [17], which was based on the proportion of green space and private gardens in a neighborhood. In their study, a U-shaped relationship was found between natural environment and cognitive impairment. Our study found no urban versus rural gradient when measured as population density. This supports Wu and colleagues’ [13, 17] findings that land-use is important and that no simple urban-rural gradient exists.
A country’s remaining life expectancy at age 60 is negatively related to dementia incidence, but only in women at a conventional significance level. On the one hand, this result may be indicative of a compression of morbidity, as shown in a previous study of German elderly [51]. On the other hand, it has already been shown that the health profile of a region exerts an independent effect on the individual risk of needing long-term care, with better regional health status being associated with less need for long-term care [52]. In Germany, dementia and the need for long-term care are closely linked [53] and women are at a higher risk for both.
It has been argued that much of the effect of area deprivation can be explained by the individual characteristics of people living in these areas, rather than by the characteristics of the areas themselves [24]. On the other hand, findings from England have documented a link between neighborhood deprivation and cognitive functioning, independent of individual markers of socioeconomic status [21]. In our study, objectively diagnosed multi-morbidity did not attenuate the regional income effect. We included information on multi-morbidity over a four-year period, which did not change the effects of our macro indicators. Multi-morbidity reflects not only health status but also socioeconomic status [54, 55], and we argue that it controls for socioeconomic status differences to some extent in the absence of individual-level health status information. Interestingly, in the absence of multi-morbidity, men have a significantly lower risk of dementia than women, which may be explained by the higher educational attainment of men and the low labor force participation of women in these cohorts [56]. Both are important factors in cognitive reserve [57], which posits that individuals with higher education and challenging professional carers have an initial advantage over individuals with lower education, which they may carry throughout their adult lives. While a higher cognitive reserve does not change the rate of cognitive ageing, these people may start from a higher level of cognitive functioning [58].
Strengths and limitations of the study
Our study has many strengths, but also limitations. One major strength is the use of health claims data. The data cover a high number of individuals with a wide range of diagnoses and combinations of diagnoses registered by physicians in a longitudinal perspective. To further increase the validity of the diagnoses, we reduced the number of false-positive diagnoses by applying the M2Q criterion. In contrast to most other studies, we also included nursing homes in addition to private households.
The longitudinal data design allowed us to observe health history, disease trajectory, and changes in health status without affecting the sample selection of patients and physicians, the type of measurement and diagnosis, the criteria of dementia definition, the quantity of patients’ health care utilization, and the quality of documentation by physicians. The data do not suffer from reactivity bias (e.g., social desirability), any type of response bias, cognitive bias (e.g., recall bias or overconfidence bias), selective attrition (e.g., change of health insurance, which is rare at old age), or relocation-related selection bias because health insurance is usually retained even if the insurant moves to a new residence. The latter is particularly important, as evidenced by the high incidence of dementia among those who moved in our study. We assume only a marginal direct social selection bias of access to health care services, because the German statutory health insurance allows regular visits to a general practitioner at no cost for the patients. Due to the large sample size and the inclusion of five-digit postal codes, we were able to complement and analyze the effects of macro factors at a comparatively small regional level. The regional macro factors are of high quality because they were collected and harmonized by an administrative institution and are based on established and reliable data sources and measurements. We selected six indicators from the large, diverse, and publicly available INKAR database, considering a variation of different dimensions and aspects of regional characteristics. The selection criterion was comparability, variability between regions, and multidimensionality with respect to the different characteristics. Using multilevel survival regression models, we were able to estimate the simultaneous effects of individual and macro-level factors, taking hierarchical dependencies into account.
However, our study has limitations. Most importantly, the data do not include information on the diagnostic measures used, the experience level of physicians, the socioeconomic status and lifestyle of individuals, or the health history of individuals before 2014 or after 2019. Consequently, effects of advancing or postponing dementia and undocumented or false-negative diagnoses remained unobserved. Another issue is the definition of dementia. We used ICD-10 codes that were officially reported to the health insurance company by physicians. We have no information on the accuracy and appropriateness of the diagnosis measurement, definition, and reporting quality used by physicians.
We had no way to validate the diagnoses externally. However, in previous analyses, we compared dementia incidence and prevalence from German claims data with results from international epidemiological studies and found that the age-specific profiles fit well [56, 59]. A U.S. study comparing dementia determined from survey-based cognitive tests with dementia diagnosis from Medicare claims arrived at similar population-level prevalence estimates [60], and in Sweden there were very few cases of dementia patients in the National Patient Registry who did not score respectively on cognitive tests [61]. We do not differentiate dementia by etiology because approximately 45% of diagnoses are categorized as unspecified dementia (F03), and even among specified diagnoses, there may be a large proportion of misclassifications [61]. Methodological limitations relate to 1) the selection of regional indicators and 2) individual risk factors. Although we selected six different macro factors, there may be more (latent) dimensions (e.g., regional-cultural norms, health behaviors, lifestyle, socio-political history) associated with dementia occurrence. In addition, regional indicators are limited to late stage of life and do not capture environmental influences during the life course. This is similar to the studies cited in the Background section, which primarily focus on the elderly and in which, with few exceptions, external environmental indicators are mainly tied to one point in time (see Supplementary Table 1). The selection of individual-level risk factors was severely constrained by limitations of the registered data. Several risk factors known from the literature, such as socioeconomic status, genetic predisposition, physical activity, diet, and alcohol and tobacco use, were not included in the data and therefore we could not control for them. This limitation is directly related to a possible insurance selection bias. While our results are representative of the entire AOK population, previous studies have shown that AOK members on average have a lower socioeconomic status and are older [35, 62], and as a result thy are unhealthier than the overall German population. To reduce this potential bias, we adjusted the models for age, for multi-morbidity, and for the proportion of AOK members within a region.
Conclusion
Living in low-income areas is detrimental to the mental health of both men and women in terms of higher dementia risk. We do not confirm previous studies which found an effect only for men, instead we show that women also suffer from low-income environments. We confirm that a nature-based environment allowing free physical activity for the entire population is associated with a lower risk of dementia, and our results suggest that this effect is mainly due to an improvement in health in general; the effect seems to be stronger in men. On the other hand, women appear to profit more from the overall health status among the elderly of a region, as measured by life expectancy at age 60. Our findings suggest that both men and women living in low-income neighborhoods should be targeted for dementia prevention. In addition, further studies are needed to examine whether the gendered effect of nature-based space is related to differences in lifestyle, with women engaging more in social activities and men engaging more in physical activities. Finally, further studies need to examine health resources related to regional long-term care provision and the medical system, which influence life expectancy and seem to be particularly important for women.
ACKNOWLEDGMENTS
We are grateful to Christian Günster from the Scientific Research Institute of the AOK, WIdO, for providing the data, Anne Fink for her support in data preparation, and Anna-Victoria Holtz for her support in preparing the bibliography.
Authors’ disclosures available online (https://www.j-alz.com/manuscript-disclosures/21-5030r2).
SUPPLEMENTARY MATERIAL
{ label (or @symbol) needed for fn } The supplementary material is available in the electronic version of this article: https://dx.doi.org/10.3233/JAD-215030.
REFERENCES
[1] | Prince M , Ali G-C , Guerchet M , Prina AM ((2015) ) World Alzheimer Report 2015. The Global Impact of Dementia: An analysis of prevalence, incidence, cost and trends. Alzheimer’s Disease International, London. |
[2] | Shah H , Albanese E , Duggan C , Rudan I , Langa KM , Carrillo MC , Chan KY , Joanette Y , Prince M , Rossor M , Saxena S , Snyder HM , Sperling R , Varghese M , Wang H , Wortmann M , Dua T ((2016) ) Research priorities to reduce the global burden of dementia by 2025. Lancet Neurol 15: , 1285–1294. |
[3] | OksuzyanA, GumaJ, DoblhammerG ((2018) ) Sex differences in health and survival. In: A Demographic Perspective on Gender, Family and Health in Europe, DoblhammerG, GumàJ, eds., Springer International Publishing AG, Cham, pp. 65–100. |
[4] | Fratiglioni L , Viitanen M , Strauss von E , Tontodonati V , Herlitz A , Winblad B ((1997) ) Very old women at highest risk of dementia andAlzheimer’s disease: Incidence data from the Kungsholmen Project, Stockholm. Neurology 48: , 132–138. |
[5] | Letenneur L , Gilleron V , Commenges D , Helmer C , Orgogozo J-M , Dartigues J-F ((1999) ) Are sex and educational level independent predictors of dementia and Alzheimer’s disease? Incidence data from the PAQUID project. J Neurol Neurosurg Psychiatry 66: , 177–183. |
[6] | Edland SD , Rocca WA , Petersen RC , Cha RH , Kokmen E ((2002) ) Dementia and Alzheimer disease incidence rates do not vary by sex in Rochester, Minn. Arch Neurol 59: , 1589–1593. |
[7] | Giacobini E , Pepeu G ((2018) ) Sex and gender differences in the brain cholinergic system and in the response to therapy of Alzheimer disease with cholinesterase inhibitors. Curr Alzheimer Res 15: , 1077–1084. |
[8] | Karp A , Kåreholt I , Qiu C , Bellander T , Winblad B , Fratiglioni L ((2004) ) Relation of education and occupation-based socioeconomic status to incident Alzheimer’s disease. Am J Epidemiol 159: , 175–183. |
[9] | Pankratz VS , Roberts RO , Mielke MM , Knopman DS , Jack CR , Geda YE , Rocca WA , Petersen RC ((2015) ) Predicting the risk of mild cognitive impairment in the Mayo Clinic Study of Aging. Neurology 84: , 1433–1442. |
[10] | Epperson CN , Sammel MD , Freeman EW ((2013) ) Menopause effects onverbal memory: Findings from a longitudinal community cohort. JClin Endocrinol Metab 98: , 3829–3838. |
[11] | Rocca WA , Grossardt BR , Shuster LT ((2011) ) Oophorectomy, menopause,estrogen treatment, and cognitive aging: Clinical evidence for awindow of opportunity. Brain Res 1379: , 188–198. |
[12] | Glass TA , Balfour JL ((2003) ) Neighborhoods, aging, and functional limitations. In Neighborhoods and Health, KawachiI, BerkmanLF, eds., Oxford University Press, pp. 303–334. |
[13] | Wu Y-T , Prina AM , Jones AP , Barnes LE , Matthews FE , Brayne C ((2015) ) Community environment, cognitive impairment and dementia in laterlife: Results from the Cognitive Function and Ageing Study. AgeAgeing 44: , 1005–1011. |
[14] | Stafford M , Cummins S , Macintyre S , Ellaway A , Marmot M ((2005) ) Gender differences in the associations between health and neighbourhood environment. Soc Sci Med 60: , 1681–1692. |
[15] | Matheson FI , White HL , Moineddin R , Dunn JR , Glazier RH ((2010) ) Neighbourhood chronic stress and gender inequalities in hypertensionamong Canadian adults: A multilevel analysis. J EpidemiolCommunity Health 64: , 705–713. |
[16] | Clarke PJ , Weuve J , Barnes L , Evans DA , Mendes de Leon CF ((2015) ) Cognitive decline and the neighborhood environment. Ann Epidemiol 25: , 849–854. |
[17] | Wu Y-T , Prina AM , Jones A , Matthews FE , Brayne C ((2017) ) The builtenvironment and cognitive disorders: Results from the CognitiveFunction and Ageing Study II. Am J Prev Med 53: , 25–32. |
[18] | Keijzer de C , Tonne C , Basagaña X , Valentín A , Singh-Manoux A , Alonso J , Antó JM , Nieuwenhuijsen MJ , Sunyer J , Dadvand P ((2018) ) Residential surrounding greenness and cognitive decline: A10-year follow-up of the Whitehall II Cohort. Environ HealthPerspect 126: , 77003. |
[19] | Zhang W , Liu S , Sun F , Dong X ((2019) ) Neighborhood social cohesion and cognitive function in U.S. Chinese older adults-findings from the PINE study. Aging Ment Health 23: , 1113–1121. |
[20] | Wee LE , Yeo WX , Yang GR , Hannan N , Lim K , Chua C , Tan MY , Fong N , Yeap A , Chen L , Koh GC-H , Shen HM ((2012) ) Individual and area level socioeconomic status and its association with cognitive function and cognitive impairment (low MMSE) among community-dwelling elderly in Singapore. Dement Geriatr Cogn Disord Extra 2: , 529–542. |
[21] | Lang IA , Llewellyn DJ , Langa KM , Wallace RB , Huppert FA , Melzer D ((2008) ) Neighborhood deprivation, individual socioeconomic status,and cognitive function in older people: Analyses from the EnglishLongitudinal Study of Ageing. J Am Geriatr Soc 56: , 191–198. |
[22] | Shih RA , Ghosh-Dastidar B , Margolis KL , Slaughter ME , Jewell A , Bird CE , Eibner C , Denburg NL , Ockene J , Messina CR , Espeland MA ((2011) ) Neighborhood socioeconomic status and cognitive function in women. Am J Public Health 101: , 1721–1728. |
[23] | Besser LM , McDonald NC , Song Y , Kukull WA , Rodriguez DA ((2017) ) Neighborhood environment and cognition in older adults: A systematicreview. Am J Prev Med 53: , 241–251. |
[24] | Cadar D , Lassale C , Davies H , Llewellyn DJ , Batty GD , Steptoe A ((2018) ) Individual and area-based socioeconomic factors associatedwith dementia incidence in England: Evidence from a 12-yearfollow-up in the English Longitudinal Study of Ageing. JAMAPsychiatry 75: , 723–732. |
[25] | Ouvrard C , Meillon C , Dartigues J-F , Ávila-Funes JA , Amieva H ((2020) ) Do individual and geographical deprivation have the sameimpact on the risk of dementia? A 25-year follow-up study. JGerontol B Psychol Sci Soc Sci 75: , 218–227. |
[26] | McCann A , McNulty H , Rigby J , Hughes CF , Hoey L , Molloy AM , Cunningham CJ , Casey MC , Tracey F , O’Kane MJ , McCarroll K , Ward M , Moore K , Strain JJ , Moore A ((2018) ) Effect of area-level socioeconomic deprivation on risk of cognitive dysfunction in older adults. J Am Geriatr Soc 66: , 1269–1275. |
[27] | Zuelsdorff M , Larson JL , Hunt JFV , Kim AJ , Koscik RL , Buckingham WR , Gleason CE , Johnson SC , Asthana S , Rissman RA , Bendlin BB , Kind AJH ((2020) ) The Area Deprivation Index: A novel tool for harmonizable risk assessment in Alzheimer’s disease research. Alzheimers Dement 6: , e12039. |
[28] | Russ TC , Batty GD , Hearnshaw GF , Fenton C , Starr JM ((2012) ) Geographical variation in dementia: Systematic review withmeta-analysis. Int J Epidemiol 41: , 1012–1032. |
[29] | Letellier N , Gutierrez L-A , Carrière I , Gabelle A , Dartigues J-F , Dufouil C , Helmer C , Cadot E , Berr C ((2018) ) Sex-specific association between neighborhood characteristics and dementia: The Three-City cohort. Alzheimers Dement 14: , 473–482. |
[30] | Letellier N , Carrière I , Gutierrez L-A , Gabelle A , Dartigues J-F , Dufouil C , Helmer C , Cadot E , Berr C ((2019) ) Influence ofactivity space on the association between neighborhoodcharacteristics and dementia risk: Results from the 3-City studycohort. BMC Geriatr 19: , 4. |
[31] | Mossialos E , Wenzl M , Osborn R , Anderson C (2015) International profiles of health care systems, 2014, https://www.commonwealthfund.org/sites/default/files/documents/___media_files_publications_fund_report_2015_jan_1802_mossialos_intl_profiles_2014_v7.pdf, Accessed November 24, 2021. |
[32] | McGuire TG , van Kleef R , eds. ((2018) ) Risk adjustment, risk sharing and premium regulation in health insurance markets: Theory and practice, Academic Press, an imprint of Elsevier, London, United Kingdom. |
[33] | Charlson ME , Pompei P , Ales KL , MacKenzie CR ((1987) ) A new method of classifying prognostic comorbidity in longitudinal studies: Development and validation. J Chronic Dis 40: , 373–383. |
[34] | Crowther MJ ((2019) ) Multilevel mixed-effects parametric survival analysis: Estimation, simulation, and application. Stata J 19: , 931–949. |
[35] | Fink A ((2015) ) Dementia and long-term care –an analysis based on German health insurance data. In Health among the elderly in Germany: Newevidence on disease, disability and care need, Doblhammer G, ed., Barbara Budrich Publishers, Opladen, Germany, pp. 139–156. |
[36] | Plassman BL , Williams JW , Burke JR , Holsinger T , Benjamin S ((2010) ) Systematic review: Factors associated with risk for and possibleprevention of cognitive decline in later life. Ann Intern Med 153: , 182–193. |
[37] | Muller M , Sigurdsson S , Kjartansson O , Jonsson PV , Garcia M , Bonsdorff MB von , Gunnarsdottir I , Thorsdottir I , Harris TB , van Buchem M ((2014) ) Birth size and brain function 75 years later. Pediatrics 134: , 761–770. |
[38] | Stern Y ((2009) ) Cognitive reserve. Neuropsychologia 47: , 2015–2028. |
[39] | Livingston G , Huntley J , Sommerlad A , Ames D , Ballard C , Banerjee S , Brayne C , Burns A , Cohen-Mansfield J , Cooper C ((2020) ) Dementia prevention, intervention, and care: 2020 report of the Lancet Commission. Lancet 396: , 413–446. |
[40] | Luppa M , Gentzsch K , Angermeyer MC , Weyerer S , König H-H , Riedel-Heller SG ((2010) ) Gender-specific predictors of institutionalisation in the elderly–results of the Leipzig longitudinal study of the aged (LEILA 75+). Psychiatrische Praxis 38: , 185–189. |
[41] | Runte R ((2018) ) Predictors of institutionalization in people withdementia: A survey linked with administrative data. Aging ClinExp Res 30: , 35–43. |
[42] | Oswald F , Rowles GD ((2017) ) Beyond the relocation trauma in old age: New trends in elders’ residential decisions. In New Dynamics in Old Age Individual, Environmental, and Societal Perspectives, Routledge, pp. 127–152. |
[43] | Brownie S , Horstmanshof L , Garbutt R ((2014) ) Factors that impact residents’ transition and psychological adjustment to long-term aged care: A systematic literature review. Int J Nurs Stud 51: , 1654–1666. |
[44] | Aretz B , Doblhammer G , Janssen F ((2019) ) Effects of changes in livingenvironment on physical health: A prospective German cohort study ofnon-movers. Eur J Public Health 29: , 1147–1153. |
[45] | Aretz B , Janssen F , Vonk JM , Heneka MT , Boezen HM , Doblhammer G ((2021) ) Long-term exposure to fine particulate matter, lung function and cognitive performance: A prospective Dutch cohort study on the underlying routes. Environ Res 201: , 111533. |
[46] | Pollard TM , Wagnild JM ((2017) ) Gender differences in walking (forleisure, transport and in total) across adult life: A systematicreview. BMC Public Health 17: , 341. |
[47] | Vallée J , Cadot E , Roustit C , Parizot I , Chauvin P ((2011) ) The role of daily mobility in mental health inequalities: Theinteractive influence of activity space and neighbourhood ofresidence on depression. Soc Sci Med 73: , 1133–1144. |
[48] | Polku H , Mikkola TM , Portegijs E , Rantakokko M , Kokko K , Kauppinen M , Rantanen T , Viljanen A ((2015) ) Life-space mobility and dimensions of depressive symptoms among community-dwelling older adults. Aging Ment Health 19: , 781–789. |
[49] | Liu C-C , Sun Y , Kung S-F , Kuo H-W , Huang N-C , Li C-Y , Hu SC ((2020) ) Effects of physical and social environments on the risk of dementiaamong Taiwanese older adults: A population-based case-control study. BMC Geriatr 20: , 226. |
[50] | Carey IM , Anderson HR , Atkinson RW , Beevers SD , Cook DG , Strachan DP , Dajnak D , Gulliver J , Kelly FJ ((2018) ) Are noise and air pollution related to the incidence of dementia? A cohort study in London, England. BMJ Open 8: , e022404. |
[51] | Kreft D , Doblhammer G ((2016) ) Expansion or compression of long-term care in Germany between 2001 and 2009? A small-area decomposition study based on administrative health data. Popul Health Metr 14: , 24. |
[52] | Kreft D ((2015) ) Spatial patterns in German long-term care and their relationship with socioeconomic factors. In Health among the elderly in Germany: New evidence on disease, disability and care need, Doblhammer G, ed., Barbara Budrich Publishers, Opladen, Germany. |
[53] | Fink A , Doblhammer G ((2015) ) Risk of long-term care dependence fordementia patients is associated with type of physician: An analysisof German health claims data for the years 2006 to 2010. JAlzheimers Dis 47: , 443–452. |
[54] | Tetzlaff J , Epping J , Sperlich S , Eberhard S , Stahmeyer JT , Geyer S ((2018) ) Widening inequalities in multimorbidity? Time trends among the working population between 2005 and 2015 based on German health insurance data. Int J Equity Health 17: , 103. |
[55] | Letellier N , Ilango SD , Mortamais M , Tzourio C , Gabelle A , Empana J-P , Samieri C , Berr C , Benmarhnia T ((2021) ) Socioeconomicinequalities in dementia risk among a French population-basedcohort: Quantifying the role of cardiovascular health and vascularevents. Eur J Epidemiol 36: , 1015–1023. |
[56] | Doblhammer G , Fink A , Fritze T ((2015) ) Short-term trends in dementia prevalence in Germany between the years 2007 and 2009. Alzheimers Dement 11: , 291–299. |
[57] | Barulli D , Stern Y ((2013) ) Efficiency, capacity, compensation,maintenance, plasticity: Emerging concepts in cognitive reserve. Trends Cogn Sci 17: , 502–509. |
[58] | Nyberg L , Magnussen F , Lundquist A , Baaré W , Bartrés-Faz D , Bertram L , Boraxbekk CJ , Brandmaier AM , Drevon CA , Ebmeier K , Ghisletta P , Henson RN , Junqué C , Kievit R , Kleemeyer M , Knights E , Kühn S , Lindenberger U , Penninx BWJH , Pudas S , Sørensen Ø , Vaqué-Alcázar L , Walhovd KB , Fjell AM ((2021) ) Educational attainment does not influence brain aging. Proc Natl Acad Sci U S A 118: , e2101644118. |
[59] | Doblhammer G , Fink A , Zylla S , Willekens F ((2015) ) Compression or expansion of dementia in Germany? An observational study of short-term trends in incidence and death rates of dementia between 2006/07 and 2009/10 based on German health insurance data. Alzheimers Res Ther 7: , 66. |
[60] | Chen Y , Tysinger B , Crimmins E , Zissimopoulos JM ((2019) ) Analysis ofdementia in the US population using Medicare claims: Insights fromlinked survey and administrative claims data. Alzheimers Dement(N Y) 5: , 197–207. |
[61] | Rizzuto D , Feldman AL , Karlsson IK , Dahl Aslan AK , Gatz M , Pedersen NL ((2018) ) Detection of dementia cases in two Swedish healthregisters: A validation study. J Alzheimers Dis 61: , 1301–1310. |
[62] | Hoffmann F , Koller D ((2017) ) Verschiedene Regionen, verschiedene Versichertenpopulationen? Soziodemografische und gesundheitsbezogene Unterschiede zwischen Krankenkassen. Gesundheitswesen 79: , 9. |
Notes
1 Area in natural state was defined as quarrying land, moorland, heathland, and undeveloped land (such as mountains and dunes).
2 Long-term was defined as one year or longer.


