
Automatic Prediction of Cognitive and Functional Decline Can Significantly Decrease the Number of Subjects Required for Clinical Trials in Early Alzheimer’s Disease
Abstract
Background:
While both cognitive and magnetic resonance imaging (MRI) data has been used to predict progression in Alzheimer’s disease, heterogeneity between patients makes it challenging to predict the rate of cognitive and functional decline for individual subjects.
Objective:
To investigate prognostic power of MRI-based biomarkers of medial temporal lobe atrophy and macroscopic tissue change to predict cognitive decline in individual patients in clinical trials of early Alzheimer’s disease.
Methods:
Data used in this study included 312 patients with mild cognitive impairment from the ADNI dataset with baseline MRI, cerebrospinal fluid amyloid-β, cognitive test scores, and a minimum of two-year follow-up information available. We built a prognostic model using baseline cognitive scores and MRI-based features to determine which subjects remain stable and which functionally decline over 2 and 3-year follow-up periods.
Results:
Combining both sets of features yields 77%accuracy (81%sensitivity and 75%specificity) to predict cognitive decline at 2 years (74%accuracy at 3 years with 75%sensitivity and 73%specificity). When used to select trial participants, this tool yields a 3.8-fold decrease in the required sample size for a 2-year study (2.8-fold decrease for a 3-year study) for a hypothesized 25%treatment effect to reduce cognitive decline.
Conclusion:
When used in clinical trials for cohort enrichment, this tool could accelerate development of new treatments by significantly increasing statistical power to detect differences in cognitive decline between arms. In addition, detection of future decline can help clinicians improve patient management strategies that will slow or delay symptom progression.
INTRODUCTION
Alzheimer’s disease (AD) is a neurodegenerative disorder characterized by abnormal accumulation of amyloid-β (Aβ) and intracellular neurofibrillary tangles in the brain resulting in progressive synaptic dysfunction, irreversible neuronal loss, and cognitive deficits [1, 2]. This pathological process gradually develops over many years, with a long asymptomatic phase before a clinical diagnosis of AD [3]. Patients in the early stages of AD dementia are not a monolithic bloc. Some experience decline in their cognitive abilities at different rates, with some patients progressing very fast while a large portion of patients remain stable [4, 5]. This heterogeneity increases the complexity of treatment development. After numerous failures of candidate drugs for dementia due to AD, the field has moved toward clinical trials at an earlier stage (mild cognitive impairment (MCI) with proven AD biomarkers) [6, 7]. However, even recent trials in amyloid positive patients with MCI do not factor the marked inter-individual differences in rates of progression in subjects with MCI, which can have a profound effect on the outcome of trials [8]. Recent clinical trial results have shown that inter-individual differences in speed of progression can have a major impact on the achievement of primary aims, and can leave uncertainty about the true efficacy of putative treatments [9]. Accurately predicting the progression rate in individual patients with mild cognitive impairment and mild dementia due to AD would enable the enrichment of patient populations in clinical trials by increasing the mean cognitive/functional decline over the trial duration, and therefore facilitating the demonstration of the treatment effect (or the absence of treatment effect). This in turn could lead to potentially faster, more efficient candidate drug testing.
In order to be generalizable to the population after drug approval, tools to predict future progression in MCI would have to be based on readily available measures in clinical practice, such as brain MRI and cognitive tests. Indeed, AD is associated with a stereotypical pattern of early cerebral atrophy in the medial temporal lobe limbic regions including entorhinal cortex (EC) and hippocampus (HC) [1]. The early degeneration in medial temporal lobe limbic structures consistent with early memory deficits provides the anatomical basis to use MRI-based measures of atrophy as valid markers of disease state and progression [10, 11].
We have previously developed Scoring by Nonlocal Image Patch Estimator (SNIPE) as a grading metric to measure AD-related structural alterations in brain anatomy, with applications to both hippocampal and entorhinal structures [12]. Based on this nonlocal patch-based framework, SNIPE estimates the structural similarity of a new subject under study to a number of templates present in a training library consisting of cognitively normal subjects and patients with AD. In our previous work, we showed that baseline SNIPE scores could differentiate patients with MCI that remain stable versus those that progress to AD [13], and that baseline SNIPE scores enable AD prediction in a group of cognitively intact subjects seven years before the clinical diagnosis of AD dementia [14]. More recently, we demonstrated that combining MRI features and neurocognitive test results at baseline could yield 78%accuracy in prediction of conversion from MCI to AD at 2 and 3 years before diagnosis of AD (and up to 87%accuracy, five years before diagnosis) [15].
While these results were promising, conversion to AD as a categorical diagnosis may be too late an event when testing new neuroprotective therapies. In this study, we investigated the ability of our models to predict cognitive and functional decline (as opposed to categorical change in diagnosis from MCI to mild dementia) in a cohort of patients with mild AD similar to those chosen for recent clinical trials [16, 17]. Using only baseline cognitive test results and baseline MR-driven features, we evaluate the accuracy, sensitivity, and specificity of our model to predict decline over two- and three-year follow-up periods, durations commonly used in clinical trials. Functional decline is defined as an increase in global Clinical Dementia Rating-Sum of boxes (CDR-SB) score [18]. Finally, we evaluate the potential use of our proposed technique as a screening tool for enrichment in clinical trials targeting patients likely to experience cognitive decline in near future.
METHODS
Dataset
Data used in the preparation of this article were obtained from the Alzheimer’s Disease Neuroimaging Initiative (ADNI) database (http://adni.loni.usc.edu). The ADNI was launched in 2003 as a public-private partnership, led by Principal Investigator Michael W. Weiner, MD. The primary goal of ADNI has been to test whether serial MRI, positron emission tomography (PET), other biological markers, and clinical and neuropsychological assessment can be combined to measure the progression of MCI and early AD.
In this work, we selected subjects with mild AD from ADNI study for which T1 MRI data and Montreal Cognitive Assessment (MoCA) scores were available at baseline. All subjects provided informed consent and the protocol was approved by the institution review board at all sites. The inclusion of MoCA limited this study to ADNI2 and ADNI-GO datasets, since this measurement was not included in ADNI1 dataset. The key inclusion criteria here are similar to those used for current clinical trials of AD in amnestic MCI cohorts: 1) A CDR-Global Score of 0.5, 2) A Mini-Mental State Examination (MMSE) score between 24 and 30 (inclusive), and 3) having a positive amyloid PET scan with a cut-off of 0.79 SUVr for positivity. Application of these criteria reduced the number of subjects available at baseline in ADNI2 and ADNI-GO to 312. These subjects were labeled as either stable or progressive based on a 2-point increase [19] in their global CDR-SB score from a total possible of 18 points [18]. Here, we refer to the stable and progressive mild AD subjects as pMCI and sMCI, respectively.
Table 1
Dataset Information
| 2 years follow-up | 3 years follow-up | |
| pMCI | 55 | 63 |
| sMCI | 155 | 108 |
| pMCI:sMCI ratio | 0.355 | 0.583 |
| Age at baseline | 72.5±6.7 | 71.9±6.6 |
| %Male | 54.3 | 55.6 |
Preprocessing
All the selected T1 MR images were preprocessed using a fully automatic pipeline. This pipeline includes denoising [20], correction of intensity inhomogeneity using N3 [21], and intensity normalization. MRI scans were then registered to pseudo-Talairach stereotaxic space [22, 23] using a population-specific template [24]. Brain extraction was then performed using BEaST [25].
MRI features: SNIPE scoring
To automatically segment HC and EC, a multi-template non-local patch-based method has been used [26]. This method uses a set of MRI volumes with manually segmented HC and EC as training library. The target patch is then weighted based on how much it resembles each patch in the training dataset. The final label of the patch (targeted structure or background) was assigned based on a weighted average of all similar patches.
The SNIPE grading or scoring of the HC and EC is then achieved by estimating the patch similarity of the subject under study to different training populations: normal controls and patients with AD dementia [12, 13]. Following the same linear regression method used in [27], SNIPE scores are corrected for age and sex based on the normal control population. Visual quality control was performed on all processed MR datasets.
Classification
Our feature set contains age, sex, cognitive test scores including Alzheimer’s Disease Assessment Scale (ADAS), MoCA, Rey Auditory Verbal Learning Task (RAVLT), MMSE, and MR-based z-scored features (SNIPE scores for HC and EC) from baseline data that are used as input to the classifier.
Since the number of sMCI and pMCI subjects were not the same, and standard methods may have difficulty with such imbalanced data, we used a balanced random forest algorithm to train our predictive model [28]. This method down-samples the majority class and trains the trees of the random forest based on a more balanced data set.
We trained our prognostic model using different combinations of features drawn from baseline visits. These classifiers were trained either using MRI-driven SNIPE scores and age, neurocognitive scores and age, or a combination of both SNIPE and neurocognitive scores plus age, and each model was validated using 10-fold cross-validation. The classification performance for both follow-up periods (i.e., 2 and 3 years) was evaluated based on the measured sensitivity, specificity, and accuracy.
Power analysis
Following the method used in [29], we estimated the required sample size to detect a reduction in the mean annual rate of cognitive decline based on CDR-SB score. This method assumes that rates of decline are linear for each subject. We used a two-sided test and set the standard significance level to 0.05 with a power of 80%. The required sample size per arm was estimated using the following formula [30]:
(1)
Where α and 1-β are the significance level and power and
We estimated and compared sample sizes for two groups of subjects. First, using data from all the mild AD subjects in the ADNI dataset that fit the selection criteria above (n = 312), i.e., the unenriched group. Second, using only the subset of those ADNI MCI subjects identified as pMCI using baseline data and the classifier described above (n = 64 for 2 years), i.e., the enriched group.
RESULTS
Prediction accuracy, sensitivity, and specificity
To assess how different features affect prediction accuracy, we trained models with different combinations of features. Table 2 shows the classification performance in terms of sensitivity, specificity, and accuracy, for all the models trained in this study, for 2- and 3-year follow up periods. Using hippocampal grading scores in addition to MoCA, ADAS13, and MMSE, yields the highest accuracy in predicting cognitive decline at 2 years. Comparing results between the classifier using only the baseline cognitive score and the corresponding classifier with the added MRI features showed that for both follow up periods, the accuracy of prediction is increased when adding MRI features. Results also showed that pMCI and sMCI groups did not have significantly different age at baseline for the 2- or 3-year analysis.
Table 2
Classifier performances
| 2-year follow-up | 3-year follow-up | |||||
| Feature sets (including Age) | Sen (%) | Spec (%) | Acc (%) | Sen (%) | Spec (%) | Acc (%) |
| MoCA | 72.1±2.1 | 62.6±1.9 | 65.3±1.5 | 59.4±2.1 | 60.7±1.5 | 60.2±1.2 |
| ADAS13 | 71.2±2.5 | 71.3±1.6 | 71.3±1.3 | 67.4±0.9 | 68.3±2.0 | 68.8±1.4 |
| MoCA, ADAS13 | 74.8±2.4 | 74.7±1.2 | 74.7±1.1 | 66.4±1.8 | 70.6±1.7 | 70.4±1.3 |
| MoCA, ADAS13, MMSE | 76.5±1.5 | 75.7±1.3 | 75.9±1.0 | 65.2±1.9 | 70.4±1.5 | 70.8±1.2 |
| MoCA, ADAS13, MMSE, RAVLT | 76.1±2.1 | 74.8±1.2 | 75.2±0.9 | 66.3±1.8 | 69.3±1.6 | 71.0±1.3 |
| HC, EC | 76.2±2.1 | 70.1±1.3 | 71.7±1.1 | 75.1±1.9 | 68.9±1.4 | 71.0±1.3 |
| HC, ADAS13 | 78.8±1.3 | 73.6±1.2 | 74.7±1.2 | 75.7±1.6 | 70.7±1.4 | 72.6±1.1 |
| HC, MoCA | 75.9±2.4 | 72.4±1.4 | 73.2±1.2 | 71.6±2.0 | 67.3±1.2 | 69.0±0.9 |
| HC, EC, ADAS13 | 81.0±2.2 | 74.2±1.1 | 75.9±1.1 | 75.4±1.7 | 71.6±1.3 | 73.4±1.1 |
| HC, MoCA, ADAS13 | 80.4±1.6 | 74.3±1.1 | 75.8±0.9 | 75.4±2.2 | 70.7±1.2 | 72.8±1.1 |
| HC, EC, MoCA, ADAS13 | 80.2±2.1 | 75.0±0.8 | 76.7±0.7 | 74.9±2.4 | 73.0±1.4 | 74.0±1.2 |
| HC, MoCA, ADAS13, MMSE | 81.3±1.8 | 74.7±1.1 | 76.9±0.9 | 74.4±1.3 | 71.3±1.4 | 73.3±1.2 |
| HC, EC, MoCA, ADAS13, MMSE | 79.5±1.9 | 74.6±1.1 | 75.9±1.0 | 75.2±1.8 | 72.3±1.3 | 73.2±1.2 |
Power analysis
Table 3 summarizes the CDR-SB values for the unenriched and enriched MCI cohorts that met the inclusion criteria described in the Methods and that were used to complete the power analysis.
Table 3
CDR-SB values
| Baseline mean (std dev) | Year 1 mean (std dev) | Year 2 mean (std dev) | Year 3 mean (std dev) | |
| unenriched MCI | 1.631 (0.935) | 1.956 (1.457) | 2.356 (2.107) | 2.866 (2.978) |
| enriched MCI (2 y) | 1.924 (0.875) | 2.68 (1.325) | 4.084 (2.504) | – |
| enriched MCI (3 y) | 1.851 (0.874) | 2.559 (1.359) | 3.869 (2.639) | 5.094 (3.788) |
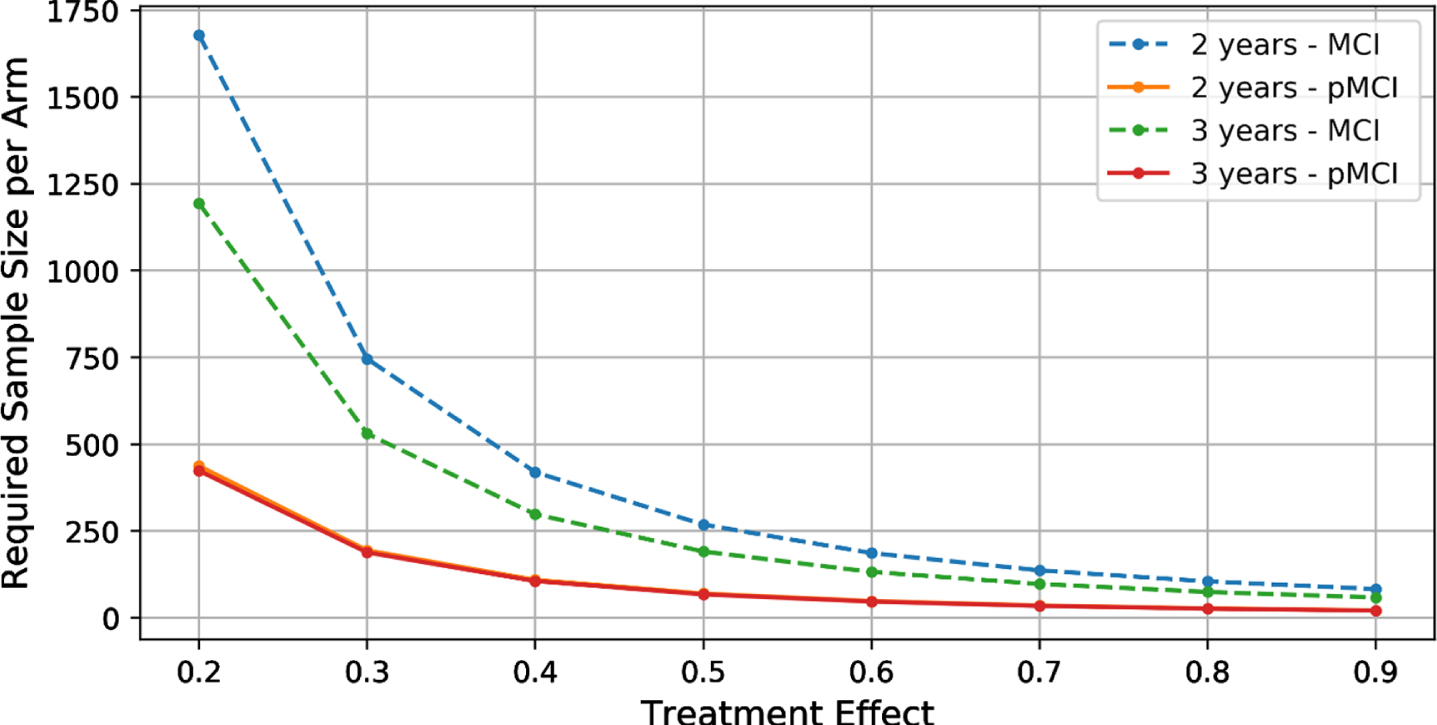
Figure 1 shows the required sample sizes for different treatment effects for both unenriched and enriched MCI cohorts. Using the unenriched group of MCI subjects, power analysis shows that 1,075 subjects (764 subjects) per arm are required in a 2-year (3-year) trial of therapy with a hypothesized 25%effect size (80%power and 5%significance level) to reduce cognitive decline, measured by a two-point increase in CDR-SB (dotted lines in Fig. 1). When using the enriched cohort of MCI subjects, only 279 (273) subjects per arm are require for a 2-year (3-year) trial (solid lines in Fig. 3). These results demonstrate that enrichment using baseline HC, MoCA, ADAS13, and MMSE yields a 3.8-fold decrease in the sample size for a 2-year study (2.8-fold decrease for a 3-year study).
Fig. 1
The required sample size per arm for different treatment effects. (Note that the 2-year and 3-year pMCI curves almost overlap.).
DISCUSSION
In the present study, we trained models to predict cognitive decline in patients in the early stages of AD dementia. We used feature sets consisting of baseline measures of either cognitive test scores, MRI-based grading scores, or a combination of both features for follow-up periods of 2 and 3 years in the ADNI dataset. The results demonstrate that cognitive test scores and our MRI-based features contribute differently to the result of the prediction and combining cognitive test scores and MRI-based features improve prediction accuracy (Table 2). Using HC, MoCA, ADAS13, and MMSE as features yielded the highest prediction accuracy of 76.9%with a sensitivity of 81.3%and a specificity of 74.7%at 2 years.
In our previous work, we showed that when predicting onset of dementia in subjects with mild cognitive impairment, MRI-based features (SNIPE) are more sensitive compared to cognitive features, and even more so with longer follow-up periods, while cognitive features contribute more to the specificity of the prediction [15]. Here, we also show that cognitive features lose sensitivity when it comes to predicting functional and cognitive decline at 36 months compared to that at 24 months.
While adding MRI features to cognitive scores increases accuracy by 1%for a 2-year trial, and 2%for a 3-year trial, the sensitivity of the model is more important than the accuracy for clinical trial enrichment, since we are looking for the maximum number of true positives, i.e., subjects that will certainly decline. Using MoCA and ADAS13 as features for our model, we achieved nearly 75%sensitivity for two-year prediction. By adding the HC SNIPE score to this feature set, we were able to increase the sensitivity by 5.6%to 80.4%. At three years, prediction sensitivity of MOCA and ADAS was 66.4%, but adding HC SNIPE features raises it to 75.4%, i.e., a 9%increase. As we have previously shown [15], MRI-driven features help contribute more sensitivity to the prediction at later follow-up periods. Despite the fact that predicting subtle cognitive decline is harder than predicting conversion from MCI to AD, the predictive accuracy of cognitive decline remains high.
We further estimated the statistical power of our prognostic model in terms of the sample size required to detect a treatment effect on the decline of cognitive abilities. Using a conservative estimate of 25%treatment effect in the power analysis, we found a 3.8-fold reduction in the number of subjects required for a 2-year study (and 2.8-fold decrease for 3-year. If we change this estimate to an optimistic 40%treatment effect, the resulting power analysis yields a 2.40-fold reduction for a 3-year trial and a 3.24-fold reduction for a 2-year trial. This could give a marked clinical advantage, making the enrichment of the target cohort more precise with a smaller sample size, and therefore less costly.
Our results compare favorably to previous work. Lorenzi et al. evaluated a number of biomarkers to screen in subjects more likely to have cognitive decline [31]. Without enrichment, their simulations required a sample size of 674 MCI patients per arm to detect a 25%treatment effect (90%power) on cognitive decline measured with CDR-SB in a two-year trial. Enrichment using either ADAS-COG, cerebrospinal fluid (CSF) tau, CSF Aβ42, CSF tau/Aβ42, hippocampal volume, CSF p-tau, or [18F]-FDG PET decreased the number of patients required to 270, 310, 291, 264, 191, 287, and 240, respectively. At 191 subjects per arm, hippocampal volume offered a 3.5-fold reduction in the number of subjects required in their study. For direct comparison (25%effect, 90%power, 2-year trial), baseline HC SNIPE, MoCA, ADAS13, and MMSE enables a 3.8-fold reduction (from 1,439 subjects unenriched to 375 subjects enriched with our classification tool). Ithapu et al. used deep learning techniques to evaluate enrichment in a 2-year trial of cognitive decline [32]. They found that 1,586 subjects were required to detect a 25%effect (80%power, significance of 0.05) without enrichment and that only 281 subjects were required per arm using baseline [18F]-FDG PET, amyloid florbetapir PET, and structural MRI. While these results are very similar to ours, we are agnostic to the source of amyloid positivity. We can use amyloid results from inexpensive CSF-derived biomarkers or more expensive PET scans.
Recent work by Wolz et al. evaluated enrichment in clinical trials in MCI using markers of amyloid (PET imaging or CSF analysis of beta amyloid) and neurodegeneration (measured by hippocampal volume) for a 25%effect size to decrease the rate of cognitive decline measured with MMSE or ADAS-Cog13 (with 80%power and significance level 0.05) [33]. While 908 unenriched subjects per arm were required for the ADAS-Cog13 outcome measure, this number could be reduced to 605 using baseline hippocampal volume, to 458 using baseline measures of amyloid, and 363 (corresponding to a 2.5-fold reduction) when using both. In a previous study, we have shown that SNIPE scores are better predictors of cognitive decline compared to volumetric measurements [34], and as a result, this score would further decrease the number of subjects needed, when used instead of volumetric-based measurements.
It is important to note that patient selection in clinical trials is an expensive process. At the beginning of a trial, one must screen a large number of subjects to select those that meet eligibility and enrichment criteria. This process currently involves the collection of several biomarkers (structural MRI, CSF biomarkers, amyloid/tau PET), but generally do not include prediction measures to identify subjects that are likely to have cognitive and functional decline. In ADNI, 35%of the MCI subjects showed decline (define by at least two-point increase in CDR-SB) after 2 years. This shows the need to screen roughly 3x more MCI subjects at baseline. With 58%of subjects declining after 3 years in ADNI, studies need to screen almost twice as many subjects for 3-year trials. Decreasing the required sample size to demonstrate a clinical for effect would lead to massive savings in the follow-up visits of enrolled patients (but with a higher cost at enrollment). For example, assume 1000 subjects are required for a 2-year trial. With enrichment, this number is reduced to 263. However, 3x more subjects need to be screened at baseline if the rate of ADNI decliners is used. This gives a total of 3×263 subjects at baseline +263 at year 1 and 263 at year 2, for a total of 1,315 subject visits (compared to 3,000 subject visits with no enrichment, a 56%savings). Using a method to enrich the cohorts and decrease the number of subjects needed for a trial would therefore have a significance impact on the budget needed for such trials.
There are a number of encouraging trials of lifestyle interventions that have demonstrated beneficial effects in terms of improving cognition and delaying [35–39]. A reliable tool that can accurately identify elderly individuals with higher risk of cognitive decline will enable earlier implementation of such strategies in the more at-risk population, which will in turn improve the likelihood of slowing down or preventing cognitive decline, before substantial neurological damage has occurred. In addition, such a tool may help to improve patient compliance in such programs.
Our study is not without limitations. It is important to note that the results here apply only to MCI subjects that present with an amnestic phenotype. While some ADNI subjects with posterior cortical atrophy and sufficient memory decline may have met the inclusion criteria used here, other atypical MCI groups (e.g., limbic predominant, hippocampal sparing, logopenic progressive aphasia, primary progressive aphasia, or frontal variant of AD) would have to be tested specifically in the future. With this in mind, the enrichment potential described here is possible only in trials of amnestic MCI subjects with inclusion criteria similar to those indicated above. Trials of MCI subjects with non-amnestic presentation, or with different inclusion criteria would need to carefully evaluate the use of such a selection tool as presented here.
Because of the relatively limited size of the dataset, we used 10-fold cross validation and report the average accuracy, sensitivity, and specificity across the 10 folds. This provides a robust estimate of performance, but it may be potentially optimistic. Other, larger independent databases are needed for further validation. Furthermore, while there is evidence that cognitive decline may be non-linear over the full course of the disease [40], we assume only a linear change over the short 2 and 3 year periods considered here. The proportion of converters enrolled in the ADNI may also change as MCI patients are followed for longer periods. Finally, here we measured against the decline in the unenriched MCI cohort from ADNI with specific inclusion criteria which might not necessarily be representative of real population of MCI subjects seen in trials or in the clinic.
CONCLUSION
In this work, we were able to predict future cognitive and functional decline in the early stages of AD using a prognostic model that combines cognitive scores and MRI-based biomarkers from a single baseline visit. These features are easy to measure, making this method efficient for clinicians to use as an aid to guide psycho-social interventions for individual patients based on their individual short-term prognosis. Refining clinical trial cohorts to the enrollment of subjects in the early stages of AD with a higher chance of declining over a shorter period of time could improve the efficiency of these trials.
ACKNOWLEDGMENTS
Data collection and sharing for this project was funded by the Alzheimer’s Disease Neuroimaging Initiative (ADNI) (National Institutes of Health Grant U01 AG024904) and DOD ADNI (Department of Defense award number W81XWH-12-2-0012). ADNI is funded by the National Institute on Aging, the National Institute of Biomedical Imaging and Bioengineering, and through generous contributions from the following: AbbVie, Alzheimer’s Association; Alzheimer’s Drug Discovery Foundation; Araclon Biotech; BioClinica, Inc.; Biogen; Bristol-Myers Squibb Company; CereSpir, Inc.; Cogstate; Eisai Inc.; Elan Pharmaceuticals, Inc.; Eli Lilly and Company; EuroImmun; F. Hoffmann-La Roche Ltd and its affiliated company Genentech, Inc.; Fujirebio; GE Healthcare; IXICO Ltd.; Janssen Alzheimer Immunotherapy Research & Development, LLC.; Johnson & Johnson Pharmaceutical Research & Development LLC.; Lumosity; Lundbeck; Merck & Co., Inc.; Meso Scale Diagnostics, LLC.; NeuroRx Research; Neurotrack Technologies; Novartis Pharmaceuticals Corporation; Pfizer Inc.; Piramal Imaging; Servier; Takeda Pharmaceutical Company; and Transition Therapeutics. The Canadian Institutes of Health Research is providing funds to support ADNI clinical sites in Canada. Private sector contributions are facilitated by the Foundation for the National Institutes of Health (https://fnih.org/). The grantee organization is the Northern California Institute for Research and Education, and the study is coordinated by the Alzheimer’s Therapeutic Research Institute at the University of Southern California. ADNI data are disseminated by the Laboratory for Neuro Imaging at the University of Southern California.
Authors’ disclosures available online (https://www.j-alz.com/manuscript-disclosures/21-0664r1).
SUPPLEMENTARY MATERIAL
[1] The supplementary material is available in the electronic version of this article: https://dx.doi.org/10.3233/JAD-210664.
REFERENCES
[1] | Braak H , Braak E ((1991) ) Neuropathological stageing of Alzheimer-related changes. Acta Neuropathol 82: , 239–256. |
[2] | Duyckaerts C , Delatour B , Potier M ((2009) ) Classification and basic pathology of Alzheimer disease. Acta Neuropathol 118: , 5–36. |
[3] | Jack CR , Bennett DA , Blennow K , Carrillo MC , Dunn B , Haeberlein SB , Holtzman DM , Jagust W , Jessen F , Karlawish J , Liu E , Molinuevo JL , Montine T , Phelps C , Rankin KP , Rowe CC , Scheltens P , Siemers E , Snyder HM , Sperling R , Elliott C , Masliah E , Ryan L , Silverberg N ((2018) ) NIA-AA Research Framework: Toward a biological definition of Alzheimer’s disease. Alzheimers Dement 14: , 535–562. |
[4] | Tifratene K , Robert P , Metelkina A , Pradier C , Dartigues JF ((2015) ) Progression of mild cognitive impairment to dementia due to AD in clinical settings. Neurology 85: , 331–338. |
[5] | Palmer K , Bäckman L , Winblad B , Fratiglioni L ((2008) ) Mild cognitive impairment in the general population: Occurrence and progression to Alzheimer disease. Am J Geriatr Psychiatry 16: , 603–611. |
[6] | Gauthier S , Albert M , Fox N , Goedert M , Kivipelto M , Mestre-Ferrandiz J , Middleton LT ((2016) ) Why has therapy development for dementia failed in the last two decades? Alzheimers Dement 12: , 60–64. |
[7] | Cummings JL , Morstorf T , Zhong K ((2014) ) Alzheimer’s disease drug-development pipeline: Few candidates, frequent failures. Alzheimers Res Ther 6: , 37–43. |
[8] | Gauthier S , Pin Ng K , Pascoal TA , Zhang H , Rosa-Neto P ((2018) ) Targeting Alzheimer’s disease at the right time and the right place: Validation of a personalized approach to diagnosis and treatment. J Alzheimers Dis 64: , 23–31. |
[9] | Knopman DS , Jones DT , Greicius MD ((2021) ) Failure to demonstrate efficacy of aducanumab: An analysis of the EMERGE and ENGAGE trials as reported by Biogen, December 2019. Alzheimers Dement 17: , 696–701. |
[10] | Frisoni GB , Fox NC Jr , Scheltens CRJP , Thompson PM ((2010) ) The clinical use of structural MRI in Alzheimer disease. Nat Rev Neurol 6: , 67–77. |
[11] | Jack CR , Petersen RC , Xu YC , Waring SC , O’Brien PC , Tangalos EG , Smith GE , Ivnik RJ , Kokmen E ((1997) ) Medial temporal atrophy on MRI in normal aging and very mild Alzheimer’s disease. Neurology 49: , 786–794. |
[12] | Coupé P , Eskildsen SF , Manjón JV , Fonov VS , Collins DL ((2012) ) Simultaneous segmentation and grading of anatomical structures for patient’s classification: Application to Alzheimer’s disease. Neuroimage 59: , 3736–3747. |
[13] | Coupé P , Eskildsen SF , Manjón J V , Fonov VS , Pruessner JC , Allard M , Collins DL ((2012) ) Scoring by nonlocal image patch estimator for early detection of Alzheimer’s disease. Neuroimage Clin 1: , 141–152. |
[14] | Coupé P , Fonov VS , Bernard C , Zandifar A , Eskildsen SF , Helmer C , Catheline G , Collins DL , Vale D ((2015) ) Detection of Alzheimer’s disease signature in MR images seven years before conversion to dementia: Toward an early individual prognosis. Hum Brain Mapp 4770: , 4758–4770. |
[15] | Zandifar A , Fonov VS , Ducharme S , Belleville S , Collins DL ((2019) ) MRI and cognitive scores complement each other to accurately predict Alzheimer’s dementia 2 to 7 years before clinical onset. Neuroimage Clin 25: , 102121. |
[16] | 221AD301 Phase 3 Study of Aducanumab (BIIB037) in Early Alzheimer’s Disease (ENGAGE). |
[17] | 221AD302 Phase 3 Study of Aducanumab (BIIB037) in Early Alzheimer’s Disease (EMERGE). |
[18] | Morris JC ((1993) ) The Clinical Dementia Rating (CDR): Current version and scoring rules. Neurology 43: , 2412–2412. |
[19] | Andrews JS , Desai U , Kirson NY , Zichlin ML , Ball DE , Matthews BR ((2019) ) Disease severity and minimal clinically important differences in clinical outcome assessments for Alzheimer’s disease clinical trials. Alzheimers Dement (N Y) 5: , 354–363. |
[20] | Manjón J V. , Coupé P , Martí-Bonmatí L , Collins DL , Robles M ((2010) ) Adaptive non-local means denoising of MR images with spatially varying noise levels. J Magn Reson Imaging 31: , 192–203. |
[21] | Sled JG , Zijdenbos AP , Evans AC ((1998) ) A nonparametric method for automatic correction of intensity nonuniformity in MRI data. IEEE Trans Med Imaging 17: , 87–97. |
[22] | Dadar M , Fonov VS , Collins DL , Alzheimer’s Disease Neuroimaging Initiative ((2018) ) A comparison of publicly available linear MRI stereotaxic registration techniques. Neuroimage 174: , 191–200. |
[23] | Collins DL , Neelin P , Peters TM , Evans AC ((1994) ) Automatic 3D intersubject registration of MR volumetric data in standardized Talairach space. J Comput Assist Tomogr 18: , 192–205. |
[24] | Fonov V , Evans AC , Botteron K , Almli CR , Mckinstry RC , Collins DL ((2011) ) NeuroImage Unbiased average age-appropriate atlases for pediatric studies. Neuroimage 54: , 313–327. |
[25] | Eskildsen SF , Coupé P , Fonov V , Manjón J V. , Leung KK , Guizard N , Wassef SN , Østergaard LR , Collins DL ((2012) ) BEaST: Brain extraction based on nonlocal segmentation technique. Neuroimage 59: , 2362–2373. |
[26] | Coupé P , Manjón J V , Fonov V , Pruessner J , Collins DL ((2011) ) Patch-based segmentation using expert priors: Application to hippocampus and ventricle segmentation. Neuroimage 54: , 940–954. |
[27] | Zandifar A , Fonov V , Coupé P , Pruessner J , Collins DL ((2017) ) A comparison of accurate automatic hippocampal segmentation methods. Neuroimage 155: , 383–393. |
[28] | Chen C , Liaw A , Breiman L (2004) Using random forest to learn imbalanced data. |
[29] | McEvoy L , Edland S , Holland D , Hagler D , Roddey JC , Fennema-notestine C , Salmon DP , Koyama AK , Aisen PS , Brewer JB , Dale AM ((2010) ) Enrichment strategy for secondary prevention trials in Alzheimer disease. Neuroimaging 24: , 269–277. |
[30] | Fitzmaurice GM , Laird NM , Ware JH ((2011) ) Applied Longitudinal Analysis, John Wiley & Sons, Inc. |
[31] | Lorenzi M , Donohue M , Paternicò D , Scarpazza C , Ostrowitzki S , Blin O ((2010) ) Enrichment through biomarkers in clinical trials of Alzheimer’s drugs in patients with mild cognitive impairment. Neurobiol Aging 31: , 1443–1451.e1. |
[32] | Ithapu VK , Singh V , Okonkwo OC , Chappell RJ ((2015) ) Imaging-based enrichment criteria using deep learning algorithms for efficient clinical trials in mild cognitive impairment. Alzheimers Dement 11: , 1489–1499. |
[33] | Wolz R , Schwarz AJ , Gray KR , Hill DLG ((2016) ) Enrichment of clinical trials in MCI due to AD using markers of amyloid and neurodegeneration. Neurology 87: , 1235–41. |
[34] | Zandifar A , Fonov V , Potvin O , Duchesne S , Collins DL (2019) SNIPE score can capture prodromal Alzheimer’s in cognitively normal subjects. bioRxiv, doi: https://doi.org/10.1101/541854. |
[35] | Rosenberg A , Ngandu T , Rusanen M , Antikainen R , Bäckman L , Havulinna S , Hänninen T , Laatikainen T , Lehtisalo J , Levälahti E , Lindström J , Paajanen T , Peltonen M , Soininen H , Stigsdotter-Neely A , Strandberg T , Tuomilehto J , Solomon A , Kivipelto M ((2018) ) Multidomain lifestyle intervention benefits a large elderly population at risk for cognitive decline and dementia regardless of baseline characteristics: The FINGER trial. Alzheimers Dement 14: , 263–270. |
[36] | Rosenberg A , Mangialasche F , Ngandu T , Solomon A , Kivipelto M ((2020) ) Multidomain interventions to prevent cognitive impairment, Alzheimer’s disease, and dementia: From FINGER to World-Wide FINGERS. J Prev Alzheimers Dis 7: , 29–36. |
[37] | Toman J , Klímová B , Vališ M ((2018) ) Multidomain lifestyle intervention strategies for the delay of cognitive impairment in healthy aging. Nutrients 10: , 1560. |
[38] | Kivipelto M , Mangialasche F , Ngandu T ((2018) ) Lifestyle interventions to prevent cognitive impairment, dementia and Alzheimer disease. Nat Rev Neurol 14: , 653–666. |
[39] | Yu JT , Xu W , Tan CC , Andrieu S , Suckling J , Evangelou E , Pan A , Zhang C , Jia J , Feng L , Kua EH , Wang YJ , Wang HF , Tan MS , Li JQ , Hou XH , Wan Y , Tan L , Mok V , Tan L , Dong Q , Touchon J , Gauthier S , Aisen PS , Vellas B ((2020) ) Evidence-based prevention of Alzheimer’s disease: Systematic review and meta-analysis of 243 observational prospective studies and 153 randomised controlled trials. J Neurol Neurosurg Psychiatry 91: , 1201–1209. |
[40] | Cloutier S , Chertkow H , Kergoat M-J , Gauthier S , Belleville S ((2015) ) Patterns of cognitive decline prior to dementia in persons with mild cognitive impairment. J Alzheimers Dis 47: , 901–913. |
[41] | Louppe G , Wehenkel L , Sutera A , Geurts P (2013) Understanding variable importances in Forests of randomized trees. Advances in Neural Information Processing Systems 26 (NIPS 2013), Burges CJC, Bottou L,Welling M, Ghahramani Z, Weinberger KQ, eds. |


