
Investigating Auditory Electrophysiological Measures of Participants with Mild Cognitive Impairment and Alzheimer’s Disease: A Systematic Review and Meta-Analysis of Event-Related Potential Studies
Abstract
Background:
Objectively measuring auditory functions has been proposed as an avenue in differentiating normal age-related cognitive dysfunction from Alzheimer’s disease (AD) and its prodromal states. Previous research has suggested auditory event-related potentials (AERPs) to be non-invasive, cost-effective, and efficient biomarkers for the diagnosis of AD.
Objective:
The objective of this paper is to review the published literature on AERPs measures in older adults diagnosed with AD and those at higher risk of developing AD, i.e., mild cognitive impairment (MCI) and subjective cognitive decline.
Methods:
The search was performed on six major electronic databases (Ovid MEDLINE, OVID EMBASE, PsycINFO, PubMed, Scopus, and CINAHL Plus). Articles identified prior to 7 May 2019 were considered for this review. A random effects meta-analysis and analysis of between study heterogeneity was conducted using the Comprehensive Meta-Analysis software.
Results:
The search identified 1,076 articles; 74 articles met the full inclusion criteria and were included in the systematic review, and 47 articles were included into the analyses. Pooled analysis suggests that AD participants can be differentiated from controls due to significant delays in ABR, N100, P200, N200, and P300 latencies. P300 amplitude was significantly smaller in AD participants compared to controls. P300 latencies differed significantly between MCI participants and controls based on the pooled analysis.
Conclusion:
The findings of this review indicate that some AERPs may be valuable biomarkers of AD. In conjunction with currently available clinical and neuropsychological assessments, AERPs can aid in screening and diagnosis of prodromal AD.
INTRODUCTION
Dementia due to Alzheimer’s disease (AD) accounts for 60–80%of all dementia cases [1] and is characterized by impairment in episodic memory as well as other cognitive functions [2]. Neurodegenerative changes that lead to AD begin to accumulate approximately 20 years prior to the appearance of clinical symptoms [3, 4]. Extracellular plaques of amyloid-β (Aβ) are one of the primary AD biomarkers closely associated with neural atrophy and synaptic damage, which are associated with gradual neuronal death [3, 5]. Tau protein accumulation and hyperphosphorylation is another histopathological hallmark of AD. It results in the formation of neurofibrillary tangles (NFTs) inside neural cell bodies, ultimately resulting in synaptic loss and neuronal death [6]. Biomarker abnormalities result in substantial brain injury, neural death, and the degeneration of cortical and subcortical structures. Over time, these changes lead to memory loss, further cognitive impairment, and changes in daily living activities representing the clinical symptoms of AD [5].
Biomarkers of AD have been identified using a number of techniques, including positron emission tomography (PET) for amyloid plaques and more recently for NFTs and glucose metabolism, magnetic resonance imaging (MRI) for volumetric and structural changes, and lumbar puncture for cerebrospinal fluid (CSF) biomarkers (e.g., tau and Aβ) of AD [7, 8]. However, both CSF and PET are not available for mass screening of high risk individuals in many remote areas of high-income countries and in many mid to low-income countries due to the expertise, facilities and infrastructure required to conduct these tests [9]. Additionally, the neuronal death that must occur in order to be detectable by MRI or hypometabolism on FDG-PET is substantial and the change, at least for now, are irreversible. Such difficulties limit the applications of these techniques in preclinical early stages of AD, that is, prior to significant brain damage and the appearance of the clinical symptoms [5, 10]. Other limiting factors for these diagnostic methods include their invasive nature and the high cost associated with conducting these tests, which limits their use in routine clinical practice [11–13].
In addition, commonly utilized cognitive impairment screening tests, such as the Montreal Cognitive Assessment (MoCA) and Mini-Mental State Examination (MMSE), have varied sensitivity and specificity [14], resulting in the possibility that some individuals meet the screening criteria for cognitive impairment on one test but not on the other [15]. Furthermore, even comprehensive neuropsychological measures are not specific or sensitive enough to detect very early and preclinical changes in episodic memory, as the primary clinical manifestations of AD [15].
Considering current challenges associated with identification of those at risk (pre-clinical AD) and diagnosing AD and its prodromal stages as well as the availability of disease-altering interventions, it has become imperative to identify other early diagnostic tool(s) and/or diagnostic strategies for preclinical AD [16]. The identified stages that are associated with higher risk of developing AD, i.e., subjective cognitive decline (SCD) and amnestic mild cognitive impairment (MCI), have the potential to define a target population for early AD intervention. This is important as treatments at later stages of the disease show no promise in altering the disease course due to substantial neuronal injury and cognitive impairment already present [17].
In addition to current biomarkers of AD, measuring the brain’s electrical activity using electroencephalo-graphy (EEG) has been proposed as an avenue to detect early brain changes associated with AD and its prodromal stages [18–21]. Neural responses to specific sensory, cognitive and motor processes can be elicited by combining EEG with particular tasks [22]. These responses, also known as event-related potentials (ERP), are a result of the brain’s adjustment from a discorded (high entropy) to an ordered (low entropy) state in response to synchronization to a particular task [23]. In other words, ERPs reflect the changes in the state of electrical brain activity in response to different tasks. ERPs can be analyzed with respect to the intensity of the response (amplitude) as well as the time the response occurs (latency) in relation to the stimulus [22, 24]. ERPs reflect brain activity that is phase and time locked to a presented stimulus, which has been suggested to be an objective tool for the assessment of cognitive status and other brain functions [22, 25].
Cognitive decline has been shown to be strongly associated with hearing loss with the probability of incident dementia log-linearly increasing with the severity of hearing loss [26]. In addition, results from a number of longitudinal studies suggest that changes in central auditory processing skills, even in the absence of severe peripheral hearing loss, are associated with high incidence of cognitive decline and AD [27, 28]. Objectively measuring auditory functions has been proposed as an avenue in differentiating normal age-related cognitive dysfunction from AD and its prodromal states [29–31].
The peaks of distinct auditory event-related potentials (AERP), measured using surface skin electrodes, that present at different latencies are thought to represent neural activity from different anatomical areas along the auditory pathway and associated structures [32]. For this reason, AERPs have been used to objectively evaluate central auditory function, hearing thresholds, and sensory processing [25, 33–35]. Additionally, AERPs have also been suggested to reflect auditory memory, working memory, attention, language comprehension, discrimination and decision-making [36–39]. These AERP components can be characterized into one of three groups: 1) short latency AERPs, 2) middle latency AERPs and, 3) long latency AERPs. Evoked potentials that appear within 12 milliseconds (ms) of an auditory stimulus are considered short latency AERPs and these include: electrocochleography (ECochG), auditory brainstem response (ABR), and frequency following response (FFR). Middle latency AERPs appear between 12 and 50 ms following a stimulus and these include: middle latency responses (MLR), generally labelled Na, Pa and Nb, and Auditory Steady-State Response (ASSR). Finally, AERPs that occur 50 ms or later following an auditory stimulus are considered late latency AERPs. These responses are divided into exogenous (P50 (P1 or Pb), N100, P200 and N200) or endogenous (P300, N400, P600, Mismatch Negativity (MMN), and contingent negative variation (CNV)). Previous research suggested AERPs to be non-invasive, cost- effective and efficient biomarkers for the diagnosis of AD [40–44]. AERPs alone may not provide the required diagnostic specificity as pathophysiological biomarkers (i.e., Aβ and NFTs); however, AERPs can contribute to the first-line screening to identify high-risk individuals that would otherwise be investigated using expensive (PET or volumetric MRI) or invasive (lumber puncture for CSF) methods. Reducing the number of AD related cases that require second-line or further investigation will reduce cost from both a financial and organizational perspective.
Many studies have been conducted on AERPs in people with cognitive decline due to AD. In order to evaluate the currently available literature and identify any gaps in the knowledge, this paper aims to systematically review the published literature currently available on auditory event-related potentials that have been used to assess the auditory functions in older adults diagnosed with AD and its clinical and pre-clinical stages, including those with MCI and SCD. This review and meta-analysis aims to: 1) determine the magnitude of AERP latency and amplitude abnormalities present in SCD, MCI, and AD participants compared to controls, 2) determine which AERPs can differentiate between the subject groups (normal healthy controls, SCD, MCI, and AD), and 3) determine which AERPs can yield a possible biomarker for pre-clinical and early clinical AD, i.e., SCD and MCI.
METHODS
All full-length peer-reviewed publications of original data that measured AERPs in people with AD, MCI, SCD, and age-matched controls available on electronic databases prior to 7 May 2019 were considered for this review. The search was performed on major electronic databases (Ovid MEDLINE, OVID EMBASE, PsycINFO, PubMed, Scopus, and CINAHL Plus) using keywords alone or in combination with Medical Subject Headings divided into two domains: 1) auditory tests and 2) AD. Only studies with specified aMCI participants were included in the meta-analyses; MCI studies that did not specify aMCI, however, still fit the remaining inclusion criteria were included in the summary table for descriptive purposes. A random effects meta-analysis and analysis of between study heterogeneity was conducted using the Comprehensive Meta-Analysis software, version 3. Methods were informed by Cochrane guidelines for systematic reviews [45] and the methodological approach is outlined in detail in the review protocol [46].
RESULTS
Search result
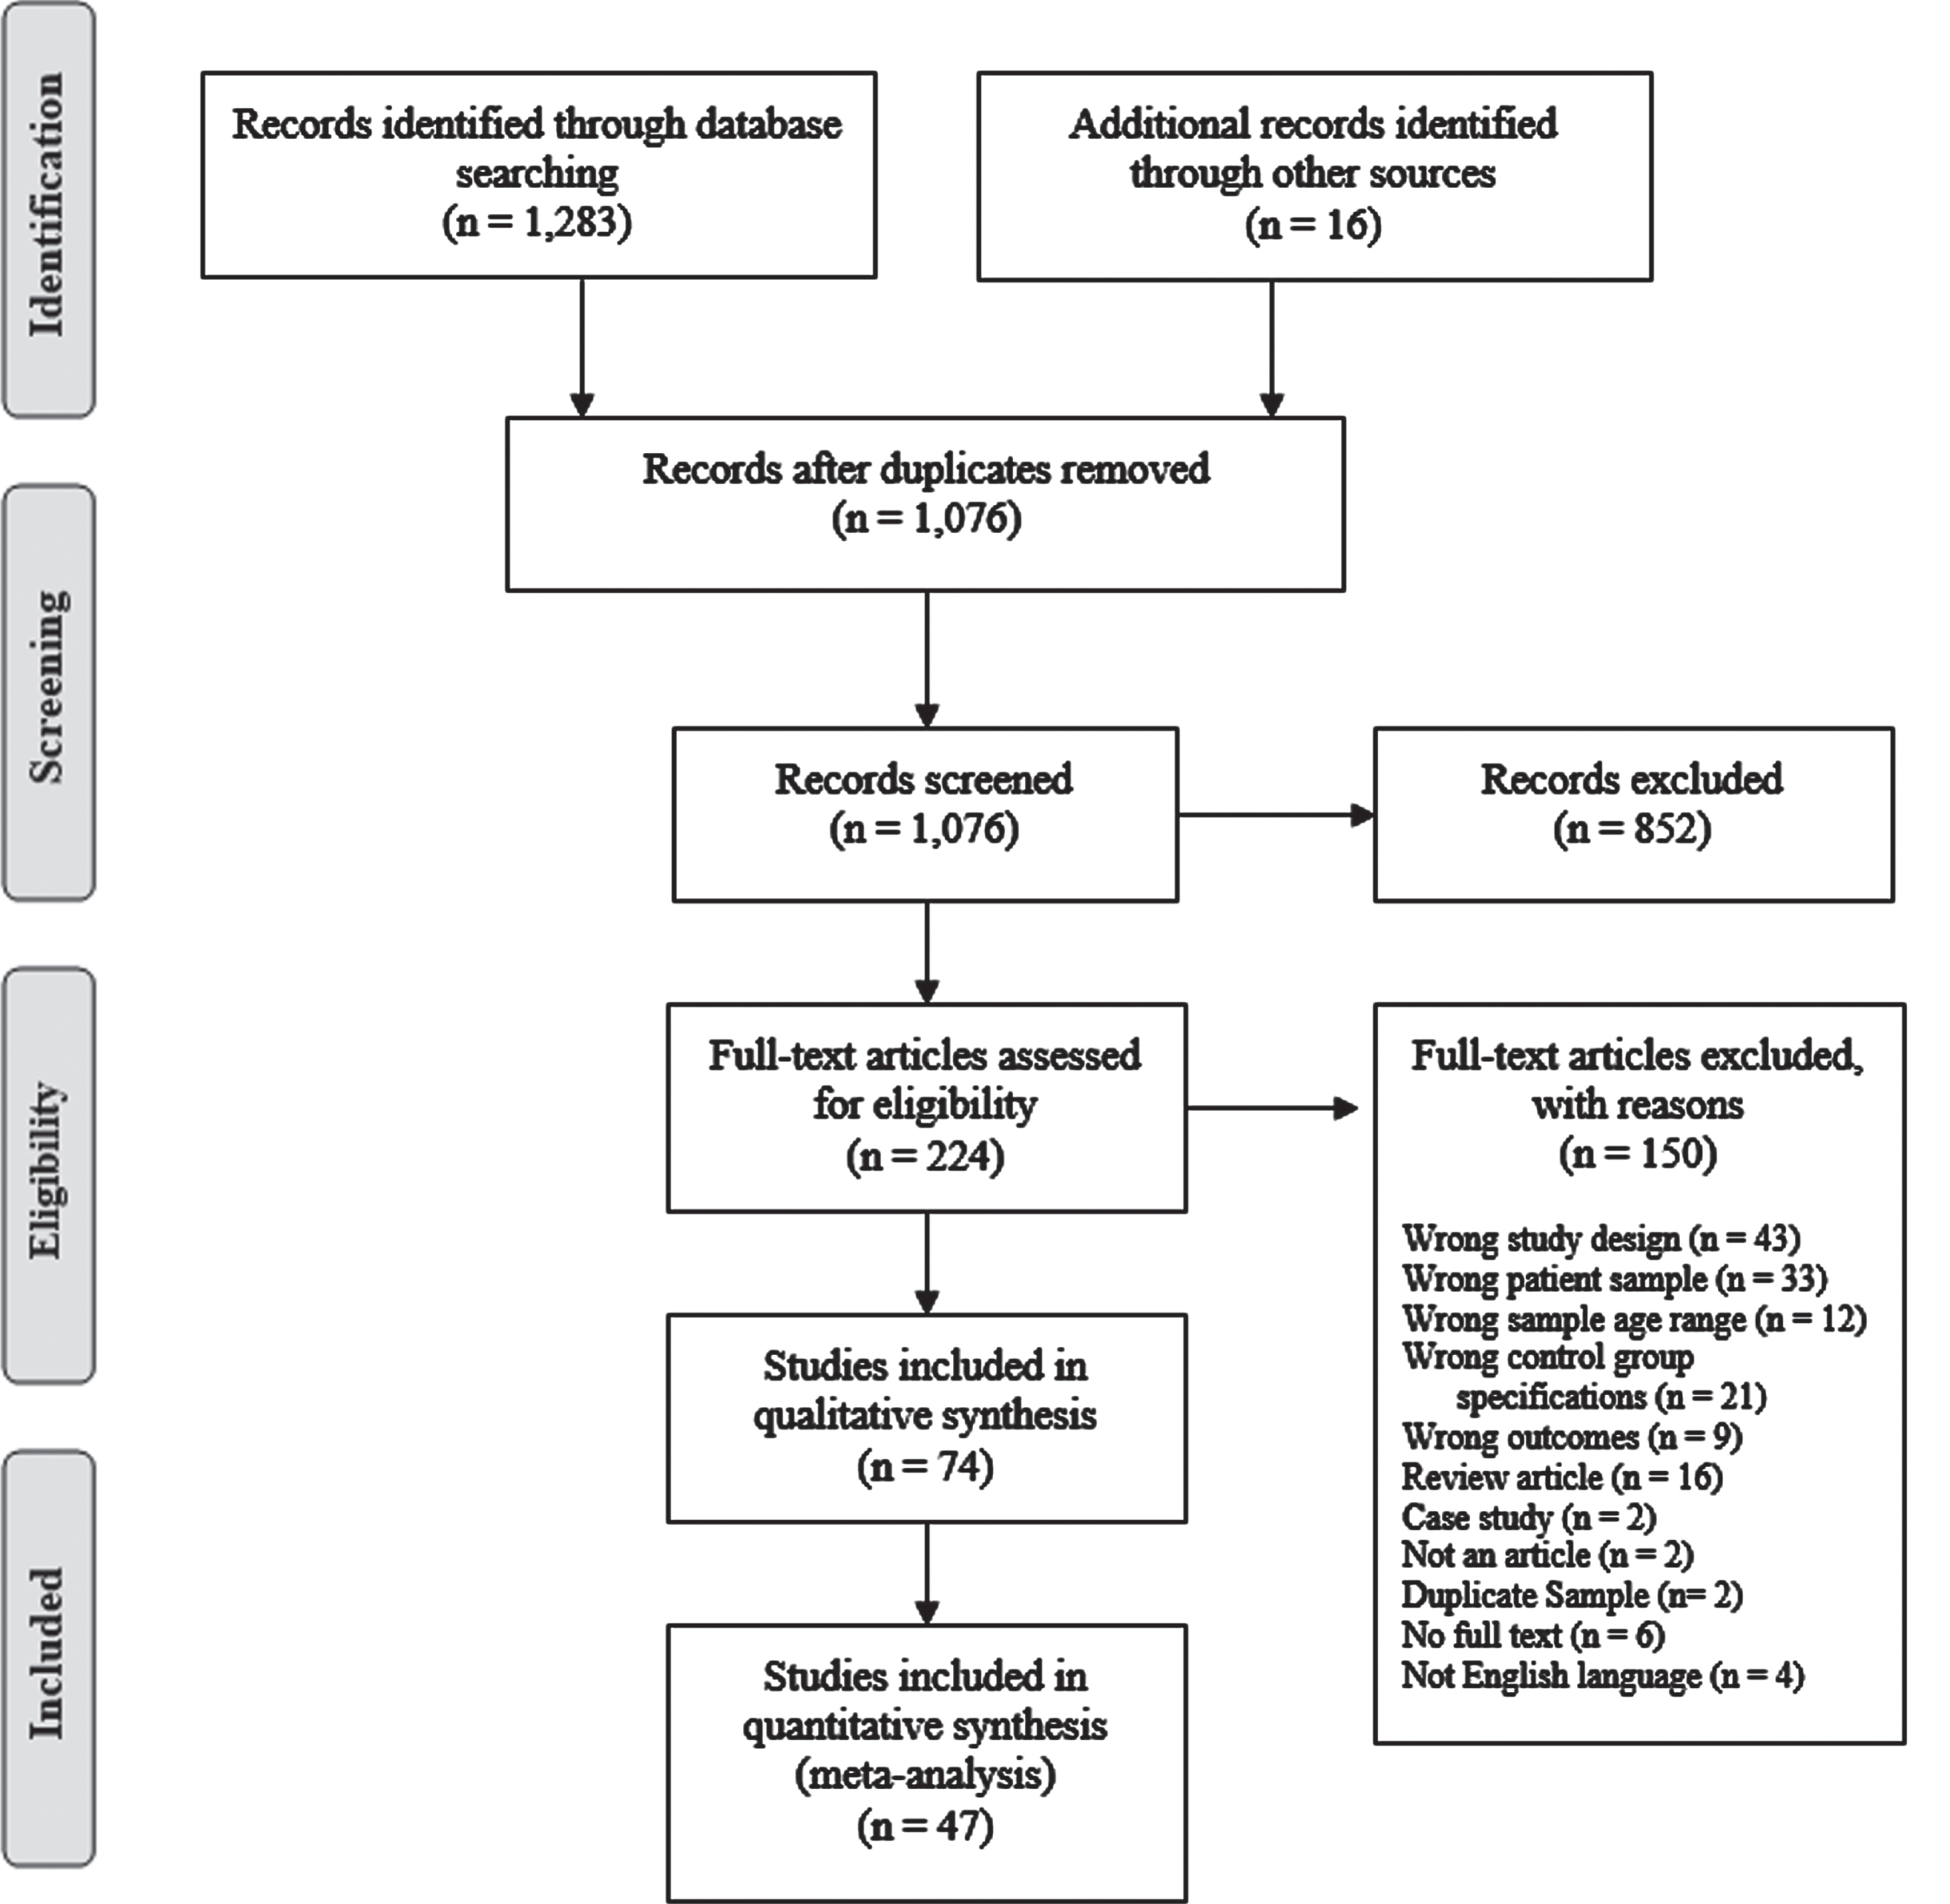
As shown in Fig. 1, a total of 1,076 titles and abstracts were screened against the eligibility criteria. Of the screened articles, 852 were excluded based on the information provided in the title and abstract, and 224 articles were selected for full text review. A total of 74 articles met the full inclusion criteria and were included in the systematic review, and 47 were added into the various meta-analyses. Articles were excluded from the meta-analysis for one or more of the following reasons: 1) mean values were not reported and/or could not be obtained, 2) standard deviation (SD) and/or standard error values were not reported and could not be obtained, and 3) one or more of the participant group(s) results were reported in multiple articles. In the latter case only the data from most recent article were included in the meta-analysis. Meta-analyses were not conducted for AERPs if: 1) there were less than two studies using the same testing paradigm in the same participant groups (e.g., Three-tone active oddball paradigm, Active vowel discrimination task), and 2) there were less than three articles on the same AERP.
Fig. 1
PRISMA flow diagram of search result.
Study characteristics
All studies included in the review compared auditory electrophysiological assessments in a group of participants with cognitive impairment or cognitive complaints with a healthy (non-complainers) age-matched control group. Fifty-four studies compared participants with AD to healthy controls, 11 compared participants with MCI to healthy controls, 9 compared both participants with MCI and AD to healthy controls, while none were found which compared participants with SCD to healthy controls. The studies included a total of 3,740 participants (1,455 AD, 615 MCI, 0 SCD and 1,670 controls) from 25 countries. The majority of the studies used the National Institute of Neurological and Communicative Disorders and Stroke and the Alzheimer’s disease and Related Disorders Association (NINCDS-ADRDA) and/or Diagnostic and Statistical Manual of Mental Disorders (DSM) criteria to diagnose AD (52 out of 62 studies), one study used neuropsychological assessments by certified neurologist coupled with the Mini-Mental State Examination (MMSE) and Wechsler Memory Scale, one study used the Clinical Dementia Rating (CDR) and 8 studies used other neuropsychological evaluations and/or medical imaging (see Table 1). MCI was diagnosed using the Petersen’s criteria [47] and/or DSM criteria in most studies (15 out of 20 studies) included in the review, Smith’s 1996 criteria was used in two studies [48], Winbald’s criteria [49] was used in one study, and 2 studies used other neuropsychological evaluations to diagnose MCI, as described in Table 1.
Table 1
Characteristics of auditory event-related potential cohort studies included in the systematic review
| Study (country) [Ref] | AD mean age (n) M/F | MCI mean age (n) M/F | HC mean age (n) M/F | Diagnosis/screening method | MMSE Score (Mean±SD) | Task | AERPs | Amplitude | Latency |
| Ally et al. 2006 (USA) [93] | 74.90±5.63 (20) 9/11 | - | 74.35±5.42 (20) 11/9 | AD: NINCDS-ADRDA | AD: 21.20±2.48 HC: 28.35±0.86 | Passive double click paradigm | P50 | HC = AD | HC = AD |
| Ally et al. 2006 (USA) [94] | 74.20±5.34 (20) 9/11 | - | 75.35±6.02 (20) 11/9 | AD: NINCDS-ADRDA | AD: 21.65±2.11 HC: 28.65±0.81 | Active auditory oddball (Count targets) | P300 | HC > AD (p = 0.009) | HC = AD |
| Ashford et al. 2011 (USA) [40] | 74.7±7.7 (23) Not specified | - | 69.3±6.3 (11) Not specified | AD: NINCDS-ADRDA | AD: 16.6±7.3 HC: 28.8±1.7 | Active auditory oddball (Count targets) | P300 | HC > AD (p < 0.01) | HC = AD |
| Bender et al. 2014 (Germany) [95] | 75.2±5.01 (19) 11/8 | - | 72.3±5.1 (17) 6/11 | AD: NINCDS-ADRDA, Neuropsychological examination, MRI, and CSF | AD: 20.9±5.1 HC: 29.5±0.6 | Passive double click paradigm | P50 P300 | HC = AD HC = AD | Not measured Not measured |
| Bennys et al. 2007 (France) [69] | 70.9±6.8 (30) 15/15 | 64.4±7.6 (20) 5/15 | 61.6±6.4 (10) 5/5 | AD: NINCDS-ADRDA and DSM-IV MCI: Petersen criteria | AD: 22.2±2.6 MCI: 27.0±1.6 HC: 29.6±0.5 | Active auditory oddball (Count targets) | N200 P300 | AD < MCI < HC (p < 0.05) HC > AD MCI > AD HC > MCI (p < 0.05) | AD > MCI > HC (p < 0.05) HC < AD (p < 0.05) |
| Bennys et al. 2011 (France) [41] | - | MCI-P 70.7±9 (41) Not specified MCI-S 72±4.8 (30) Not specified Combined: 71.2±7.5 (71) | 71.2±9.2 (31) Not specified | MCI: Petersen criteria | MCI-P: 25.4±3.2 MCI-S: 26.4±2.7 Combined MCI: 25.8±3 HC: 29.5±0.5 | Active auditory oddball (Count targets) | N200 P300 | HC > MCI-P @ Pz (p < 0.0001) MCI-P < MCI-S @ Pz (p = 0.0002) HC > MCI-P @ Pz (p = 0.003) MCI-P < MCI-S @ Pz (p = 0.008) | HC < MCI-P @ Fz &Pz (p < 0.001) HC < MCI-P (p < 0.0001) MCI-P > MCI-S (p = 0.006) |
| Blackwood et al. 1987 (Scotland) [96] | 61.5 (20) 10/10 | - | 62.1 (23) 9/14 | AD: neurological examination Criteria included: progressive dementia with onset under 65 years old and inpatient investigation to exclude other dementia types. | Not measured | Active auditory oddball (Count targets) | P300 | HC < AD (p < 0.01) | HC < AD (p < 0.01) |
| Boller et al. 2002 (France) [61] | 75±8.1 (10) 5/5 | - | 75±6.2 (12) 8/4 | AD: NINCDS-ADRDA and DSM-IV | AD: 19.6±2.9 HC: 28.8±1.2 | Active auditory oddball (Respond to target- not specified how) Passive auditory oddball (MMN only) | MMN P300 | HC > AD (p < 0.0001) HC > AD (p < 0.0001) | Not measured HC = AD |
| Bonanni et al. 2010 (Italy) [97] | 71.7±4.7 (37) 17/20 | - | 72.0±4.1 (50) 32/18 | AD: NINCDS-ADRDA | AD: 22.1±1.5 HC: 29.0±0.8 | Active auditory oddball (Count targets) | N100 P200 N200 P300 | HC = AD HC = AD HC = AD Not specified | HC = AD HC = AD HC = AD HC < AD (p < 0.05) |
| Bronnick et al. 2010 (Norway) [98] | 77.0±9.3 (16) 2/14 | - | 73.1±4.5 (18) 4/14 | AD: NINCDS-ADRDA and DSM-IV | AD: 21.3±3.9 HC: 29.1±1.4 | Passive hearing | MMN | HC = AD (p = 0.194) | Not reported |
| Buchwald et al. 1989 (USA) [99] | 63.2 (6) 6/0 | - | 64 (6) 6/0 | AD: NINCDS-ADRDA | Not measured | Passive hearing | P30 (Pa) P50 (P1) | HC = AD HC > AD (p < 0.004) | HC = AD HC = AD |
| Cancelli et al. 2006 (Italy) [53] | 76.1±5.6 (18) 5/13 | - | 74.2±5.4 (15) 5/10 | AD: NINCDS-ADRDA | AD: 22.3±3.6 HC: 29.5±0.9 | Passive double click paradigm | P50 | HC < AD (p = 0.01) | HC = AD |
| Caravaglios et al. 2008 (Italy) [74] | 74.9±7.4 (21) 9/12 | - | 74.0±8.7 (16) 7/9 | AD: NINCDS-ADRDA | AD: 22.8±3.0 HC: 29.0±1.2 | Active auditory oddball (Press button on target) | N100 P200 N200 P300 | Not measured Not measured Not measured Not measured | HC = AD HC = AD HC < AD (p < 0.01) HC < AD (p < 0.01) |
| Cecchi et al. 2015 (USA) [68] | 76.2±0.74 (99) 48/51 | - | 73.2±0.71 (100) 40/60 | AD: NINCDS-ADRDA | AD: 23.4±0.19 HC: 29.1±0.08 | Three-tone active oddball (Press button on target) | P50 N100 P200 N200 P300 Slow wave | HC > AD (Distractor tones) (p < 0.05) HC > AD (Standard &target tones) (p < 0.01) HC < AD (Distractor tones) (p < 0.01) HC > AD (Standard tones) (p < 0.01) HC > AD (Target tones) (p < 0.01) (HC > AD) (Target &distractor tones) (p < 0.01) HC = AD | HC < AD (Distractor tones) (p < 0.05) HC = AD HC = AD HC < AD (Target tones) (p < 0.01) HC < AD (Target tones) (p < 0.05) HC < AD (Target tones) (p < 0.05) |
| Chen et al. 2015 (China) [87] | 69.79±9.20 (42) 20/22 | - | 68.03±10.79 (35) 15/20 | AD: NINCDS-ADRDA and DSM-IV | AD: 20.21±5.34 HC: 25.77±2.27 | Active auditory oddball (Press button and count target) | N200 P300 | HC = AD HC = AD | HC = AD HC < AD @ Cz (p = 0.007) &Pz (p = 0.002) |
| Cintra et al. 2017 (Brazil) [100] | 76.29±7.86 (17) 6/9 | 75.18±7.93 (34) 17/17 | 74.50±9.31 (14) 3/11 | AD: CDR MCI: Petersen criteria | AD: 20 MCI: 24 HC: 26 | Active auditory oddball (Count target) | N200 P300 | Not measured HC = MCI = AD | HC = MCI = AD HC = MCI = AD |
| Fein et al. 1994 (USA) [101] | 77.6±6.8 (8) Not specified | - | 69.5±8.7 (17) Not specified | AD: NINCDS-ADRDA | AD: 13.2±5.4 HC: 29.1±0.8 | Passive double click paradigm | P30 P50 | HC = AD HC = AD | HC = AD HC = AD |
| Ford et al. 1997 (USA) [102] | 68.7±4.92 (12) 8/4 | - | 66.5±5.87 (11) 5/6 | AD: NINCDS-ADRDA | AD: 20.3±1.04 HC: 28.2±1.25 | Active auditory oddball (Press button on target) Active oddball noise paradigm (Press button on noise) Passive oddball noise paradigm | N100 P300 | HC > AD for active auditory oddball paradigm only (p < 0.05) HC > AD for all paradigms (p < 0.05) | HC = AD HC < AD for all paradigms (p < 0.05) |
| Frodl et al. 2002 (Germany) [54] | 69.9±10.3 (30) 15/15 | 66.2±11.3 (26) 10/16 | 64.9±10.9 (26) Not specified | AD: NINCDS-ADRDA and DSM-IV MCI: Petersen criteria | AD: 20.8±4.1 MCI: 27.5±1.6 HC: 29.7±0.5 | Active auditory oddball (Press button on target) | TS-P300 TB-P300 | HC = MCI = AD HC > AD (p = 0.001) MCI > AD (p = 0.001) HC = MCI | HC < AD (p = 0.003) MCI = AD HC = MCI HC = MCI = AD |
| Gao et al. 2018 (China) [103] | - | 71.28±5.98 (39) 25/14 | 69.93±5.58 (44) 21/23 | MCI: Petersen criteria | MCI: 27.08±2.11 HC: 27.41±1.31 | Passive auditory oddball | MMN P300 | HC = MCI HC = MCI | HC > MCI (p < 0.05) HC = MCI |
| Golob &Starr 2000 (USA) [66] | 72.0±3.1 (10) 4/6 | - | 66.3±1.6 (12) 4/8 | AD: NINCDS-ADRDA | AD: 23.0±0.9 HC: 29.1±0.3 | Active auditory oddball (Press button on target) | P50 N100 P200 N200 P300 | HC < AD (p < 0.04) HC = AD HC = AD HC = AD HC = AD | HC = AD HC = AD HC < AD HC = AD HC < AD (p < 0.01) |
| Golob et al. 2001 (USA) [104] | - | 76.5±2.7 (15) 11/4 | 72.8±7.8 (12) 3/9 | MCI: Smith 1996 criteria | MCI: 27.7±2.7 HC: 29.2±0.8 | Active auditory oddball (Press button on target) | P50 N100 P200 N200 P300 | HC < MCI (p < 0.01) HC = MCI HC = MCI HC = MCI HC = MCI | HC < MCI (P < 0.001) HC = MCI HC = MCI HC = MCI HC < MCI (p < 0.04) |
| Golob et al. 2007 (USA) [70] | 77.0±6.6 (14) 9/5 | MCI-MD: 76.0±5.2 (13) 5/8 MCI-SD: 74.6±5.9 (28) 20/8 Combined: 75±5.7 (41) 25/16 | 75.1±5.7 (44) 21/23 | MMSE scores and, AD: Impairment in memory, other cognitive domain &in daily living activities. MCI-MD: Petersen criteria, McKhann criteria (1984) &only memory impaired MCI-SD: Petersen criteria, McKhann criteria (1984) &at least two domains impaired (including memory) | AD: 21.7±3.0 MCI-MD: 27.4±2.4 MCI-SD: 27.4±1.6 Combined MCI: 27.4±1.8 HC: 29.0±1.1 | Active auditory oddball (Press button on target) | P50 N100 P200 P300 | HC < MCI-MD (p < 0.001) MCI-MD > MCI-SD (p < 0.01) HC = MCI = AD HC = MCI = AD HC = MCI = AD | HC = MCI = AD HC = MCI = AD HC = MCI = AD HC < MCI-SD (p < 0.01) HC < AD (p < 0.001) |
| Grimes et al. 1987 (USA) [105] | ABR: 64.1 (69) 39/30 MLR: Not reported (39) 26/13 | - | ABR: 63.7 (35) 18/17 MLR: 61.4 (31) 20/11 | AD: DSM-III | Not measured | Passive hearing | ABR MLR | Not measured HC = AD | HC = AD HC = AD |
| Gungor et al. 2005 (Turkey) [106] | Mild AD: 72.5±6.8 (12) 5/7 Moderate AD: 71.8±5.8 (10) 6/4 Combined: 72.18±6.2 (22) 11/11 | - | 71.2±5.2 (10) 5/5 | AD: NINCDS-ADRDA | Mild AD: 22.9±1.4 Moderate AD: 15.9±1.2 Combined AD: 19.7±3.8 HC: 29.4±0.5 | Active auditory oddball (Count target) | N100 P200 N200 P300 | HC = AD HC = AD HC = AD HC = AD | HC = AD HC = AD HC = AD HC < AD (p < 0.05) |
| Hanafusa et al. 1991 (Japan) [107] | 76.9±4.7 (14) Not specified | - | 74.5±6.3 (29) Not specified | AD: DSM-III | Not measured | Active auditory oddball (Press button on target) | N100 P300 | Not measured Not measured | HC = AD HC < AD (p < 0.01) |
| Hirata et al. 2000 (Japan) [108] | 72.2±7.5 (26) Not specified | - | 69.0±3.3 (12) Not specified | AD: NINCDS-ADRDA | AD: 18.6±4.3 HC: 29.0±1.3 | Active auditory oddball (Count target) | N100 N200 P300 | HC > AD (p < 0.05) HC = AD HC > AD (p < 0.05) | HC < AD (p < 0.05) HC > AD (p < 0.02) HC < AD (p < 0.01) |
| Holt et al. 1995 (USA) [55] | 72.9±4.4 (26) 9/17 | - | 70.5±7.2 (26) 9/17 | AD: NINCDS-ADRDA | AD: 16.2 HC: Not measured | Active auditory oddball (Count target and press button) | N100 P200 N200 P300 | HC = AD HC < AD (p < 0.05) HC = AD HC > AD (p < 0.001) | HC < AD (p < 0.01) HC < AD (p < 0.001) HC < AD (p < 0.001) HC < AD (p < 0.05) |
| Irimajiri et al. 2005 (USA) [109] | - | 74.8±8.3 (17) 10/7 | 75.8±4.0 (16) 6/10 | MCI: Smith 1996 criteria, neurological and neuropsychological exam Criteria included: moderate to severe defects in episodic memory, no impairment on DRSS, B-RDS and BADLS. | MCI: 27.5±1.7 HC: 29.3±0.8 | Passive hearing | ABR P50 N100 P200 MLR | HC = MCI HC < MCI (p < 0.03) HC < MCI (dependent on stimulus rate) (p < 0.002) HC = MCI HC = MCI | HC = MCI HC = MCI HC = MCI HC = MCI HC = MCI |
| Ito et al. 1990 (Japan) [110] | 60.2 (40) 18/22 | - | 61.8 (40) 20/20 | AD: X-ray CT, MRI and PET assessments | Not measured | Active auditory oddball (Count targets) | N100 P200 P300 | HC = AD HC = AD HC > AD (p < 0.05) | HC = AD HC = AD HC = AD |
| Jessen et al. 2001 (Germany) [111] | 71.2±5.8 (17) 6/11 | - | 67.8±7.4 (17) 6/11 | AD: NINCDS-ADRDA | AD: 17.5±5.4 HC: 29.1±1.0 | Passive double click paradigm | P50 | HC = AD | HC = AD |
| Ji et al. 2015 (China) [112] | - | 65.81±6.90 (43) 22/21 | 66.21±6.81 (43) 19/24 | MCI: DSM-IV | MCI: ? 26 HC: ? 24 | Passive auditory oddball paradigm | MMN | HC = MCI | HC < MCI (p < 0.001) |
| Jiang et al. 2017 (China) [42] | 65.67±8.88 (15) 6/9 | - | 61.10±7.98 (30) 10/20 | AD: DSM-V and Petersen criteria | AD: 23.47±2.64 HC: 28.50±1.11 | Passive auditory oddball paradigm | MMN | HC < AD (p = 0.017) | HC = AD |
| Jimenez-Escrig et al. 2002 (Spain) [113] | 69.7±5.8 (33) 9/24 | - | 64.6±7.5 (16) 12/4 | AD: NINCDS-ADRDA and DSM-IV | Not reported | Active auditory oddball (Press button on target) | P300 | HC = AD | HC < AD (p = 0.0002) |
| Juckel et al. 2008 (Germany) [114] | 66.7±10.2 (18) 8/10 | - | 63.8±11.1 (18) 8/10 | AD: NINCDS-ADRDA | AD: 20.4±5.0 HC: Not reported | Active auditory oddball (Press button on target) | P3a P3b | HC = AD HC > AD (p = 0.01) | HC < AD (p = 0.02) HC = AD (p = 0.2) |
| Kazmerski et al. 1997 (USA) [115] | Active paradigms: 68.7±6.6 (16) 8/8 Passive paradigms: 68.2±5.9 (9) 4/5 (6 from active) | - | Active paradigms: 69.1±6.5 (15) 5/11 Passive paradigms: 70.5±5.3 (17) 3/14 (2 from active) | AD: NINCDS-ADRDA | (Used mMMSE; Score out of 50) Active paradigms: AD: 41.6±6.6 HC: 54.6±1.8 Passive paradigms: AD: 36.0±11.6 HC: 54.5±1.8 | Active auditory oddball (Press button on target) Passive auditory oddball Three-tone Active oddball (Press button on target) Three-tone passive oddball | MMN N200 P300 | HC > AD (All paradigms) (p < 0.05) HC = AD HC = AD | HC = AD HC = AD HC = AD |
| Kuskowski et al. 1991 (USA) [116] | 66.0 (33) 20/13 | - | 64 (16) 8/8 | AD: DSM-III-R | AD: 17.7 HC: Not reported | Passive hearing | ABR | Not measured | HC = AD |
| Lai et al. 2010 (Taiwan) [75] | 71.04±6.52 (20) 11/9 | 68.0±8.70 (18) 11/7 | 64.79±7.75 (14) 9/5 | AD: NINCDS-ADRDA MCI: Winbald criteria | AD: 19.69±1.25 MCI: 23.07±0.84 HC: 28.25±1.52 | Active auditory oddball (Press button on target) | N100 P200 N200 P300 | HC = MCI = AD HC = MCI = AD HC = MCI = AD HC = MCI = AD | HC = MCI = AD HC = MCI = AD HC = MCI = AD HC &MCI < AD @ Pz only HC < MCI @ Pz only (p < 0.05) |
| Lee et al. 2013 (Korea) [117] | 76.45±5.57 (31) 8/23 | - | 75.84±4.74 (31) 5/26 | AD: NINCDS-ADRDA | AD: 16.16±5.25 HC: 25.58±3.60 | Active auditory oddball (Press button on target) | P300 | HC > AD (p = 0.001) | HC = AD |
| Levada et al. 2016 (Ukraine) [118] | - | 75.31±5.65 (32) 11/21 | 73.32±5.41 (25) 6/19 | MCI: DSM-V and MRI | MCI: 25 HC: 29 | Active auditory oddball (Count targets) | P300 | HC = MCI | HC = MCI |
| Li et al. 2010 (China) [119] | - | 72.5±5.4 (34) 21/13 | 71.6±5.7 (34) 23/11 | MCI: Petersen criteria | MCI: 24.4±3.8 HC: 28.1±1.5 | Active auditory oddball (Press button on target) | P50 N100 P200 P300 | HC < MCI (p < 0.001) HC = MCI HC = MCI HC < MCI (p < 0.05) | HC = MCI HC = MCI HC = MCI HC > MCI (p < 0.05) |
| Marsh et al. 1990 (USA) [120] | 65.2±6.7 (18) Not specified | - | 65.4±6.7 (17) Not specified | AD: CDR, neurological examination and neuropsychological assessments, including, MMSE, B-RDS and Hachinski scale. Criteria included: gradual and progressive loss of memory and cognitive function | AD: 24.7±1.3 HC: 29.6±0.7 | Active auditory oddball (Count targets) | N100 P200 P300 | Not measured Not measured Not measured | HC = AD HC = AD HC < AD (p < 0.0001) |
| Masanaka et al. 2005 (Japan) [121] | 71.4±12.7 (15) Not specified | - | 69.6±8.8 (15) Not specified | AD: NINCDS-ADRDA | AD: 17.2±6.5 HC: 29.3±1.2 | ABR: passive hearing N100, P200, N200 &P300: Active auditory oddball (Press button on target) | ABR N100 P200 N200 P300 | Not measured Not measured Not measured Not measured Not measured | HC = AD HC = AD HC = AD HC < AD (p < 0.01) HC < AD (p < 0.01) |
| Medvidovic et al. 2013 (Croatia) [122] | - | 73.9±7.4 (22) 4/18 | 70±5.8 (22) 4/18 | MCI: Neuropsychological testing | Not measured | Active auditory oddball (Count targets) | P300 | Not reported | HC < MCI (p < 0.001) |
| Mowszowski et al. 2012 (Australia) [123] | - | 67.32±8.05 (28) 13/15 | 64.86±4.0 (14) 5/9 | MCI: Petersen criteria, DSM-IV and MMSE | MCI: 27.86±1.58 HC: 29.14±1.03 | Passive hearing | MMN | HC > MCI @ M1 (p = 0.05) &M2 only (p = 0.002) | HC = MCI |
| Muscoso et al. 2006 (Italy) [67] | 70.1±9 (43) 20/23 | - | 68.6±12.5 (39) 21/18 | AD: NINCDS-ADRDA | AD: 20±6.2 HC: 28.7±1.3 | Active auditory oddball (Press button on target) | N100 P200 N200 P300 | Not measured Not measured Not measured Not measured | HC < AD (p < 0.01) HC < AD (p < 0.05) HC < AD (p < 0.01) HC < AD (p < 0.01) |
| O’Mahony et al. 1993 (Ireland) [124] | 78.0±5.7 (15) Not specified | - | 77.5±3.8 (15) Not specified | AD: DSM-III-R | AD: 18.7±2.8 HC: 28.9±1.1 | Active auditory oddball (Raise finger on target) | N200 P300 | Not reported Not reported | HC = AD HC < AD @ Fz only (p < 0.005) |
| O’Mahony et al. 1994 (Ireland) [125] | 73.3±5.5 (35) 7/28 | - | 71.3±4.3 (34) 15/19 | AD: NINCDS-ADRDA HC: MMSE > 27 | AD: 17.4±6.0 HC: 29.6±0.7 | Passive hearing | ABR MLR: P30 (Pa) P50 (P1) | Not measured HC = AD HC > AD (p = 0.006) | HV < AD IPL between waves I-V HC < AD (p = 0.037) HC = AD |
| O’Mahony et al. 1996 (Ireland) [126] | 74.5±4.3 (18) 1/17 | - | 72.7±4.7 (12) 3/9 | AD: NINCDS-ADRDA HC: MMSE > 27 | AD: 17.8±4.8 HC: 29.4±0.7 | Active auditory oddball (Raise finger on target) | N200 P300 | Not measured Not measured | HC < AD (p < 0.005) HC < AD (p < 0.0001) |
| Ortiz et al. 1994 (Spain) [127] | 66.8 (10) 7/3 | - | 66.4 (10) 6/4 | AD: Neuropsychological assessments by certified neurologist, MMSE and Wechsler memory scale | MMSE AD: Not reported HC: 27.8±1.7 | Active auditory oddball (Attend to both target and standard tones) | P300 | HC < AD @ Pz only (p<0.01) | HC < AD @ Fp1, Fp2, F7, F4, F3, Pz, P3 and T5 (p < 0.05) |
| Papadaniil et al. 2016 (Greece) [62] | 70±6.8 (21) 7/14 | 72±4.7 (21) 7/14 | 67±2.7 (21) 8/13 | AD: Treated in memory and dementia outpatient clinics, blood tests, MRI and MMSE HC &MCI: MMSE, blood tests and MRI | AD: 22.6±3.4 MCI: 27±1.4 HC: 28.81±0.9 | Active auditory oddball (Press button on target) | MMN P300 | HC = MCI = AD HC = MCI = AD | HC < AD (p < 0.01) HC < MCI (p < 0.01) HC < AD (p < 0.05) |
| Papaliagkas et al. 2008 (Greece) [128] | - | 67.1±6.9 (91) 35/56 | 68.7±9.9 (30) 15/15 | MCI: Petersen criteria | MCI: 27.7 HC: 29.7 | Active auditory oddball (Count targets) | N200 P300 Slow Wave | HC < MCI (p < 0.05) HC = MCI N/A | HC = MCI HC < MCI (p < 0.001) HC < MCI (p < 0.001) |
| Papaliagkas et al. 2011 (Greece) [129] | - | 67.4±7.8 (22) Not specified | 68.7±9.9 (30) 15/15 | MCI: Petersen criteria | MCI: 27.9±1.9 HC: 29.7 | Active auditory oddball (Count targets) | N200 P300 Slow wave | HC < MCI (p = 0.002) Not reported N/A | HC < MCI (p = 0.042) HC < MCI (at follow up) (p < 0.05) HC = MCI |
| Phillips et al. 1997 (Canada) [56] | M: 69.4±7.0 F: 68.8±7.5 M + F: 69.1±6.9 (14) 8/6 | - | M: 66.8±8.3 F: 69.8±4.9 M + F: 68.2±6.9 (22) 12/10 | AD: NINCDS-ADRDA | Not measured | Rarefaction click paradigm | P30 (Pa) P50 (Pb) | HC < AD (p = 0.029) HC = AD | HC = AD HC = AD |
| Pokryszko-Dragan et al. 2003 (Poland) [130] | 68.6 (13) 4/9 | - | Aged matched but not specified (13) Not specified | AD: NINCDS-ADRDA | Not reported | Active auditory oddball (Raise hand on target) | P300 | HC = AD | HC < AD (p < 0.05) |
| Rai 1990 (England) [131] | 76.0±6.5 (62) 17/45 | - | 79.7±5.8 (49) 12/37 | AD: Clinical examination, psychological assessment and, MMSE | AD: 21.8±3.4 HC: 29.0±0.9 | Active auditory oddball (Press button on target) | N200 | Not measured | HC = AD |
| Revonsuo et al. 1998 (Finland) [132] | 67.1±8.3 (9) 3/6 | - | 67.4±4.0 (17) 9/8 | AD: NINCDS-ADRDA, DSM-III-R and MRI or CT | AD: 18±6.7 HC: 27.7±1.8 | Semantic activation (Congruous and incongruous spoken words) | N100 P200 N400 | HC = AD HC = AD Not reported | HC > AD Congruous words (p < 0.05) HC = AD HC = AD |
| Riekkinen et al. 1997 (Finland) [52] | APOE E4+ 66±4 APOE E4 - 68±6 Combined: 66.8±8.9 (19) Not specified | - | 67±5 (14) Not specified | AD: NINCDS-ADRDA | AD: APOE E4 + 18±4 APOE E4 - 19±6 Combined: 18.4±4.8 HC: 28±2 | Passive oddball paradigm | MMN | HC = AD | Not measured |
| Schwartz et al. 2003 (USA) [133] | 76.5 (12) 5/7 | - | 71.5 (12) 4/8 | AD: NINCDS-ADRDA | Not measured | Active spoken word and sentence comprehension (Press button for response) | N400 | HC =AD | HC = AD |
| St Clair et al. 1985 (Scotland) [134] | 61.4 (15) 5/10 | - | 62 (23) 7/16 | AD: neurological and psychological assessments Criteria included: steadily progressing dementing illness and memory impairment as the presenting feature, cerebral atrophy (CT scan) and, AD biomarkers in CSF. | Not measured | Active auditory oddball (Count targets) | N100 P200 N200 P300 | HC > AD (p < 0.05) HC > AD (p < 0.05) Not reported HC > AD (p < 0.001) | Not reported Not reported HC < AD (p < 0.01) HC < AD (p < 0.01) |
| Sumi et al. 2000 (Japan) [135] | 70±6.6 (34) 16/18 | - | 68.5±4.9 (39) 18/21 | AD: NINCDS-ADRDA | Not measured | Active auditory oddball (Press button on target) | N100 P200 N200 P300 | Not measured Not measured Not measured Not measured | HC = AD HC = AD HC < AD (p < 0.01) HC < AD (p < 0.01) |
| Swartz et al. 1992 (USA) [136] | 76 (6) 4/2 | - | 73 (12) 5/7 | AD: NINCDS-ADRDA | Not measured | Active auditory oddball (Press button on target) | P300 | HC = AD | HC < AD (p = 0.04) |
| Tachibana et al. 1989 (Japan) [137] | 70.6±7.0 (16) 11/5 | - | 69.1±7.3 (34) 15/19 | AD: NINCDS-ADRDA and DSM-III-R | Not measured | Passive hearing | ABR | Not measured | HC < AD for wave V, IPL between III-V &I-V only (p < 0.01) |
| Tachibana et al. 1996 (Japan) [43] | 71.4±12.7 (15) 10/5 | - | 69.6±8.8 (15) 9/6 | AD: NINCDS-ADRDA and DSM-III-R | AD: 17.2±6.5 HC: Not measured | ABR: passive hearing N100, P200, N200 &P300: Active auditory oddball (Press button on target) | ABR N100 P200 N200 P300 | Not measured Not measured Not measured Not measured Not measured | HC < AD for IPL between I-V in both L &R ears (p < 0.05) HC = AD HC < AD (p < 0.05) HC < AD (p < 0.01) HC < AD (p < 0.05) |
| Taguchi et al. 2003 (Japan) [138] | 71.2±9.3 (31) 11/20 | - | 68.9±4.9 (34) 10/24 | AD: NINCDS-ADRDA | Not measured | Active auditory oddball (Press button on target) | N100 P200 N200 P300 | Not measured Not measured Not measured Not measured | HC = AD HC = AD HC < AD (p < 0.001) HC < AD (p < 0.001) |
| Tarkka et al. 2002 (Finland) [139] | Sporadic 71±8 (34) Not specified Familial 70±9 (22) Not specified Combined: 70.6±8.3 (56) | - | 72±3 (25) Not specified | AD: NINCDS-ADRDA | Not measured | Passive hearing | N100 | HC = Sporadic AD HC < Familial AD only (p < 0.05) | HC = Sporadic AD HC > Familial AD only (p < 0.05) |
| Thomas et al. 2010 (Germany) [140] | 75.21±5.0 (19) 8/11 | - | 72.29±5.1 (17) 6/11 | AD: NINCDS-ADRDA | AD: 20.9±5.1 HC: 29.5±0.06 | Passive double click paradigm | P50 | HC < AD (p < 0.01) | HC = AD |
| Tsolaki et al. 2017 (Greece) [141] | 70±6.8 (21) 7/14 | 72±4.7 (21) 7/14 | 67±2.7 (21) 8/13 | AD: NINCDS-ADRDA and DSM-V MCI: Petersen criteria | AD: 22.6±6.8 MCI: 27±1.4 HC: 28.81±0.9 | Active auditory oddball (Press button on target) | MMN N100 P300 | HC = MCI = AD HC = MCI = AD HC = MCI = AD | HC < AD (p < 0.01) HC = MCI = AD HC < AD (p < 0.005) |
| Vaitkevicius et al. 2015 (Lithuania) [142] | AD-N: 74.36±4.75 (22) 14/8 AD-T: 74.23±5.21 (22) 8/14 Combined: 74.3±4.9 (44) 22/22 | - | 74.06±4.49 (50) 24/26 | AD: NINCDS-ADRDA | AD-N: 20.73±1.7 AD-T: 20.14±1.36 Combined AD: 20.4±1.5 HC: 29.04±0.92 | Active auditory oddball (Press button on target) | N200 P300 | HC = AD HC = AD | HC > AD (p < 0.001) HC < AD (p < 0.001) |
| Van Deursen et al. 2009 (Netherlands) [143] | 75.2±6.9 (15) 11/4 | 70.6±7.2 (20) 12/8 | 69.5±6.1 (20) 12/8 | AD: NINCDS-ADRDA MCI: Petersen criteria | AD: 20.8±2.7 MCI: 26.3±1.6 HC: 29.3±0.8 | Active auditory oddball (Press button on target) | N200 P300 | HC = MCI = AD HC > MCI HC > AD (p < 0.05) | HC = MCI = AD HC < MCI HC < AD (p < 0.05) |
| Van Deursen et al. 2011 (Netherlands) [144] | 75.2±6.9 (15) 11/4 | 70.6±7.2 (20) 12/8 | 69.5±6.1 (20) 12/8 | AD: NINCDS-ADRDA MCI: Petersen criteria | AD: 20.8±2.7 MCI: 26.3±1.6 HC: 29.3±0.8 | Passive hearing | ASSR | HC < AD @ T5, T6 &O2 (p < 0.05) HC = MCI MCI < AD @ T6 (p < 0.05) | Not measured |
| Williams et al. 1991 (UK) [145] | 75±8.7 (17) Not specified | - | 74±6.4 (17) Not specified | AD: DSM-III | Not measured | Active auditory oddball (Press button on target) | N100 P200 N200 P300 | HC = AD HC = AD HC = AD HC > AD (p < 0.05) | HC < AD (p < 0.01) HC = AD HC < AD (p < 0.001) HC < AD (p < 0.01) |
| Yamaguchi et al. 2000 (Japan) [146] | 68.5±8.0 (16) Not specified | - | 69.6±9.3 (18) Not specified | AD: NINCDS-ADRDA | Not measured | Three-tone active oddball (Press button on target) | P100 N100 P200 P300 | HC = AD HC > AD (p < 0.05) HC = AD HC < AD for novel sounds (p < 0.005) HC > AD for target tones (p < 0.005) | HC = AD HC = AD HC = AD HC = AD for novel sounds HC < AD for target tones (p < 0.0001) |
| Yokoyama et al. 1995 (Japan) [147] | 66.8 (12) Not specified | - | 66.4 (13) Not specified | AD: NINCDS-ADRDA and DSM-III-R | Not measured | MMN: passive hearing N100, P200, N200 &P300: Active auditory oddball (Raise finger on target) | MMN N100 P200 N200 P300 | HC = AD HC = AD HC = AD HC = AD HC > AD @ Pz (p<0.05) | HC < AD @ Pz, P3, P4 (p < 0.05) HC = AD HC = AD HC < AD @ Pz (p < 0.01) HC < AD @ Pz (p < 0.05) |
AERP, Auditory event-related potential; AD, Alzheimer’s group; MCI, Mild cognitive impairment group; SCD, Subjective cognitive decline group; HC, Healthy controls (aged matched); CDR, Clinical dementia rating; NINCDS-ADRDA, National Institute of Neurological and Communicative Disorders and Stroke and the Alzheimer’s disease and Related Disorders Association; DSM, Diagnostic and Statistical Manual of Mental Disorders; MoCA, Montreal Cognitive Assessment; MMSE, Mini-Mental State Examination; DRSS, Dementia Rating Severity Scale; B-RDS, Blessed-Roth Dementia Scale; BADLS, Bristol Activity of Daily Living Scale; TS-P300, Temporo-superior P300 component; TB-P300, Temporo-basal P300 component; IPL, Interpeak latency; L, Left ear; R, Right ear; MCI-SD, Single domain amnestic mild cognitive impairment; MCI-MD, Multiple domain amnestic mild cognitive impairment; MCI-P, Mild cognitive impairment patients with progressive decline; MCI-S, Stable mild cognitive impairment; AD-N, Treatment naïve; AD-T, Treatment group (10 mg/day donepezil); APOE E4+, Apolipoprotein E4 alleles positive; APOE E4-, Apolipoprotein E4 alleles negative; MMN, Mismatch negativity; FFR, Frequency-following response; ABR, Auditory brain response; ASSR, Auditory steady-state response; MLR, Middle latency response.
Studies included in the review assessed most AERPs including: ABR, ASSR, FFR, MLR, MMN, positive late latency AERPs (P50, P200, and P300), and negative late latency AERPs (N100, N200, N400). These AERPs were elicited using varying cognitive tasks, including passive double (paired) click paradigm, active (two-tone and three-tone) oddball paradigm, passive oddball paradigm, active vowel discrimination task, passive (rarefaction clicks) hearing task, semantic activation task and spoken word paradigm. The studies included in the systematic review are summarized in Table 1.
Meta-analysis
The results of the meta-analyses are reported as standard difference in mean (SMD) with 95%confidence intervals (CI) as the synthesized measure of effect size. The meta-analyses results are reported under the random effects model, which accounts for any variations between study methodologies. An effect size between 0.2 and 0.5 is considered a small effect, between 0.5 and 0.8 is considered a medium effect, while an effect size 0.8 or higher is considered a large effect [50]. The Cochrane’s Q-Value statistic was performed to test heterogeneity of the studies and the I-squared (I2) statistic was performed to indicate heterogeneity as a percentage. Heterogeneity analysis results are presented as part of the “summary” on the meta-analyses forest plots.
Auditory brainstem responses and mismatch negativity
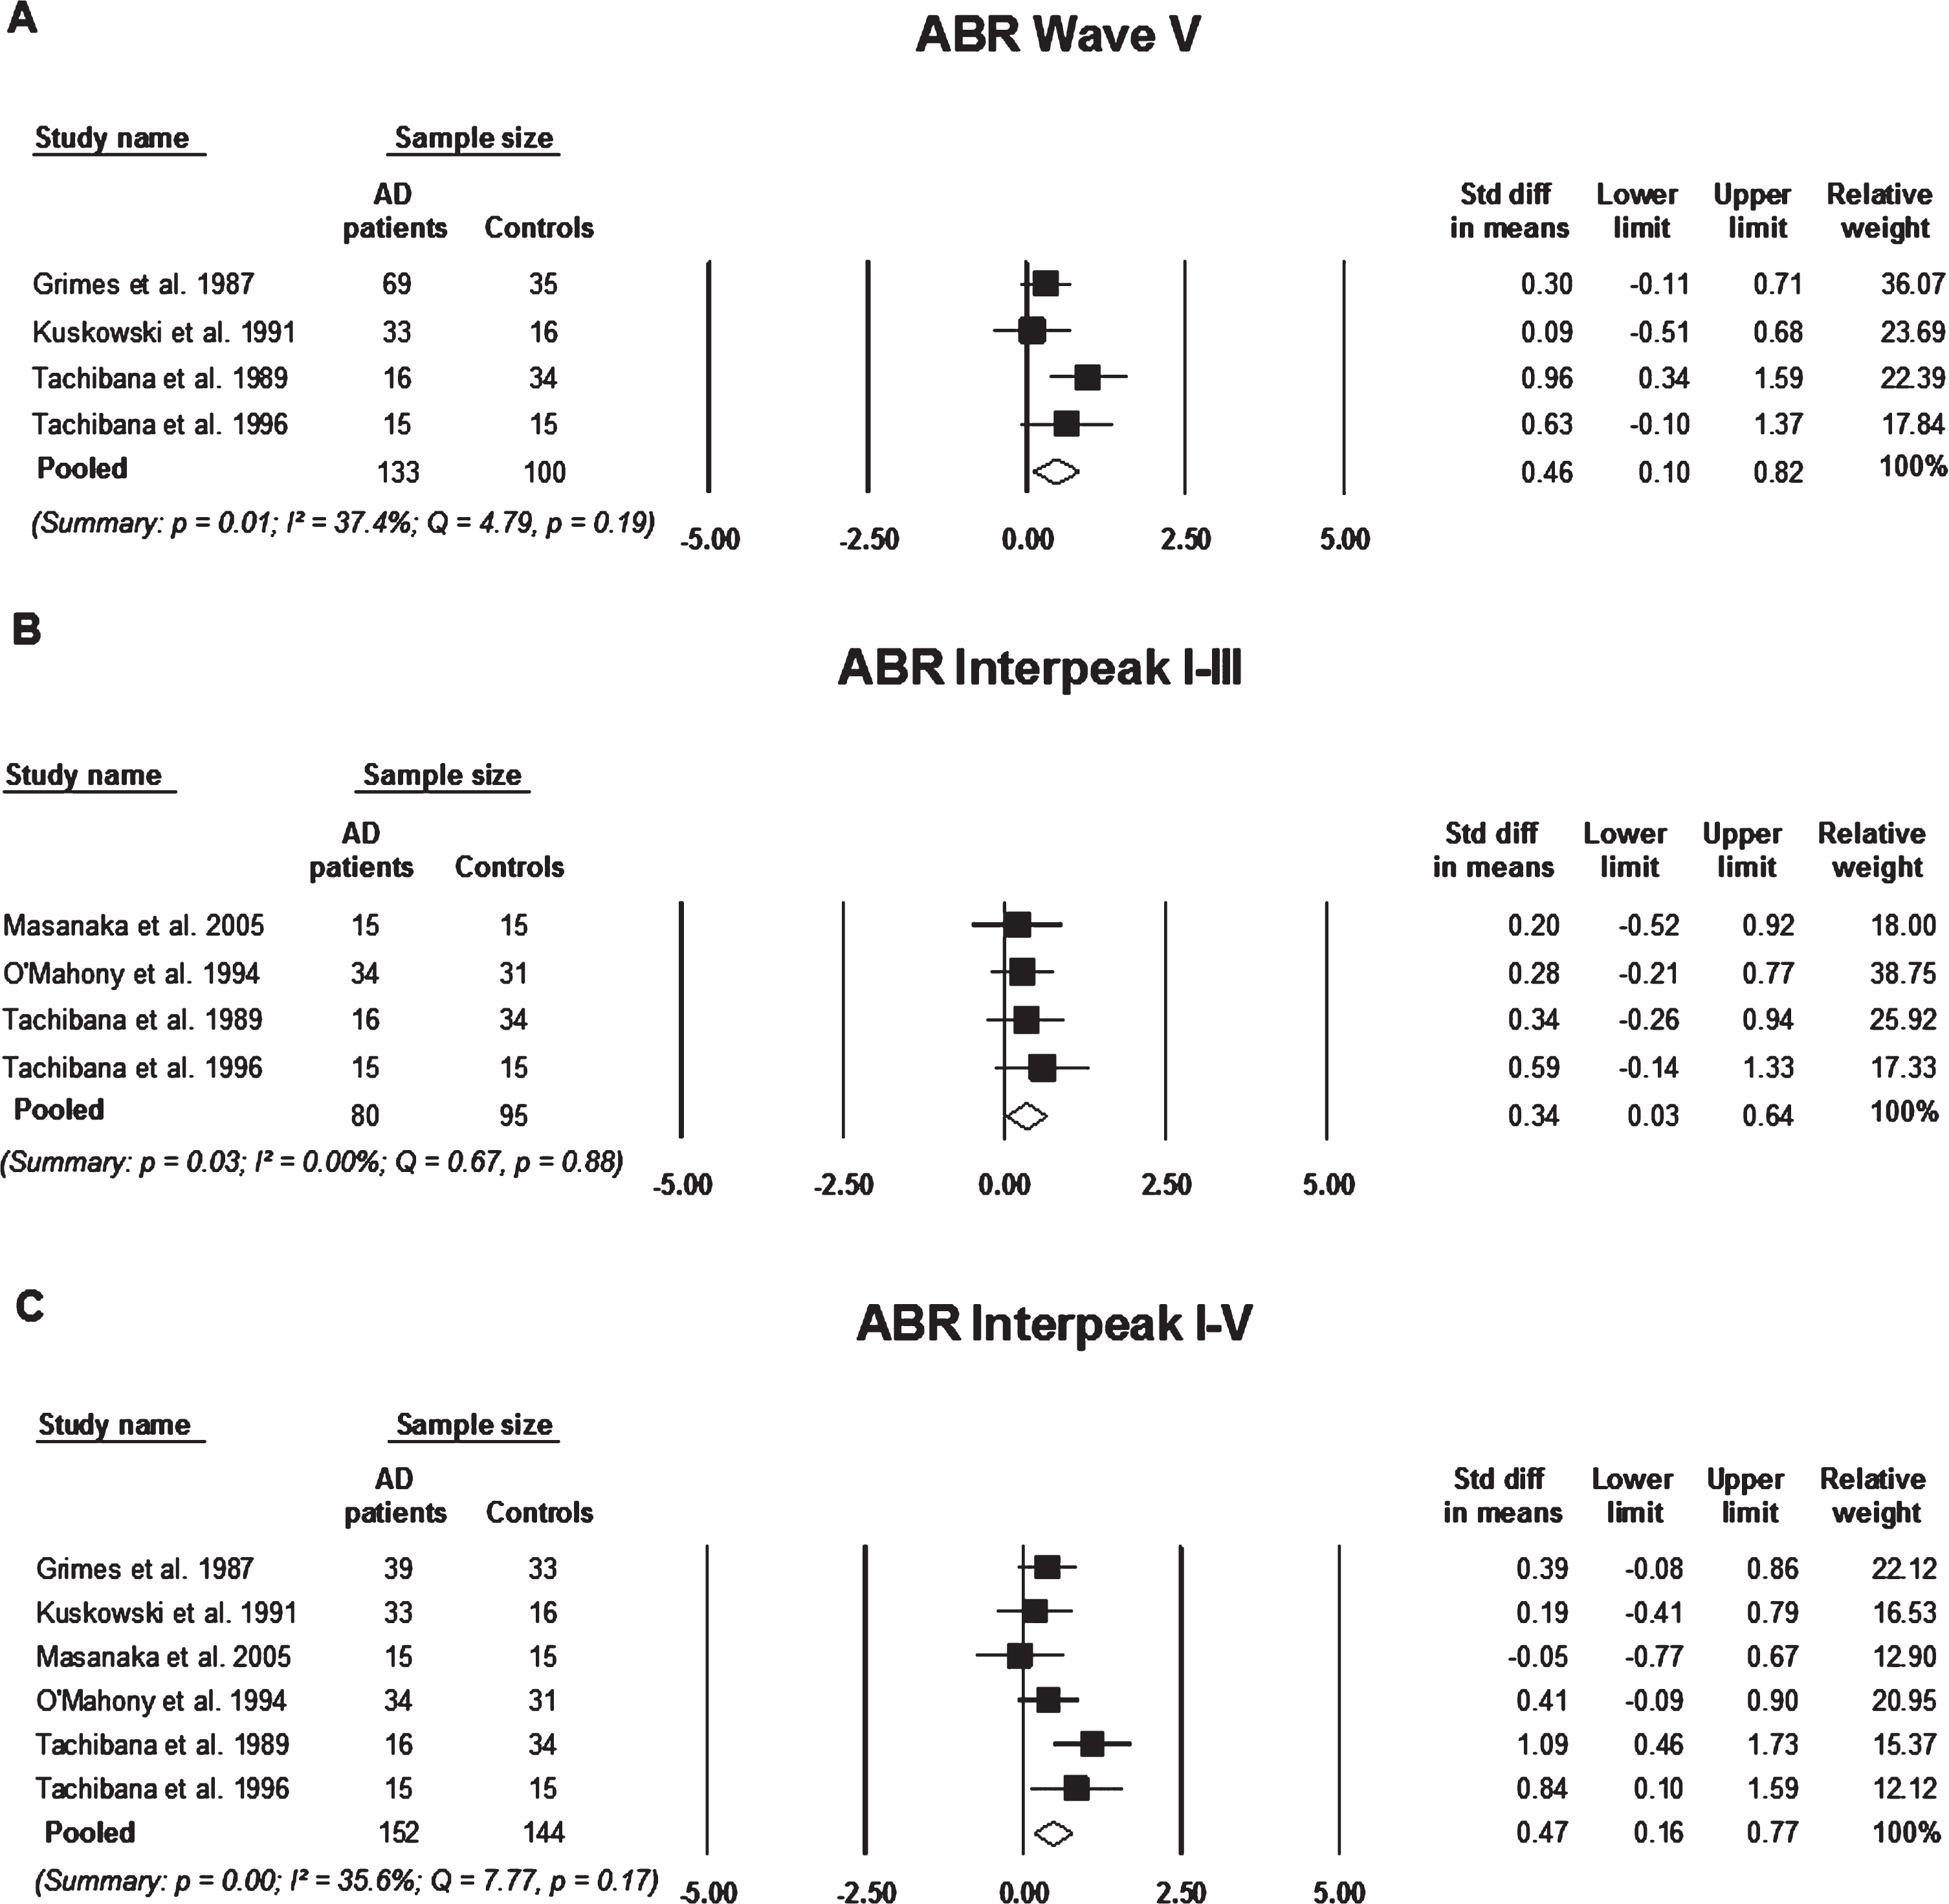
Compared to the control group, AD participants had significantly prolonged ABR Wave V latencies, pooled SMD: 0.46 (n = 4, 95%CI: 0.10 to 0.82, p = 0.01; Fig. 2A). Although the effect size would be considered small (< 0.5) [50], the variation in ABR wave V latency between participants with AD and healthy controls was significant when using a passive rarefaction click paradigm. No significant difference in SMD between controls and AD participants was seen in ABR waves I and III; pooled SMD: –0.06 (n = 3, 95%CI: –0.42 to 0.31, p = 0.76; Supplementary Figure 1A) and 0.25 (n = 3, 95%CI: –0.11 to 0.62, p = 0.18; Supplementary Figure 1B), respectively. A statistically significant difference in pooled SMD between controls and AD participants was present in interpeak I-V and interpeak I-III latencies; SMD 0.47 (n = 6, 95%CI: 0.16 to 0.77, p = 0.00; Fig. 2B), and 0.34 (n = 4, 95%CI: 0.03 to 0.64, p = 0.03; Fig. 2 C), respectively. There was no significant difference in interpeak III-V latencies between AD participants and controls in the reviewed studies, pooled SMD: 0.31 (n = 5, 95%CI: –0.17 to 0.80, p = 0.21; Supplementary Figure 1 C). MMN amplitude did not differ significantly between AD and control participants when elicited using the passive oddball paradigm and pooled analysis revealed no effect (effect size < 0.2 [51]), SMD: –0.06 (n = 3, 95%CI: –0.46 to 0.34, p = 0.76; Supplementary Figure 2).
Fig. 2
Standard mean difference and pooled estimated of each study included in the meta-analyses of auditory brainstem responses (ABR) elicited using the passive rarefaction click paradigm. All the analyses compare participants with Alzheimer’s disease (AD) to controls A) analysis of ABR wave V latency, B) analysis of ABR interpeak wave I-III, and C) analysis of ABR interpeak wave I-V. Summary includes: p = significance level; I2 = percentage of heterogeneity; Q = Cochrane’s Q. The horizontal lines represent the 95%confidence interval for each computed standard mean difference. Note: weights are from random effects analysis.
P50 (Pb or P1)
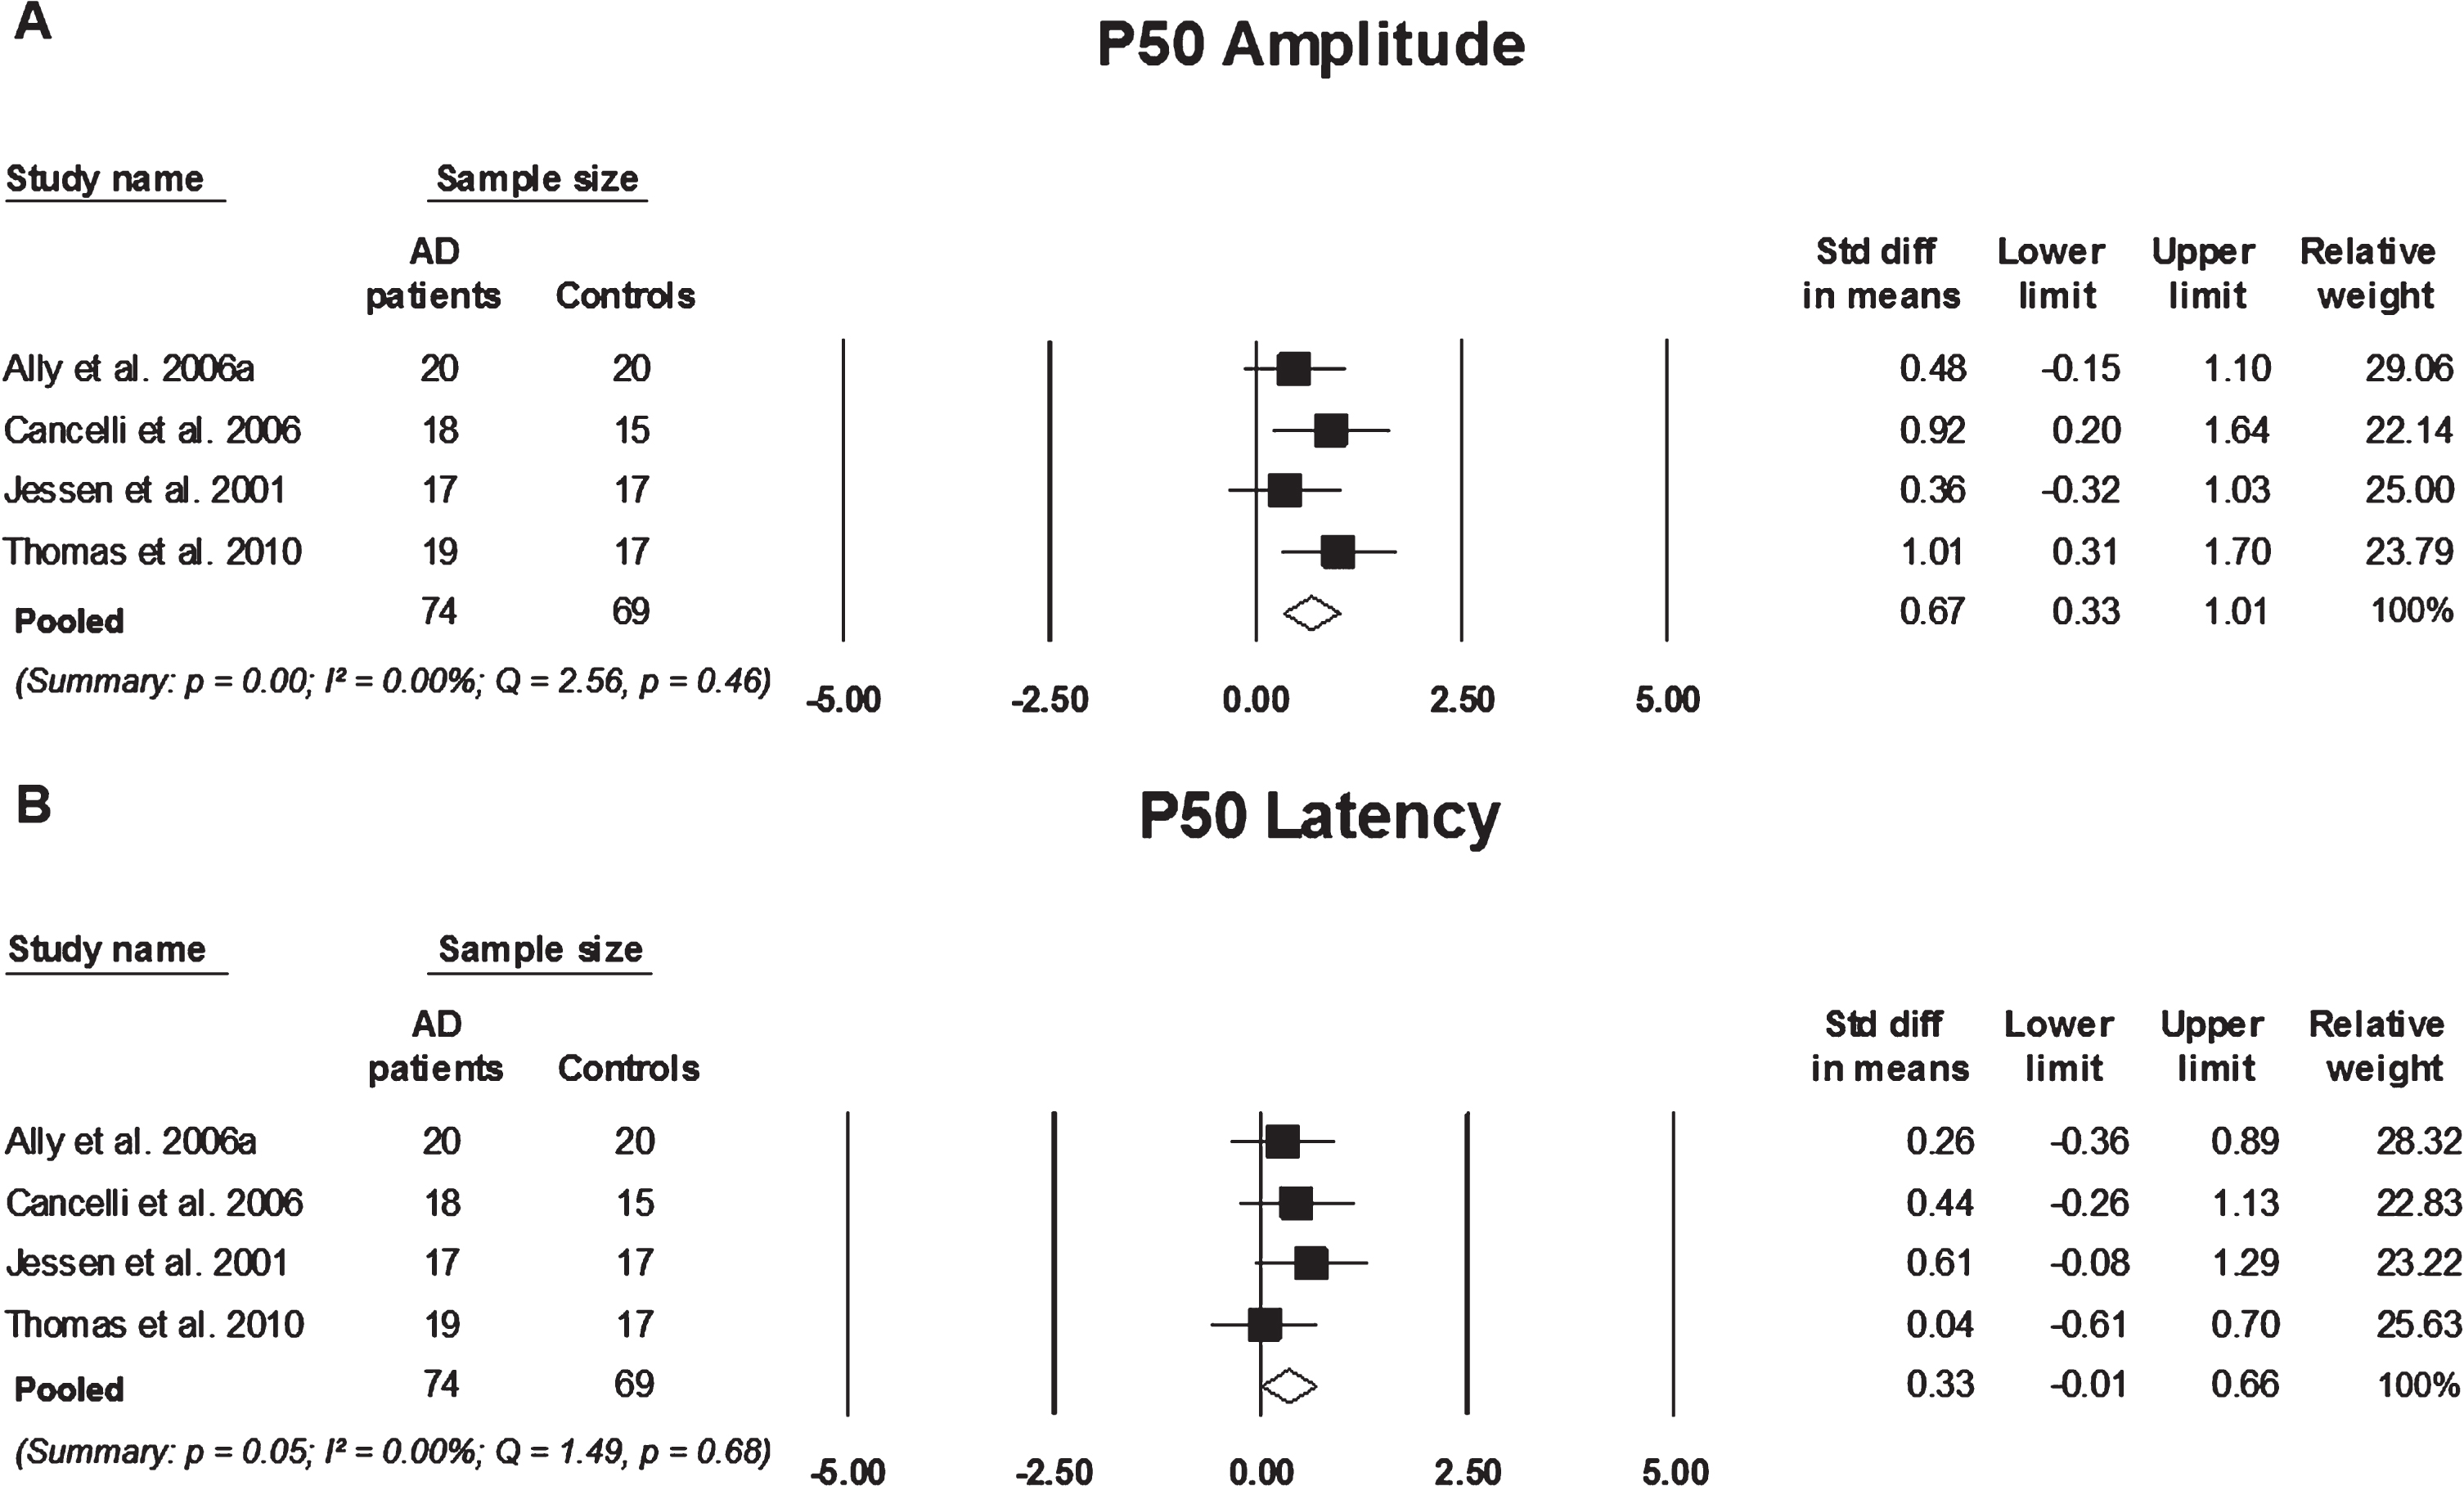
P50 elicited using the paired-click paradigm varied significantly in amplitude and latency between AD participants and controls. AD participants had larger P50 amplitudes and prolonged P50 latencies in comparison to controls, pooled SMD: 0.67 (n = 4, 95%CI: 0.33 to 1.01, p = 0.00; Fig. 3A) and 0.33 (n = 4, 95%CI: –0.01 to 0.66, p = 0.05; Fig. 3B), respectively. The pooled effect size suggests that the average P50 amplitude for a participant in the AD group is 0.67 SD above that of a participant in the control group, hence the average AD participant would have larger P50 amplitude than over 73%of the participants in the control group. On the other hand, pooled analysis of P50 elicited using the rarefaction click paradigm showed no significant difference in P50 amplitudes or latencies between controls and AD participants (n = 2; Supplementary Figure 3).
Fig. 3
Standard mean difference and pooled estimated of each study included in the meta-analyses of P50 elicited using the paired-click paradigm. A) comparing P50 amplitude between participants with Alzheimer’s disease AD to controls, B) comparing P50 latency between participants with AD and controls, Summary includes: p = significance level; I2 = = percentage of heterogeneity; Q = Cochrane’s Q. The horizontal lines represent the 95%confidence interval for each computed standard mean difference. Note: weights are from random effects analysis.
3.4.2N100 & P200
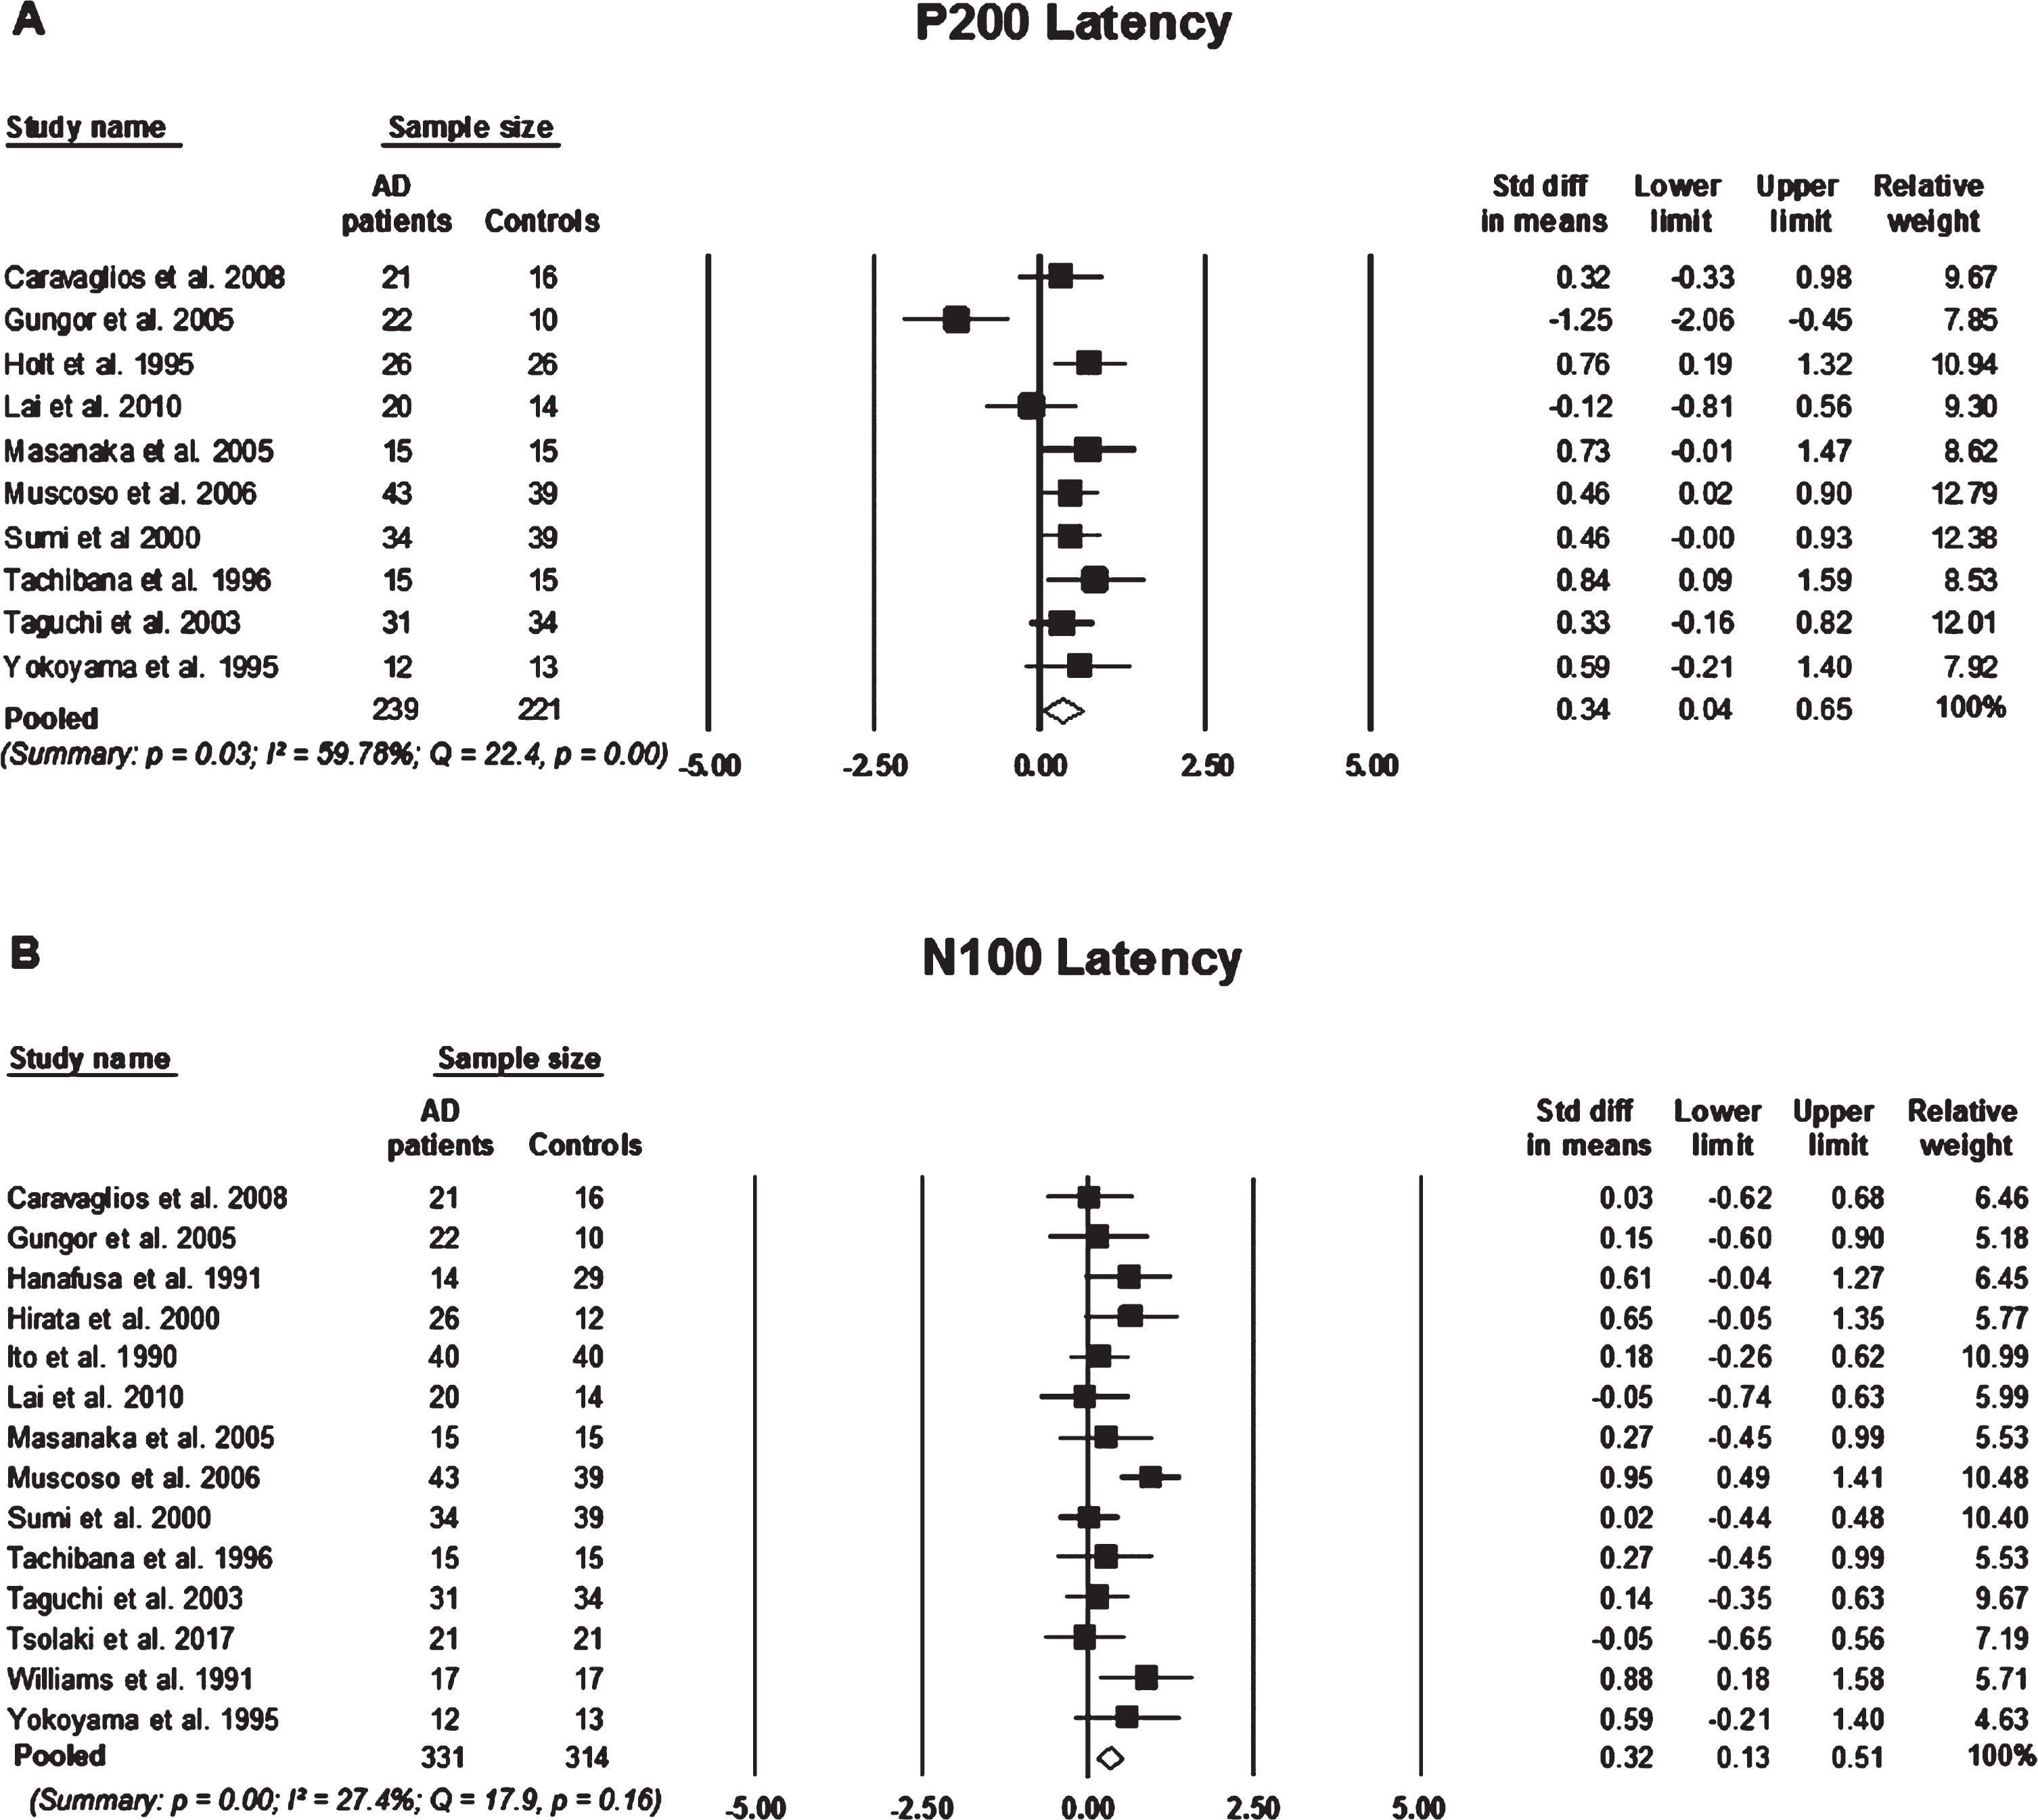
Although there was a small pooled effect size, participants with AD showed prolonged N100 latencies in comparison to control participants, pooled SMD: 0.32 (n = 14, 95%CI: 0.13 to 0.51, p = 0.00; Fig. 4B). MCI participants did not significantly differ in N100 latency from control participants, pooled SMD 0.20 (n = 2, 95%CI: –0.58 to 0.93, p = 0.59; Supplementary Figure 4A). The SMD between AD, MCI, and control participants were not significant for N100 amplitude (Supplementary Figure 4B,C). Similarly, P200 latencies differed significantly between AD participants and controls, SMD: 0.34 (n = 10, 95%CI: 0.04 to 0.65, p = 0.03; Fig. 4A), however, did not differ significantly between MCI and control participants. Also, there was no significant difference present in P200 amplitude in participants with AD or MCI in comparison to controls (n = 2, p > 0.05; Supplementary Figure 5).
Fig. 4
Standard mean difference and pooled estimated of each study included in the meta-analyses of P200 and N100 elicited using an active two-tone oddball paradigm. A) Comparing P200 latency between participants with Alzheimer’s disease (AD) and controls, B) comparing N100 latency between participants with AD and controls. Summary includes: p = significance level; I2 = percentage of heterogeneity; Q = Cochrane’s Q. The horizontal lines represent the 95%confidence interval for each computed standard mean difference. Note: weights are from random effects analysis.
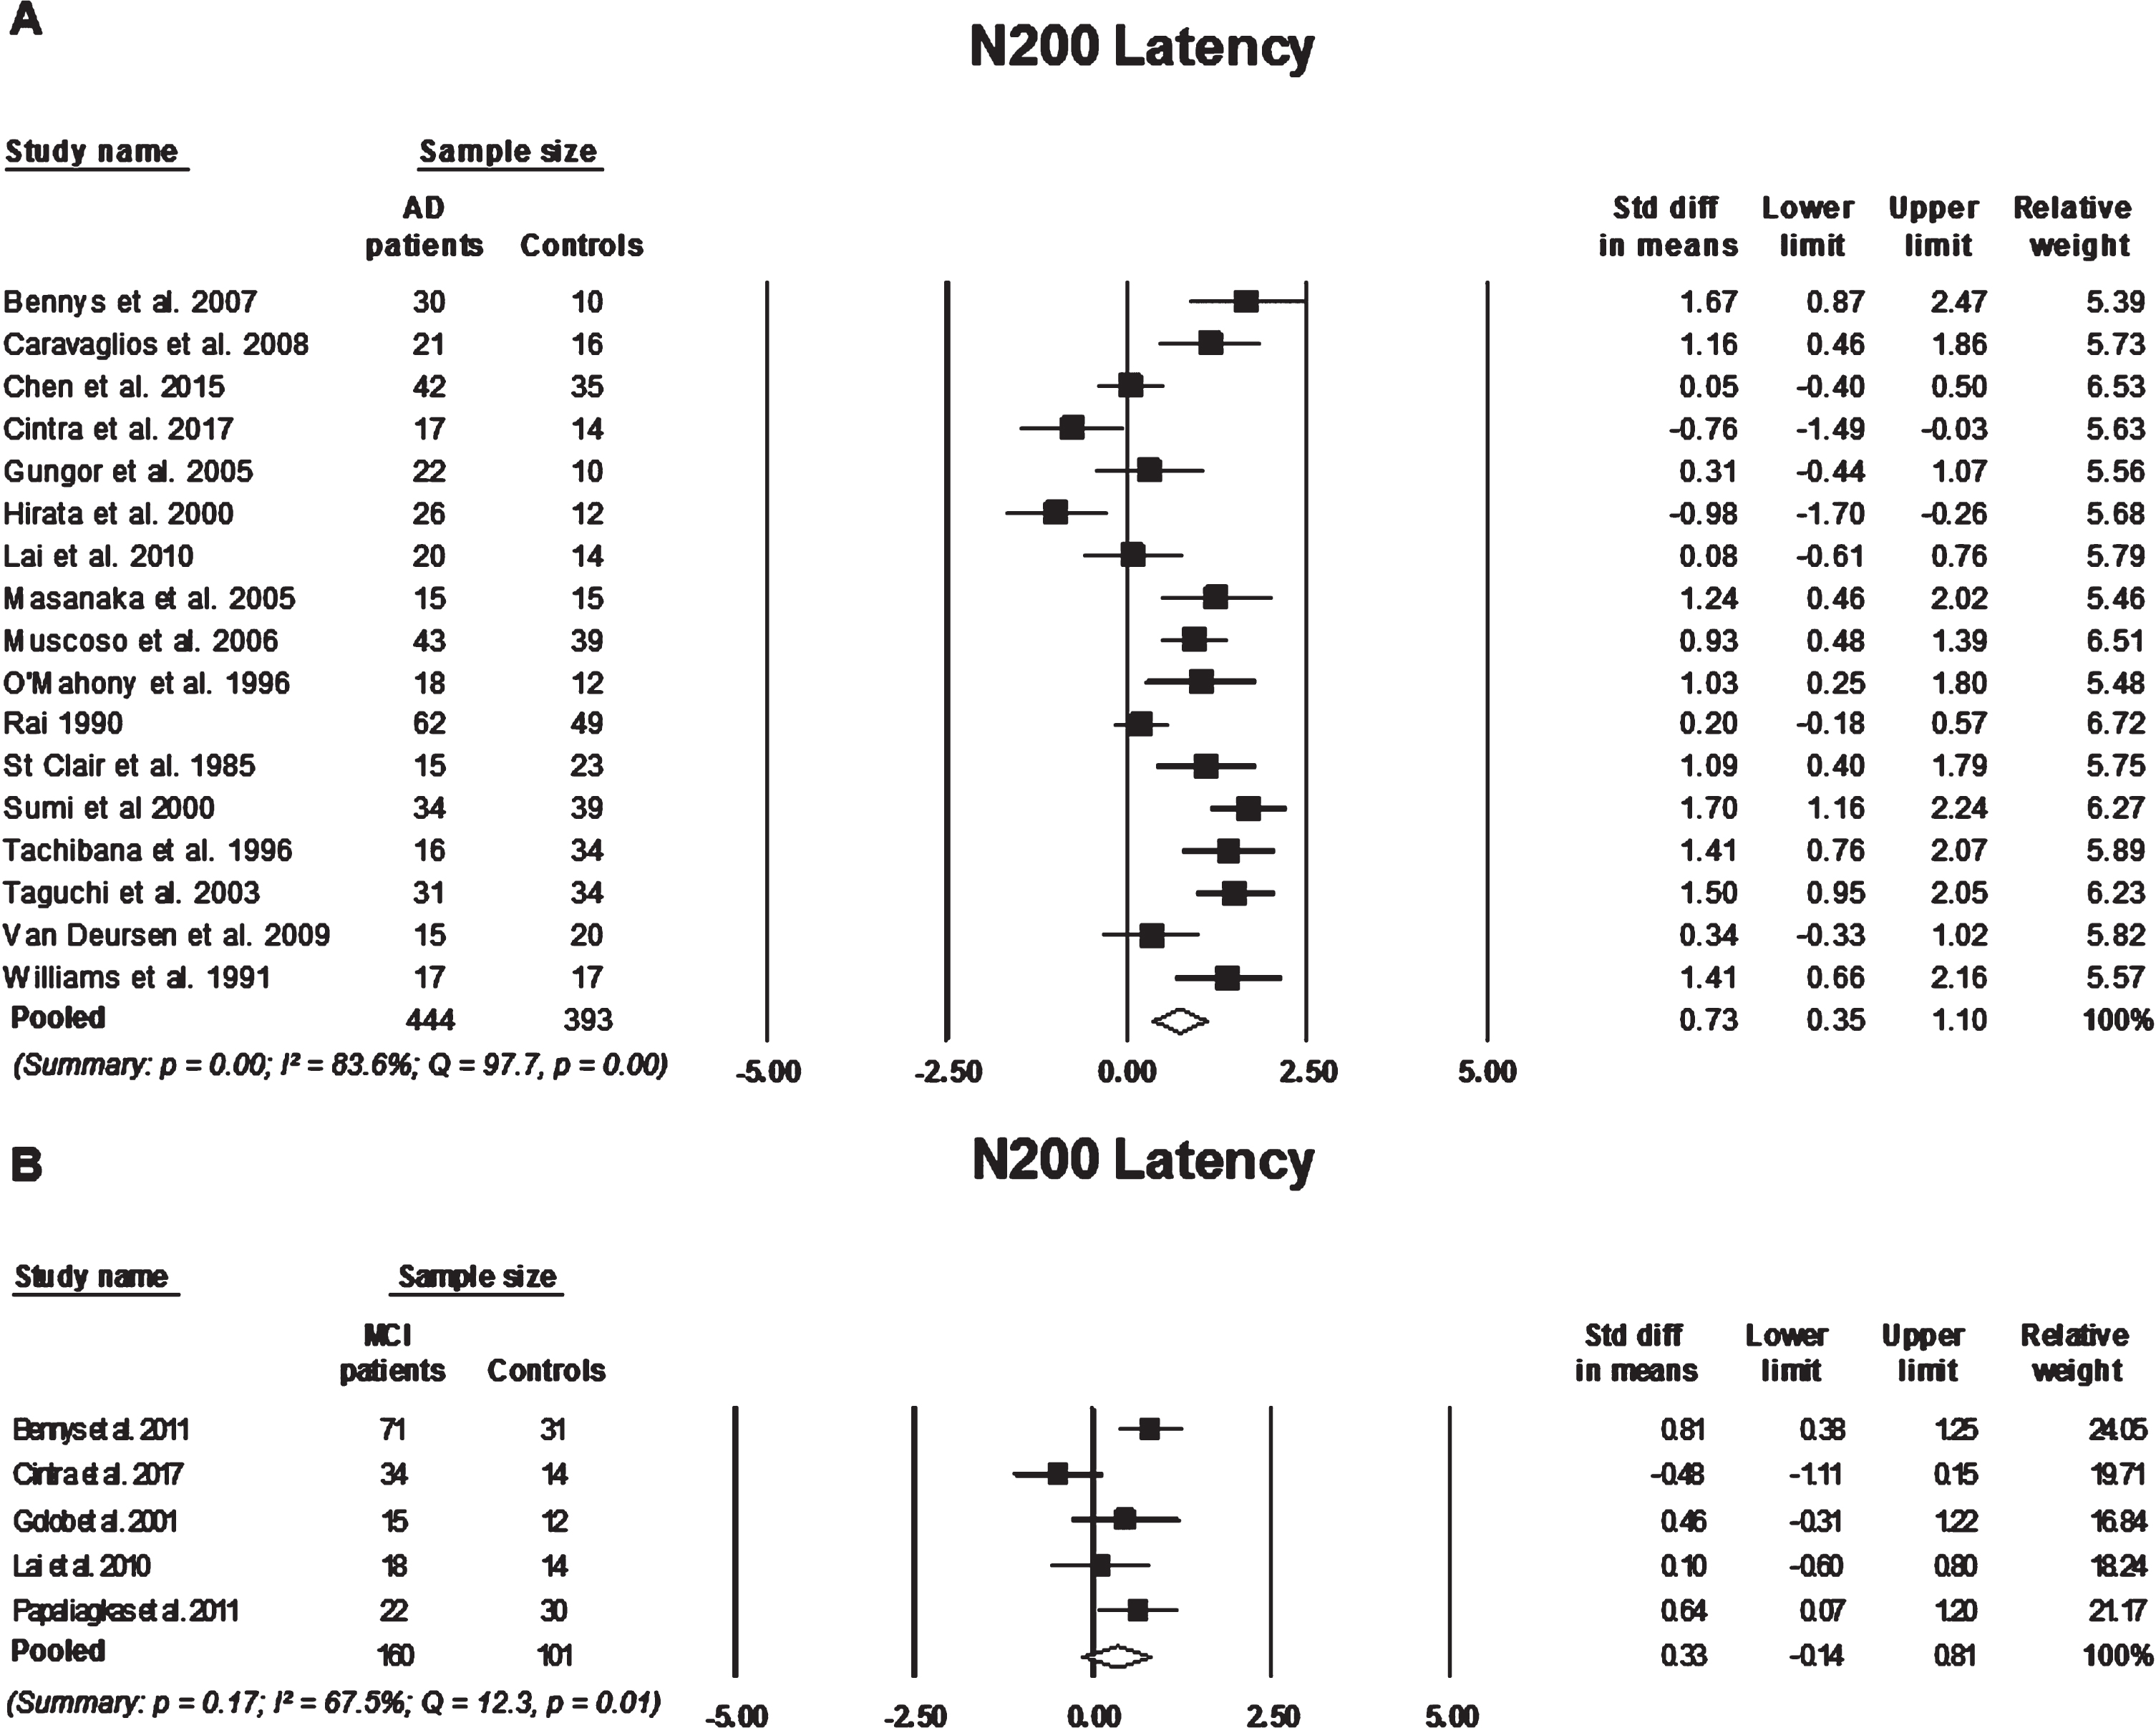
N200
N200 latencies, elicited using an active two-tone paradigm, were significantly prolonged in AD in comparison with controls, pooled SMD: 0.73 (n = 17, 95%CI: 0.35 to 1.10, p = 0.00; Fig. 5A). However, N200 latency was not significantly different between MCI participants in comparison to controls, pooled SMD: 0.33 (n = 5, 95%CI: –0.14 to 0.81, p = 0.17; Fig. 5B). Indicating that the average AD participant would have a significantly more delayed N200 latency than over 76%of control participants. To a slightly lesser extent, a participant in the MCI group would have a longer N200 latency than over 62%of control participants. However, there was no statistically significant difference in N200 mean latencies between AD participants and MCI participants, pooled SMD: –0.17 (n = 2, 95%CI: –0.60 to 0.26, p = 0.43; Supplementary Figure 6A). There was no significant difference present in N200 amplitudes between any of the participant groups (Supplementary Figure 6B, C).
Fig. 5
Standard mean difference and pooled estimated of each study included in the meta-analyses of N200 elicited using an active two-tone oddball paradigm. A) comparing N200 latency between participants with Alzheimer’s disease (AD) and controls, B) comparing N200 latency between participants with mild cognitive impairment (MCI) to controls. Summary includes: p = significance level; I2 = percentage of heterogeneity; Q = Cochrane’s Q. The horizontal lines represent the 95%confidence interval for each computed standard mean difference. Note: weights are from random effects analysis.
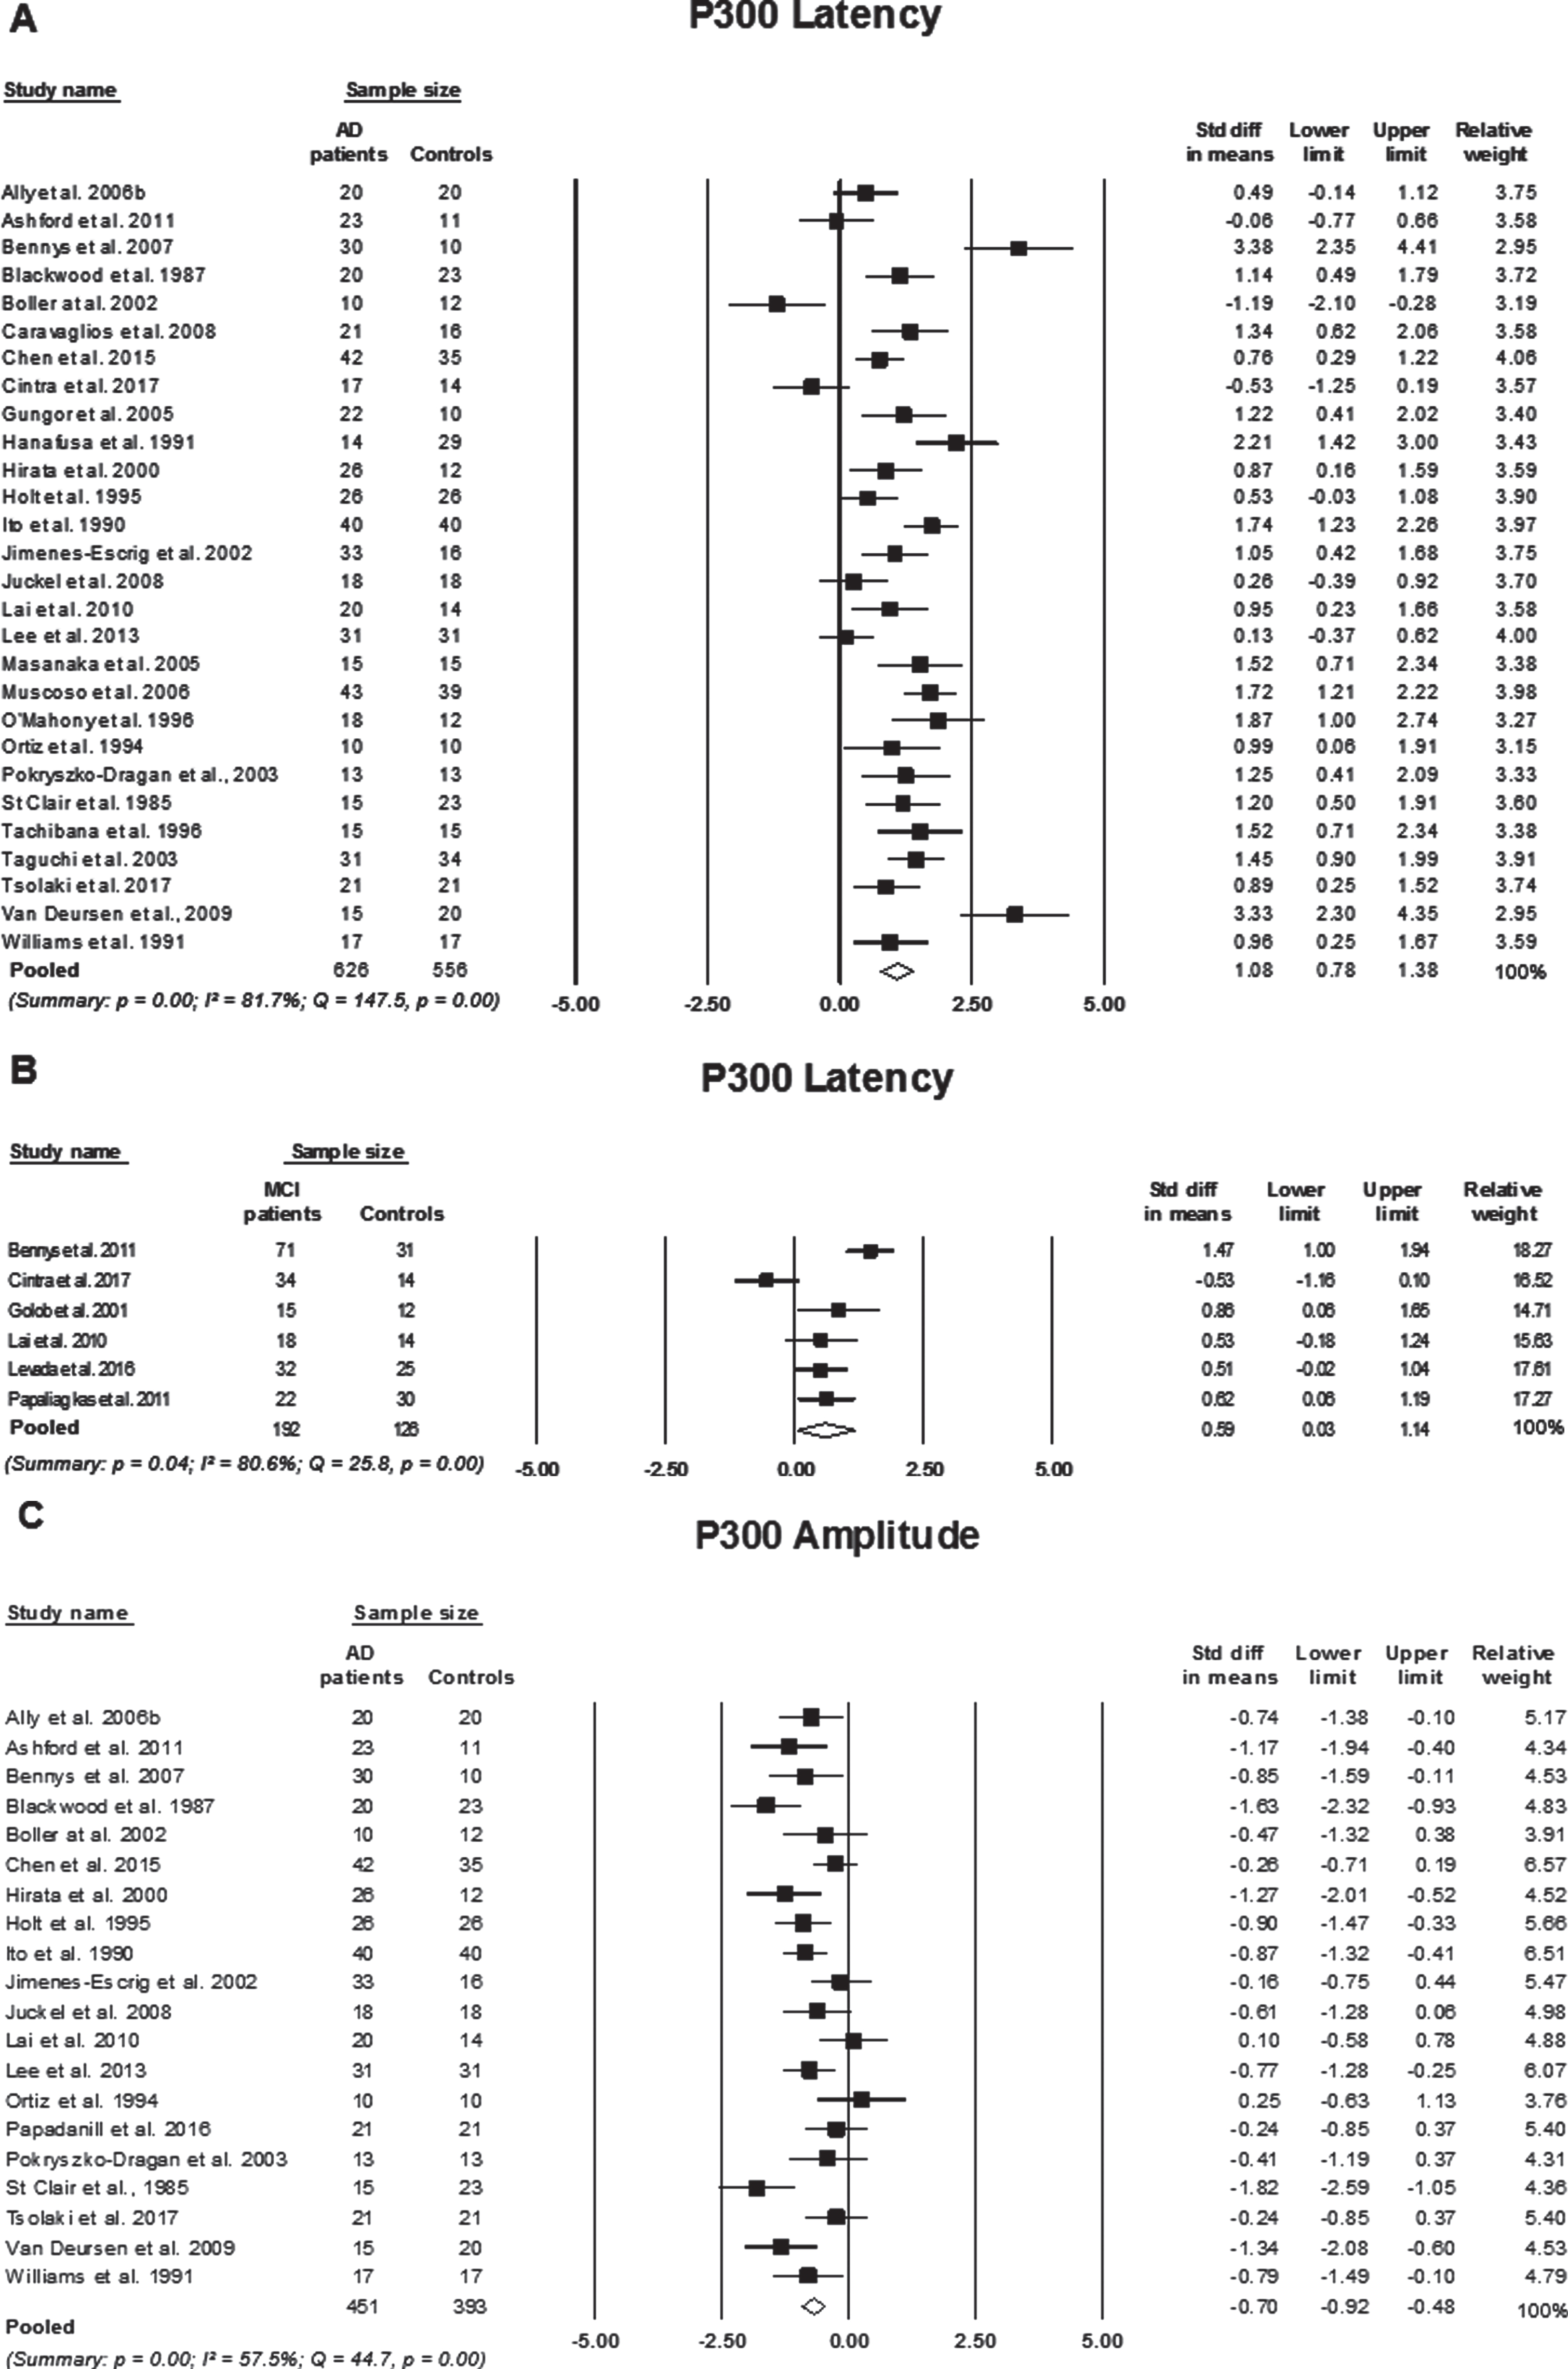
P300
Compared to controls, participants with AD had significantly prolonged P300 latencies with a large effect size (effect size > 0.8), pooled SMD: 1.08 (n = 28, 95%CI: 0.78 to 1.38, p = 0.00; Fig. 6A). MCI participants also had prolonged P300 latencies in comparison to controls with a medium effect size (effect size between 05–0.8), pooled SMD: 0.59 (n = 6, 95%CI: 0.03 to 1.14, p = 0.00; Fig. 6B), suggesting that an AD participant has a P300 latency on average 1.08 standard deviations above a control participant, which exceeds over 84%of the P300 latency measures for control participants. Similarly, P300 latencies in MCI participants are on average 0.59 standard deviations above control subjects, which exceeds over 69%of the P300 latency measures for control participants. Although the cognitively impaired groups (i.e., AD and MCI) differed significantly from the controls, their P300 latencies did not differ significantly from each other, SMD: 0.09 (n = 2, 95%CI: 0.09 to 0.52, p = 0.88; Supplementary Figure 7A). Participants with AD also showed smaller P300 amplitudes when compared to controls, SMD: –0.70 (95%CI: –0.92 to –0.48, p = 0.00; Fig. 6C). P300 amplitudes did not differ significantly when comparing MCI participants with controls and AD participants (Supplementary Figure 7B,C).
Fig. 6
Standard mean difference and pooled estimated of each study included in the meta-analyses of P300 elicited using an active two-tone oddball paradigm. A) comparing P300 latency between participants with Alzheimer’s disease (AD) and controls, B) comparing P300 latency between participants with mild cognitive impairment (MCI) to controls, and C) comparing P300 amplitude between participants with AD to controls. Summary includes: p = significance level; I2 = percentage of heterogeneity; Q = Cochrane’s Q. The horizontal lines represent the 95%confidence interval for each computed standard mean difference. Note: weights are from random effects analysis.
Heterogeneity
The percentage of variation across studies (I2 statistic) due to heterogeneity as well as Cohran’s Q-value and level of significance are presented on each fort plot for each meta-analysis (refer to Figs. 2–6 and Supplementary Figure 1–7). I2 less than or equal to 25%is considered low heterogeneity, I2 between 26–50%is considered moderate heterogeneity and substantial heterogeneity is I2 = 75%or greater [42]. Higher percentage of variation (I2) across studies is indicative of greater variation in study outcomes and/or between study variations in clinical heterogeneity, that is, differences between participant characteristics, timing of outcome measures and characteristics of the intervention [52]. Despite efforts to reduce clinical heterogeneity using a strict inclusion criteria and only pooling studies with similar designs, there was still significant heterogeneity across studies on; P300 latency (I2 > 80%, p < 0.01), P300 amplitude comparing AD to controls only (I2 = 57.5%, p = 0.00), N200 latency (I2 > 64%, p < 0.05), N200 amplitude comparing MCI to controls only (I2 = 85%, p = 0.00), P200 latency comparing AD to controls only (I2 = 59.8%, p = 0.00), N100 amplitude comparing AD and MCI to controls (I2 = 90.5%and 93.9%, p = 0.00, respectively), P50 amplitude elicited using rarefaction clicks (I2 = 91.6%, p = 0.00), and studies on ABR measuring interpeak wave III-V (I2 = 67.1%, p = 0.02). Controlling for factors such as the severity and duration of the disease, could reduce between study heterogeneity, however, this can be difficult to achieve as a limited number of studies report or measure for these factors. As higher heterogeneity dilutes confidence in the pooled effect, it is therefore important to take this into account when interpreting the final outcomes. It is also noteworthy that all other between study heterogeneity analyses were insignificant.
Methodological quality assessment
Studies included in this review were assessed based on their methodological quality using a quantitative quality assessment tool (EPHPP, 1998). The studies were rated as either “strong”, “moderate” or “weak” based on the overall outcomes of the eight core components of the EPHPP instrument. These components are: 1) selection bias, 2) study design, 3) confounders, 4) blinding, 5) data collection methods, 6) withdraws and dropout, 7) intervention integrity, and 8) analysis, refer to Table 2. A majority of the included studies were rated as “moderate” (n = 47, 63.5%), 5/74 (6.7%) studies were rated as “strong” and 22/74 (29.7%) were rated as “weak”. None of the included studies were described as a randomized trial, however, the “strong” studies (n = 5) indicated blinding in the study design. One study had a double-blind study design [52], and 4 studies were a single blind [53–56]. The studies that were rated as “moderate” or “weak” did not met all the core components of the quality assessment, which is attributed to one or more of the following reasons: 1) absence of information (e.g., recruitment procedure), 2) lack of a randomized control trial study design, 3) no use of blinding, and 4) lack of clarity.
Table 2
Qualitative assessment results for quantitative studies included in the review (n = 74)
| Core item | Tool question (EPHPP, 1998) | Number of studies with positive assessment (Answer) | Percentage of studies with positive assessment |
| Selection bias | Are the individuals selected to participate in the study likely to be representative of the target population? | 54 (Very likely) | 72% |
| What percentage of selected individuals agreed to participate? | 4 (80 –100%) | 5% | |
| 70 (Not described) | |||
| Study design | Was the study described as randomized? | 0 (Yes) | 0% |
| Confounders | Were there important differences between groups prior to the intervention? | 52 (No) | 70% |
| Indicate the percentage of relevant confounders that were controlled either in the design (e.g., stratification, matching) or analysis. | 64 (80–100%) | 86% | |
| Blinding | Was (were) the outcome assessor(s) aware of the intervention or exposure status of participants? | 7 (No) | 9% |
| Were the study participants aware of the research question? | 1 (No) | 1% | |
| Data collection methods | Were data collection tools shown to be valid? | 76 (Yes) | 100% |
| Were data collection tools shown to be reliable? | 74 (Yes) | 100% | |
| Withdraws and dropout | Were withdrawals and dropouts reported in terms of numbers and/or reasons per group? | 2 (Yes) | 2% |
| 72 (Not Applicable) | |||
| Indicate the percentage of participants completing the study. (If the percentage differs by groups, record the lowest.) | 4 (80–100%) | 5% | |
| 70 (Not Applicable–retrospective case control) | |||
| Intervention integrity | What percentage of participants received the allocated intervention or exposure of interest? | 74 (80–100%) | 100% |
| Was the consistency of the intervention measured? | 2 (Yes) | 3% | |
| Is it likely that subjects received an unintended intervention (contamination or cointervention) that may influence the results? | 74 (No) | 100% | |
| Analysis | Indicate the unit of allocation. | 74 (Individual) | 100% |
| Indicate the unit or analysis. | 74 (Individual) | 100% | |
| Are the statistical methods appropriate for the study design? | 74 (Yes) | 100% | |
| Is the analysis performed by intervention allocation status (i.e., intention to treat) rather than the actual intervention received? | 74 (No) | 100% |
Fifty-four (72.9%) studies selected participants that were “very likely” to represent the target population, while 19 studies did not clearly describe their recruitment procedure, resulting in a “weak” rating in the selection bias component of the quality assessment. Most studies (86%) controlled for confounding factors in their study design (e.g., recruitment) and/or in statistical analysis, therefore, there were no differences in age, gender ratio, and education level between study groups. All studies (n = 74; 100%) utilized valid data collection tools and appropriate statistical methods for data analysis (see Table 2). All the studies included in this systematic review were case-control studies, therefore, the level of recommendation for all individual studies was level 4 based on American Society of Plastic Surgeons’ Evidence Rating Scale for diagnostic studies [57].
DISCUSSION
This systematic review and meta-analysis aimed to investigate whether AERPs differ in amplitude and/or latency between participants with cognitive impairment (MCI and AD) or subjective cognitive decline (SCD) to age-matched controls based on the analysis of currently available literature. Some AERPs (i.e., ASSR, FFR P30, N400, and slow wave) were not meta-analyzed as there was only a limited number of studies with similar designs reporting their findings, however, the majority of the AERPs were meta-analyzed (ABR, MMN, P50, N100, P200, N200, and P300). Findings from this investigation suggest that the AERPs analyzed in the review (except for MMN) vary significantly, in mean latency and/or amplitude, between participants with AD and controls. No significant variation in AERP mean latencies or amplitudes between AD participants and MCI participants were observed; however, this could be due to the low number of studies comparing these two groups. Only P300 differed significantly between MCI participants and controls based on the pooled analysis, but again this could be attributed to the low number of studies with similar designs investigating AERPs in MCI participants. Notably, due to the lack of studies investigating AERPs in SCD in comparison to non-SCD participants, a meta-analysis on this group could not be performed.
Auditory event-related potentials and cognitive decline
Although there are conflicting reports regarding ABRs in participants with AD, this meta-analysis suggests that there are significant delays in the appearance of ABR wave V, interpeak I-V wave and interpeak I-III wave in patients with AD in comparison to controls. There are multiple neural generators of ABRs which are sequentially activated throughout the brainstem auditory pathway. Therefore, ABRs have been frequently used to evaluate the function and integrity of the central and peripheral auditory pathway [35]. The findings of this meta-analysis are consistent with suggestions of brainstem and midbrain structure abnormalities in people with AD [58, 59]. Variations in disease severity and duration have been proposed as explanations for conflicting results across ABR studies [43], but nevertheless pooled analysis of the studies is supportive of significant abnormalities in ABRs in AD participants when compared to controls.
MMN has been proposed to reveal deficits in echoic memory storage and automatic mismatch detection essential for attention [60]. An impaired MMN response in AD participants suggests difficulty in automatic information processing that is required for sensorial storage [61]. However, in this meta-analysis no significant difference was observed between AD participants and controls. It should, however, be noted that only three studies were included in the pooled analysis of standard mean differences of MMN amplitude between AD participants and controls, meaning that these results should be interpreted with caution. Individually, two studies suggest that MMN is significantly impaired in participants with AD in comparison to healthy controls [42, 61], while one study report no difference in MMN measures between the two groups [52]. There is evidence that suggests that MMN latency is significantly longer in MCI participants in comparison to controls, again, indicating that automated auditory information processing is impaired at this stage of cognitive decline [62]. Some, non-AD related, studies have suggested that reduced MMN amplitude could be used as an index for cognitive decline, as it correlates with increased severity of negative symptoms (including, attention difficulties, memory problems, social withdrawal, and apathy) [63–65]. However, limited research has compared MMN measures at different stages of AD, making it difficult to establish if MMN can be applied to staging cognitive decline associated with AD.
The meta-analyses of late latency (P50, N100, P200, N200, and P300) AERPs indicate that these components are significantly abnormal in AD participants when compared to controls. Pooled analysis of the studies suggests that using an active two-tone oddball paradigm AD participants can be differentiated from controls due to significant delays in N100, P200, N200, and P300 latencies. The strength of the response was not significantly affected by the presence of AD in any of the AERPs except for P300 amplitude, which was significantly smaller in AD participants compared to controls when elicited using an active oddball task. Inter-subject variability in amplitude may have led to inconsistent findings within each study as well as in the pooled analysis. Abnormalities in these AERPs in people with cognitive decline have been linked to their proposed roles in cognitive processes such as attention, memory and executive functions [66–69].
A small number of studies have investigated P50 amplitude and latency differences between AD participants and controls. Pooled analysis indicates that P50 amplitude and latency differ significantly between the groups. Variations in the pooled analysis of P50 measures between AD participants and controls were only observed when P50 was elicited using a paired-click paradigm, which is thought to reflect sensory gating. This is supportive of the hypothesis that P50 may be an index of attention and inhibitory processing, which is altered due to progressive cognitive decline observed in AD [53, 70].
Both N100 and P200 have been suggested to be generated by the primary and secondary auditory cortex, therefore, these AERP components are thought to reflect the higher processing of sensory information [71, 72]. Although previous studies reported that N100 and P200 components do not discriminate between healthy aging and AD [70, 73–75], pooled analysis suggests that latency measures of these components may differentiate normal controls from people with AD. This contradicts previous assumptions that people with AD may not have measurable impairments in perceiving and processing changes in an auditory stimulus [76].
Multiple neural regions have been implicated in the generation of the N200 response, these include the brainstem, thalamic region, and the auditory cortex [77, 78]. The N200 peak is suggested to reflect the discrimination, perception, and classification of auditory information [79]. Results from this analysis imply that AD participants have impaired central auditory processing as reflected by longer N200 latency when compared to controls. Behavioral studies have also shown that AD and MCI participants have impaired central auditory processing. Reduced performance in the Synthetic Sentence Identification-Ipsilateral Competing Message (SSI-ICM) task, which is used to test central auditory function, has been seen in participants with MCI and AD [27, 80]. There has also been a strong association between SSI-ICM performance and cortical thickness of the primary auditory cortex [81], further supporting that association between cortical degeneration and impaired auditory processing seen in cognitively impaired participants. A previous meta-analysis on N200 latency in participants with AD and MCI reported significant standard mean differences between AD and MCI subjects when compared to controls, but not when compared to one another [82]. However, in this study pooled analysis of N200 latency did not indicate that this AERP can differentiate between MCI and healthy aging, or between MCI and AD participants.
The neural generators of the P300 response are thought to include: the frontal lobe, temporal-parietal junction, medical temporal lobe, posterior cingulate gyrus, and the parietal cortex [83–85]. Regions that are known to be involved in sensory processing, memory storage, cognitive function, and executive functions. It is therefore suggested that P300 reflects cortical activity as it relies on functions such as memory, attention, and discrimination to be elicited. AD participants’ exhibit increased P300 latency, which is an indication of diminished classification speed in processing tasks and dysfunctional attention-driven discrimination processing, which is suggested to evaluate the representation of previous events in working memory [86, 87]. Additionally, P300 amplitude has been proposed to be an index of the amount of cognitive resources allocated by a participant to a cognitive process or task [88]. Pooled analysis suggests that AD participants have reduced P300 amplitude, which in turn reflects altered cognitive resource allocation to an attention-driven discrimination task.
P300 latency abnormalities in MCI participants are relatively similar to that of AD participants, which is further supported by the insignificant standard mean difference in the analysis comparing these components in participants with AD and MCI. Similar to the findings of this meta-analysis, a previous meta-analysis reported that P300 latency did not differ significantly between MCI and AD participants [89]. Interestingly, however, a longitudinal study evaluating patients at risk of developing AD, found that MCI participants that progressed to probable AD after a 5-year follow-up, had longer P300 latency at baseline when compared to MCI participants that did not progress to AD [90]. This in turn implies that latency measures of some AERPs may provide an avenue in discriminating between those at higher risk of AD from healthy individuals.
Study limitations
For the analysis of some AERPs, such as MMN, P50 and ABR, and the analysis of MCI studies, the low number of studies with similar methodological design investigating these AERPs poses as the strongest limitation. Meta-analysis studies are unable to overcome the limitations presented in individual studies, therefore, more data would be required to make final conclusions. Slight variations in diagnostic criteria used within the studies in combination with differences in factors such as gender ratio, MMSE scores, and testing paradigm modality may affect heterogeneity between the studies and the significance of the effect size.
Conclusions and gaps in knowledge
The findings of this review indicate that some AERP measures may be valuable biomarkers of AD. In conjunction with currently available clinical and neuropsychological assessments, AERPs may aid in detecting cognitive impairment associated with AD. The use of AERPs for measuring differences between AD patients and healthy older adults show great promise, particularly the use of P50, N100, P200, N200, and P300 latency measures. P300 also shows promise in differentiating between MCI patients and healthy age matched controls, which could aid in early detection of individuals at prodromal stages of AD. However, based on the pooled analysis, none of the AERPs showed significant sensitivity in differentiating between AD and MCI patients. These findings suggest that although AERPs have inadequate sensitivity for staging cognitive decline or differentiating between AD and MCI, they have adequate specificity to discriminate between those with cognitive impairment from healthy older adults. Also, this review highlights the need for research on AERPs in participants with SCD. AERPs were not analyzed for the SCD group as there were no studies on this group. Two studies were identified outside this review to have investigated AERPs in a group with subjective memory complaints or cognitive decline [91, 92]. However, both studies lacked a control group of individuals without SCD, therefore the AERP measures reported would not indicate differences between these participants and non-SCDs. Investigating AERPs in SCD participants could provide more information on the possible application of these measures in identifying cognitive impairment at earlier stages prior to the appearance of cognitive decline on neuropsychological assessments. In addition, there are a limited number of studies that investigate certain AERP components, such as ASSR, FFR, N400, and P600, which again highlights the need for more research in order to fully elucidate the usefulness and effectiveness of AERP measures as a biomarker of cognitive decline associated with AD.
DISCLOSURE STATEMENT
Authors’ disclosures available online (https://www.j-alz.com/manuscript-disclosures/21-0556r1).
SUPPLEMENTARY MATERIAL
[1] The supplementary material is available in the electronic version of this article: https://dx.doi.org/10.3233/JAD-210556.
REFERENCES
[1] | Alzheimer’s Association ((2017) ) 2017 Alzheimer’s disease facts and figures. Alzheimers Dement 13: , 325–373. |
[2] | McKhann GM , Knopman DS , Chertkow H , Hyman BT , Jack CR Jr., Kawas CH , Klunk WE , Koroshetz WJ , Manly JJ , Mayeux R , Mohs RC , Morris JC , Rossor MN , Scheltens P , Carrillo MC , Thies B , Weintraub S , Phelps CH ((2011) ) The diagnosis of dementia due to Alzheimer’s disease: Recommendations from the National Institute on Aging-Alzheimer’s Association workgroups on diagnostic guidelines for Alzheimer’s disease. Alzheimers Dement 7: , 263–269. |
[3] | Jack CR Jr., Knopman DS , Jagust WJ , Petersen RC , Weiner MW , Aisen PS , Shaw LM , Vemuri P , Wiste HJ , Weigand SD , Lesnick TG , Pankratz VS , Donohue MC , Trojanowski JQ ((2013) ) Tracking pathophysiological processes in Alzheimer’s disease: An updated hypothetical model of dynamic biomarkers. Lancet Neurol 12: , 207–216. |
[4] | Villemagne VL , Burnham S , Bourgeat P , Brown B , Ellis KA , Salvado O , Szoeke C , Macaulay SL , Martins R , Maruff P , Ames D , Rowe CC , Masters CL ((2013) ) Amyloid beta deposition, neurodegeneration, and cognitive decline in sporadic Alzheimer’s disease: A prospective cohort study. Lancet Neurol 12: , 357–367. |
[5] | Magalingam KB , Radhakrishnan A , Ping NS , Haleagrahara N ((2018) ) Current concepts of neurodegenerative mechanisms in Alzheimer’s disease. Biomed Res Int 2018: , 3740461. |
[6] | Iqbal K , Gong CX , Liu F ((2014) ) Microtubule-associated protein tau as a therapeutic target in Alzheimer’s disease. Expert Opin Ther Targets 18: , 307–318. |
[7] | Hampel H , Frank R , Broich K , Teipel SJ , Katz RG , Hardy J , Herholz K , Bokde AL , Jessen F , Hoessler YC , Sanhai WR , Zetterberg H , Woodcock J , Blennow K ((2010) ) Biomarkers for Alzheimer’s disease: Academic industry and regulatory perspectives. Nat Rev Drug Discov 9: , 560–574. |
[8] | Villemagne VLD , Fodero-Tavoletti MTP , Masters CL , Rowe CCMD ((2015) ) Tau imaging: Early progress and future directions. Lancet Neurol 14: , 114–124. |
[9] | Khoury R , Ghossoub E ((2019) ) Diagnostic biomarkers of Alzheimer’s disease: A state-of-the-art review. Biomark Neuropsychiatry 1: , 100005. |
[10] | Jack CR , Bennett DA , Blennow K , Carrillo MC , Dunn B , Haeberlein SB , Holtzman DM , Jagust W , Jessen F , Karlawish J , Liu E , Molinuevo JL , Montine T , Phelps C , Rankin KP , Rowe CC , Scheltens P , Siemers E , Snyder HM , Sperling R , Elliott C , Masliah E , Ryan L , Silverberg N ((2018) ) NIA-AA Research Framework: Toward a biological definition of Alzheimer’s disease. Alzheimers Dement 14: , 535–562. |
[11] | Fletcher LCB , Burke KE , Caine PL , Rinne NL , Braniff CA , Davis HR , Miles KA , Packer C ((2013) ) Diagnosing Alzheimer’s disease: Are we any nearer to useful biomarker-based, non-invasive tests? GMS Health Technol Assess 9: , Doc01. |
[12] | Craig-Schapiro R , Fagan AM , Holtzman DM ((2009) ) Biomarkers of Alzheimer’s disease. Neurobiol Dis 35: , 128–140. |
[13] | Jack CR Jr., Knopman DS , Weigand SD , Wiste HJ , Vemuri P , Lowe V , Kantarci K , Gunter JL , Senjem ML , Ivnik RJ , Roberts RO , Rocca WA , Boeve BF , Petersen RC ((2012) ) An operational approach to National Institute on Aging-Alzheimer’s Association criteria for preclinical Alzheimer disease. Ann Neurol 71: , 765–775. |
[14] | Larner AJ ((2012) ) Screening utility of the Montreal Cognitive Assessment (MoCA): In place of–or as well as–the MMSE? Int Psychogeriatr 24: , 391–396. |
[15] | Werner P , Korczyn AD ((2008) ) Mild cognitive impairment: Conceptual, assessment, ethical, and social issues. Clin Interv Aging 3: , 413–420. |
[16] | Wang P , Zhang X , Liu Y , Liu S , Zhou B , Zhang Z , Yao H , Zhang X , Jiang T ((2013) ) Perceptual and response interference in Alzheimer’s disease and mild cognitive impairment. Clin Neurophysiol 124: , 2389–2396. |
[17] | Sperling RA , Jack CR Jr., Aisen PS ((2011) ) Testing the right target and right drug at the right stage. Sci Transl Med 3: , 111cm133. |
[18] | Prichep LS , John ER , Ferris SH , Rausch L , Fang Z , Cancro R , Torossian C , Reisberg B ((2006) ) Prediction of longitudinal cognitive decline in normal elderly with subjective complaints using electrophysiological imaging. Neurobiol Aging 27: , 471–481. |
[19] | Babiloni C , Carducci F , Lizio R , Vecchio F , Baglieri A , Bernardini S , Cavedo E , Bozzao A , Buttinelli C , Esposito F , Giubilei F , Guizzaro A , Marino S , Montella P , Quattrocchi CC , Redolfi A , Soricelli A , Tedeschi G , Ferri R , Rossi-Fedele G , Ursini F , Scrascia F , Vernieri F , Pedersen TJ , Hardemark H-G , Rossini PM , Frisoni GB ((2013) ) Resting state cortical electroencephalographic rhythms are related to gray matter volume in subjects with mild cognitive impairment and Alzheimer’s disease. Hum Brain Mapp 34: , 1427–1446. |
[20] | Babiloni C , Ferri R , Binetti G , Cassarino A , Forno GD , Ercolani M , Ferreri F , Frisoni GB , Lanuzza B , Miniussi C , Nobili F , Rodriguez G , Rundo F , Stam CJ , Musha T , Vecchio F , Rossini PM ((2006) ) Fronto-parietal coupling of brain rhythms in mild cognitive impairment: A multicentric EEG study. Brain Res Bull 69: , 63–73. |
[21] | Henderson G , Ifeachor E , Hudson N , Goh C , Outram N , Wimalaratna S , Del Percio C , Vecchio F ((2006) ) Development and assessment of methods for detecting dementia using the human electroencephalogram. IEEE Trans Biomed Eng 53: , 1557–1568. |
[22] | Luck S ((2005) ), An introduction to the event-related potential technique, MIT Press. |
[23] | Emre Cek M , Ozgoren M , Acar Savaci F ((2009) ) Continuous time wavelet entropy of auditory evoked potentials. Comput Biol Med 40: , 90–96. |
[24] | Schomer DL , Loped da Silva FH ((2012) ) Niedermeyer’s Electroencephalography : Basic Principles, Clinical Applications, and Related Fields.Wolters Kluwer Health, Philadelphia. |
[25] | Takeda T , Kakigi A ((2010) ) The clinical value of extratympanic electrocochleography in the diagnosis of Ménière’s disease. ORL J Otorhinolaryngol Relat Spec 72: , 196–204. |
[26] | Lin FR , Metter EJ , O’Brien RJ , Resnick SM , Zonderman AB , Ferrucci L ((2011) ) Hearing loss and incident dementia. Arch Neurol 68: , 214–220. |
[27] | Gates GA , Anderson ML , Feeney MP , McCurry SM , Larson EB ((2008) ) Central auditory dysfunction in older persons with memory impairment or Alzheimer dementia. Arch Otolaryngol Head Neck Surg 134: , 771–777. |
[28] | Gates GA , Anderson ML , McCurry SM , Feeney MP , Larson EB ((2011) ) Central auditory dysfunction as a harbinger of Alzheimer dementia. Arch Otolaryngol Head Neck Surg 137: , 390–395. |
[29] | Hardy CJ , Marshall CR , Golden HL , Clark CN , Mummery CJ , Griffiths TD , Bamiou DE , Warren JD ((2016) ) Hearing and dementia. J Neurol 263: , 2339–2354. |
[30] | Taljaard DS , Olaithe M , Brennan-Jones CG , Eikelboom RH , Bucks RS ((2016) ) The relationship between hearing impairment and cognitive function: A meta-analysis in adults. Clin Otolaryngol 41: , 718–729. |
[31] | Vecchio F , Maatta S ((2011) ) The use of auditory event-related potentials in Alzheimer’s disease diagnosis. Int J Alzheimers Dis 2011: , 653173. |
[32] | Burkard RF , Eggermont JJ , Don M ((2007) ) Auditory evoked potentials: Basic principles and clinical application, Lippincott Williams & Wilkins. |
[33] | Fu Z , Wu X , Chen J ((2017) ) Using frequency-following responses (FFRs) to evaluate the auditory function of frequency-modulation (FM) discrimination. Appl Inform 4: , 1–11. |
[34] | Tomlin D , Rance G , Graydon K , Tsialios I ((2006) ) A comparison of 40 Hz auditory steady-state response (ASSR) and cortical auditory evoked potential (CAEP) thresholds in awake adult subjects. Int J Audiol 45: , 580–588. |
[35] | Legatt AD , Aminoff MJ (2012) Brainstem auditory evoked potentials : Methodology, interpretation, and clinical application. In Aminoff’s Electrodiagnosis in Clinical Neurology, 519-552. |
[36] | Mahajan Y , Peter V , Sharma M ((2017) ) Effect of EEG referencing methods on auditory mismatch negativity. Front Neurosci 11: , 560–560. |
[37] | Kutas M , Federmeier KD ((2000) ) Electrophysiology reveals semantic memory use in language comprehension. Trends Cogn Sci 4: , 463–470. |
[38] | Didoné DD , Garcia MV , Oppitz SJ , Silva TFFd , Santos SND , Bruno RS , Filha VAVDS , Cóser PL ((2016) ) Auditory evoked potential P300 in adults: Reference values. Einstein (Sao Paulo) 14: , 208–212. |
[39] | Haenschel C , Vernon DJ , Dwivedi P , Gruzelier JH , Baldeweg T ((2005) ) Event-related brain potential correlates of human auditory sensory memory-trace formation. J Neurosci 25: , 10494–10501. |
[40] | Ashford JW , Coburn KL , Rose TL , Bayley PJ ((2011) ) P300 energy loss in aging and Alzheimer’s disease. JAD 23: , 229–238. |
[41] | Bennys K , Rondouin G , Benattar E , Gabelle A , Touchon J ((2011) ) Can event-related potential predict the progression of mild cognitive impairment? J Clin Neurophysiol 28: , 625–632. |
[42] | Jiang S , Yan C , Qiao Z , Yao H , Jiang S , Qiu X , Yang X , Fang D , Yang Y , Zhang L , Wang L , Zhang L ((2017) ) Mismatch negativity as a potential neurobiological marker of early-stage Alzheimer disease and vascular dementia. Neurosci Lett 647: , 26–31. |
[43] | Tachibana H , Takeda M , Okuda B , Kawabata K , Nishimura H , Kodama N , Iwamoto Y , Sugita M ((1996) ) Multimodal evoked potentials in Alzheimer’s disease and Binswanger’s disease. J Geriatr Psychiatry Neurol 9: , 7–12. |
[44] | Lister JJ , Harrison Bush AL , Andel R , Matthews C , Morgan D , Edwards JD ((2016) ) Cortical auditory evoked responses of older adults with and without probable mild cognitive impairment. Clin Neurophysiol 127: , 1279–1287. |
[45] | Higgins JPT ((2019) ) Cochrane handbook for systematic reviews of interventions, Wiley-Blackwell, Hoboken, NJ. |
[46] | Tarawneh HY , Mulders W , Sohrabi HR , Martins RN , Jayakody DMP ((2020) ) Auditory electrophysiological assessments of Alzheimer’s disease and preclinical stages: Protocol for a systematic review and meta-analysis. BMJ Open 10: , e033308. |
[47] | Petersen RC ((2004) ) Mild cognitive impairment as a diagnostic entity. J Intern Med 256: , 183–194. |
[48] | Smith GE , Petersen RC , Parisi JE , Ivnik RJ ((1996) ) Definition, course, and outcome of mild cognitive impairment. Neuropsychol Dev Cogn B Aging Neuropsychol Cogn 3: , 141–147. |
[49] | Winblad B , Palmer K , Kivipelto M , Jelic V , Fratiglioni L , Wahlund LO , Nordberg A , Bäckman L , Albert M , Almkvist O , Arai H , Basun H , Blennow K , de Leon M , DeCarli C , Erkinjuntti T , Giacobini E , Graff C , Hardy J , Jack C , Jorm A , Ritchie K , van Duijn C , Visser P , Petersen RC ((2004) ) Mild cognitive impairment–beyond controversies, towards a consensus: Report of the International Working Group on Mild Cognitive Impairment. J Intern Med 256: , 240–246. |
[50] | Sullivan GM , Feinn R ((2012) ) Using effect size-or why thevalue is not enough. J Grad Med Educ 4: , 279–282. |
[51] | Bartolucci AAP , Tendera MMD , Howard GD ((2011) ) Meta-analysis of multiple primary prevention trials of cardiovascular events using aspirin. Am J Cardiol 107: , 1796–1801. |
[52] | Riekkinen P Jr, Pääkkönen A , Karhu J , Partanen J , Soininen H , Laakso M , Riekkinen P Sr, Riekkinen P Sr ((1997) ) THA disrupts mismatch negativity in Alzheimer disease. Psychopharmacology (Berl) 133: , 203–206. |
[53] | Cancelli I , Cadore IP , Merlino G , Valentinis L , Moratti U , Bergonzi P , Gigli GL , Valente M ((2006) ) Sensory gating deficit assessed by P50/Pb middle latency event related potential in Alzheimer’s disease. J Clin Neurophysiol 23: , 421–425. |
[54] | Frodl T , Hampel H , Juckel G , BÜRger K , Padberg F , Engel RR , MÖLler H-J , Hegerl U ((2002) ) Value of event-related P300 subcomponents in the clinical diagnosis of mild cognitive impairment and Alzheimer’s Disease. Psychophysiology 39: , 175–181. |
[55] | Holt LE , Raine A , Pa G , Schneider LS , Henderson VW , Pollock VE ((1995) ) P300 topography in Alzheimer’s disease. Psychophysiology 32: , 257–265. |
[56] | Phillips NA , Connolly F.J , Charles Mate-Kole C , Gray J ((1997) ) Individual differences in auditory middle latency responses in elderly adults and patients with Alzheimer’s disease. Int J Psychophysiol 27: , 125–136. |
[57] | American Society of Plastic Surgeons A, ASPS Evidence Rating Scales, https://www.plasticsurgery.org/Documents/medical-professionals/health-policy/evidence-practice/ASPS-Rating-Scale-March-2011.pdf, 2021. |
[58] | Yamamoto T ((1985) ) Nucleus raphe dorsalis in Alzheimer’s disease: Neurofibrillary tangles and loss of large neurons. Ann Neurol 17: , 573–577. |
[59] | Bondareff W , Mountjoy CQ , Roth M , Rossor MN , Iversen LL , Reynolds GP ((1987) ) Age and histopathologic heterogeneity in Alzheimer’s disease. Evidence for subtypes. Arch Gen Psychiatry 44: , 412–417. |
[60] | Näätänen R ((2007) ) The mismatch negativity (MMN) in basic research of central auditory processing: A review. Clin Neurophysiol 118: , 2544–2590. |
[61] | Boller F , El Massioui F , Devouche E , Traykov L , Pomati S , Starkstein SE ((2002) ) Processing emotional information in Alzheimer’s disease: Effects on memory performance and neurophysiological correlates. Dement Geriatr Cogn Disord 14: , 104–112. |
[62] | Papadaniil CD , Kosmidou VE , Tsolaki A , Tsolaki M , Kompatsiaris IY , Hadjileontiadis LJ ((2016) ) Cognitive MMN and P300 in mild cognitive impairment and Alzheimer’s disease: A high density EEG-3D vector field tomography approach. Brain Res 1648: , 425–433. |
[63] | Wynn JK , Sugar C , Horan WP , Kern R , Green MF ((2010) ) Mismatch negativity, social cognition, and functioning in schizophrenia patients. Biol Psychiatry 67: , 940–947. |
[64] | Näätänen R , Kujala T , Escera C , Baldeweg T , Kreegipuu K , Carlson S , Ponton C ((2011) ) The mismatch negativity (MMN) –A unique window to disturbed central auditory processing in ageing and different clinical conditions. Clin Neurophysiol 123: , 424–458. |
[65] | Näätänen R ((2003) ) Mismatch negativity: Clinical research and possible applications. Int J Psychophysiol 48: , 179–188. |
[66] | Golob E , Starr A ((2000) ) Effects of stimulus sequence on event-related potentials and reaction time during target detection in Alzheimer’s disease. Clin Neurophysiol 111: , 1438–1449. |
[67] | Muscoso EG , Costanzo E , Daniele O , Maugeri D , Natale E , Caravaglios G , Muscoso EG , Costanzo E , Daniele O , Maugeri D , Natale E , Caravaglios G ((2006) ) Auditory event-related potentials in subcortical vascular cognitive impairment and in Alzheimer’s disease. J Neural Transm 113: , 1779–1786. |
[68] | Cecchi M , Moore DK , Sadowsky CH , Solomon PR , Doraiswamy PM , Smith CD , Jicha GA , Budson AE , Arnold SE , Fadem KC ((2015) ) A clinical trial to validate event-related potential markers of Alzheimer’s disease in outpatient settings. Alzheimers Dement (Amst) 1: , 387–394. |
[69] | Bennys K , Portet F , Touchon J , Rondouin G ((2007) ) Diagnostic value of event-related evoked potentials N200 and P300 subcomponents in early diagnosis of Alzheimer’s disease and mild cognitive impairment. J Clin Neurophysiol 24: , 405–412. |
[70] | Golob EJ , Irimajiri R , Starr A ((2007) ) Auditory cortical activity in amnestic mild cognitive impairment: Relationship to subtype and conversion to dementia. Brain 130: , 740–752. |
[71] | Pratt S , Lightfoot G ((2012) ) Physiological mechanisms underlying MLRs and cortical EPs. In Translational Perspectives in Auditory Neuroscience; Physiological Assessment of Audition, Tremblay KL, Burkard RF, ed. Plural Publishing, San Diego, CA, pp. 243–282. |
[72] | Ross B , Tremblay K ((2009) ) Stimulus experience modifies auditory neuromagnetic responses in young and older listeners. Hear Res 248: , 48–59. |
[73] | Chang Y-S , Chen H-L , Hsu C-Y , Tang S-H , Liu C-K ((2014) ) Parallel improvement of cognitive functions and p300 latency following donepezil treatment in patients with Alzheimer’s disease: A case-control study. J Clin Neurophysiol 31: , 81–85. |
[74] | Caravaglios G , Costanzo E , Palermo F , Muscoso EG ((2008) ) Decreased amplitude of auditory event-related delta responses in Alzheimer’s disease. Int J Psychophysiol 70: , 23–32. |
[75] | Lai CL , Lin RT , Liou LM , Liu CK ((2010) ) The role of event-related potentials in cognitive decline in Alzheimer’s disease. Clin Neurophysiol 121: , 194–199. |
[76] | Morrison C , Rabipour S , Knoefel F , Sheppard C , Taler V ((2018) ) Auditory event-related potentials in mild cognitive impairment and Alzheimer’s disease. Curr Alzheimer Res 15: , 702–715. |
[77] | Mahajan Y , McArthur G ((2012) ) Maturation of auditory event-related potentials across adolescence. Hear Res 294: , 82–94. |
[78] | Ponton C , Eggermont JJ , Khosla D , Kwong B , Don M ((2002) ) Maturation of human central auditory system activity: Separating auditory evoked potentials by dipole source modeling. Clin Neurophysiol 113: , 407–420. |
[79] | Duarte JL , Alvarenga KdF , Banhara MR , de Melo ADP , Sás RM , Filho OAC ((2009) ) P300- long-latency auditory evoked potential in normal hearing subjects: Simultaneous recording value in Fz and Cz. Braz J Otorhinolaryngol 75: , 231–236. |
[80] | Ghannoum MT , Shalaby AA , Farghaly M , Hamdy M , Hamdy HS ((2018) ) Central auditory processing findings in a group of cognitively impaired individuals. Hearing Balance Commun 16: , 145–154. |
[81] | Zatorre RJ , Belin P ((2001) ) Spectral and temporal processing in human auditory cortex. Cereb Cortex 11: , 946–953. |
[82] | Howe AS ((2014) ) Meta-analysis of the endogenous N200 latency event-related potential subcomponent in patients with Alzheimer’s disease and mild cognitive impairment. Clin Neurophysiol 125: , 1145–1151. |
[83] | Wronka EA , Kaiser J , Coenen AML ((2012) ) Neural generators of the auditory evoked potential components P3a and P3b. Acta Neurobiol Exp 72: , 51–64. |
[84] | Bledowski C , Prvulovic D , Hoechstetter K , Scherg M , Wibral M , Goebel R , Linden DEJ ((2004) ) Localizing P300 generators in visual target and distractor processing: A combined event-related potential and functional magnetic resonance imaging study. J Neurosci 24: , 9353–9360. |
[85] | Huster RJ , Westerhausen R , Pantev C , Konrad C ((2010) ) The role of the cingulate cortex as neural generator of the N200 and P300 in a tactile response inhibition task. Hum Brain Mapp 31: , 1260–1271. |
[86] | Verleger R , Jaśkowski P , Wascher E ((2005) ) Evidence for an integrative role of P3b in linking reaction to perception. J Psychophysiol 19: , 165–181. |
[87] | Chen L , Zhou Y , Liu L , Zhang X , Zhang H , Liu S ((2015) ) Cortical event-related potentials in Alzheimer’s disease and frontotemporal lobar degeneration. J Neurol Sci 359: , 88–93. |
[88] | Polich J ((2007) ) Updating P300: An integrative theory of P3a and P3b. Clin Neurophysiol 118: , 2128–2148. |
[89] | Howe AS , Bani-Fatemi A , De Luca V ((2014) ) The clinical utility of the auditory P300 latency subcomponent event-related potential in preclinical diagnosis of patients with mild cognitive impairment and Alzheimer’s disease. Brain Cogn 86: , 64–74. |
[90] | Golob EJ , Irimajiri R , Starr A ((2007) ) Auditory cortical activity in amnestic mild cognitive impairment: Relationship to subtype and conversion to dementia. Brain 130: , 740–752. |
[91] | Gironell A , Garcia-Sanchez C , Estevez-Gonzalez A , Boltes A , Kulisevsky J ((2005) ) Usefulness of p300 in subjective memory complaints: A prospective study. J Clin Neurophysiol 22: , 279–284. |
[92] | Laptinskaya D , Thurm F , Küster OC , Fissler P , Schlee W , Kolassa S , von Arnim CAF , Kolassa IT ((2018) ) Auditory memory decay as reflected by a new mismatch negativity score is associated with episodic memory in older adults at risk of dementia. Front Aging Neurosci 10: , 5. |
[93] | Ally BA , Jones GE , Cole JA , Budson AE ((2006) ) Sensory gating in patients with Alzheimer’s disease and their biological children. Am J Alzheimers Dis Other Demen 21: , 439–447. |
[94] | Ally BA , Jones GE , Cole JA , Budson AE ((2006) ) The P300 component in patients with Alzheimer’s disease and their biological children. Biol Psychol 72: , 180–187. |
[95] | Bender S , Bluschke A , Dippel G , Rupp A , Weisbrod M , Thomas C ((2014) ) Auditory post-processing in a passive listening task is deficient in Alzheimer’s disease. Clin Neurophysiol 125: , 53–62. |
[96] | Blackwood D , St Blackburn I , Tyrer G ((1987) ) Cognitive brain potentials and psychological deficits in Alzheimer’s dementia and Korsakoff’s amnesic syndrome. Psychol Med 17: , 349–358. |
[97] | Bonanni L , Franciotti R , Onofrj V , Anzellotti F , Mancino E , Monaco D , Gambi F , Manzoli L , Thomas A , Onofrj M ((2010) ) Revisiting P300 cognitive studies for dementia diagnosis: Early dementia with Lewy bodies (DLB) and Alzheimer disease (AD). Neurophysiol Clin. 40: , 255–265. |
[98] | Bronnick KS , Nordby H , Larsen JP , Aarsland D ((2010) ) Disturbance of automatic auditory change detection in dementia associated with Parkinson’s disease: A mismatch negativity study. Neurobiol Aging 31: , 104–113. |
[99] | Buchwald JS , Erwin RJ , Read S , Van Lancker D , Cummings JL , Buchwald JS , Erwin RJ , Read S , Van Lancker D , Cummings JL ((1989) ) Midlatency auditory evoked responses: Differential abnormality of P1 in Alzheimer’s disease. Electroencephalogr Clin Neurophysiol 74: , 378–384. |
[100] | Cintra MTG , Ávila RT , Soares TO , Cunha LCM , Silveira KD , de Moraes EN , Simas KR , Fernandes RB , Gonçalves DU , de Rezende NA , Bicalho MAC ((2018) ) Increased N200 and P300 latencies in cognitively impaired elderly carrying ApoE ɛ-4 allele. Int J Geriatr Psychiatry 33: , e221–e227. |
[101] | Fein G , Biggins C , Van Dyke C ((1994) ) The auditory P50 response is normal in Alzheimer’s disease when measured via a paired click paradigm. Electroencephalogr Clin Neurophysiol 92: , 536–545. |
[102] | Ford J , Roth W , Isaacks B , Tinklenberg J , Yesavage J , Pfefferbaum A ((1997) ) Automatic and effortful processing in aging and dementia: Event-related brain potentials. Neurobiol Aging 18: , 169–180. |
[103] | Gao L , Chen J , Gu L , Shu H , Wang Z , Liu D , Yan Y , Zhang Z ((2018) ) Effects of gender and apolipoprotein E on novelty MMN and P3a in healthy elderly and amnestic mild cognitive Impairment. Front Aging Neurosci 10: , 256. |
[104] | Golob EJ , Johnson JK , Starr A ((2002) ) Auditory event-related potentials during target detection are abnormal in mild cognitive impairment. Clin Neurophysiol 113: , 151–161. |
[105] | Grimes AM , Grady CL , Pikus A , Grimes AM , Grady CL , Pikus A ((1987) ) Auditory evoked potentials in patients with dementia of the Alzheimer type. Ear Hear 8: , 157–161. |
[106] | Gungor HA , Yildiz A , Aydin F , Gungor F , Boz A , Ozkaynak S ((2005) ) Tc-99m HMPAO brain SPECT findings in mild and moderate Alzheimer’s disease: Correlation with event related potentials. J Neurol Sci 234: , 47–53. |
[107] | Hanafusa H , Motomura N , Fukai M , Hanafusa H , Motomura N , Fukai M ((1991) ) Event-related potentials in senile dementia of Alzheimer’s type, multiinfarct dementia and Parkinson’s disease. Jpn J Psychiatry Neurol 45: , 667–670. |
[108] | Hirata K , Hozumi A , Tanaka H , Kubo J , Zeng XH , Yamazaki K , Asahi K , Nakano T ((2000) ) Abnormal information processing in dementia of Alzheimer type. A study using the event-related potential’s field. Eur Arch Psychiatry Clin Neurosci 250: , 152–155. |
[109] | Irimajiri R , Golob EJ , Starr A ((2005) ) Auditory brain-stem, middle- and long-latency evoked potentials in mild cognitive impairment. Clin Neurophysiol 116: , 1918–1929. |
[110] | Ito J , Yamao S , Fukuda H , Mimori Y , Nakamura S ((1990) ) The P300 event-related potentials in dementia of the Alzheimer type: Correlations between P300 and monoamine metabolites. Electroencephalogr Clin Neurophysiol 77: , 174–178. |
[111] | Jessen F , Kucharski C , Fries T , Papassotiropoulos A , Hoenig K , Maier W , Heun R ((2001) ) Sensory gating deficit expressed by a disturbed suppression of the P50 event-related potential in patients with Alzheimer’s disease. Am J Psychiatry 158: , 1319–1321. |
[112] | Ji L-L , Zhang Y-Y , Zhang L-E , He B , Lu G-H ((2015) ) Mismatch negativity (MMN) latency as a biomarker of amnestic mild cognitive impairment in Chinese rural elders. Front Aging Neurosci 7: , 22. |
[113] | Jimenez-Escrig A , Fernandez-Lorente J , Herrero A , Baron M , Lousa M , de Blas G , Gobernado J ((2002) ) Event-related evoked potential P300 in frontotemporal dementia. Dement Geriatr Cogn Disord 13: , 27–32. |
[114] | Juckel G , Clotz F , Frodl T , Kawohl W , Hampel H , Pogarell O , Hegerl U ((2008) ) Diagnostic usefulness of cognitive auditory event-related p300 subcomponents in patients with Alzheimers disease? J Clin Neurophysiol 25: , 147–152. |
[115] | Kazmerski VA , Friedman D , Ritter W ((1997) ) Mismatch negativity during attend and ignore conditions in Alzheimer’s disease. Biol Psychiatry 42: , 382–402. |
[116] | Kuskowski MA , Morley GK , Malone SM , Okaya AJ ((1991) ) Longitudinal measurements of brainstem auditory evoked potentials in patients with dementia of the Alzheimer type. Int J Neurosci 60: , 79–84. |
[117] | Lee M-S , Lee S-H , Moon E-O , Moon Y-J , Kim S , Kim S-H , Jung I-K ((2013) ) Neuropsychological correlates of the P300 in patients with Alzheimer’s disease. Prog Neuropsychopharmacol Biol Psychiatry 40: , 62–69. |
[118] | Levada OV , Cherednichenko NV , Gorbachev SV ((2016) ) Parameters of the P300 potential in mild neurocognitive disorders of different etiologies. Neurophysiology 48: , 414–420. |
[119] | Li X , Shao X , Wang N , Wang T , Chen G , Zhou H ((2010) ) Correlation of auditory event-related potentials and magnetic resonance spectroscopy measures in mild cognitive impairment. Brain Res 1346: , 204–212. |
[120] | Marsh JT , Schubarth G , Brown WS , Riege W , Strandburg R , Dorsey D , Maltese A , Kuhl D ((1990) ) PET and P300 relationships in early Alzheimer’s disease. Neurobiol Aging 11: , 471–476. |
[121] | Masanaka T , Hisao T , Keita K , Yasunobu K , Hiroo Y , Bungo O ((2005) ) Multi-modal evoked potentials in corticobasal degeneration, progressive supranuclear palsy and Alzheimer disease. Int Congr Ser 1278: , 145–148. |
[122] | Medvidovic S , Titlic M , Maras-Simunic M ((2013) ) P300 evoked potential in patients with mild cognitive impairment. Acta Inform Med 21: , 89–92. |
[123] | Mowszowski L , Hermens DF , Diamond K , Norrie L , Hickie IB , Lewis SJG , Naismith SL ((2012) ) Reduced mismatch negativity in mild cognitive impairment: Associations with neuropsychological performance. J Alzheimers Dis 30: , 209–219. |
[124] | O’Mahony D , Rowan M , Feely J , O’Neill D , Walsh J , Coakley D ((1993) ) Parkinson’s dementia and Alzheimer’s dementia: An evoked potential comparison. Gerontology 39: , 228–240. |
[125] | O’Mahony D , Rowan M , Feely J , Walsh JB , Coakley D ((1994) ) Primary auditory pathway and reticular activating system dysfunction in Alzheimer’s disease. Neurology 44: , 2089–2094. |
[126] | O’Mahony D , Coffey J , Murphy J , O’Hare N , Hamilton D , Rowan M , Freyne P , Walsh J , Coakley D ((1996) ) Event-related potential prolongation in Alzheimer’s disease signifies frontal lobe impairment: Evidence from SPECT imaging. J Gerontol A Biol Sci Med Sci 51: , M102–M107. |
[127] | Ortiz T , Martin Loeches M , Miguel F , Abdad EV , Puente AE , Ortiz T , Martin Loeches M , Miguel F , Abdad EV , Puente AE ((1994) ) P300 latency and amplitude in the diagnosis of dementia. J Clin Psychol 50: , 381–388. |
[128] | Papaliagkas V , Kimiskidis V , Tsolaki M , Anogianakis G ((2008) ) Usefulness of event-related potentials in the assessment of mild cognitive impairment. BMC Neurosci 9: , 107. |
[129] | Papaliagkas VT , Kimiskidis VK , Tsolaki MN , Ano-gianakis G ((2011) ) Cognitive event-related potentials: Longitudinal changes in mild cognitive impairment. Clin Neurophysiol 122: , 1322–1326. |
[130] | Pokryszko-Dragan A , Slotwinski K , Podemski R , Pok-ryszko-Dragan A , Slotwinski K , Podemski R ((2003) ) Modality-specific changes in P300 parameters in patients with dementia of the Alzheimer type. Med Sci Monit 9: , CR130–CR134. |
[131] | Rai G ((1990) ) Assessment of the N2 component of the auditory evoked potential in the elderly. J Clin Exp Gerontol 12: , 51–57. |
[132] | Revonsuo A , Portin R , Juottonen K , Rinne JO ((1998) ) Semantic processing of spoken words in Alzheimer’s disease: An electrophysiological study. J Cogn Neurosci 10: , 408–420. |
[133] | Schwartz TJ , Federmeier KD , Van Petten C , Salmon DP , Kutas M , Schwartz TJ , Federmeier KD , Van Petten C , Salmon DP , Kutas M ((2003) ) Electrophysiological analysis of context effects in Alzheimer’s disease. Neuropsychology 17: , 187–201. |
[134] | St Blackwood DH , Christie JE ((1985) ) P3 and other long latency auditory evoked potentials in presenile dementia Alzheimer type and alcoholic Korsakoff syndrome. Br J Psychiatry 147: , 702–706. |
[135] | Sumi N , Nan’no H , Fujimoto O , Ohta Y , Takeda M ((2000) ) Interpeak latency of auditory event-related potentials (P300) in senile depression and dementia of the Alzheimer type. Psychiatry Clin Neurosci 54: , 679–684. |
[136] | Swartz KP , Walton JP , Crummer GC , Hantz EC , Frisina RD ((1992) ) P3 event-related potentials and performance of healthy older and Alzheimer’s dementia subjects for music perception tasks. Psychomusicology 11: , 96–118. |
[137] | Tachibana H , Takeda M , Sugita M ((1989) ) Brainstem auditory evoked potentials in patients with multi-infarct dementia and dementia of the Alzheimer type. Int J Neurosci 48: , 325–331. |
[138] | Taguchi S , Fujimoto O , Takamori N , Hanatani T , Sumi N , Nan’no H , Takeda M ((2003) ) Neurophysiological evaluation of late paraphrenia: Comparison with chronic schizophrenia and dementia of the Alzheimer type. Psychogeriatrics 3: , 29–38. |
[139] | Tarkka IM , Lehtovirta M , Soininen H , Paakkonen A , Karhu J , Partanen J ((2002) ) Auditory adaptation is differentially impaired in familial and sporadic Alzheimer’s disease. Biomed Pharmacother 56: , 45–49. |
[140] | Thomas C , vom Berg I , Rupp A , Seidl U , Schroder J , Roesch-Ely D , Kreisel SH , Mundt C , Weisbrod M ((2010) ) P50 gating deficit in Alzheimer dementia correlates to frontal neuropsychological function. Neurobiol Aging 31: , 416–424. |
[141] | Tsolaki AC , Kosmidou V , Kompatsiaris IY , Papadaniil C , Hadjileontiadis L , Adam A , Tsolaki M ((2017) ) Brain source localization of MMN and P300 ERPs in mild cognitive impairment and Alzheimer’s disease: A high-density EEG approach. Neurobiol Aging 55: , 190–201. |
[142] | Vaitkevičius A , Kaubrys G , Audronytė E ((2015) ) Distinctive effect of donepezil treatment on P300 and N200 subcomponents of auditory event-related evoked potentials in Alzheimer disease patients. Med Sci Monit 21: , 1920–1927. |
[143] | van Deursen JA , Vuurman EF , Smits LL , Verhey FR , Riedel WJ ((2009) ) Response speed, contingent negative variation and P300 in Alzheimer’s disease and MCI. Brain Cogn 69: , 592–599. |
[144] | van Deursen JA , Vuurman EF , van Kranen-Mastenbroek VH , Verhey FR , Riedel WJ ((2011) ) 40-Hz steady state response in Alzheimer’s disease and mild cognitive impairment. Neurobiol Aging 32: , 24–30. |
[145] | Williams P , Jones GH , Briscoe M , Thomas R , Cronin P ((1991) ) P300 and reaction-time measures in senile dementia of the Alzheimer type. Br J Psychiatry 159: , 410–414. |
[146] | Yamaguchi S , Tsuchiya H , Yamagata S , Toyoda G , Kobayashi S ((2000) ) Event-related brain potentials in response to novel sounds in dementia. Clin Neurophysiol 111: , 195–203. |
[147] | Yokoyama Y , Nakashima K , Shimoyama R , Urakami K , Takahashi K ((1995) ) Distribution of event-related potentials in patients with dementia. Electroencephalogr Clin Neurophysiol 35: , 431–437. |


