
Assessing Genetic Overlap and Causality Between Blood Plasma Proteins and Alzheimer’s Disease
Abstract
Background:
Blood plasma proteins have been associated with Alzheimer’s disease (AD), but understanding which proteins are on the causal pathway remains challenging.
Objective:
Investigate the genetic overlap between candidate proteins and AD using polygenic risk scores (PRS) and interrogate their causal relationship using bi-directional Mendelian randomization (MR).
Methods:
Following a literature review, 31 proteins were selected for PRS analysis. PRS were constructed for prioritized proteins with and without the apolipoprotein E region (APOE+/–PRS) and tested for association with AD status across three cohorts (n = 6,244). An AD PRS was also tested for association with protein levels in one cohort (n = 410). Proteins showing association with AD were taken forward for MR.
Results:
For APOE ɛ3, apolipoprotein B-100, and C-reactive protein (CRP), protein APOE+ PRS were associated with AD below Bonferroni significance (pBonf, p < 0.00017). No protein APOE- PRS or AD PRS (APOE+/–) passed pBonf. However, vitamin D-binding protein (protein PRS APOE-, p = 0.009) and insulin-like growth factor-binding protein 2 (AD APOE- PRS p = 0.025, protein APOE- PRS p = 0.045) displayed suggestive signals and were selected for MR. In bi-directional MR, none of the five proteins demonstrated a causal association (p < 0.05) in either direction.
Conclusion:
Apolipoproteins and CRP PRS are associated with AD and provide a genetic signal linked to a specific, accessible risk factor. While evidence of causality was limited, this study was conducted in a moderate sample size and provides a framework for larger samples with greater statistical power.
INTRODUCTION
Over 50 million people currently live with dementia worldwide, a figure forecast to rise to 152 million by 2050 as global populations live longer [1]. The most common form of dementia is late-onset Alzheimer’s disease (AD) [2], where individuals suffer severe, progressive cognitive decline and a range of neuropsychiatric symptoms [3] from their mid 60s until death. AD is a highly heritable [4], polygenic trait [5, 6] with a wide range of known genetic and environmental risk factors [7, 8]. However, the precise etiology of AD remains unexplained [9] and no disease altering treatments exist [10, 11].
Endophenotypes representing traits closer to a hypothesized biological risk factor can help unpack AD etiology and provide accessible targets for intervention. For example, a wide range of blood plasma proteins have been associated with AD [12] and provide a potential avenue for disease diagnosis and treatment. Promisingly, prediction of AD diagnosis using plasma levels of amyloid-β (Aβ) [13] and tau [14] is improving toward clinical level. However, measuring known AD protein neuropathological end-products (Aβ and tau) provides limited explanation of how other plasma proteins may mediate AD risk. For example, Kiddle et al.’s systematic review identified that four proteins (apolipoprotein E (APOE), alpha-2-macroglobulin, complement C3, and alpha-1-antitrypsin) were associated with AD in at least five cohorts [12]. APOE and the complement pathway have been consistently implicated in functional and genetic studies of AD risk [15, 16] and recent Mendelian randomization (MR) studies suggest lower levels of APOE and complement C3 in plasma may be causal for AD [17, 18].
One way to explore the role of plasma proteins further is to assess their genetic overlap with AD. Recent improvements in protein assay technology have enabled the creation of a genetic atlas for plasma proteins [19]. Over 3,000 proteins now have publicly available genetic summary statistics [19], allowing polygenic risk scores (PRS) to be constructed for individual proteins. PRS represent aggregate genetic propensity for a trait and so if associated with another trait imply a degree of shared genetics influences both traits. For example, a higher AD PRS has been associated with lower cognitive ability in individuals without dementia [20] and with increased levels of the promising AD biomarker p-tau181 [21]. If a protein PRS is associated with AD, this provides a genetic signal linked to a specific, accessible biological risk factor, something which remains a challenge for genome wide association studies (GWAS) [22]. PRS can also be calculated for individuals meaning protein PRS associated with AD could inform AD diagnosis prediction.
However, testing the association of PRS with a trait does not demonstrate causality. For example, a plasma protein PRS associated with AD may simply indicate shared genetic variants which effect traits or pathways unrelated to disease pathogenesis [23]. MR provides a method to test whether an exposure causally effects an outcome by using genetic variants as instrumental variables in a construct similar to a randomized control trial. This works because an individual’s genes are effectively randomized at birth enabling the creation of a quasi-intervention group who have a genetic disposition for an exposure [24]. In AD, MR has demonstrated the protective effect of higher cognitive ability and educational attainment in two large scale studies [7, 25] and has indicated several blood metabolites are on the causal disease pathway [26]. For plasma proteins specifically, MR has primarily been deployed as part of large scale non-targeted, phenome-wide MR analysis [27, 28]. For example, Zheng et al. identified 111 causal associations between 65 proteins and 52 disease-related phenotypes (p < 3.5×10⁻⁷) including sialic acid binding Ig-like lectin 3 (CD33) with AD, supporting previous GWAS results [29, 30]. While phenome-wide MR designs excel at providing a multi-trait matrix of potential causal signals, they lack the flexibility to unpack disease specific relationships. For example, 61 out of 62 proteins associated with AD at a p-value less than 0.05 in Zheng et al. were tested using the Wald Ratio with only 1 SNP as an instrumental variable [27]. Disease specific approaches have more flexibility to relax assumptions which can help increase statistical power and enable more robust statistical sensitivity analyses [23].
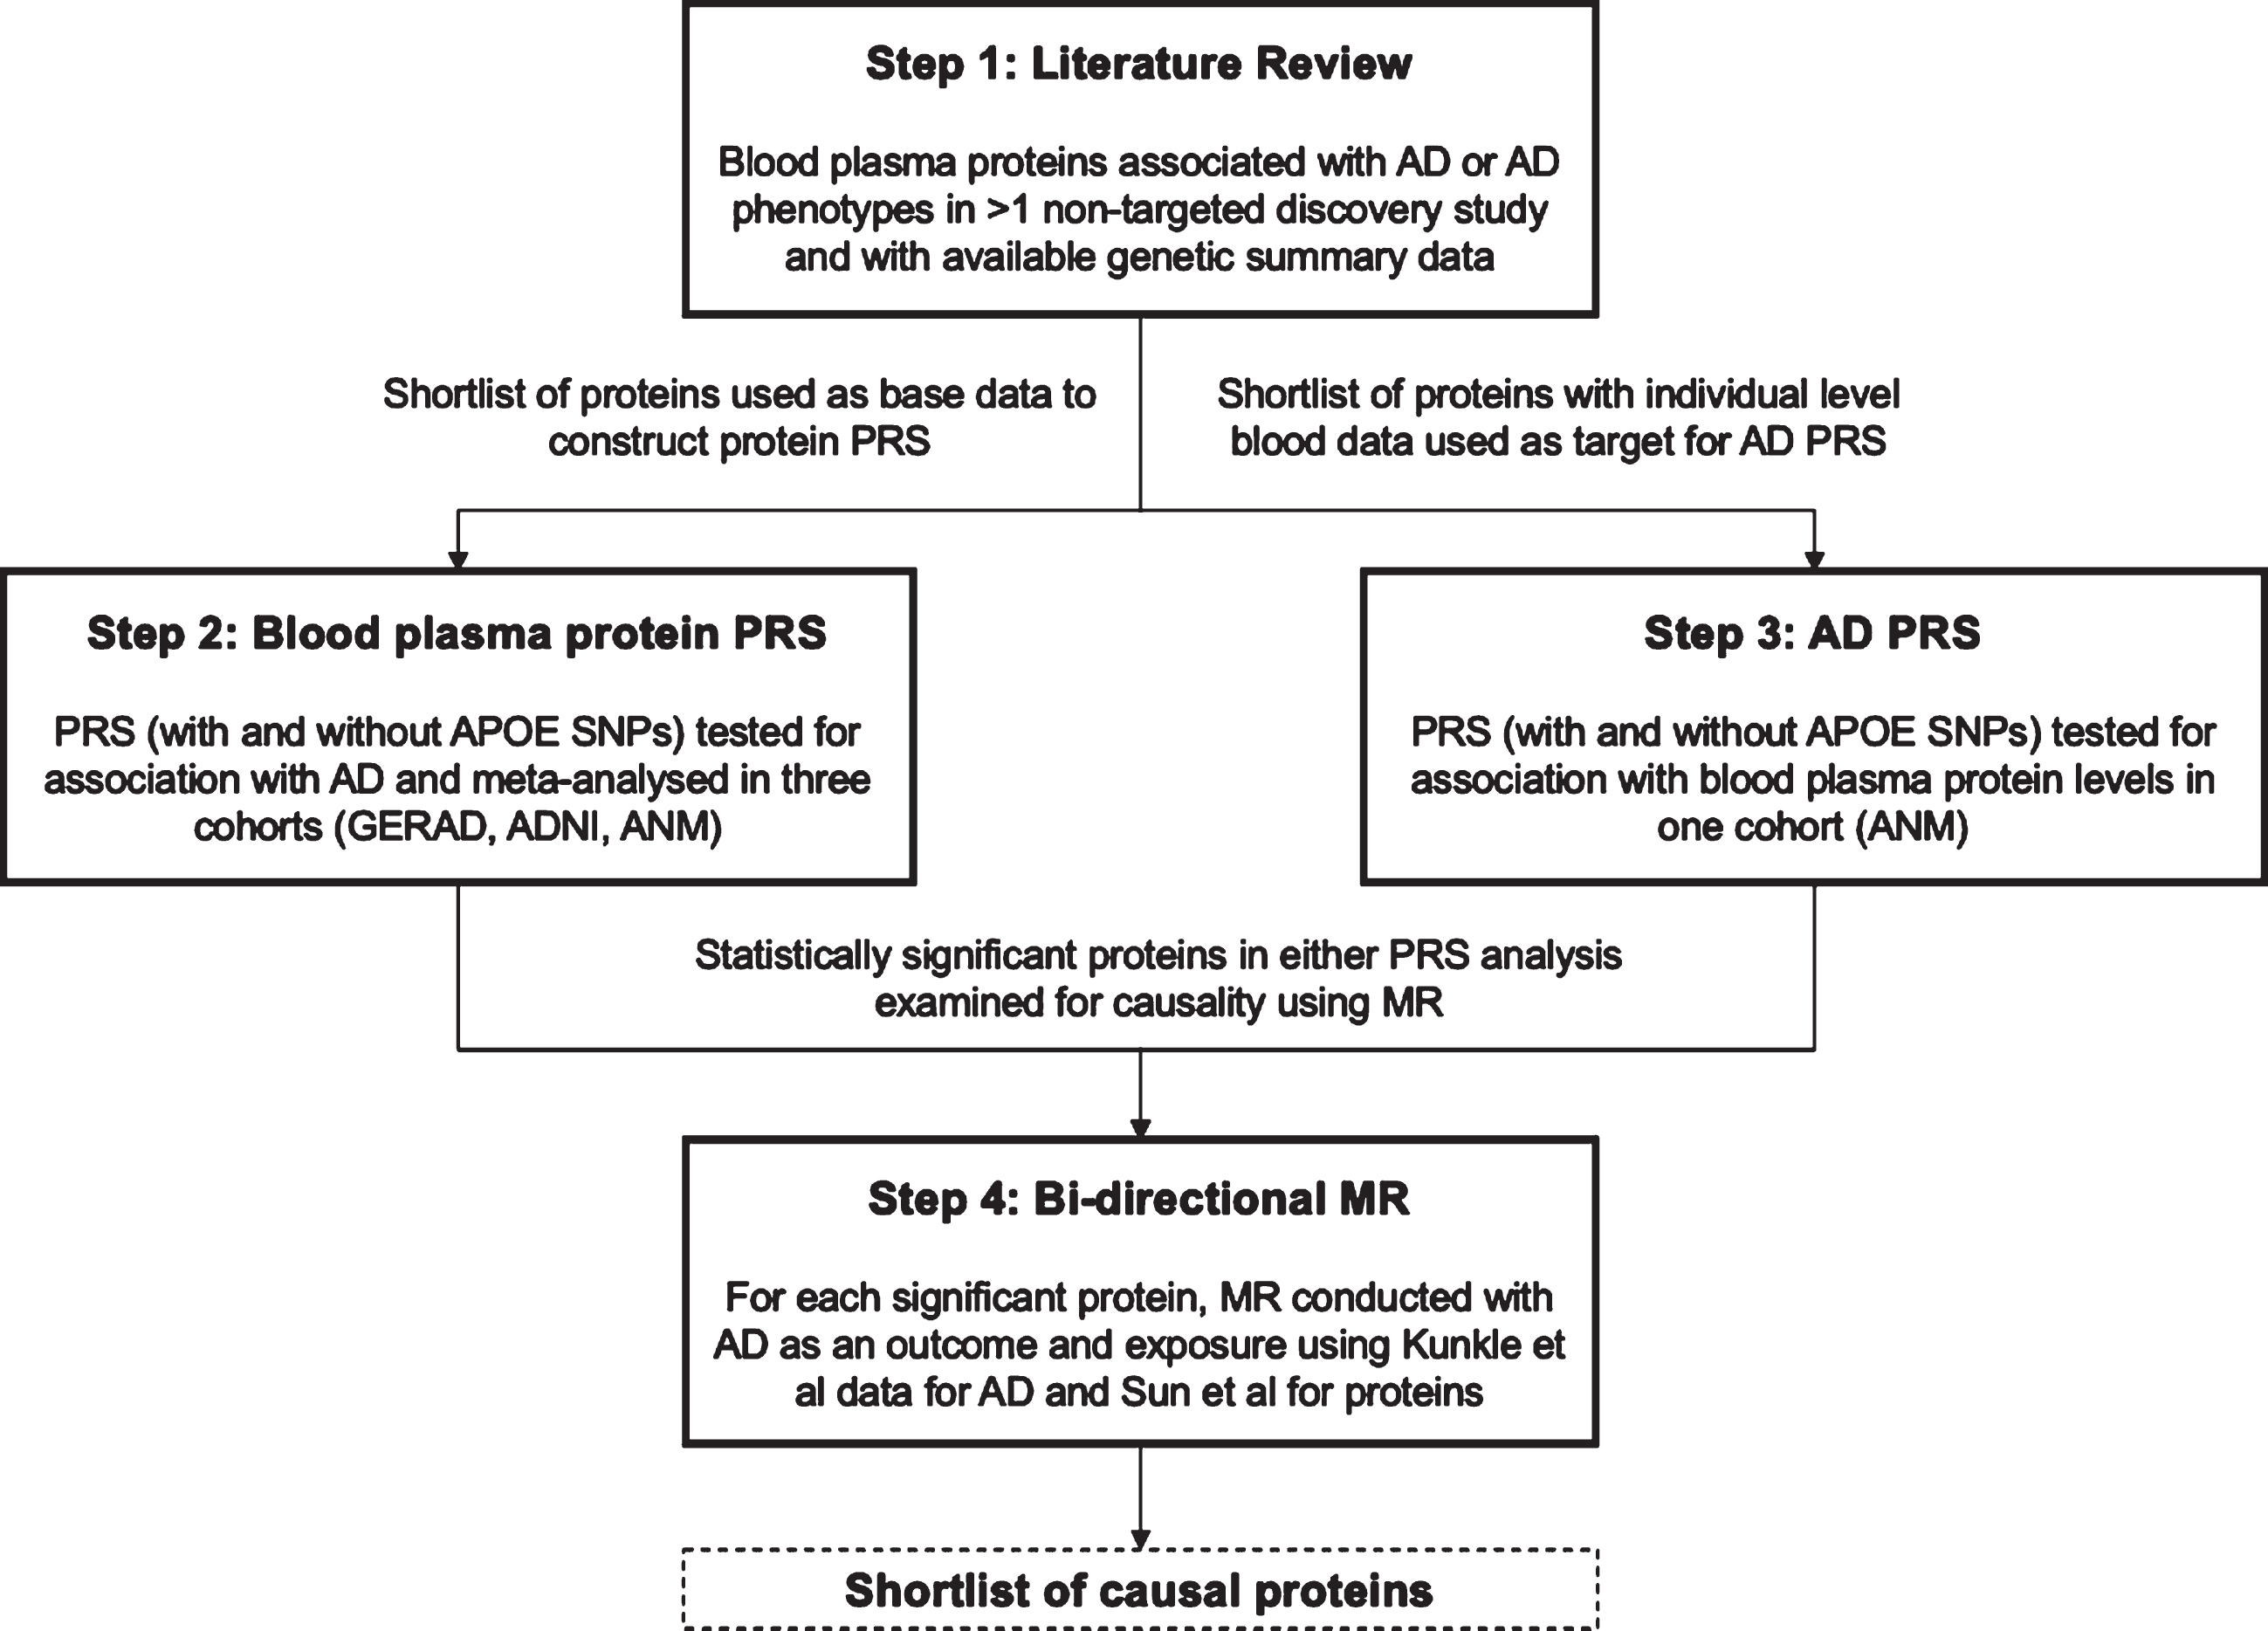
The primary objective of this study was to explore the genetic overlap between AD and plasma proteins using PRS and to assess whether individual plasma proteins play a causal role in AD etiology using MR (see Fig. 1 for illustrative overview of study design). This study identified a shortlist of plasma proteins from existing literature that have been robustly associated with AD or AD endophenotypes and have publicly available genetic summary data. PRS models were then created for each shortlisted protein and tested for association with AD across three consortium cohorts, Genetic and Environmental Risk in Alzheimer’s Disease (GERAD1), Alzheimer’s Disease Neuroimaging Initiative (ADNI), and AddNeuroMed (ANM). An AD PRS was also constructed with publicly available genetic summary data from the largest case ascertained AD GWAS to date [8] and used to test each protein for bi-directional association in ANM where individual level plasma protein data was available. Lastly, for plasma proteins with PRS that demonstrated significant associations with AD (see Materials and Methods) in one or both PRS analyses, two sample bi-directional MR was conducted to test for causality (Fig. 1).
Fig. 1
Illustrative overview of study design outlining the four key steps in the study workflow: literature review, plasma protein PRS, AD PRS, and bi-directional MR.
MATERIALS AND METHODS
Plasma protein candidates
A shortlist of plasma proteins was compiled for analysis from previous AD discovery studies to represent known protein candidates for genetic exploration. A panel of 163 proteins previously associated with AD or AD related phenotypes from a systematic review of 21 non-targeted human AD blood protein discovery studies up to 2014 was used as the baseline [12]. An additional literature review was then conducted to cover the period from 2014–2019 and applied the same screening criteria (non-targeted discovery studies, except for panel based studies with > 100 candidates) [12] to generate the candidate list (further details in the Supplementary Material). Proteins were then selected for the shortlist if they passed two criteria. Firstly, the association replicated in > 1 study and, secondly, genetic summary data was available for the protein from Sun et al.’s human plasma protein GWAS [19]. At the time of analysis, Sun et al. was the largest, plasma protein GWAS using SomaLogic with publicly available data (downloaded and cross referenced from http://www.phpc.cam.ac.uk/ceu/proteins/).
Plasma protein data preparation
Plasma protein genetic summary data was acquired from Sun et al.’s GWAS of 3,622 proteins in 3,301 healthy participants from the INTERVAL study (further details in the Supplementary Material), a randomized trial of 45,000 blood donors across 25 centers in England [31]. Summary association results were made available on http://www.phpc.cam.ac.uk/ceu/proteins/ and were downloaded for proteins on the shortlist. Files were then uploaded to Rosalind, King’s College London’s high-performance computing facility, for further quality control (QC) and analysis. Further QC was conducted using R.3.6.0 and was based primarily on aligning to the protocol recommended for PRS analysis [32]. Specifically, remaining duplicates, non bi-allelic and non-target data overlapping variants were removed and SNP rsIDs were added and aligned with the target dataset (see https://github.com/AlexHandy1/ad-genetic-overlap-analysis for analysis scripts). Observed SNP heritability (h2SNP) and cross protein genetic correlation (rg) was estimated for each protein using linkage disequilibrium score regression (LDSR) with the Python LDSC package (Version 1.0.0) sourced from https://github.com/bulik/ldsc.
AD data preparation
Individual level genotype data for AD cases and controls was acquired from three consortium studies: GERAD1, ADNI, and ANM.
GERAD1 is a European consortium (https://gtr.ukri.org/projects?ref=G0902227) [33]. The GERAD1 sample comprised up to 3,292 AD cases and 1,223 controls. Genetic data from a subset of 4,515 participants was made available for this analysis prior to QC (further details in the Supplementary Material).
ADNI is a longitudinal, multi-center North American study initiated in 2004 [34] and now in its fourth wave (ADNI1, ADNI-GO, ADNI2, and ADNI3) collecting clinical, imaging, genetic, and biomedical biomarkers for AD. Genetic data from 1,674 participants (not including ADNI3) was made available for this analysis prior to QC (further details in the Supplementary Material).
The ANM is a European consortium, initiated in 2008 with the aim to establish biomarkers for AD [35]. The Dementia Case Register (DCR) is a follow-up of ANM, with UK subjects recruited from the Maudsley and King’s Healthcare Partners Dementia Case Register [36]. Genetic data from 1,063 participants from ANM (including DCR) was made available for this analysis prior to QC (further details in the Supplementary Material). In addition to full clinical and demographic data, 410 participants had plasma protein data. Plasma protein data was collected using SomaLogic’s multiplexed, aptamer-based assay (SOMAscan) with SOMAmers for 1,016 proteins. Normalized, log2 transformed residuals were used as the phenotype after regression with age, sex, batch, and 10 principal components.
For all three consortium datasets, standard genetic QC procedures were applied (removal of non-autosomal chromosomes, alleles with minor allele frequency < 1%, genotypes with call rate < 98%and Hardy Weinberg deviations at 1×10⁻⁵) based on protocol by Coleman [37] (further details in Supplementary Figure 1). The sample size remaining for analysis after these QC procedures were applied is reported in the results (see Tables 2 and 3).
Table 2
Summary characteristics of GERAD1, ADNI, and ANM participants post QC
| Total | AD Cases | Controls | Males | Females | 70 and over | Mean age | |
| GERAD1 (N) | 4,492 | 3,277 | 1,215 | 1,640 | 2,852 | 3,189 | 70.5 |
| ADNI (N) | 1,007 | 639 | 368 | 559 | 448 | 886 | 78.2 |
| ANM (N) | 745 | 371 | 374 | 309 | 436 | 641 | 78.2 |
| Total (N) | 6,244 | 4,287 | 1,957 | 2,508 | 3,736 | 4,716 |
Table 3
Summary characteristics of ANM participants with plasma protein data post QC
| Total | AD Cases | MCI Cases | Controls | Males | Females | 70 and over | Mean age | |
| ANM (blood) (N) | 410 | 210 | 104 | 96 | 163 | 247 | 330 | 75.2 |
Plasma protein PRS
A PRS was constructed with the post QC Sun et al. GWAS data (“base data”) for each shortlist protein using PRSice-2 software (version 2.3.1e) [38]. PRSice automatically removes strand ambiguous SNPs and SNPs that are not present in both base and target data. SNPs were further “clumped” if LD (measured in r2) was > 0.1 within a window of 250 kilobases with the SNP with the lowest GWAS p-value within each region retained. After clumping, PRS were calculated with SNPs under 10 pre-defined p-value thresholds (5e-08, 5e-05, 5e-04, 0.0001, 0.001, 0.01, 0.05, 0.1, 0.2, 0.5, 1). PRS at all 10 thresholds for each protein were then independently tested for association with each individual AD dataset (GERAD1, ADNI and ANM) using logistic regression. Age, sex, and 7 principal components to control for population stratification were included as covariates to create a null model (covariates only), which was subtracted from the full model (covariates and PRS), to provide a Lee adjusted r2 [39] assuming an AD prevalence of 7%[40].
Protein PRS, for each selected protein, were tested for association with AD with the APOE region (992 SNPs within 750 kilobases of rs429358 on chromosome 19) included (APOE+) and excluded (APOE-) for all participants. APOE SNPs were removed to test whether protein PRS associations held without the known, strong effects of APOE alleles on AD risk [41]. As a secondary analysis to explore sex and age specific associations, PRS were constructed and tested for subgroups stratified by male, female, and 70 years and over (≥70) to test for gender and age specific effects. Lastly, random-effects meta-analysis was conducted on the PRS results at each p-value threshold across the three AD datasets using R and a restricted maximum likelihood (REML) estimator from the metafor R package [42]. Meta-analyzed results were ranked by lowest p-value to identify the most significant PRS model threshold for each protein-AD association. A Bonferroni corrected p-value of 0.00017 (0.05 / (number of proteins x number of PRS p-value thresholds tested)) was estimated and used as the primary threshold for significance. Given this is a conservative threshold, if no proteins pass this threshold in all participants (APOE+ and APOE–), nominally significant proteins (p < 0.05) will be considered for MR analysis based on an assessment of their association strength (e.g., how close to Bonferroni threshold) and consistency (e.g., association across subgroups).
AD PRS
An AD PRS was constructed using the meta-analyzed stage 1 discovery results from Kunkle et al.’s AD GWAS [8] of 21,982 AD cases and 41,944 cognitively normal controls (“base data”) downloaded from https://www.niagads.org/datasets/ng00075. Kunkle et al. was selected to provide statistical power and a clinical phenotype as the largest case ascertained AD GWAS to date. QC was applied to the base data of 11,480,632 variants to remove NAs, variants without an rsID and non bi-allelic variants leaving 10,528,610 variants for PRS analysis. As rsIDs were already provided in the AD base data and aligned to GRCh37, non-target data overlapping variants were removed with PRSice during the PRS analysis. p-value thresholds and clumping configuration settings in PRSice were kept constant with the protein PRS analysis. No covariates were included as age, sex, batch, and population stratification were already controlled for in the production of the protein residuals phenotype which was used as the target data. This decision was taken to align with other proteomic studies integrating genetic and proteomic data [19] and to enable comparability. AD PRS were tested for association with each individual shortlist protein using linear regression and the PRS model with the best fit (measured by lowest p-value) was presented for each protein. As with the protein PRS, AD PRS were tested for association with and without APOE SNPs and secondary analysis was conducted on subsets stratified by gender (male, female) and age (≥70). Bonferroni correction (and a more liberal assessment of association strength) was estimated and applied to control for multiple testing as described in the protein PRS analysis (with number of tests adjusted for the number of proteins with individual level blood data available for analysis).
Bi-directional MR
MR analysis was performed using the MR Base R package [43] on a subset of proteins from the PRS analyses. Proteins were selected for MR if they had a p-value below Bonferroni significance in either PRS analysis (protein PRS to AD APOE+/–or AD PRS to protein APOE+/–) or if they were nominally significant (p-value < 0.05) in both directions (protein PRS to AD APOE+/–and AD PRS to protein APOE+/–). Given Bonferroni is a conservative threshold, if no protein passed Bonferroni significance, the strongest protein association with a p-value below 0.05 was also considered. Univariate MR was performed with each protein as the exposure and AD as the outcome. Genetic instrument SNPs for each protein were selected from Sun et al. at two p-value thresholds for analysis (5×10⁻⁸ and 5×10⁻⁶). The less stringent 5×10⁻⁶ threshold was applied to ensure SNPs were available for all proteins with the noted limitation of introducing potential weak instrument bias. Selected SNPs were then clumped within a 250 kb window at LD r2 < 0.001. F statistics were generated for each SNP (SNP-exposure effect size∧2/SNP-exposure standard error∧2) to test for weak instrument bias and excluded if < 10 [44]. The remaining SNPs were further pruned if they were associated with any of the other proteins or with AD directly (p < 5×10⁻⁸ in Kunkle et al. GWAS). This was implemented to exclude SNPs that may affect AD through a pathway other than the exposure protein (horizontal pleiotropy) [45]. SNPs were also removed in the APOE region (chromosome 19, base-pairs 4500000–4580000) as potential confounders that violate MR’s core assumptions, given their known association with AD [46]. Protein exposure SNPs and AD outcome SNPs were harmonized and tested with alleles assumed to be on the forward strand (no palindromic SNPs removed). As a secondary test, the MR analysis was also run with palindromic SNPs flipped and removed if non-inferable. Causal estimates were estimated using inverse variance weighted (IVW) two sample MR and sensitivities were tested with MR-Egger, weighted median and leave one out analysis (further details in the Supplementary Material). To test for causality in the opposite direction, this analysis pipeline was repeated with AD as the exposure (using AD SNPs with p-value < 5×10⁻⁸ from Kunkle et al. stages 1, 2, and 3) and each protein as the outcome.
An interactive web dashboard was built with R Shiny to present the full PRS and MR results (available at https://alexhandy1.shinyapps.io/ad-genetic-overlap-web-results/) with the key results reported herein.
RESULTS
Data preparation
The literature review provided 4 new studies [36, 47–49] adding 14 new proteins and bringing the total candidate protein list to 175. From the 175 candidate proteins, 31 passed the shortlist inclusion criteria (> 1 study replication, GWAS data available, see Table 1).
Table 1
Protein shortlist for analysis ordered by number of studies replicated in from literature review
| Protein name | UniProt ID | Studies replicated in (N) | SOMAmer ID (Sun et al. study) |
| Pancreatic prohormone | P01298 | 7 | PPY.4588.1.2 |
| Apolipoprotein E (isoform ɛ3) | P02649 | 6 | APOE.2937.10.2 |
| Complement factor H | P08603 | 5 | CFH.4159.130.1 |
| Plasma protease C1 inhibitor | P05155 | 5 | SERPING1.4479.14.2 |
| Complement C3 | P01024 | 5 | C3.2755.8.2 |
| Fibrinogen (D-dimer) | P02671, | 5 | FGA.FGB.FGG.4907.56.1 |
| P02675, | |||
| P02679 | |||
| Serum amyloid P-component | P02743 | 4 | APCS.2474.54.5 |
| Haptoglobin | P00738 | 3 | HP.3054.3.2 |
| Interleukin-3 | P08700 | 3 | IL3.4717.55.2 |
| Complement C4-A/B | P0C0L4 | 3 | C4A.C4B.4481.34.2 |
| P0C0L5 | |||
| Interleukin-10 | P22301 | 3 | IL10.2773.50.2 |
| Vitronectin | P04004 | 3 | VTN.13125.45.3 |
| Insulin-like growth factor-binding protein 2 | P18065 | 3 | IGFBP2.2570.72.5 |
| Angiopoietin-2 | O15123 | 2 | ANGPT2.13660.76.3 |
| Apolipoprotein B-100 | P04114 | 2 | APOB.2797.56.2 |
| C-C motif chemokine 26 | Q9Y258 | 2 | CCL26.9168.31.3 |
| C-reactive protein | P02741 | 2 | CRP.4337.49.2 |
| Clusterin | P10909 | 2 | CLU.4542.24.2 |
| Granulocyte colony-stimulating factor | P09919 | 2 | CSF3.8952.65.3 |
| Interleukin-13 | P35225 | 2 | IL13.3072.4.2 |
| Interleukin-8 | P10145 | 2 | CXCL8.3447.64.2 |
| Kit ligand | P21583 | 2 | KITLG.9377.25.3 |
| Matrix metalloproteinase-9 | P14780 | 2 | MMP9.2579.17.5 |
| Natriuretic peptides B | P16860 | 2 | NPPB.3723.1.2 |
| Plasminogen | P00747 | 2 | PLG.3710.49.2 |
| Resistin | Q9HD89 | 2 | RETN.3046.31.1 |
| Serotransferrin | P02787 | 2 | TF.4162.54.2 |
| Tenascin | P24821 | 2 | TNC.4155.3.2 |
| Tumor necrosis factor | P01375 | 2 | TNF.5936.53.3 |
| Vascular cell adhesion protein 1 | P19320 | 2 | VCAM1.2967.8.1 |
| Vitamin D-binding protein | P02774 | 2 | GC.6581.50.3 |
Sun et al.’s GWAS provided summary statistics for 3301 participants (see characteristics in Supplementary Table 1) covering 10,572,788 variants for each protein, with 5,210,103 variants included for PRS analysis after additional QC for this study (see Supplementary Table 2). Average h2 SNP across the proteins was 0.10; however, results were treated as indicative given the average standard error was 0.16 (including 8 proteins with h2 SNP less than 0) (see the Supplementary Material for further details).
For the AD cohort, 6,244 participants were available for analysis from GERAD1, ADNI, and ANM (see Table 2) with 5,218,413 overlapping variants included for PRS analysis after QC (see the Supplementary Material for further details).
In the AD PRS analysis where only ANM had plasma protein data, 410 participants with plasma protein data remained for analysis after QC (see Table 3).
PRS results
Plasma protein PRS
In all participants, APOE+ PRS for APOE ɛ3 (p = 6.5×10⁻²¹), apolipoprotein B-100 (APOB-100, p = 6.7×10⁻²⁰), and C-reactive protein (CRP, p = 1.5×10⁻⁸) were associated with AD at Bonferroni significance (p < 0.00017) (see Table 4 and full results at https://alexhandy1.shinyapps.io/ad-genetic-overlap-web-results/). No other protein APOE+ PRS passed Bonferroni significance in all participants or subgroups. For APOE- PRS (992 SNPs within 750 kilobases of rs429358 on chromosome 19 removed), no proteins, including APOE, APOB, and CRP, passed Bonferroni significance in all participants or subgroups. In all participants, APOE- PRS for vitamin D-binding protein (VDBP) presented the strongest signal (p = 0.009) with 7 other proteins passing nominal significance (p < 0.05). The 3 proteins passing Bonferroni significance in APOE+ PRS (APOE ɛ3, APOB-100, and CRP) and the strongest APOE- PRS signal in all participants (VDBP) were deemed signals warranting further exploration in MR analysis.
Table 4
Summary of proteins with APOE+ PRS associations from meta-analyzed logistic regression with AD in all participants below Bonferroni significance
| Protein | PRS p threshold* | SNPs in PRS (N) | Beta** | 95%CI Lower | 95%CI Upper | R2 *** | p |
| APOE ɛ3 | 5.0E-08 | 5 | 0.26 | 0.20 | 0.31 | 0.01 | 6.5E-21 |
| APOB-100 | 5.0E-08 | 2 | 0.58 | 0.46 | 0.70 | 0.01 | 6.7E-20 |
| CRP | 5.0E-08 | 5 | –0.31 | –0.42 | –0.20 | 0.01 | 1.5E-08 |
*p-value from protein GWAS below which SNPs were included in PRS. PRS p-value threshold for most significant PRS model (based on meta-analyzed p-value) presented. **Estimated based on normalized, per standard deviation of PRS. ***Estimated from meta-analysis outputs using the formula
AD PRS
AD PRS models were tested for association with 26 of the 31 shortlist proteins in 1 ANM cohort (due to data availability) and in the same 3 subgroups (males, females and ≥70). In all participants and subgroups, no proteins were associated with AD APOE+ or APOE- PRS (992 SNPs within 750 kilobases of rs429358 on chromosome 19 removed) at Bonferroni significance (p < 0.00019, view full results at https://alexhandy1.shinyapps.io/ad-genetic-overlap-web-results/). In all participants, Haptoglobin presented the strongest association with AD APOE+ PRS (p = 0.0107), with CRP (p = 0.0108) the other protein to pass nominal significance. For AD APOE- PRS, Complement factor H was the strongest signal (p = 0.021) with 6 other proteins passing nominal significance. Insulin-like growth factor-binding protein 2 (IGFBP2) was one of these proteins (p = 0.025) and came close to Bonferroni significance in ≥70 (p = 0.00026). Given IGFBP2 was also the only protein to display a nominally significant association for APOE- PRS in both directions (AD APOE- PRS p = 0.025, protein APOE- PRS p = 0.045) it was selected for MR analysis.
Bi-directional MR results
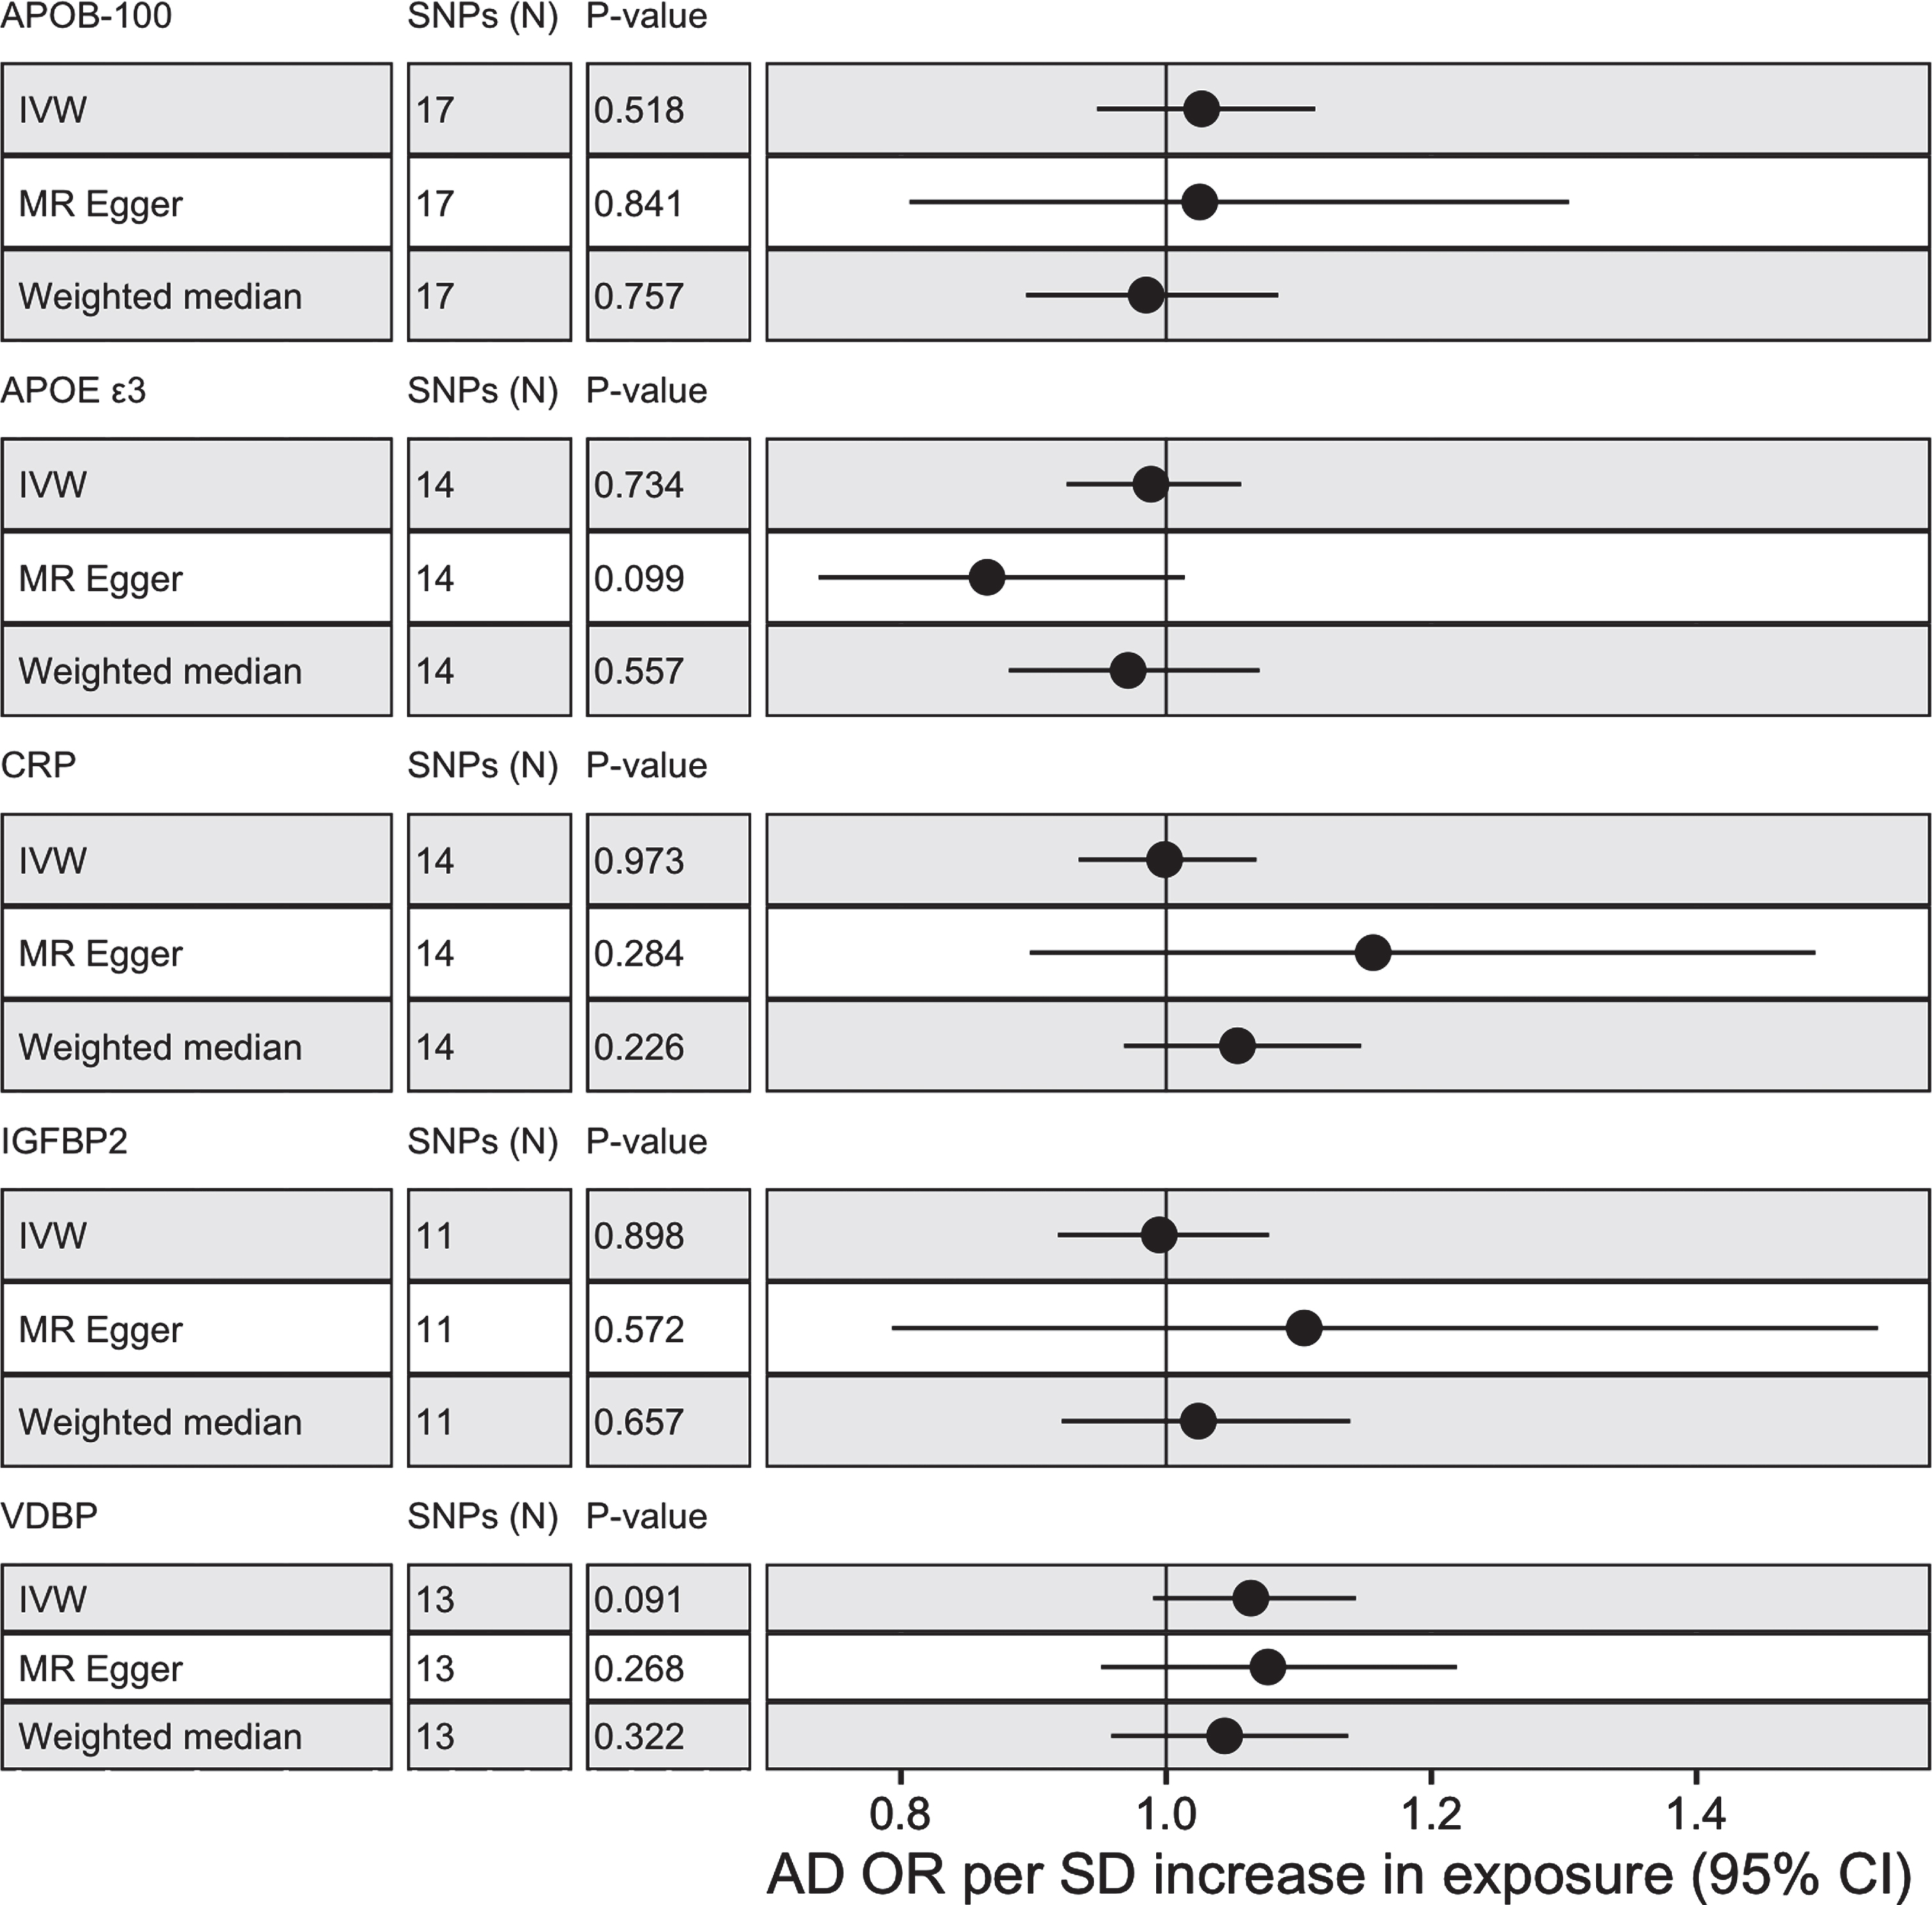
MR analysis was conducted with five proteins, APOE ɛ3, APOB-100, CRP, IGFBP2, and VDBP to test for casual associations. Only two proteins (CRP and VDBP) had valid SNP instruments at 5×10⁻⁸ but all proteins had available SNP instruments at 5×10⁻⁶. No proteins passed nominal significance (p < 0.05) using IVW with SNPs selected at 5×10⁻⁸ or 5×10⁻⁶ (see Fig. 2 and view full results at https://alexhandy1.shinyapps.io/ad-genetic-overlap-web-results/). Overall, exclusion of non-inferable palindromic SNPs produced similar results across all methods. All instruments selected had an F statistic > 10 and there was limited evidence of horizontal pleiotropy (no Egger intercept p < 0.05) or heterogeneity between SNPs (no Cochran’s Q p < 0.05 for protein across multiple methods). There was also no evidence of reverse causality when AD was tested as an exposure.
Fig. 2
MR results with protein as exposure and AD as outcome for IVM, MR-Egger and weighted median with alleles assumed on forward strand for harmonization with SNP instruments selected at 5×10⁻⁶.
DISCUSSION
Main findings
This study set out to identify if a shortlist of plasma proteins, previously associated with AD in observational studies, genetically overlap with AD by testing if PRS for these proteins were associated with AD. For proteins with evidence of genetic overlap, MR was conducted to test whether exposure to the protein was causal. The findings provide strong evidence that APOE ɛ3, APOB-100, and CRP genetically overlap with AD and, therefore, identifies a genetic signal linked to a set of specific, accessible risk factors. Moreover, this overlap appears to be driven by the APOE genotype, providing evidence that APOE’s strong genetic effect on AD [41] may be partially linked to plasma proteins. However, our MR analysis found no evidence of causality for APOE ɛ3, APOB-100, or CRP.
Apolipoproteins in plasma have been linked to AD risk through their role in regulating cholesterol [50], with increased total cholesterol (TC) associated with higher risk [51, 52] while increased high-density lipoprotein cholesterol (HDL-C) appears protective [53]. CRP has also been suggested as a causal factor in AD through its pro-inflammatory role in the immune response [54, 55]. Observational evidence is nuanced, with increased levels of CRP in midlife associated with multiple dementias in later life [56] contrasting with lower levels of CRP found in individuals who actively have AD [57].
The key advantage of MR is its ability to help disentangle causal associations from associations which could be triggered by numerous confounders [24]. Our null MR results for APOE ɛ3, APOB-100, or CRP align with larger MR studies that found no causal associations between AD and CRP [25], TC or HDL-C [58, 59], the hypothesized mechanisms of action for apolipoproteins. However, these results are not yet conclusive. A more recent MR meta-analysis found that both TC and HDL-C showed causal associations with AD [60] with Rasmussen et al.’s larger MR study also suggesting APOE in plasma is causal for AD [18]. Unfortunately due to data availability, our study was only able to measure APOE isoform ɛ3 rather than the higher effect isoforms ɛ2 and ɛ4 [61] suggesting our null MR result may be due to isoform rather than a lack of causality. All these findings support the need for a larger scale MR study measuring a consistent and historically comparable set of plasma protein exposures.
Independently of APOE, VDBP and IGFBP2 presented suggestive signals of genetic overlap with AD in our study. Research investigating the effect of VDBP and IGFBP2 on AD is less well developed. VDBP has been shown to attenuate Aβ aggregation in vitro and in mice [62] and two recent MR studies have identified a causal relationship between increased levels of VDBP and reduced AD risk [63, 64], with Larsson et al demonstrating particularly strong evidence from two large samples. In our MR analysis, VDBP did not demonstrate evidence of causality, however, our sample is smaller than Larsson et al and may have lacked statistical power. IGFBP2 has been shown to restrict the neuroprotective effects of insulin growth factors [65] and increased levels have been associated with higher AD risk and lower cognitive performance [66]. In our MR analysis, IGFBP2 did not demonstrate evidence of causality. To the best of our knowledge, this is the first study to conduct a targeted MR on IGFBP2 and AD, suggesting further research is required before making a strong inference on causality.
Limitations and future directions
Our study has three key limitations. Firstly, the initial proteins considered for analysis had to demonstrate prior association with AD and, therefore, represent only a subset of proteins in plasma. Whilst a targeted design was deliberate to lower the risk of false positives and support interpretability, it does increase the probability that causal proteins for AD were not included in the analysis. This exclusion risk was amplified by data availability constraints and a reliance on the SomaLogic platform, with only 53%of candidate proteins from the literature review possessing publicly available genetic summary data at the time of analysis. Most notably, alpha-2-macroglobulin and alpha-1-antitrypsin were each replicated in 6 studies in the literature review (the same number of replications as APOE) but were excluded due to a lack of genetic data. Moving forward, a planned outreach effort to aggregate summary data from other research groups and assay platforms (as demonstrated by [27]) supported by integrating new data [67] could improve protein coverage and increase statistical power.
Secondly, the statistical power to correctly identify true positives was limited across multiple steps of the analysis. Studies are now routinely conducted with samples of 100,000 + individuals for common human traits [68–70] in order to capture the small effect sizes of individual SNPs [71]. Sample size is particularly important for traits with low to moderate heritability where the effect size of individual SNPs is likely to be lower [72]. In this study, estimates of observed SNP heritability (h2 SNP) for proteins were themselves hampered by sample size (see https://github.com/bulik/ldsc/wiki/FAQ), but a median h2 SNP of 0.09 (interquartile range 0.006–0.22) suggests analyzed proteins were at most, moderately heritable. Moderate heritability weakens PRS and MR [73], given PRS and MR instrumental variables are a composite of genetic liability which is dependent on the heritability of a trait. This may partly explain the limited genetic overlap and low variance explained (R2) of AD by individual protein PRS (see https://alexhandy1.shinyapps.io/ad-genetic-overlap-web-results/). Low R2 may also reflect that proteins often exert their effects as part of large molecular networks rather than as individual entities [74]. Therefore, larger sample sizes and multivariate statistical tests are required to robustly corroborate the lack of causal protein-AD associations in this study.
Lastly, the nature of the phenotype data collected possesses several inherent limitations. Both protein and AD case target data were collected at a single point in time. For AD this means a proportion of controls may have developed into cases and for proteins it means observed variability over time [75, 76] is not captured. For AD there is the added limitation of using a clinical diagnosis as a phenotype. Clinical manifestation is heterogenous [77, 78] and in-life diagnosis can be inaccurate [79, 80] implying that adding endophenotype measures closer to causal biology (e.g., hippocampal volume) and symptomology (e.g., cognitive performance) may allow more precise association analysis.
Future analyses should, therefore, aim to expand protein coverage, increase sample sizes, and expand PRS and MR analyses to AD endophenotypes.
CONCLUSION
This study provides evidence that apolipoproteins and CRP PRS are associated with AD and identifies a genetic signal linked to a specific, accessible risk factor. However, none of the proteins tested in MR demonstrated evidence of causality. This study was conducted in a moderate sample size and may have lacked the statistical power to identify true causal associations. Therefore, this study provides a framework for future research to robustly interrogate protein causality in larger samples.
ACKNOWLEDGMENTS
This work was also made possible only through generous funding from key funding bodies. Petroula Proitsi is funded by Alzheimer’s Research UK. Jodie Lord is funded by the van Geest endowment fund. Richard Dobson is supported by the following: (1) NIHR Biomedical Research Centre at South London and Maudsley NHS Foundation Trust and King’s College London, London, UK; (2) Health Data Research UK, which is funded by the UK Medical Research Council, Engineering and Physical Sciences Research Council, Economic and Social Research Council, Department of Health and Social Care (England), Chief Scientist Office of the Scottish Government Health and Social Care Directorates, Health and Social Care Research and Development Division (Welsh Government), Public Health Agency (Northern Ireland), British Heart Foundation and Wellcome Trust; (3) The BigData@Heart Consortium, funded by the Innovative Medicines Initiative-2 Joint Undertaking under grant agreement No. 116074. This Joint Undertaking receives support from the European Union’s Horizon 2020 research and innovation programme and EFPIA; it is chaired by DE Grobbee and SD Anker, partnering with 20 academic and industry partners and ESC; (4) the National Institute for Health Research University College London Hospitals Biomedical Research Centre; (5) the National Institute for Health Research (NIHR) Biomedical Research Centre at South London and Maudsley NHS Foundation Trust and King’s College London; (6) the UK Research and Innovation London Medical Imaging & Artificial Intelligence Centre for Value Based Healthcare; (7) the National Institute for Health Research (NIHR) Applied Research Collaboration South London (NIHR ARC South London) at King’s College Hospital NHS Foundation Trust.
This study represents independent research additionally funded by the National Institute for Health Research (NIHR) Biomedical Research Centre at South London and Maudsley NHS Foundation Trust and King’s College London. The views expressed are those of the author(s) and not necessarily those of the NHS, the NIHR or the Department of Health and Social Care.
The authors acknowledge use of the research computing facility at King’s College London, Rosalind (https://rosalind.kcl.ac.uk), which is delivered in partnership with the National Institute for Health Research (NIHR) Biomedical Research Centres at South London & Maudsley and Guy’s & St. Thomas’ NHS Foundation Trusts, and part-funded by capital equipment grants from the Maudsley Charity (award 980) and Guy’s & St. Thomas’ Charity (TR130505). The views expressed are those of the author(s) and not necessarily those of the NHS, the NIHR, King’s College London, or the Department of Health and Social Care.
GERAD1 Acknowledgments: Cardiff University was supported by the Wellcome Trust, Medical Research Council (MRC), Alzheimer’s Research UK (ARUK) and the Welsh Assembly Government. Cambridge University and Kings College London acknowledge support from the MRC. ARUK supported sample collections at the South West Dementia Bank and the Universities of Nottingham, Manchester, and Belfast. The Belfast group acknowledges support from the Alzheimer’s Society, Ulster Garden Villages, N. Ireland R&D Office, and the Royal College of Physicians/Dunhill Medical Trust. The MRC and Mercer’s Institute for Research on Ageing supported the Trinity College group. The South West Dementia Brain Bank acknowledges support from Bristol Research into Alzheimer’s and Care of the Elderly. The Charles Wolfson Charitable Trust supported the OPTIMA group. Washington University was funded by NIH grants, Barnes Jewish Foundation, and the Charles and Joanne Knight Alzheimer’s Research Initiative. Patient recruitment for the MRC Prion Unit/UCL Department of Neurodegenerative Disease collection was supported by the UCLH/UCL Biomedical Centre and NIHR Queen Square Dementia Biomedical Research Unit. LASER-AD was funded by Lundbeck SA. The Bonn group was supported by the German Federal Ministry of Education and Research (BMBF), Competence Network Dementia and Competence Network Degenerative Dementia, and by the Alfried Krupp von Bohlen und Halbach-Stiftung. The GERAD1 Consortium also used samples ascertained by the NIMH AD Genetics Initiative.
A proportion of data collection and sharing for this project was also funded by the Alzheimer’s Disease Neuroimaging Initiative (ADNI) (National Institutes of Health Grant U01 AG024904). ADNI is funded by the National Institute on Aging, the National Institute of Biomedical Imaging and Bioengineering, and through generous contributions from the following: Abbott; Alzheimer’s Association; Alzheimer’s Drug Discovery Foundation; Amorfix Life Sciences Ltd.; AstraZeneca; Bayer HealthCare; BioClinica, Inc.; Biogen Idec Inc.; Bristol-Myers Squibb Company; Eisai Inc.; Elan Pharmaceuticals Inc.; Eli Lilly and Company; F. Hoffmann-La Roche Ltd and its affiliated company Genentech, Inc.; GE Healthcare; Innogenetics, N.V.; Janssen Alzheimer Immunotherapy Research & Development, LLC.; Johnson & Johnson Pharmaceutical Research & Development LLC.; Medpace, Inc.; Merck & Co., Inc.; Meso Scale Diagnostics, LLC.; Novartis Pharmaceuticals Corporation; Pfizer Inc.; Servier; Synarc Inc.; and Takeda Pharmaceutical Company. The Canadian Institutes of Health Research is providing funds to support ADNI clinical sites in Canada. Private sector contributions are facilitated by the Foundation for the National Institutes of Health (http://www.fnih.org). The grantee organization is the Northern California Institute for Research and Education, and the study is coordinated by the Alzheimer’s Disease Cooperative Study at the University of California, San Diego. ADNI data are disseminated by the Laboratory of Neuro Imaging at the University of California, Los Angeles.
Authors’ disclosures available online (https://www.j-alz.com/manuscript-disclosures/21-0462r1).
SUPPLEMENTARY MATERIAL
[1] The supplementary material is available in the electronic version of this article: https://dx.doi.org/10.3233/JAD-210462.
REFERENCES
[1] | Alzheimer’s Disease International ((2019) ) World Alzheimer Report 2019. Attitudes to dementia. London. |
[2] | Van Cauwenberghe C , Van Broeckhoven C , Sleegers K ((2016) ) The genetic landscape of Alzheimer disease: Clinical implications and perspectives. Genet Med 18: , 421–430. |
[3] | Lyketsos CG , Carrillo MC , Ryan JM , Khachaturian AS , Trzepacz P , Amatniek J , Cedarbaum J , Brashear R , Miller DS ((2011) ) Neuropsychiatric symptoms in Alzheimer’s disease. Alzheimers Dement 7: , 532–539. |
[4] | Gatz M , Reynolds CA , Fratiglioni L , Johansson B , Mortimer JA , Berg S , Fiske A , Pedersen NL ((2006) ) Role of genes and environments for explaining Alzheimer disease. Arch Gen Psychiatry 63: , 168. |
[5] | Escott-Price V , Myers AJ , Huentelman M , Hardy J ((2017) ) Polygenic risk score analysis of pathologically confirmed Alzheimer disease. Ann Neurol 82: , 311–314. |
[6] | Escott-Price V , Myers A , Huentelman M , Shoai M , Hardy J ((2019) ) Polygenic risk score analysis of Alzheimer’s disease in cases without APOE4 or APOE2 alleles. J Prev Alzheimers Dis 6: , 16–19. |
[7] | Jansen IE , Savage JE , Watanabe K , Bryois J , Williams DM , Steinberg S , Sealock J , Karlsson IK , Hägg S , Athanasiu L , Voyle N , Proitsi P , Witoelar A , Stringer S , Aarsland D , Almdahl IS , Andersen F , Bergh S , Bettella F , Bjornsson S , Brækhus A , Bråthen G , de Leeuw C , Desikan RS , Djurovic S , Dumitrescu L , Fladby T , Hohman TJ , Jonsson PV , Kiddle SJ , Rongve A , Saltvedt I , Sando SB , Selbæk G , Shoai M , Skene NG , Snaedal J , Stordal E , Ulstein ID , Wang Y , White LR , Hardy J , Hjerling-Leffler J , Sullivan PF , van der Flier WM , Dobson R , Davis LK , Stefansson H , Stefansson K , Pedersen NL , Ripke S , Andreassen OA , Posthuma D ((2019) ) Genome-wide meta-analysis identifies new loci and functional pathways influencing Alzheimer’s disease risk. Nat Genet 51: , 404–413. |
[8] | Kunkle BW , Grenier-Boley B , Sims R , Bis JC , Damotte V , Naj AC , Boland A , Vronskaya M , van der Lee SJ , Amlie-Wolf A , et al. ((2019) ) Genetic meta-analysis of diagnosed Alzheimer’s disease identifies new risk loci and implicates Aβ, tau, immunity and lipid processing. Nat Genet 51: , 414–430. |
[9] | Morris GP , Clark IA , Vissel B ((2018) ) Questions concerning the role of amyloid-β in the definition, aetiology and diagnosis of Alzheimer’s disease. Acta Neuropathol 136: , 663–689. |
[10] | Cummings J , Feldman HH , Scheltens P ((2019) ) The “rights” of precision drug development for Alzheimer’s disease. Alzheimers Res Ther 11: , 76. |
[11] | Cummings J ((2018) ) Lessons learned from Alzheimer disease: Clinical trials with negative outcomes. Clin Transl Sci 11: , 147–152. |
[12] | Kiddle SJ , Sattlecker M , Proitsi P , Simmons A , Westman E , Bazenet C , Nelson SK , Williams S , Hodges A , Johnston C , Soininen H , Kłoszewska I , Mecocci P , Tsolaki M , Vellas B , Newhouse S , Lovestone S , Dobson RJB ((2014) ) Candidate blood proteome markers of Alzheimer’s disease onset and progression: A systematic review and replication study. J Alzheimers Dis 38: , 515–531. |
[13] | Chouraki V , Beiser A , Younkin L , Preis SR , Weinstein G , Hansson O , Skoog I , Lambert JC , Au R , Launer L , Wolf PA , Younkin S , Seshadri S ((2015) ) Plasma amyloid-β and risk of Alzheimer’s disease in the Framingham Heart Study. Alzheimers Dement 11: , 249–257.e1. |
[14] | Karikari TK , Pascoal TA , Ashton NJ , Janelidze S , Benedet AL , Rodriguez JL , Chamoun M , Savard M , Kang MS , Therriault J , Schöll M , Massarweh G , Soucy JP , Höglund K , Brinkmalm G , Mattsson N , Palmqvist S , Gauthier S , Stomrud E , Zetterberg H , Hansson O , Rosa-Neto P , Blennow K ((2020) ) Blood phosphorylated tau 181 as a biomarker for Alzheimer’s disease: A diagnostic performance and prediction modelling study using data from four prospective cohorts. Lancet Neurol 19: , 422–433. |
[15] | Aiyaz M , Lupton MK , Proitsi P , Powell JF , Lovestone S ((2012) ) Complement activation as a biomarker for Alzheimer’s disease. Immunobiology 217: , 204–215. |
[16] | Liu CC , Kanekiyo T , Xu H , Bu G ((2013) ) Apolipoprotein e and Alzheimer disease: Risk, mechanisms and therapy. Nat Rev Neurol 9: , 106–118. |
[17] | Rasmussen KL , Nordestgaard BG , Frikke-Schmidt R , Nielsen SF ((2018) ) An updated Alzheimer hypothesis: Complement C3 and risk of Alzheimer’s disease—A cohort study of 95,442 individuals. Alzheimers Dement 14: , 1589–1601. |
[18] | Rasmussen KL , Tybjærg-Hansen A , Nordestgaard BG , Frikke-Schmidt R ((2018) ) Plasma apolipoprotein E levels and risk of dementia: A Mendelian randomization study of 106,562 individuals. Alzheimers Dement 14: , 71–80. |
[19] | Sun BB , Maranville JC , Peters JE , Stacey D , Staley JR , Blackshaw J , Burgess S , Jiang T , Paige E , Surendran P , Oliver-Williams C , Kamat MA , Prins BP , Wilcox SK , Zimmerman ES , Chi A , Bansal N , Spain SL , Wood AM , Morrell NW , Bradley JR , Janjic N , Roberts DJ , Ouwehand WH , Todd JA , Soranzo N , Suhre K , Paul DS , Fox CS , Plenge RM , Danesh J , Runz H , Butterworth AS ((2018) ) Genomic atlas of the human plasma proteome. Nature 558: , 73–79. |
[20] | Andrews SJ , Das D , Cherbuin N , Anstey KJ , Easteal S ((2016) ) Association of genetic risk factors with cognitive decline: The PATH through life project. Neurobiol Aging 41: , 150–158. |
[21] | Zettergren A , Lord J , Ashton NJ , Benedet AL , Karikari TK , Lantero Rodriguez J , Snellman A , Suárez-Calvet M , Proitsi P , Zetterberg H , Blennow K ((2021) ) Association between polygenic risk score of Alzheimer’s disease and plasma phosphorylated tau in individuals from the Alzheimer’s Disease Neuroimaging Initiative. Alzheimer’s Res Ther 13: , 17. |
[22] | Visscher PM , Wray NR , Zhang Q , Sklar P , McCarthy MI , Brown MA , Yang J ((2017) ) 10 years of GWAS discovery: Biology, function, and translation. Am J Hum Genet 101: , 5–22. |
[23] | Richardson TG , Harrison S , Hemani G , Smith GD ((2019) ) An atlas of polygenic risk score associations to highlight putative causal relationships across the human phenome. Elife 8: , e43657. |
[24] | Ebrahim S , Davey Smith G ((2008) ) Mendelian randomization: Can genetic epidemiology help redress the failures of observational epidemiology? Hum Genet 123: , 15–33. |
[25] | Larsson SC , Traylor M , Malik R , Dichgans M , Burgess S , Markus HS ((2017) ) Modifiable pathways in Alzheimer’s disease: Mendelian randomisation analysis. BMJ 359: , j5375. |
[26] | Lord J , Jermy B , Green R , Wong A , Xu J , Legido-Quigley C , Dobson R , Richards M , Proitsi P (2020) Deciphering the causal relationship between blood metabolites and Alzheimer’s disease: A Mendelian randomization study. medRxiv, 2020.04.28.20083253. |
[27] | Zheng J , Haberland V , Baird D , Walker V , Haycock P , Gutteridge A , Richardson TG , Staley J , Elsworth B , Burgess S , Sun BB , Danesh J , Runz H , Maranville JC , Martin HM , Yarmolinsky J , Laurin C , Holmes MV , Liu J , Estrada K , McCarthy L , Hurle M , Waterworth D , Nelson MR , Butterworth AS , Smith GD , Hemani G , Scott RA , Gaunt TR (2019) Phenome-wide Mendelian randomization mapping the influence of the plasma proteome on complex diseases. bioRxiv, 627398. |
[28] | Bretherick AD , Canela-Xandri O , Joshi PK , Clark DW , Rawlik K , Boutin TS , Zeng Y , Amador C , Navarro P , Rudan I , Wright AF , Campbell H , Vitart V , Hayward C , Wilson JF , Tenesa A , Ponting CP , Baillie JK , Haley C (2019) Proteome by-phenome Mendelian Randomisation detects 38 proteins with causal roles in human diseases and traits. bioRxiv, 631747. |
[29] | Naj AC , Jun G , Beecham GW , Wang LS , Vardarajan BN , Buros J , Gallins PJ , Buxbaum JD , Jarvik GP , Crane PK , et al. ((2011) ) Common variants at MS4A4/MS4A6E, CD2AP, CD33 and EPHA1 are associated with late-onset Alzheimer’s disease. Nat Genet 43: , 436–443. |
[30] | Hollingworth P , Harold D , Sims R , Gerrish A , Lambert JC , Carrasquillo MM , Abraham R , Hamshere ML , Pahwa JS , Moskvina V , et al. ((2011) ) Common variants at ABCA7, MS4A6A/MS4A4E, EPHA1, CD33 and CD2AP are associated with Alzheimer’s disease. Nat Genet 43: , 429–436. |
[31] | Di Angelantonio E , Thompson SG , Kaptoge S , Moore C , Walker M , Armitage J , Ouwehand WH , Roberts DJ , Danesh J , Donovan J , Ford I , Henry R , Hunt BJ , Le Huray B , Mehenny S , Miflin G , Green J , Stredder M , Watkins NA , McDermott A , Ronaldson C , Thomson C , Tolkien Z , Williamson L , Allen D , Sambrook J , Hammerton T , Bruce D , Choudry F , Ghevaert C , Johnston K , Kelly A , King A , Mo A , Page L , Richardson P , Senior P , Umrania Y , Wong H , Murphy G , Newland AC , Wheatley K , Greaves M , Turner M , Aziz T , Brain R , Davies C , Turner R , Wakeman P , Dent A , Wakeman A , Anthony B , Bland D , Parrondo W , Vincent H , Weatherill C , Forsyth A , Butterfield C , Wright T , Ellis K , Poynton P , Brooks C , Martin E , Littler L , Williams L , Blair D , Ackerley K , Woods L , Stanley S , Walsh G , Franklin G , Howath C , Sharpe S , Smith D , Botham L , Williams C , Alexander C , Sowerbutts G , Furnival D , Thake M , Patel S , Roost C , Sowerby S , Appleton MJ , Bays E , Bowyer G , Clarkson S , Halson S , Holmes K , Humphries G , Parvin-Cooper L , Towler J , Addy J , Barrass P , Stennett L , Burton S , Dingwall H , Clarke V , Potton M , Bolton T , Daynes M , Spackman S , Momodu A , Fenton J , Muhammed O , Oates N , Peakman T , Ryan C , Spreckley K , Stubbins C , Williams J , Brennan J , Mochon C , Taylor S , Warren K , Mant J , Danesh J ((2017) ) Efficiency and safety of varying the frequency of whole blood donation (INTERVAL): A randomised trial of 45 000 donors. Lancet 390: , 2360–2371. |
[32] | Choi SW , Mak TSH , O’Reilly PF ((2018) ) A guide to performing Polygenic Risk Score analyses. bioRxiv 2: , 416545. |
[33] | Harold D , Abraham R , Hollingworth P , Sims R , Gerrish A , Hamshere ML , Pahwa JS , Moskvina V , Dowzell K , Williams A , Jones N , Thomas C , Stretton A , Morgan AR , Lovestone S , Powell J , Proitsi P , Lupton MK , Brayne C , Rubinsztein DC , Gill M , Lawlor B , Lynch A , Morgan K , Brown KS , Passmore PA , Craig D , McGuinness B , Todd S , Holmes C , Mann D , Smith AD , Love S , Kehoe PG , Hardy J , Mead S , Fox N , Rossor M , Collinge J , Maier W , Jessen F , Schürmann B , Heun R , Van Den Bussche H , Heuser I , Kornhuber J , Wiltfang J , Dichgans M , Frölich L , Hampel H , Hüll M , Rujescu D , Goate AM , Kauwe JSK , Cruchaga C , Nowotny P , Morris JC , Mayo K , Sleegers K , Bettens K , Engelborghs S , De Deyn PP , Livingston G , Bass NJ , Gurling H , McQuillin A , Gwilliam R , Deloukas P , Al-Chalabi A , Shaw CE , Tsolaki M , Singleton AB , Guerreiro R , Mühleisen TW , Nöthen MM , Moebus S , Jöckel KH , Klopp N , Wichmann HE , Carrasquillo MM , Pankratz VS , Younkin SG , O’Donovan M , Owen MJ , Williams J ((2009) ) Genome-wide association study identifies variants at CLU and PICALM associated with Alzheimer’s disease. Nat Genet 41: , 1088–1093. |
[34] | Alzheimer’s Disease Neuroimaging Initiative. http://adni.loni.usc.edu/ |
[35] | Lovestone S , Francis P , Kloszewska I , Mecocci P , Simmons A , Soininen H , Spenger C , Tsolaki M , Vellas B , Wahlund LO , Ward M ((2009) ) AddNeuroMed - The European collaboration for the discovery of novel biomarkers for Alzheimer’s disease. Ann N Y Acad Sci 1180: , 36–46. |
[36] | Sattlecker M , Kiddle SJ , Newhouse S , Proitsi P , Nelson S , Williams S , Johnston C , Killick R , Simmons A , Westman E , Hodges A , Soininen H , Kłoszewska I , Mecocci P , Tsolaki M , Vellas B , Lovestone S , Dobson RJB ((2014) ) Alzheimer’s disease biomarker discovery using SOMAscan multiplexed protein technology. Alzheimers Dement 10: , 724–734. |
[37] | Coleman JRI , Euesden J , Patel H , Folarin AA , Newhouse S , Breen G ((2016) ) Quality control, imputation and analysis of genome-wide genotyping data from the Illumina HumanCoreExome microarray. Brief Funct Genomics 15: , 298–304. |
[38] | Choi SW , O’Reilly PF ((2019) ) PRSice-2: Polygenic Risk Score software for biobank-scale data. Gigascience 8: , giz082. |
[39] | Lee SH , Goddard ME , Wray NR , Visscher PM ((2012) ) A better coefficient of determination for genetic profile analysis. Genet Epidemiol 36: , 214–224. |
[40] | Dementia Statistics Hub. Prevalence by age in the UK. https://www.dementiastatistics.org/statistics/prevalence-by-age-in-the-uk/ |
[41] | Farrer LA , Cupples LA , Haines JL , Hyman B , Kukull WA , Mayeux R , Myers RH , Pericak-Vance MA , Risch N , Van Duijn CM ((1997) ) Effects of age, sex, and ethnicity on the association between apolipoprotein E genotype and Alzheimer disease: A meta-analysis. J Am Med Assoc 278: , 1349–1356. |
[42] | Viechtbauer W ((2010) ) Conducting meta-analyses in R with the metafor. J Stat Softw 36: , 1–48. |
[43] | Hemani G , Zheng J , Elsworth B , Wade KH , Haberland V , Baird D , Laurin C , Burgess S , Bowden J , Langdon R , Tan VY , Yarmolinsky J , Shihab HA , Timpson NJ , Evans DM , Relton C , Martin RM , Davey Smith G , Gaunt TR , Haycock PC ((2018) ) The MR-base platform supports systematic causal inference across the human phenome. Elife 7: , e34408. |
[44] | Davies NM , Holmes M V , Davey Smith G ((2018) ) Reading Mendelian randomisation studies: A guide, glossary, and checklist for clinicians. BMJ 362: , k601. |
[45] | Verbanck M , Chen CY , Neale B , Do R ((2018) ) Detection of widespread horizontal pleiotropy in causal relationships inferred from Mendelian randomization between complex traits and diseases. Nat Genet 50: , 693–698. |
[46] | Van Der Harst P , Verweij N ((2018) ) Identification of 64 novel genetic loci provides an expanded view on the genetic architecture of coronary artery disease. Circ Res 122: , 433–443. |
[47] | Ashton NJ , Nevado-Holgado AJ , Barber IS , Lynham S , Gupta V , Chatterjee P , Goozee K , Hone E , Pedrini S , Blennow K , Schöll M , Zetterberg H , Ellis KA , Bush AI , Rowe CC , Villemagne VL , Ames D , Masters CL , Aarsland D , Powell J , Lovestone S , Martins R , Hye A ((2019) ) A plasma protein classifier for predicting amyloid burden for preclinical Alzheimer’s disease. Sci Adv 5: , eaau7220. |
[48] | Shen L , Liao L , Chen C , Guo Y , Song D , Wang Y , Chen Y , Zhang K , Ying M , Li S , Liu Q , Ni J ((2017) ) Proteomics analysis of blood serums from Alzheimer’s disease patients using iTRAQ labeling technology. J Alzheimers Dis 56: , 361–378. |
[49] | Kitamura Y , Usami R , Ichihara S , Kida H , Satoh M , Tomimoto H , Murata M , Oikawa S ((2017) ) Plasma protein profiling for potential biomarkers in the early diagnosis of Alzheimer’s disease. Neurol Res 39: , 231–238. |
[50] | Brown MS , Kovanen PT , Goldstein JL ((1981) ) Regulation of plasma cholesterol by lipoprotein receptors. Science 212: , 628–635. |
[51] | Notkola I-L , Sulkava R , Pekkanen J , Erkinjuntti T , Ehnholm C , Kivinen P , Tuomilehto J , Nissinen A ((1998) ) Serum total cholesterol, apolipoprotein E epsilon 4 allele, and Alzheimer’s disease. Neuroepidemiology 17: , 14–20. |
[52] | Kivipelto M , Helkala EL , Laakso MP , Hänninen T , Hallikainen M , Alhainen K , Iivonen S , Mannermaa A , Tuomilehto J , Nissinen A , Soininen H ((2002) ) Apolipoprotein E ɛ4 allele, elevated midlife total cholesterol level, and high midlife systolic blood pressure are independent risk factors for late-life Alzheimer disease. Ann Intern Med 137: , 149–155. |
[53] | Reitz C , Tang MX , Schupf N , Manly JJ , Mayeux R , Luchsinger JA ((2010) ) Association of higher levels of high-density lipoprotein cholesterol in elderly individuals and lower risk of late-onset Alzheimer disease. Arch Neurol 67: , 1491–1497. |
[54] | Heppner FL , Ransohoff RM , Becher B ((2015) ) Immune attack: The role of inflammation in Alzheimer disease. Nat Rev Neurosci 16: , 358–372. |
[55] | McFadyen JD , Kiefer J , Braig D , Loseff-Silver J , Potempa LA , Eisenhardt SU , Peter K ((2018) ) Dissociation of C-reactive protein localizes and amplifies inflammation: Evidence for a direct biological role of C-reactive protein and its conformational changes. Front Immunol 9: , 1351. |
[56] | Schmidt R , Schmidt H , Curb JD , Masaki K , White LR , Launer LJ ((2002) ) Early inflammation and dementia: A 25-year follow-up of the Honolulu-Asia Aging Study. Ann Neurol 52: , 168–174. |
[57] | O’Bryant SE , Waring SC , Hobson V , Hall JR , Moore CB , Bottiglieri T , Massman P , Diaz-Arrastia R ((2010) ) Decreased C-reactive protein levels in Alzheimer disease. J Geriatr Psychiatry Neurol 23: , 49–53. |
[58] | Østergaard SD , Mukherjee S , Sharp SJ , Proitsi P , Lotta LA , Day F , Perry JRB , Boehme KL , Walter S , Kauwe JS , et al. ((2015) ) Associations between potentially modifiable risk factors and Alzheimer disease: A Mendelian randomization study. PLoS Med 12: , e1001841. |
[59] | Proitsi P , Lupton MK , Velayudhan L , Newhouse S , Fogh I , Tsolaki M , Daniilidou M , Pritchard M , Kloszewska I , Soininen H , Mecocci P , Vellas B , Williams J , Harold D , Sims R , Gerrish A , Chapman J , Escott-Price V , Abraham R , Hollingworth P , Hamshere M , Singh Pahwa J , Dowzell K , Williams A , Jones N , Thomas C , Stretton A , Morgan A , Williams K , Lovestone S , Powell J , Proitsi P , Lupton MK , Brayne C , Rubinsztein DC , Gill M , Lawlor B , Lynch A , Morgan K , Brown K , Passmore P , Craig D , Mcguinness B , Johnston JA , Todd S , Holmes C , Mann D , Smith AD , Love S , Kehoe PG , Hardy J , Guerreiro R , Singleton A , Mead S , Fox N , Rossor M , Collinge J , Maier W , Jessen F , Heun R , Schürmann B , Ramirez A , Becker T , Herold C , Lacour A , Drichel D , Van Den Bussche H , Heuser I , Kornhuber J , Wiltfang J , Dichgans M , Frölich L , Hampel H , Hüll M , Rujescu D , Goate A , Kauwe JSK , Cruchaga C , Nowotny P , Morris JC , Mayo K , Livingston G , Bass NJ , Gurling H , Mcquillin A , Gwilliam R , Deloukas P , Nöthen MM , Holmans P , O’Donovan M , Owen MJ , Williams J , Stewart R , Sham P ((2014) ) Genetic predisposition to increased blood cholesterol and triglyceride lipid levels and risk of Alzheimer disease: A Mendelian randomization analysis. PLoS Med 11: , e1001713. |
[60] | Zhang X , Tian Q , Liu D , Geng T , Xu X , Ge S , Zheng D , Wu L , Song M , Hou H , Wang W , Wang Y ((2020) ) Causal association of circulating cholesterol levels with dementia: A mendelian randomization meta-analysis. Transl Psychiatry 10: , 145. |
[61] | Rasmussen KL ((2016) ) Plasma levels of apolipoprotein E, APOE genotype and risk of dementia and ischemic heart disease: A review. Atherosclerosis 255: , 145–155. |
[62] | Jeon SG , Cha MY , Kim J il , Hwang TW , Kim KA , Kim TH , Song KC , Kim JJ , Moon M ((2019) ) Vitamin D-binding protein-loaded PLGA nanoparticles suppress Alzheimer’s disease-related pathology in 5XFAD mice. Nanomedicine 17: , 297–307. |
[63] | Zhang H , Wang T , Han Z , Wang L , Zhang Y , Wang L , Liu G ((2020) ) Impact of vitamin D binding protein levels on Alzheimer’s disease: A Mendelian randomization study. J Alzheimers Dis 74: , 991–998. |
[64] | Larsson SC , Traylor M , Markus HS , Michaëlsson K ((2018) ) Serum parathyroid hormone, 25-hydroxyvitamin D, and risk of Alzheimer’s disease: A mendelian randomization study. Nutrients 10: , 1243. |
[65] | Doré S , Kar S , Quirion R ((1997) ) Insulin-like growth factor I protects and rescues hippocampal neurons against β-amyloid- and human amylin-induced toxicity. Proc Natl Acad Sci U S A 94: , 4772–4777. |
[66] | McGrath ER , Himali JJ , Levy D , Conner SC , DeCarli CS , Pase MP , Courchesne P , Satizabal CL , Vasan RS , Beiser AS , Seshadri S ((2019) ) Circulating IGFBP-2: A novel biomarker for incident dementia. Ann Clin Transl Neurol 6: , 1659–1670. |
[67] | Pietzner M , Wheeler E , Carrasco-Zanini J , Raffler J , Kerrison ND , Oerton E , Auyeung VP , Luan an , Finan C , Casas JP , Williams SA , Kastenmüller G , Ralser M , Gamazon ER , Wareham J , Hingorani AD , Langenberg C (2020) Genetic architecture of host proteins interacting with SARS-CoV-2 1 2. bioRxiv, 2020.07.01.182709. |
[68] | Yengo L , Sidorenko J , Kemper K , Zheng Z , Wood A , Weedon M , Frayling T , Hirschhorn J , Yang J , Visscher P ; GIANT Consortium ((2018) ) Meta-analysis of genome-wide association studies for height and body mass index in ∼700,000 individuals of European ancestry. Hum Mol Genet 27: , 3641–3649. |
[69] | Xue A , Wu Y , Zhu Z , Zhang F , Kemper KE , Zheng Z , Yengo L , Lloyd-Jones LR , Sidorenko J , Wu Y , Agbessi M , Ahsan H , Alves I , Andiappan A , Awadalla P , Battle A , Beutner F , Bonder MJJ , Boomsma D , Christiansen M , Claringbould A , Deelen P , Esko T , Favé MJ , Franke L , Frayling T , Gharib S , Gibson G , Hemani G , Jansen R , Kähönen M , Kalnapenkis A , Kasela S , Kettunen J , Kim Y , Kirsten H , Kovacs P , Krohn K , Kronberg-Guzman J , Kukushkina V , Kutalik Z , Lee B , Lehtimäki T , Loeffler M , Marigorta UM , Metspalu A , Milani L , Müller-Nurasyid M , Nauck M , Nivard M , Penninx B , Perola M , Pervjakova N , Pierce B , Powell J , Prokisch H , Psaty B , Raitakari O , Ring S , Ripatti S , Rotzschke O , Ruëger S , Saha A , Scholz M , Schramm K , Seppälä I , Stumvoll M , Sullivan P , Teumer A , Thiery J , Tong L , Tönjes A , van Dongen J , van Meurs J , Verlouw J , Völker U , Võsa U , Yaghootkar H , Zeng B , McRae AF , Visscher PM , Zeng J , Yang J ((2018) ) Genome-wide association analyses identify 143 risk variants and putative regulatory mechanisms for type 2 diabetes. Nat Commun 9: , 2941. |
[70] | Howard DM , Adams MJ , Clarke TK , Hafferty JD , Gibson J , Shirali M , Coleman JRI , Hagenaars SP , Ward J , Wigmore EM , Alloza C , Shen X , Barbu MC , Xu EY , Whalley HC , Marioni RE , Porteous DJ , Davies G , Deary IJ , Hemani G , Berger K , Teismann H , Rawal R , Arolt V , Baune BT , Dannlowski U , Domschke K , Tian C , Hinds DA , Trzaskowski M , Byrne EM , Ripke S , Smith DJ , Sullivan PF , Wray NR , Breen G , Lewis CM , McIntosh AM ((2019) ) Genome-wide meta-analysis of depression identifies 102 independent variants and highlights the importance of the prefrontal brain regions. Nat Neurosci 22: , 343–352. |
[71] | Visscher PM , Brown MA , McCarthy MI , Yang J ((2012) ) Five years of GWAS discovery. Am J Hum Genet 90: , 7–24. |
[72] | Manolio TA , Collins FS , Cox NJ , Goldstein DB , Hindorff LA , Hunter DJ , McCarthy MI , Ramos EM , Cardon LR , Chakravarti A , Cho JH , Guttmacher AE , Kong A , Kruglyak L , Mardis E , Rotimi CN , Slatkin M , Valle D , Whittemore AS , Boehnke M , Clark AG , Eichler EE , Gibson G , Haines JL , MacKay TFC , McCarroll SA , Visscher PM ((2009) ) Finding the missing heritability of complex diseases. Nature 461: , 747–753. |
[73] | Brion MJA , Shakhbazov K , Visscher PM ((2013) ) Calculating statistical power in Mendelian randomization studies. Int J Epidemiol 42: , 1497–1501. |
[74] | Jaeger PA , Lucin KM , Britschgi M , Vardarajan B , Huang RP , Kirby ED , Abbey R , Boeve BF , Boxer AL , Farrer LA , Finch N , Graff-Radford NR , Head E , Hofree M , Huang R , Johns H , Karydas A , Knopman DS , Loboda A , Masliah E , Narasimhan R , Petersen RC , Podtelezhnikov A , Pradhan S , Rademakers R , Sun CH , Younkin SG , Miller BL , Ideker T , Wyss-Coray T ((2016) ) Network-driven plasma proteomics expose molecular changes in the Alzheimer’s brain. Mol Neurodegener 11: , 31. |
[75] | Lind L , Sundström J , Larsson A , Lampa E , Ärnlöv J , Ingelsson E ((2019) ) Longitudinal effects of aging on plasma proteins levels in older adults - associations with kidney function and hemoglobin levels. PLoS One 14: , e0212060. |
[76] | Liu Y , Buil A , Collins BC , Gillet LC , Blum LC , Cheng L , Vitek O , Mouritsen J , Lachance G , Spector TD , Dermitzakis ET , Aebersold R ((2015) ) Quantitative variability of 342 plasma proteins in a human twin population. Mol Syst Biol 11: , 786. |
[77] | Scheltens NME , Galindo-Garre F , Pijnenburg YAL , Van Der Vlies AE , Smits LL , Koene T , Teunissen CE , Barkhof F , Wattjes MP , Scheltens P , Van Der Flier WM ((2016) ) The identification of cognitive subtypes in Alzheimer’s disease dementia using latent class analysis. J Neurol Neurosurg Psychiatry 87: , 235–243. |
[78] | Komarova NL , Thalhauser CJ ((2011) ) High degree of heterogeneity in Alzheimer’s disease progression patterns. PLoS Comput Biol 7: , e1002251. |
[79] | Beach TG , Monsell SE , Phillips LE , Kukull W ((2012) ) Accuracy of the clinical diagnosis of Alzheimer disease at National Institute on Aging Alzheimer Disease Centers, 2005-2010. J Neuropathol Exp Neurol 71: , 266–273. |
[80] | Arevalo-Rodriguez I , Smailagic N , Roquéi Figuls M , Ciapponi A , Sanchez-Perez E , Giannakou A , Pedraza OL , Bonfill Cosp X , Cullum S ((2015) ) Mini-Mental State Examination (MMSE) for the detection of Alzheimer’s disease and other dementias in people with mild cognitive impairment (MCI). Cochrane Database Syst Rev 2015: , CD010783. |


