
Diagnostic Performance of Automated MRI Volumetry by icobrain dm for Alzheimer’s Disease in a Clinical Setting: A REMEMBER Study
Abstract
Background:
Magnetic resonance imaging (MRI) has become important in the diagnostic work-up of neurodegenerative diseases. icobrain dm, a CE-labeled and FDA-cleared automated brain volumetry software, has shown potential in differentiating cognitively healthy controls (HC) from Alzheimer’s disease (AD) dementia (ADD) patients in selected research cohorts.
Objective:
This study examines the diagnostic value of icobrain dm for AD in routine clinical practice, including a comparison to the widely used FreeSurfer software, and investigates if combined brain volumes contribute to establish an AD diagnosis.
Methods:
The study population included HC (n = 90), subjective cognitive decline (SCD, n = 93), mild cognitive impairment (MCI, n = 357), and ADD (n = 280) patients. Through automated volumetric analyses of global, cortical, and subcortical brain structures on clinical brain MRI T1w (n = 820) images from a retrospective, multi-center study (REMEMBER), icobrain dm’s (v.4.4.0) ability to differentiate disease stages via ROC analysis was compared to FreeSurfer (v.6.0). Stepwise backward regression models were constructed to investigate if combined brain volumes can differentiate between AD stages.
Results:
icobrain dm outperformed FreeSurfer in processing time (15–30 min versus 9–32 h), robustness (0 versus 67 failures), and diagnostic performance for whole brain, hippocampal volumes, and lateral ventricles between HC and ADD patients. Stepwise backward regression showed improved diagnostic accuracy for pairwise group differentiations, with highest performance obtained for distinguishing HC from ADD (AUC = 0.914; Specificity 83.0%; Sensitivity 86.3%).
Conclusion:
Automated volumetry has a diagnostic value for ADD diagnosis in routine clinical practice. Our findings indicate that combined brain volumes improve diagnostic accuracy, using real-world imaging data from a clinical setting.
INTRODUCTION
Utilization of non-invasive structural magnetic resonance imaging (MRI) in Alzheimer’s disease (AD) has expanded over the last decades, as the focus has shifted from a symptom-based exclusion diagnosis toward a biomarker-based framework. Whereas structural neuroimaging was historically performed to rule out brain lesions, it has become clear that identification of structural findings, such as atrophy patterns, and their association with neurodegenerative diseases may significantly increase diagnostic accuracy and aid in monitoring of disease progression [1–4]. In addition, structural imaging has become important in the selection of well characterized homogenous populations in clinical trials of disease modifying therapies in early AD [2]. In the light of these events, there is a growing interest in the use of volumetric measures of relevant brain regions as potential diagnostic markers for AD.
Brain structural volumes correlate strongly to disease severity in AD. Volumetric reductions in vulnerable cortical regions, including the frontal, parietal, and temporal brain areas, have been observed in varying degrees following disease progression [5, 6]. Medial temporal lobe atrophy, in particular hippocampal volume loss, is widely recognized as a prominent feature of AD neuropathology [3, 7]. Hippocampal atrophy resides amongst the most accurate markers of mild cognitive impairment (MCI) to AD conversion [8] and is now recommended as a neuroimaging biomarker for early detection in the revised National Institute on Aging-Alzheimer’s Association (NIA-AA) criteria for AD diagnosis [9–13].
Manual segmentations of brain structures, in particular the hippocampi, through hand-tracing by neuroanatomical experts are still considered to be the golden standard [14–16]. However, it is costly and time-consuming, especially in large-scale studies, and is subjected to inter- and intra-rater variability [14, 17]. As a result, visual assessments by radiologists are being merged with (semi-) automated volumetrics. However, semi-automated volumetry requires validated a priori determination of the region of interest (ROI) (e.g., user-defined landmarks). Fast and reliable automated brain segmentation techniques are thus beneficial to further deploy and successfully implement the usage of structural neuroimaging biomarkers in a clinical trial setting as well as routine clinical practice and increase their diagnostic accuracy. Therefore, recent research is aiming toward fully automated processes with easy interpretability for specialists, solid reproducibility, sensitivity, and a low measurement error [18, 19]. Already available automated brain segmentation software such as FreeSurfer, SPM, and BrainVisa reside among the most frequently used in neuroimaging research studies [20, 21]. Nonetheless, there is a translation paucity of many of these methodologies into the clinic, partly due to excessive processing time and a lack of validation in large cohorts that are representative of the general population. Hence, bridging the gap between the research setting and utility in clinical practice is an indispensable step in the widespread implementation of these segmentation tools in a real-world setting.
icobrain dm (v.4.4.0.), a CE-labeled and FDA-cleared automated brain tool using clinical MRI scans, has shown potential in terms of accuracy, reliability, and diagnostic performance in selected research cohorts [18]. Following previous work, we analyzed a total of 12 brain structure volumes (including whole brain, gray matter, cortical gray matter, white matter, frontal, parietal, temporal and occipital cortices, hippocampal volumes, and lateral ventricles) in a retrospective Belgian multi-center study (REMEMBER) comprising the entire AD continuum and cognitively healthy controls, to examine the utility of icobrain dm for AD for improving diagnostic accuracy in a real-world clinical setting. The secondary objective of this paper is to investigate if combined brain volumes contribute to establish or improve the accuracy of an AD diagnosis and can differentiate between different stages of the disease. Finally, to characterize icobrain dm’s validity, a comparison to the widely used automatic tool FreeSurfer (v.6.0) is performed.
MATERIALS AND METHODS
Study population and design
The ‘retrospective Belgian multi-center MRI biomarker study in dementia’ (REMEMBER) cohort comprises participants (n = 887) obtained from 8 memory clinics that are members of the Belgian Dementia Council (BeDeCo). Participants underwent a baseline brain MRI scan at date of inclusion, in combination with a clinical neurological and neuropsychological evaluation for diagnostic purposes. Patient classification was effectuated in compliance with the NIA-AA criteria for ‘MCI due to AD’ and ‘Dementia due to AD’ [9–13]. SCD patients were diagnosed according to the criteria of Jessen’s et al. (2014) [22]. Cognitively healthy controls were subjected to, at the minimum, a cognitive screening test to exclude cognitive deterioration and were required not to meet the criteria for SCD as formulated by Jessen et al. (2014) [22]. Level of education for each participant was defined as the number of years of school completed. Specific details regarding total population description and clinical diagnostic criteria have been previously published [16].
MRI acquisition and processing
Image acquisition
All MRI scans were obtained from the respective neuroimaging departments to which the patients were referred. Images from all scanner types were accepted. The MRI protocol advised to provide a 3D T1-weighted (T1w) image with a preferred voxel size of (1×1×1 mm) and an optional fluid-attenuated inversion recovery (FLAIR) sequence (not used in this study). Baseline brain MRI scans were available for all subjects. MRI acquisition came from the following scanner platforms: GE medical systems (1.5 T and 3.0 T), Philips (1.5 T and 3.0 T), and SIEMENS (1.5 T and 3.0 T). Detailed description on scanner field and model specifications can be found in Supplementary Table 1.
Image analysis
All participants underwent MR examinations, including a T1w MR sequence (slice thickness; mean (SD) 1.69 (±) 1.76). The cloud-based software icobrain dm (v.4.4.0) performed an automated brain imaging morphometry analysis, reporting volumes of whole brain (WB), gray matter (GM), white matter (WM), hippocampal total (HIP) volume, left hippocampus (HIP-L), right hippocampus (HIP-R), cortical GM volumes (CGM) of the temporal (TL), parietal (PL), occipital (OL), and frontal (FL) cortices. Brain volumes scaled for head size for both FreeSurfer and icobrain dm were adjusted to account for age and sex by using icobrain dm’s healthy reference population. The healthy population volumes were obtained from MR images of 1903 healthy subjects (1069 female and 834 male subjects) available from several public collections on which the icobrain software was applied [23]. For each brain structure, the age- and sex-matched median volume computed using icobrain dm’s healthy reference population was subtracted from the patient volume to obtain age- and sex-adjusted volumes.
Concisely, icobrain dm’s processing steps included skull stripping and voxel classification into brain or non-brain regions based on the affine registration of a Montreal Neurological Institute (MNI)-atlas brain mask, followed by matching GM, WM, and cerebrospinal fluid (CSF) probabilistic anatomical priors, also available as an MNI-atlas, to the T1w image. After bias field correction, the T1w image was segmented using a probabilistic model based on prior information from the preprocessing steps, into the three respective tissue classes: GM, WM, and CSF [24].
Cortical lobe segmentations. icobrain dm provides sub-segmentation of cortical lobes using an assembly of cortical labels available in MNI space. Through a non-rigid registration between the MNI template and the T1w image, the cortical labels (‘CGM labels”) were propagated to the patient’s image T1w space. A second non-rigid registration between the skeleton of the binarized propagated CGM labels and skeleton of the patient’s binarized cortical gray matter segmentation was used for further refinement. Lastly, CGM voxels were assigned as the cortical label matching the closest voxel in the skeleton of the non-rigidly propagated CGM labels [18].
Hippocampal segmentations. Multiple atlases containing anatomical priors (i.e., T1w templates containing hippocampal segmentations corresponding to the guidelines of the EADC-ADNI harmonized protocol [25]) for left and right hippocampi were registered to the T1w image by affine and non-rigid image transformations. The propagated segmentations were ranked according to their similarity to the input image, then combined into one probabilistic segmentation for each hippocampus (label fusion segmentation). For the final hippocampus segmentation, the probabilistic segmentation for each hippocampus was used as prior information in an intensity-based expectation maximizing (EM) algorithm with morphological level set refinement. As a post-processing step, voxels mainly considered as CSF by the main tissue segmentation were excluded from the hippocampus segmentation, to keep in line with the EADC-ADNI harmonized protocol, which agreed on excluding internal CSF pools from manual hippocampus segmentation.
All output volumes were adjusted for head size through normalization by intracranial volume, using the determinant of the affine transformation matrix describing the transformation between the image and the MNI atlas. The processing time for each individual cross-sectional analysis varied between 15 to 30 min, including an automatic quality control (QC) for approximately 7 min. icobrain dm analysis was carried out on a Linux server with 16 GB RAM and 8 CPU cores (Intel Xeon Platinum 8000).
FreeSurfer. The FreeSurfer image analysis suite (version 6.0) is well documented, freely available for download online (http://surfer.nmr.mgh.harvard.edu/) and has been thoroughly described elsewhere [26, 27]. In this paper, the recon-all stream with fully automated directive-all was used to reconstruct all brain volumes, including cortical and subcortical parcellations, processed with identical command and default parameters. Cortical labels corresponding to the frontal, temporal, and parietal gray matter regions were grouped to obtain volumes of the same three cortical lobe regions as for icobrain dm.
When reporting volumes normalized for head size, in order to obtain brain volumes in the same range as icobrain, a scaling of the FreeSurfer volumes [18] using the formula below was performed, where 1985.026 mL is the intracranial volume of the MNI template used in icobrain and ‘Estimated Total Intracranial Volume’ is the total intracranial volume reported by FreeSurfer. FreeSurfer was executed on a Linux server with 16 CPU cores (Intel Xeon Platinum 8000) and 64GB RAM. FreeSurfer required between 9 and 32 h per scan to complete, depending on the image quality and disease severity.
(1)
Quality control
A quality control of the extracted measurements was performed per center by M.W. Motion artefacts and technical parameters (including signal intensity, image artefacts, lesion contrast, tissue type volumes, noise, and field of view (FOV)) were examined through a visual assessment for all ‘outlier’ measurements. ‘Outliers’ were defined as samples having volumes below the 10th and above the 90th percentile within each center’s cohort. If the segmentation approach failed entirely, due to, e.g., low quality of scans or a large slice thickness (> 3 mm), this was reported as ‘Rejected’, resulting in the exclusion of all output values from downstream analyses. If the brain structures were partly segmented correctly and the WB volumetric analysis was trustworthy, it was reported as ‘Approved with remarks.’ Upon correct segmentation the scans were classified as ‘Approved’.
Statistical analysis
All statistical analyses were performed using the R-environment (R-Studio, v.1.0.136) for statistical computing and graphics [28, 29] using the following “packages” and (functions). Demographic information was explored for the baseline population and mean, standard deviation, median and interquartile range (where applicable) were reported (R package: “arsenal” (tableby and write2word)). Distribution of categorical variables within subject groups (e.g., sex) as well as demographic comparisons were analyzed by Chi-square tests (sex) and ANCOVA tests (age and sex-adjusted brain volume measures and other measurements). Significant differences between disease stages were evaluated using Post-hoc analysis with Tukey correction and p values were reported (R packages: “stats” (lm, anova, chisq.test) and “multcomp” (ghlt). MRI characteristics (slice thickness, voxel size, head coverage and contrast-to-noise ratio) were reported separately. Boxplots for each brain volume were computed and significant differences between groups from post-hoc analyses with Tukey correction were included (R packages: ‘ggstatsplot” (ggbetweenstats, geom_signif), “ggplot2” (scale_x_discrete), and “ggsave”).
Diagnostic performance
Prediction of disease stage was based upon logistic regression, using age and sex-adjusted brain volumes as a predictor. As binary outcome, consisting of all possible pairwise combinations of disease stages. Diagnostic performance of mentioned age and sex-adjusted brain volumes was evaluated using receiver operating characteristic (ROC) analysis, with the R package “pROC” (roc, auc, coords, ci) and the “stats” (predict) package [30]. Area under the curve (AUC), specificity and sensitivity values were documented for each of the binary classifications between disease stages (SCD versus HC, MCI versus HC, AD versus HC, AD versus SCD, and AD versus MCI). Specificity and sensitivity outcomes were calculated based on the combined smallest Euclidian distance, using the Youden index to determine the threshold for each pairwise classification between disease stages. In addition, for ADD versus HC, DeLong tests were used to investigate if the AUC’s of icobrain dm and FreeSurfer were significantly different for each individual brain structure [31].
To analyze if there was a difference in icobrain dm’s diagnostic performance regarding lower quality T1 MRI images, an additional exploratory analysis to assess the impact of slice thickness (ST) resolution in the classification of AD stages was performed. The subjects in this study were split into three groups according to T1 image resolution. Important to note here is that HC and SCD were classified as one group due to the small number of the low-resolution scans available in both groups. Pairwise comparisons were performed between AD stages, using a linear kernel support vector machine (SVM) model, over the high-resolution group (ST < 1 mm) as the training set, and by testing its performance over the middle (1 mm≤ST≤1.6 mm) and the low-resolution (> 1.6 mm) groups, referred to as the testing sets. The SVM was fitted using balanced AD stages data, obtained through minority class upsampling. The training set classification performance obtained in a 5-fold cross-validation fashion was also reported, as a reference performance.
Correlation between icobrain dm and FreeSurfer
The correlation between icobrain dm and FreeSurfer automated brain volumes was visualized and calculated using the “ggpubr” (ggscatter, ggqqplot) package, “stats” (shapiro.test, cor.test) package and Pearson’s correlation coefficient [32]. Linear mixed models were fitted to assess systematic bias between the two automated software tools. An anonymized patient identifier was included as a random effect to account for repeated measurements, while the automated software technique was included as a fixed effect. All brain structures were evaluated individually. A Bonferroni-corrected alpha level of 0.004 (0.05 / total number (n = 12) of brain structures) was applied for the fixed effect, testing the null hypothesis that there is no systematic difference in volume between the two automated segmentation tools. These analyses were carried out with R packages ‘lme4’ and ‘multcomp’.
Stepwise backward logistic regression
In order to improve our knowledge regarding which combination of brain volumes is most relevant and robust for differentiating the considered disease stage in the AD continuum, an exploratory multivariate ‘feature selection’ analysis was performed, with a top-down approach. To prevent suppressor effects (when predictors are only significant when another predictor is held constant, often seen in stepwise forward regression), a stepwise backward logistic regression model was applied (R package: “mass” (stepAIC), “stats” (predict, glm) and “pROC” (roc, auc, coords, ci)). The Akaike Information Criterion (AIC) was used to determine which combination of variables could best distinguish between different disease stages, while simultaneously gaining insight in which volumes were least informative. The AIC is a statistical criterion that functions as a trade-off between the goodness-of-fit and model complexity by estimating the appropriateness of different model inputs from a given dataset. The achievement of the lowest AIC was used as a stop criterion. To assess the robustness of the fitted models, we repeated the stepwise backward modelling using a different criterion, based upon p values. In brief, we started from the full model with all predictors. In each step the least significant predictor was removed, after which the model was refitted. This procedure was repeated until all remaining predictors were significant. The relative likelihood measure (REL.LL), representing the ratio of improvement in performance of the final model compared to the start model, was calculated using the following formula:
(2)
RESULTS
Initial study population
Based on the recruitment requirements, data from the following number of participants was collected; Cognitively healthy controls without cognitive complaints (recruited among spouses of patients) (HC; n = 93), subjects with subjective cognitive decline (SCD, n = 102), mild cognitive impairment (n = 379), and AD dementia patients (ADD, n = 313). From this initial cohort, the image processing of 67 participants experienced difficulties leading to an interruption of the FreeSurfer pipeline. We hypothesize that these errors might be due to a variety of issues such as large slice thickness (> 1.6 mm) and voxel sizes, an incomplete FOV, as well as the possible presence of white matter lesions, while performing topology corrections. icobrain dm was able to process all 67 MRI scans from these participants, without the run-time being affected. To obtain an equal number of participants for both automated tools, these were not used for downstream comparative analysis for neither icobrain dm nor FreeSurfer. The new study cohort included HC (n = 90), SCD (n = 93), MCI (n = 357), and ADD patients (n = 280), and represented a total of 820 subjects (Table 1). Magnetic resonance imaging parameters, including slice thickness, voxel size, contrast-to-noise (CNR) ratio, and head coverage are presented in Table 2. Incomplete head coverage, or limited field of view, is computed as the percentage of scans for which at least one of the six sides of the bounding box surrounding an ‘ideal’ brain mask falls outside the FOV of the patient’s T1 image, where the ‘ideal’ brain mask is obtained from the MNI template image, through affine registration to the patient’s T1 image.
Table 1
REMEMBER study cohort
| HC | SCD | MCI | ADD | Total | |
| Center 1 | 44 | 38 | 51 | 86 | 295 |
| Center 2 | 2 | 76 | 14 | 29 | |
| Center 3 | 32 | 13 | 14 | 89 | |
| Center 4 | 43 | 54 | 54 | ||
| Center 5 | 26 | 17 | 38 | 81 | |
| Center 6 | 2 | 96 | 65 | 163 | |
| Center 7 | 20 | 40 | 39 | 99 | |
| Center 8 | 2 | 8 | 10 | ||
| STUDY COHORT | 90 | 93 | 357 | 280 | 820 |
| Complete rejection post – QC | 1 | 4 | 36 | 30 | 71 |
| WB volumes – approved | 89 | 89 | 321 | 250 | 749 |
| All volumes – approved | 88 | 88 | 317 | 204 | 697 |
Number of subjects per disease stage (cognitively healthy control (HC), subjective cognitive decline (SCD), mild cognitive impairment (MCI) and Alzheimer’s disease dementia (ADD) patients) for each participating center. Study cohort and approved volumes (only whole brain (WB) and all volumes) after quality control (post-QC) are highlighted in bold.
Table 2
Magnetic resonance imaging T1-weighted image parameters
| Parameters | HC | SCD | MCI | ADD | Total |
| (n = 90) | (n = 93) | (n = 357) | (n = 280) | (n = 820) | |
| Slice thickness, Mean (SD) | 1.00 (0.02) | 1.33 (1.16) | 1.78 (1.89) | 1.92 (1.97) | 1.69 (1.76) |
| Contrast-to-noise CNR, Mean (SD) | 3.18 (0.33) | 3.29 (0.47) | 2.96 (0.52) | 2.83 (0.53) | 2.98 (0.52) |
| Voxel size, Mean (SD) | 0.86 (0.22) | 0.89 (0.68) | 1.02 (0.77) | 1.15 (0.82) | 1.03 (0.74) |
| Incomplete head coverage (% scans with incomplete FOV) | 25.6 | 47.3 | 43.1 | 35.0 | 38.9 |
Magnetic resonance imaging T1-weighted image parameters per disease stage (cognitively healthy control (HC), subjective cognitive decline (SCD), mild cognitive impairment (MCI), and Alzheimer’s disease dementia (ADD) patients).
The exploratory analysis on icobrain dm’s diagnostic performance regarding variable quality T1 MRI images, to assess the impact of slice thickness resolution in the classification of AD stages, showed a drop in sensitivity in the low-resolution group, compared to the middle and high resolutions for all pairwise comparisons. Specificity remained rather constant for all comparisons. The results of this exploratory analysis can be found in Supplementary Table 2, Supplementary Table 3, and Supplementary Figure 1.
Quality control
In total, 697 scans (85.0%) were approved after QC and all volumes (WB, GM, WM, CSF, CGM TOT, FL, TL, PL, OL, HIP, LVENT, left hippocampus (HIP-L) and right hippocampus (HIP-R)) were included for further analyses (Table 4, for all volumes). Subjects where smaller brain regions were not correctly segmented, but WB volumes were still accurate, were also included. Subsequently, for whole brain volume analysis, a total of 749 (91.3%) MRI scans were approved after QC (Table 3, for whole brain volumes). Seventy-one scans were completely excluded for analysis. Differences in numbers of approved scans result from volume mis-segmentation due to low scan quality (e.g., low GM-WM contrast) or large slice thickness (> 3 mm).
Table 3
REMEMBER baseline population clinical and demographic characteristics – icobrain dm - whole brain volumes approved
| HC | SCD | MCI | ADD | Total | p | |
| (N = 89) | (N = 89) | (N = 350) | (N = 250) | (N = 749) | ||
| Sex (% F) | 0.013 | |||||
| F | 47 (52.8%) | 46 (51.7%) | 160 (49.8%) | 158 (63.2%) | 411 (54.9%) | |
| Age at BL (y) | < 0.001 | |||||
| Mean (SD) | 67.3 (8.6) ∧∧∧, # # # | 68.8 (10.0) ∧∧∧, # # # | 74.6 (7.9) ***, +++ | 77.1 (8.4) ***, +++ | 73.9 (9.1) | |
| MMSE from 0 to 30 | < 0.001 | |||||
| N | 69 | 84 | 306 | 241 | 700 | |
| Mean (SD) | 29 (1) ∧∧∧, # # # | 29 (1) ∧∧∧, # # # | 25 (3) ***, +++, # # # | 21 (5) ***, +++, ∧∧∧ | 24 (5) | |
| Time between BL MRI and BL NPE (mo) | 0.254 | |||||
| Mean (SD) | 1.07 (1.1) | 3.6 (6.7) | 2.7 (4.6) | 3.8 (9.4) | 3.2 (6.9) | |
| Education (y) | < 0.001 | |||||
| N | 57 | 82 | 299 | 222 | 660 | |
| Mean (SD) | 14.9 (3.9) ∧∧, # # # | 15.3 (4.2) ∧∧∧, # # # | 13.0 (4.1) **, +++, # # # | 11.0 (4.0) ***, ∧∧∧, # # # | 12.8 (4.3) | |
| WB –whole brain (mL) | < 0.001 | |||||
| Mean (SD) | 1478.4 (74.1) ∧∧∧, # # # | 1441.4 (81.9) ∧∧∧, # # # | 1399.1 (68.7) ***, +++, # # | 1380.1 (74.0) ***, +++, ∧∧ | 1407.2 (79.4) |
Description of the data as percentage and mean ± standard deviation (SD). Analysis and post-hoc analysis with Tukey correction (significance between disease stages (cognitively healthy controls (HC), subjective cognitive decline (SCD), mild cognitive impairment (MCI), and Alzheimer’s disease dementia (ADD) patients): Chi-square test (categorical variables; sex), ANCOVA analysis (continuous variables; Age at BL (Post-hoc p values: SCD-HC; ADD-MCI: NS, remaining disease stages: < 0.0001), MMSE score (Post-hoc p values: SCD-HC: NS, remaining disease stages: < 0.001), time between baseline MRI, and baseline NPE visit (Post-hoc p values for all disease stage comparisons: NS), Years of education (YOE) (Post-hoc p values: SCD-HC: NS, MCI-HC: < 0.01, remaining disease stages: < 0.001), Brain volumes normalized for head size (Post-hoc p values: Whole brain (WB) SCD-HC: NS, ADD-MCI: < 0.05, remaining disease stages: < 0.001)). Symbols: versus HC *< 0.05, **< 0.01, ***< 0.001, versus SCD +< 0.05, ++< 0.01, +++< 0.001, versus MCI ∧< 0.05, ∧∧< 0.001, ∧∧∧< 0.0001, versus ADD #< 0.01, # #< 0.01, # # #< 0.001. BL, baseline; NPE, neuropsychological examination.
Table 4
REMEMBER baseline population clinical and demographic characteristics – icobrain dm - all volumes approved
| HC | SCD | MCI | ADD | Total | p | |
| (N = 88) | (N = 88) | (N = 317) | (N = 204) | (N = 697) | ||
| Sex (% F) | 0.029 | |||||
| F | 46 (52.3%) | 46 (52.3%) | 159 (50.2%) | 129 (63.2%) | 380 (54.5%) | |
| Age at BL (y) | < 0.001 | |||||
| Mean (SD) | 67.3 (8.7) ∧∧∧, # # # | 69.0 (10.1)∧∧∧, # # # | 74.7 (7.9) ***, +++, # # # | 76.0 (8.4) ***, +++, ∧∧∧ | 73.4 (9.0) | |
| MMSE from 0 to 30 | < 0.001 | |||||
| N | 69 | 83 | 302 | 196 | 650 | |
| Mean (SD) | 29 (1) ∧∧∧, # # # | 29 (1) ∧∧∧, # # # | 25 (3) ***, +++, # # # | 20 (5) ***, +++, ∧∧∧ | 25 (5) | |
| Time between BL MRI and BL NPE (mo) | 0.136 | |||||
| Mean (SD) | 1.1 (1.1) | 3.7 (6.8) | 2.7 (4.6) | 4.2 (10.2) | 3.3 (7.1) | |
| Education (y) | < 0.001 | |||||
| N | 56 | 81 | 296 | 177 | 610 | |
| Mean (SD) | 14.9 (3.9) ∧∧, # # # | 15.2 (4.2) ∧∧∧, # # # | 13.0 (4.1) **, +++, # # # | 11.2 (4.0) ***, ∧∧∧, # # # | 12.7 (4.3) | |
| GM –gray matter (mL) | < 0.001 | |||||
| Mean (SD) | 852.2 (44.1) ∧∧∧, # # # | 830.7 (59.0) ∧, # # # | 784.2 (63.5) ***, +, # # # | 784.1 (63.5) ***, +++, ∧∧∧ | 806.9 (61.7) | |
| WM –white matter (mL) | 0.011 | |||||
| Mean (SD) | 625.6 (59.5) | 610.5 (55.6) | 596.2 (67.1) | 597.7 (72.9) | 602.1 (67.3) | |
| CGM –cortical gray matter (mL) | < 0.001 | |||||
| Mean (SD) | 808.5 (43.4) ∧∧∧, # # # | 789.6 (58.5) ∧∧, # # # | 764.2 (53.7) ***, ++, # # # | 749.9 (60.7) ***, +++, ∧∧∧ | 768.8 (58.5) | |
| FL –frontal cortex (mL) | < 0.001 | |||||
| Mean (SD) | 216.1 (17.1) ∧∧∧, # # # | 214.0 (22.7) ∧, # # # | 200.0 (23.1) ***, + | 195.8 (22.3) ***, +++ | 202.6 (23.3) | |
| PL –parietal cortex (mL) | < 0.001 | |||||
| Mean (SD) | 139.5 (12.7) ∧∧∧, # # # | 134.2 (15.5) ∧∧∧, # # # | 127.4 (14.3) ***, +++, # # # | 122.0 (15.9) ***, +++, ∧∧∧ | 128.2 (15.8) | |
| OL –occipital cortex (mL) | 0.039 | |||||
| Mean (SD) | 63.0 (10.9) | 59.0 (7.7) | 59.3 (11.3) | 59.9 (12.4) | 59.9 (11.2) | |
| TL –temporal cortex (mL) | < 0.001 | |||||
| Mean (SD) | 149.1 (10.3) ∧∧∧, # # # | 145.6 (14.2) ∧∧∧, # # # | 136.7 (12.0) ***, +++, # # # | 130.6 (14.8) ***, +++, ∧∧∧ | 137.6 (14.4) | |
| HIP –hippocampus, total (mL) | < 0.001 | |||||
| Mean (SD) | 9.2 (0.8) ∧∧∧, # # # | 8.8 (0.9) ∧∧∧, # # # | 8.1 (1.1) ***, +++, # # # | 7.5 (1.3) ***, +++, ∧∧∧ | 8.1 (1.2) | |
| HIP-L –left hippocampus (mL) | < 0.001 | |||||
| Mean (SD) | 4.5 (0.4) ∧∧∧, # # # | 4.4 (0.4) ∧∧∧, # # # | 4.0 (0.6) ***, +++, # # # | 3.7 (0.7) ***, +++, ∧∧∧ | 4.0 (0.6) | |
| HIP-R –right hippocampus (mL) | < 0.001 | |||||
| Mean (SD) | 4.7 (0.4) ∧∧∧, # # # | 4.5 (0.5) ∧∧∧, # # # | 4.1 (0.6) ***, +++, # # # | 3.8 (0.7) ***, +++, ∧∧∧ | 4.1 (0.7) | |
| LVENT –lateral ventricles (mL) | < 0.001 | |||||
| Mean (SD) | 43.3 (21.9) ∧∧, # # | 51.3 (25.6) ∧∧, # # # | 64.3 (28.0) ***, ++, # | 73.7 (29.0) ***, +++, ∧ | 62.7 (29.0) |
Description of the data as percentage and mean ± standard deviation (SD). Analysis: Chi-square test (categorical variables; sex), ANCOVA and Post-hoc analysis with Tukey correction (significance between disease stages (cognitively healthy control (HC), subjective cognitive decline (SCD), mild cognitive impairment (MCI), and Alzheimer’s disease dementia (ADD) patients): (continuous variables; MMSE score (p values: SCD-HC: NS, remaining disease stages: < 0.0001), age at baseline (p values: SCD-HC; ADD-MCI: NS, remaining disease stages: < 0.0001), time between baseline MRI and baseline NPE (Post-hoc p values for all disease stages: NS), Education (y): SCD-HC: NS, MCI-HC: < 0.01, remaining disease stages: < 0.001. Brain volumes normalized for head size (Post-hoc p values: Gray matter (GM) SCD-HC: NS, MCI-SCD: < 0.05, remaining disease stages: < 0.001. White matter (WM): NS. Cortical gray matter (CGM) SCD-HC: NS, MCI-SCD: < 0.01, remaining disease stages < 0.001. Frontal cortex (FL) SCD-HC; ADD-MCI: NS, MCI-SCD: < 0.05, remaining disease stages; < 0.001. Parietal cortex (PL) SCD-HC: NS, remaining disease stages: < 0.001. Occipital cortex (OL) MCI-HC: < 0.05, remaining disease stages: NS. Temporal cortex (TL): SCD-HC: NS, remaining disease stages: < 0.0001. Hippocampus (HIP) SCD-HC: NS, remaining disease stages: < 0.0001). Left hippocampus (HIP-L) SCD-HC: NS, remaining disease stages: < 0.001. Right hippocampus (HIP-R) SCD-HC: NS, remaining disease stages: < 0.001. Lateral ventricles (LVENT) SCD-HC: NS, ADD-MCI: < 0.05, MCI-SCD: < 0.01, remaining groups: < 0.001)). Symbols: versus HC *< 0.05, **< 0.01, ***< 0.001, versus SCD +< 0.05, ++< 0.01, +++< 0.001, versus MCI ∧< 0.05, ∧∧< 0.01, ∧∧∧< 0.001, versus ADD #< 0.05, # #< 0.01, # # #< 0.001. NS, not significant; BL, baseline; NPE, neuropsychological examination.
Final study population
The clinical and demographic characteristics of the final study population are presented in Tables 3 and 4. Mini-Mental State Examination (MMSE) scores decreased with disease severity, with a significant difference between all groups, except when comparing cognitively healthy controls with SCD subjects. Mean age increased with disease severity but was not significantly different between cognitively healthy controls and SCD subjects (all volumes: p = 0.629, whole brain volumes: p = 0.544) nor between MCI and ADD patients for the approved whole brain volumes (p = 0.286). The time interval between the neuropsychological evaluation and the baseline MRI scan was approximately three months for most participants (all volumes: mean [IQR] 3.2 [0.5–3.0] months, whole brain volumes: mean [IQR] 3.3 [0.5–3.0] months). The level of education was significantly higher for HC and SCD subjects in comparison with the MCI and AD patients.
Normalized brain volumes obtained with icobrain dm
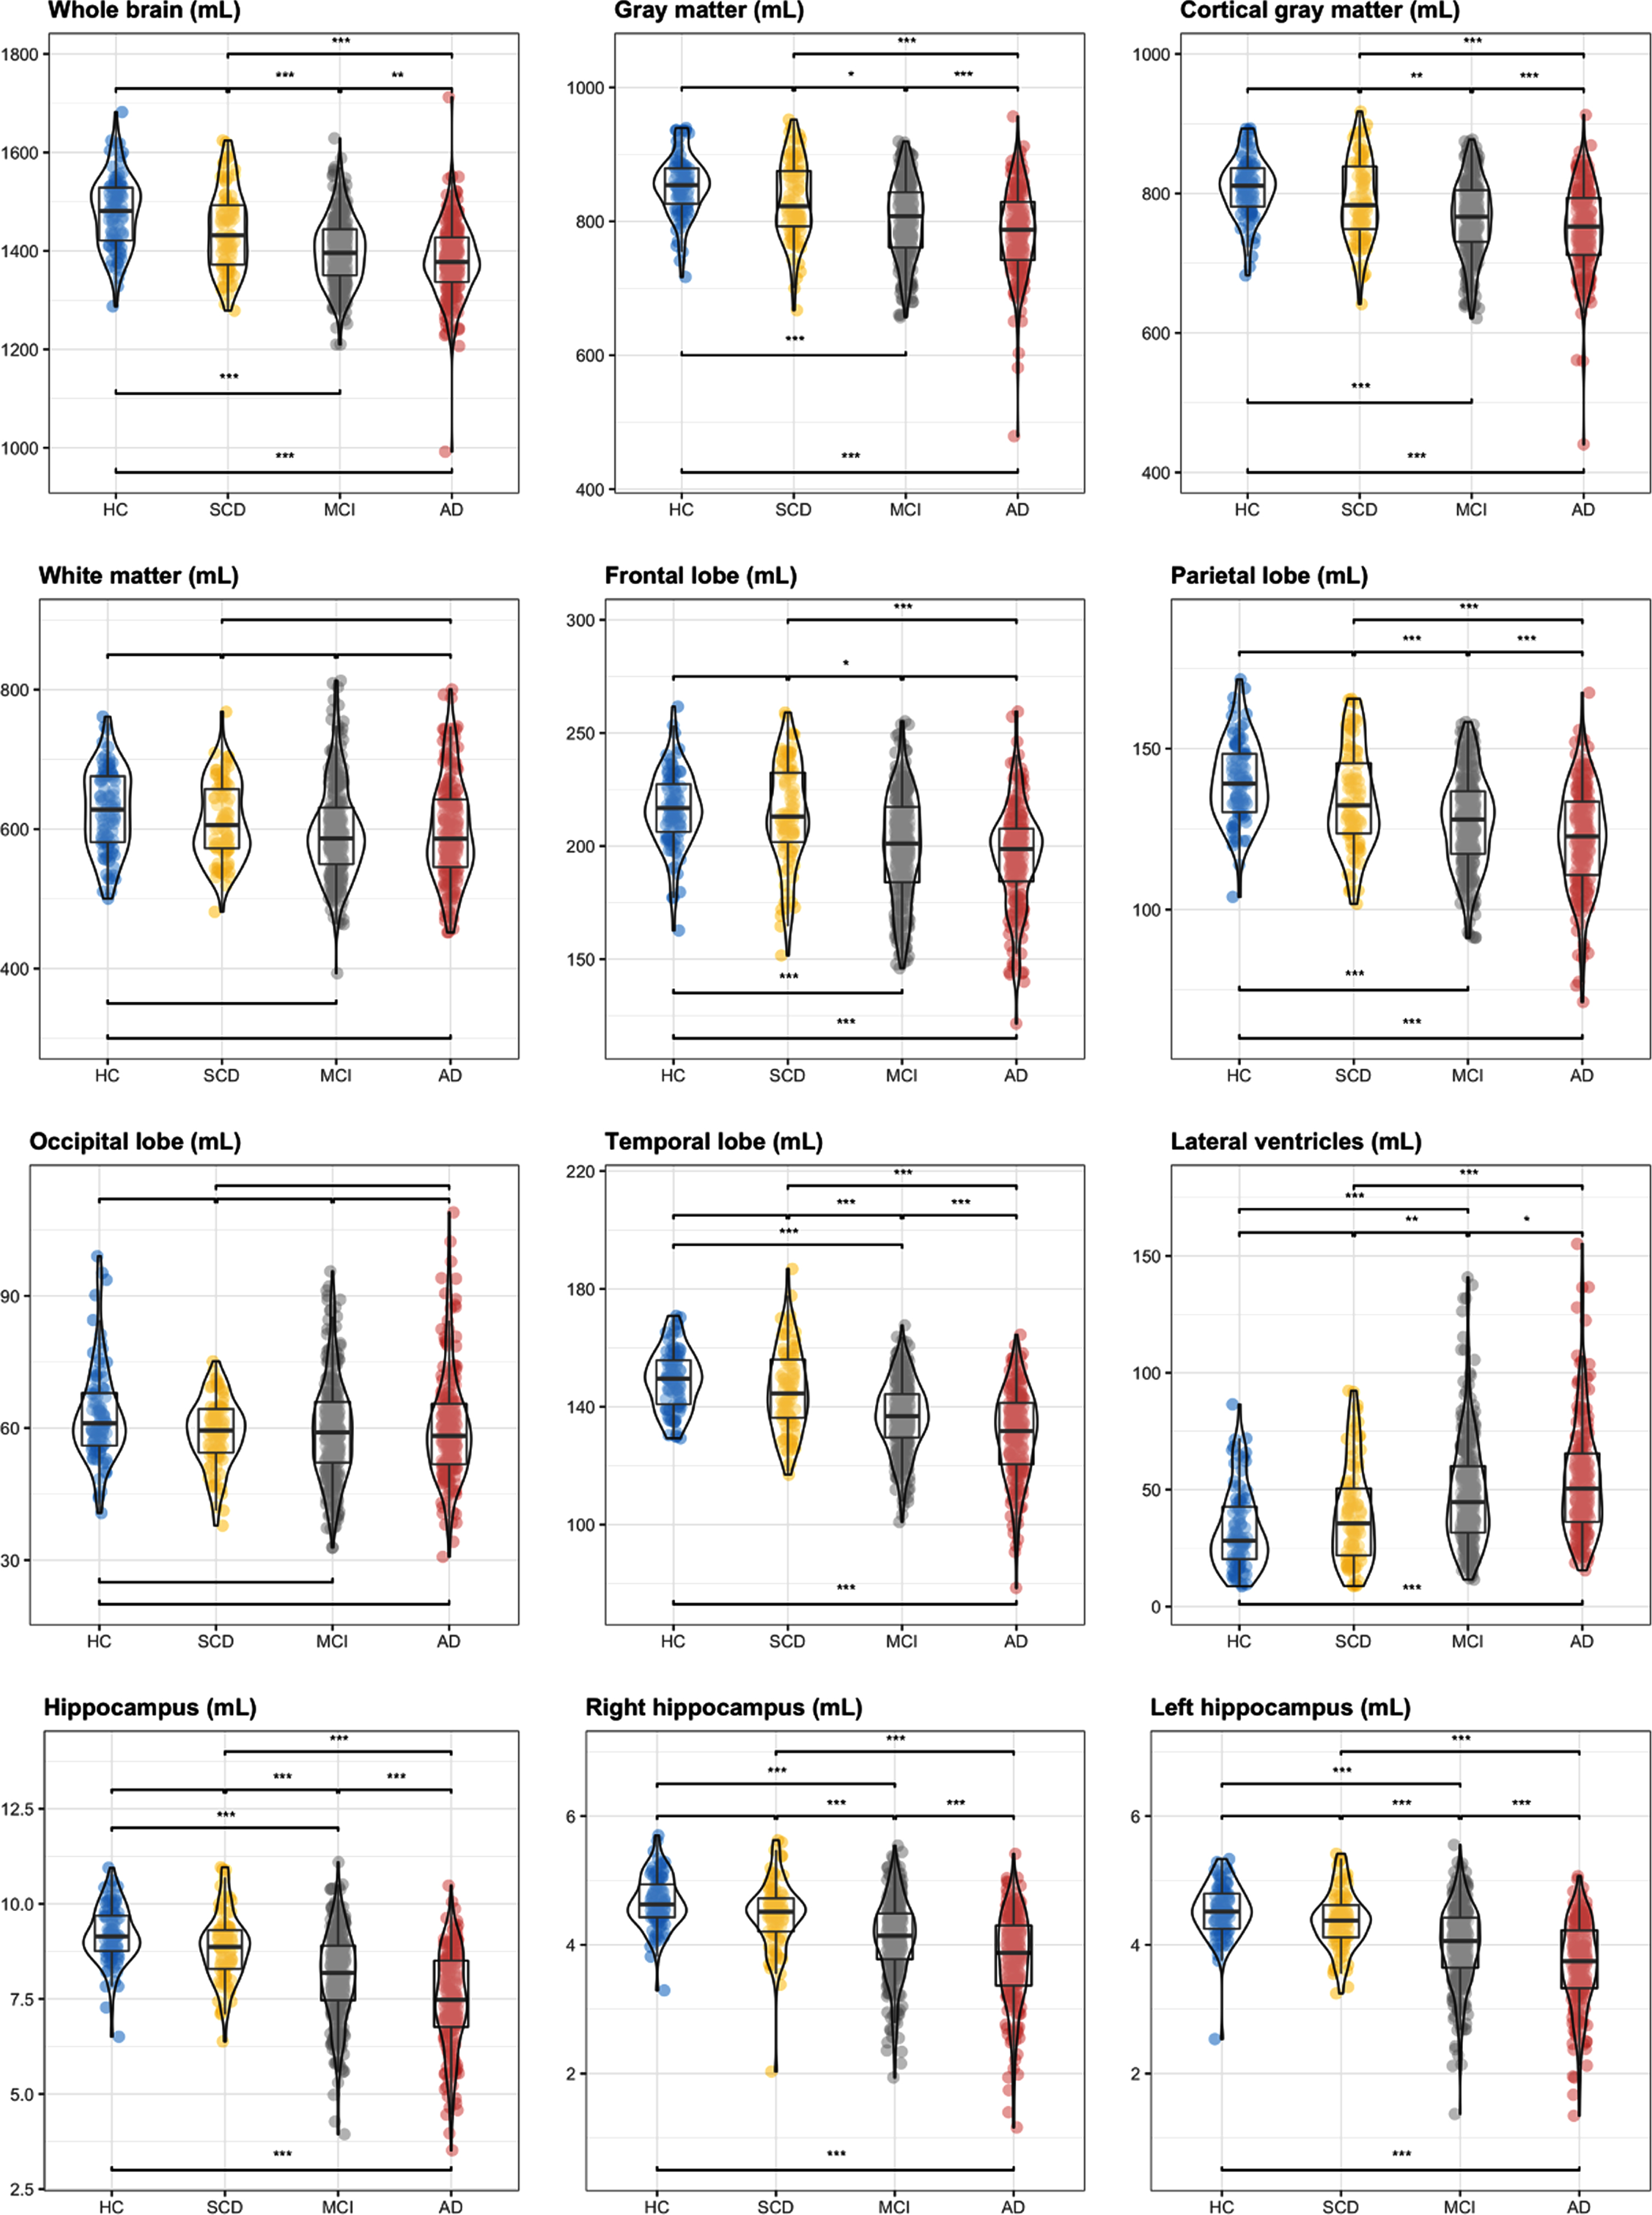
Brain volumes normalized for head size are presented in Table 3 (approved whole brain volumes) and Table 4 (all volumes approved). Whole brain, gray matter, cortical gray matter, temporal cortex, parietal cortex, lateral ventricles, and hippocampal volumes were significantly different between all disease stages, except for HC versus SCD subjects. For the frontal cortex, the difference between HC and SCD subjects, as well as between MCI and ADD patients, was not significant, while white matter and occipital cortex volumes showed no significant difference between any of the disease stages (Fig. 1).
Fig. 1
Violin boxplots per brain region –icobrain dm. Differences between groups reported using post-hoc analysis (“Tukey” correction) for normalized brain volumes. p values: 0 ‘***’< 0.001 ‘**’< 0.01 ‘*’< 0.05. The absence of a notation corresponds to a non-significant value. p values are presented in Tables 3 and 4. HC, cognitively healthy controls; SCD, subjective cognitive decline; MCI, mild cognitive impairment; ADD, Alzheimer’s disease dementia.
Correlation between icobrain dm and FreeSurfer
The correlations between icobrain dm and FreeSurfer brain volumes were all statistically significant and are fully reported in Supplementary Figure 2. The highest correlation was found between gray matter volumes (r= 0.81, p < 0.0001) and lateral ventricles (r= 0.95, p < 0.0001), while the hippocampal volumes showed the lowest correlation (HIP, r= 0.64, p < 0.0001; HIP-R, r= 0.58, p < 0.0001; HIP-L, r= 0.64, p < 0.0001). Linear mixed modelling revealed systematic differences between the automated software types across all brain structure volumes. Whole brain, white matter and hippocampal volumes showed higher estimates for FreeSurfer compared to icobrain dm, while the opposite was observed for gray matter, cortical gray matter, frontal, parietal, temporal, and occipital cortices, as well as for lateral ventricles. Detailed results are fully reported in Supplementary Table 4.
Diagnostic performance of icobrain dm as compared to FreeSurfer
Diagnostic performance of icobrain dm was evaluated between the following disease stages using ROC analysis (as described in the Methods section); HC, SCD, MCI, and ADD patients (Supplementary Table 5, Fig. 1). The age- and sex-adjusted volumes of the icobrain dm automated volumetry that showed the largest AUC to distinguish ADD patients from HC were the whole brain (AUC = 0.749), temporal cortex (AUC = 0.790), hippocampal volumes (HIP, AUC = 0.871; HIP-R, AUC = 0.862; HIP-L, AUC = 0.849), and lateral ventricles (AUC = 0.763) (Table 5). White matter (AUC = 0.562) and occipital cortex (AUC = 0.464) volumes were not able to distinguish between the different disease stages. The diagnostic performance of FreeSurfer is also shown in Table 5 (ADD versus HC), Supplementary Table 6 (all pairwise group classifications) and visually in Supplementary Figure 3. FreeSurfer obtained the highest AUCs for the temporal cortex (AUC = 0.759), total hippocampal volume (AUC = 0.711), right hippocampus (AUC = 0.732), and lateral ventricles (AUC = 0.733). Whole brain (AUC = 0.564), white matter (AUC = 0.486), and occipital lobe (AUC = 0.557) volumes were not able to distinguish between the different disease stages. When looking at ADD versus HC, icobrain dm significantly outperformed FreeSurfer for whole brain (p≤0.001), white matter (p = 0.018), hippocampal volumes (p≤0.001), and lateral ventricles (p≤0.001). Temporal, frontal, and parietal cortices reported a higher diagnostic performance for icobrain dm as well, but this was not significantly different.
Table 5
Diagnostic performance of ADD versus HC calculated with icobrain dm and FreeSurfer
| icobrain dm | FreeSurfer | p | |||||
| AUC | Specificity (%) | Sensitivity (%) | AUC | Specificity (%) | Sensitivity (%) | ||
| Whole brain | 0.749 | 65.2 | 75.6 | 0.564 | 83.1 | 45.6 | < 0.001* |
| Gray matter | 0.726 | 86.4 | 57.4 | 0.705 | 73.9 | 63.7 | 0.550 |
| Cortical gray matter | 0.686 | 89.8 | 49.0 | 0.695 | 86.4 | 49.5 | 0.788 |
| White matter | 0.562 | 75.0 | 44.1 | 0.486 | 92.0 | 23.0 | 0.018* |
| Frontal cortex | 0.685 | 82.9 | 51.5 | 0.637 | 88.6 | 35.8 | 0.176 |
| Parietal cortex | 0.725 | 88.6 | 50.0 | 0.670 | 81.8 | 52.9 | 0.086 |
| Occipital cortex | 0.464 | 70.4 | 32.8 | 0.557 | 78.5 | 35.3 | 0.126 |
| Temporal cortex | 0.790 | 65.9 | 78.0 | 0.759 | 76.1 | 70.1 | 0.298 |
| Hippocampus | 0.871 | 89.8 | 72.5 | 0.711 | 87.5 | 56.9 | < 0.001* |
| Hippocampus, left | 0.849 | 97.7 | 58.3 | 0.696 | 87.5 | 54.9 | < 0.001* |
| Hippocampus, right | 0.862 | 84.1 | 75.5 | 0.732 | 89.8 | 55.9 | < 0.001* |
| Lateral ventricles | 0.763 | 65.9 | 77.4 | 0.733 | 65.9 | 71.6 | < 0.001* |
Brain volumes were age- and sex-adjusted and normalized for head size. Area under the curve (AUC), specificity (%) and sensitivity (%) values were reported. Specificity and sensitivity outcomes were calculated based on the combined smallest Euclidian distance, using the Youden index to determine the threshold. The highest AUC value when comparing both automated tools is highlighted in bold. p values to visualize the difference between icobrain dm’s AUC and FreeSurfers’ AUC were calculated with DeLong tests with a significance level of 0.05. *p values < 0.05.
Combining different brain volumes improves AD diagnosis
A stepwise backward logistic regression model was used to evaluate which combinations of individual brain volumes achieved the best results regarding diagnostic performance, aiming to find the most stable model while minimizing the number of indicators. Two different algorithms for stepwise backward elimination (as described in the Methods section), resulted in the same final model. Total hippocampal volume was excluded from analysis based on complete multi-collinearity with the presence of the individual hippocampal volumes (HIP-L and HIP-R). In addition, white matter volumes and occipital cortex were excluded from further analysis to avoid overfitting and on account of their minimal differential contribution in the diagnostic performance of the individual brain structures. The AIC, Δ-AIC, and REL.LL are presented in Table 6 (icobrain dm) and Supplementary Table 7 (FreeSurfer). The individual contribution (in terms of AIC difference) of separate brain volumes to the final model can be found in Supplementary Table 8 (icobrain dm) and Supplementary Table 9 (FreeSurfer) for all pairwise group classifications.
Table 6
Stepwise backward regression model –icobrain dm for age- and sex-adjusted brain volumes normalized for head size
| icobrain dm | |||||||||
| Disease Stages | Final Brain Structures | AIC | Δ-AIC | rel.LL | Youden Index | Threshold | Specificity (%) | Sensitivity (%) | AUC |
| SCD versus HC | WB, FL, PL, and HIP-R | 233.7 | 5.35 | 0.04 | 0.213 | 0.564 | 81.8 | 53.4 | 0.689 |
| McI versus HC | WB, PL, TL, and HIP-R | 342.4 | 4.13 | 0.13 | 0.507 | 0.753 | 75.0 | 75.7 | 0.809 |
| ADD versus HC | WB, PL, HIP-R, HIP-L, and LVENT | 215.4 | 3.05 | 0.22 | 0.692 | 0.620 | 83.0 | 86.3 | 0.914 |
| MCI versus SCD | FL, TL, and HIP-L | 397.0 | 5.24 | 0.07 | 0.692 | 0.829 | 84.1 | 48.9 | 0.691 |
| ADD versus SCD | FL, TL, HIP-R, and HIP-L | 276.5 | 2.98 | 0.23 | 0.560 | 0.673 | 79.5 | 76.4 | 0.831 |
| ADD versus MCI | PL, HIP-R, HIP-L, and LVENT | 661.0 | 3.33 | 0.19 | 0.301 | 0.360 | 58.0 | 72.1 | 0.670 |
Input brain volumes: whole brain (WB), frontal cortex (FL), parietal cortex (PL), temporal cortex (TL), lateral ventricles (LVENT), left hippocampus (HIP-L), and right hippocampus (HIP-R). Disease stages: HC, cognitively healthy controls; SCD, subjective cognitive decline; MCI, mild cognitive impairment; ADD, Alzheimer’s disease dementia. AIC, Akaike Information Criterion; Δ-AIC, Difference between the AIC of the full model (input brain volumes) and the final model (brain volume model with the lowest AIC); REL.LL, relative likelihood measure; AUC, Area under the curve, specificity (%), and sensitivity (%) values were reported. Specificity and sensitivity outcomes are presented as percentages and were calculated based on the combined smallest Euclidian distance, using the Youden index to determine the threshold. Brain structures highlighted in bold are present in the final models of both automated volumetric tools.
icobrain dm (Table 6, Fig. 2)
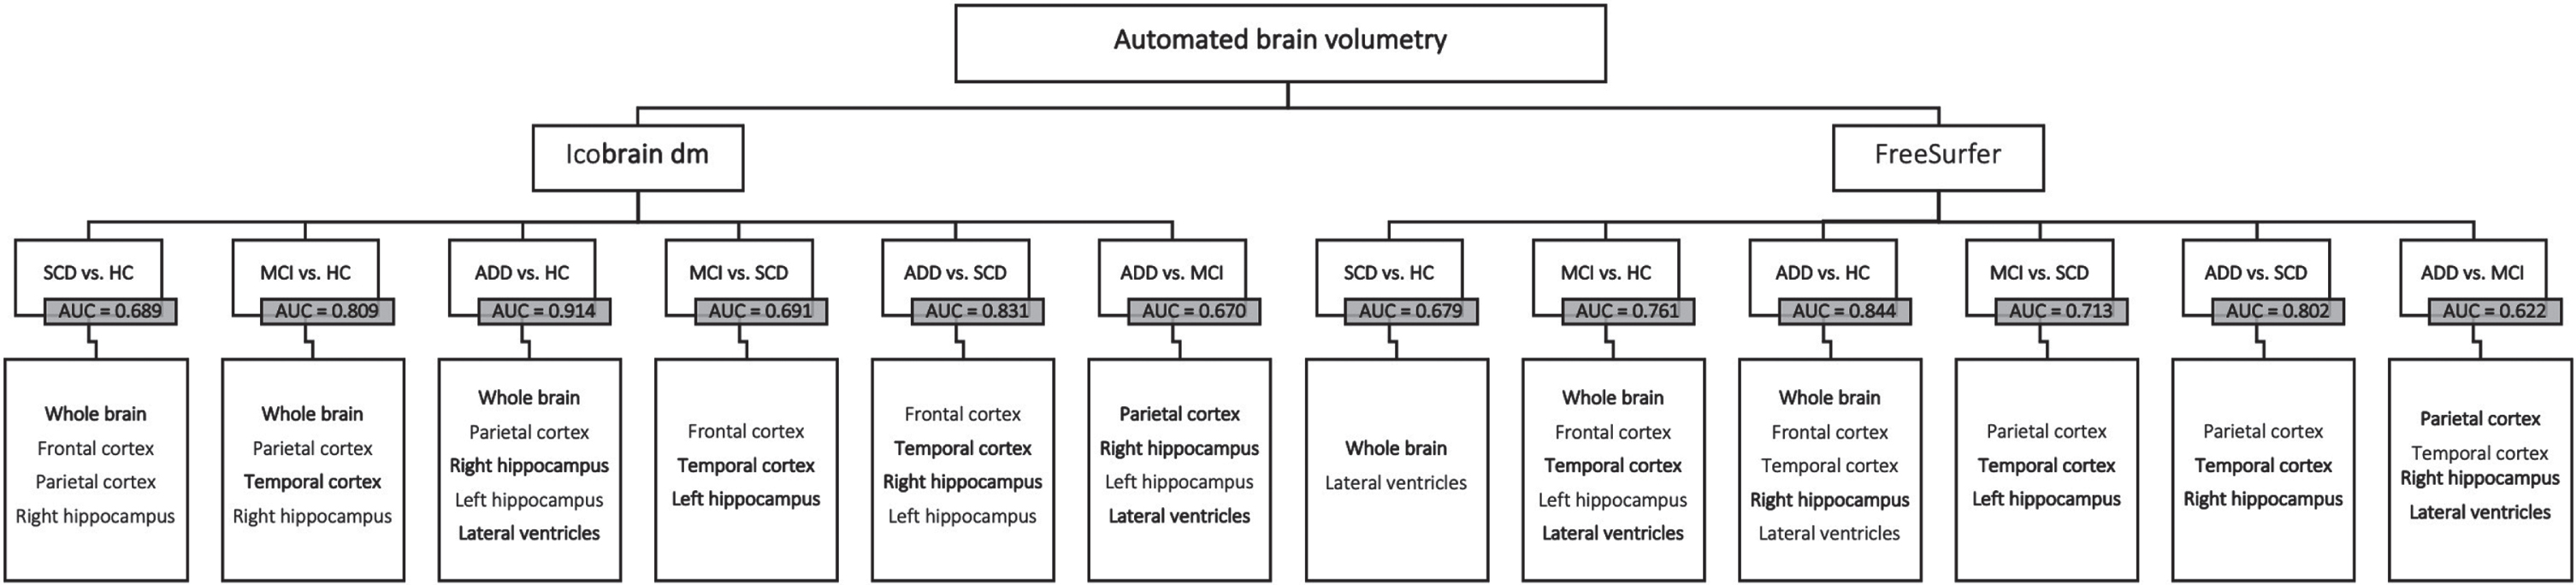
For SCD-HC (AUC = 0.689), whole brain, frontal cortex, parietal cortex, and right hippocampus contributed to the differentiation between the groups. The model for the MCI-HC differentiation (AUC = 0.809) showed that whole brain, parietal and temporal cortices, and right hippocampus together provided the most information to distinguish between the disease stages. For differentiating between ADD and HC patients (AUC = 0.914), whole brain, parietal cortex, as well as both hippocampal volumes (HIP-L and HIP-R), and lateral ventricles, each provided additional information to improve diagnostic performance. Variables to differentiate the MCI-SCD subjects (AUC = 0.691) included frontal and temporal cortices, and the left hippocampus. The model for the ADD-SCD group comparison (AUC = 0.831) consisted of frontal cortex, temporal cortex, and both hippocampal volumes. Finally, for the ADD-MCI group comparison (AUC = 0.670), it was the parietal cortex, both hippocampal volumes and lateral ventricles that contributed the most to the discrimination. A comparison between the AUC values from the stepwise logistic regression model and the diagnostic performance of the individual brain volumes computed by icobrain dm, shows that combining different brain volumes can improve AD diagnosis.
Fig. 2
Stepwise backward regression flowchart –icobrain dm and FreeSurfer. Final brain structures per pairwise comparison for icobrain dm (left) and FreeSurfer (right). AUC, area under the curve. Brain structures highlighted in bold are present in the final models of both automated volumetric tools. HC, cognitively healthy controls; SCD, subjective cognitive decline; MCI, mild cognitive impairment; ADD, Alzheimer’s disease dementia.
FreeSurfer (Supplementary Table 7, Fig. 2)
For the separation between SCD-HC (AUC = 0.679), whole brain and lateral ventricles contributed the most in the final model. The model for the MCI-HC group (AUC = 0.761) showed that whole brain, frontal and temporal cortices, the left hippocampus and the lateral ventricles together provided the most information to distinguish between the disease stages. For differentiating between ADD and HC patients (AUC = 0.844), whole brain, frontal, and temporal cortices as well as the right hippocampus and lateral ventricles, each provided additional information to improve the diagnostic performance. The model for the MCI-SCD group (AUC = 0.713) included parietal cortex, temporal cortex, and the left hippocampus. Variables to distinguish the ADD-SCD groups (AUC = 0.802) consisted of parietal cortex, temporal cortex, and the right hippocampus. Finally, for the ADD-MCI group (AUC = 0.622), parietal and temporal cortices, right hippocampus, and lateral ventricles each contributed to the improvement of diagnostic performance. As seen with icobrain dm, combining different brain volumes led to a higher diagnostic performance for distinguishing between disease stages, compared to the AUC values of the individual brain segmentations.
DISCUSSION
In this study we examined the diagnostic utility of icobrain dm in a real-world clinical setting, including a head-to-head comparison with the widely used FreeSurfer software. In addition, we performed an exploratory stepwise backward logistic regression analysis to assess if combined brain structures would improve diagnostic accuracy in the AD continuum. This study showed the robustness (no software crash nor unrealistic segmentations) of icobrain dm, considering the data heterogeneity. In addition, it served as a real-world validation for previously published research cohort data on icobrain dm’s diagnostic performance [18].
The most notable difference between icobrain dm and FreeSurfer was seen when looking at the whole brain volumes, where icobrain dm showed a highly significant difference between HC and ADD patients, whereas FreeSurfer could not distinguish well between the disease stages. One possible reason for this could be the large percentage of T1w MRI sequences that suffered from incomplete head coverage, which might have affected FreeSurfer’s whole brain volume output. Differences between the outcomes of icobrain dm and FreeSurfer for whole brain volumes might be caused by the fact that icobrain dm uses a different method, based on determining grey scale differences in an image. In other words, there are no assumptions made regarding the cortical folding patterns. FreeSurfer on the other hand, needs to find a cortical model to determine the surface of the cortex, which becomes a difficult task with an image that has an incomplete FOV or with a 2D image. The usage of a different method might also explain the significant difference in obtained brain volumes according to the linear mixed modelling approach.
It has been shown that FreeSurfer performs well with curated datasets such as ADNI and OASIS-1 [18]. However, the effect of large slice thickness (>1.6 mm) and voxel sizes, an incomplete field of view, as well as white matter lesions, resulted in significant runtime elongation (>72 h) while performing topology corrections. In some cases, this resulted in a complete abortion (n = 67) of FreeSurfer analysis, a previously reported phenomenon [34]. icobrain dm processed all 820 MRI T1w sequences of this dataset accurately without the processing time being affected, suggesting icobrain dm can have a diagnostic value for the analysis of real-world clinical data.
Selection of relevant brain volumes for robust AD diagnosis
Using a stepwise logistic regression model can be useful to select the minimum number of indicators to distinguish between different groups. Through providing models with more stable indicators, the number of exigent brain structures for AD diagnosis in clinical routine can be minimized. In addition, identifying the most relevant volumetric measures for each disease stage might aid to understand the underlying pathophysiology of the AD continuum [35, 36].
The exploratory stepwise-AIC analysis done in this study revealed that combining brain structures computed by icobrain dm indeed improved diagnostic accuracy in the AD continuum. The whole brain, frontal, parietal, and temporal cortices, both hippocampal volumes (HIP-L and HIP-R), and the lateral ventricles reside amongst the most relevant volumetric measures and that each, either as a separate predictor or in combination with each other, provide information to improve diagnostic accuracy in the different disease stages within the AD continuum as compared to HC. These results were in concordance with previously published literature [3, 37, 38].
When looking at the individual disease stage comparisons such as SCD versus HC, it is important to note that SCD is characterized by self-experienced worsening of cognitive function [22, 39, 40]. Individuals with SCD have a higher risk to have incipient AD as compared to cognitively healthy individuals without cognitive complaints [41], hence exploring possible differences between HC and SCD can aid in refinement of SCD features.
In the ADD-MCI comparison, besides the right hippocampus and lateral ventricles, both models contained the parietal cortex as one of the brain structures that helped to distinguish between the disease stages. Apart from medial temporal lobe atrophy, progression of atrophy to posterior regions, which includes the posterior cingulate gyrus, precuneus, and parietal cortex [42], is increasingly recognized as a potential structural marker for MCI to ADD conversion [43]. In addition, several studies indicated that MCI patients display loss of gray matter in the posterior parietal cortex, when compared to cognitively healthy controls, suggesting parietal involvement in earlier stages of AD as well [44]. Since visuo-spatial impairment, executive dysfunction and language impairment are also characteristics of AD, together with the strong connectivity between the parietal cortex and other regions of the brain, the presence of the parietal cortex as an important structure in icobrain dm’s final model of both the SCD-HC, MCI-HC, and ADD-MCI comparison seems to be plausible [44].
All disease stages classifications included either one, or both hippocampal volumes, which is consistent with previous statements reported in the literature indicating hippocampal atrophy is a reliable marker for disease stage and progression [2, 45, 46]. The model, however, does not consider possible hippocampal asymmetry. Evidence for possible changes in the MRI hippocampal asymmetry index during the progression of AD have been previously reported and it was suggested to occur with different extents between control, MCI, and ADD disease stages [47, 48]. Changes in the normal pattern of asymmetry could be representative of a brain pathology and could serve as a neuroanatomical marker or as a risk factor, thus could therefore be considered in future studies [49]. Apart from considering hippocampal asymmetry, hippocampal subfield segmentation is generating increasing interest as well. Although currently not applied in FDA-approved automated segmentation software, including hippocampal subfield segmentation may provide insight in subregion specific pathology patterns, as hippocampal subregions were postulated to be functionally specialized and not equally affected by AD [50–52]. In our previous study, it was shown that the usage of FreeSurfer’s hippocampal subfield functionality resulted in a higher DSC and lower mean absolute volume difference compared to FreeSurfer’s default hippocampal segmentation, however not surpassing icobrain dm in terms of accuracy [18]. Since hippocampal subfield segmentation improved FreeSurfer’s performance, the inclusion of hippocampal subfield segmentation in icobrain dm’s pipeline as an additional sensitive biomarker might lead to improved diagnostic accuracy and should be further investigated.
Toward implementation in clinical practice
This study showed that automated neuroimaging biomarkers computed by icobrain dm, individually as well as combined, can aid in improving diagnosis for real-world clinical data in a time-efficient manner. However, tackling the most frequent obstacles when obtaining real world data is key to support the continuum of evidence generation for the usage of automated volumetric tools in daily practice. The usage of real-world data is as well a strength as a limitation in the current study in terms of analysis and interpretation. Real world data is clinically driven, often showing lower internal validity due to the selection based on clinical indications rather than strict inclusion criteria, resulting in variable data quality, especially in MRI resolution. In the current study, icobrain dm demonstrated clinical utility by being able to handle MRI images of variable quality, additionally confirmed by the exploratory analysis assessing the impact of slice thickness resolution on icobrain dm’s diagnostic performance. Furthermore, icobrain dm does not recommend specific acquisition parameters, allowing easy integration in routine clinical practice. Nevertheless, we suggest an MRI slice thickness of < 1.6 mm to adequately analyze neuroimaging data in an automated manner, since image quality remains a critical factor for reliable automated volumetric measurements, especially regarding potential clinical applications. We did not repeat a comparison with manual segmentations to assess segmentation method accuracy, since hippocampal manual segmentations were compared against icobrain dm and FreeSurfer segmentations in our previous study, reporting a significantly higher dice coefficient for icobrain dm as opposed to FreeSurfer, while also showing an overall lower volumetric error for other examined brain structures [18]. Lastly, a significant difference in age between the disease stages is an additional limitation of this study, but was corrected for, during statistical analysis.
Taken together, AD remains a non-unitary syndrome, with heterogenic individual neuroimaging and cognitive profiles, most likely due to a multi-factorial pathogenesis. Moreover, brain atrophy is not specific for AD. Therefore, it remains essential to use additional biomarker measures in a complementary fashion. Working toward implementation of automated volumetric tools in a clinical setting, the use of a standard imaging acquisition protocol, of which sequences can be tailored at individual sites depending on the type of MRI scanner available, together with a standardized method of interpretation, can minimize inter- and inter-site variability. Lastly, intra and inter-scanner variability on automated volumetric output should be further investigated to assess the effect of additional brain volume differences not related to AD pathology.
Based on this study, we conclude that automated volumetric tools are useful to improve diagnostic certainty of AD in routine clinical practice. In addition, combining brain structures can improve diagnostic accuracy when using real-world imaging data from a clinical setting.
ETHICAL APPROVAL AND CONSENT
The study was approved by the ethics committee of the University of Antwerp / Universitair Ziekenhuis Antwerp (N°16/2/18), Antwerp and by the ethics committees of Algemeen Ziekenhuis Sint-Jan Brugge-Oostende, Bruges (N°1992); Centre Hospitalier Universitaire Brugmann (CHU Brugmann), Brussels (N°2016/84); Centre Hospitalier Universitaire Liège (CHU Liège), Liège (N°2012/274); Cliniques Universitaires de Bruxelles (ULB), Hôpital Erasme, Brussels (N°P2016/187); Cliniques Universitaires Saint-Luc (UCL), Brussels (N°2016/07jui/261); Clinique St-Pierre Ottignies, Ottignies (N°OM045); Universitair Ziekenhuis Brussel, Brussels (N°2016/183); and Ziekenhuis Netwerk Antwerp (ZNA), Antwerp (N°4730).
icobrain dm is a proprietary software, developed by icometrix for the automated quantification of brain volumes and white matter hyperintensities.
ACKNOWLEDGMENTS
This research was in part supported by the agency of Flanders Innovation & Intrepreneurship (VLAIO), the Flemish Agency for Innovation by Science and Technology (IWT 140262), the Interreg V programme Flanders-The Netherlands of the European Regional Development Fund (ERDF) (Herinneringen/Memories project), the European Union’s Horizon 2020 research and innovation programme under grant agreement numbers 666992 (EUROPOND) and 765148 (TRABIT). For the University of Liège center, this work was supported by a French Speaking Community Concerted Research Action (ARC-06/11-340) and a Belgian InterUniversity Attraction Pole (P6/29). We acknowledge the contribution of Sebastiaan Mariën and Roxanne Bladt.
Authors’ disclosures available online (https://www.j-alz.com/manuscript-disclosures/21-0450r1).
SUPPLEMENTARY MATERIAL
[1] The supplementary material is available in the electronic version of this article: https://dx.doi.org/10.3233/JAD-210450.
REFERENCES
[1] | Yi HA , Moller C , Dieleman N , Bouwman FH , Barkhof F , Scheltens P , van der Flier WM , Vrenken H ((2016) ) Relation between subcortical grey matter atrophy and conversion from mild cognitive impairment to Alzheimer’s disease. J Neurol Neurosurg Psychiatry 87: , 425–432. |
[2] | Ledig C , Schuh A , Guerrero R , Heckemann RA , Rueckert D ((2018) ) Structural brain imaging in Alzheimer’s disease and mild cognitive impairment: Biomarker analysis and shared morphometry database. Sci Rep 8: , 11258. |
[3] | Frisoni GB , Fox NC , Jack CR Jr. , Scheltens P , Thompson PM ((2010) ) The clinical use of structural MRI in Alzheimer disease. Nat Rev Neurol 6: , 67–77. |
[4] | Ridha BH , Anderson VM , Barnes J , Boyes RG , Price SL , Rossor MN , Whitwell JL , Jenkins L , Black RS , Grundman M , Fox NC ((2008) ) Volumetric MRI and cognitive measures in Alzheimer disease: Comparison of markers of progression. J Neurol 255: , 567–574. |
[5] | Pini L , Pievani M , Bocchetta M , Altomare D , Bosco P , Cavedo E , Galluzzi S , Marizzoni M , Frisoni GB ((2016) ) Brain atrophy in Alzheimer’s disease and aging. Ageing Res Rev 30: , 25–48. |
[6] | Ferreira D , Verhagen C , Hernandez-Cabrera JA , Cavallin L , Guo CJ , Ekman U , Muehlboeck JS , Simmons A , Barroso J , Wahlund LO , Westman E ((2017) ) Distinct subtypes of Alzheimer’s disease based on patterns of brain atrophy: Longitudinal trajectories and clinical applications. Sci Rep 7: , 46263. |
[7] | McRae-McKee K , Evans S , Hadjichrysanthou C , Wong MM , de Wolf F , Anderson RM ((2019) ) Combining hippocampal volume metrics to better understand Alzheimer’s disease progression in at-risk individuals. Sci Rep 9: , 7499. |
[8] | Ottoy J , Niemantsverdriet E , Verhaeghe J , De Roeck E , Struyfs H , Somers C , Wyffels L , Ceyssens S , Van Mossevelde S , Van den Bossche T , Van Broeckhoven C , Ribbens A , Bjerke M , Stroobants S , Engelborghs S , Staelens S ((2019) ) Association of short-term cognitive decline and MCI-to-AD dementia conversion with CSF, MRI, amyloid- and (18)F-FDG-PET imaging. Neuroimage Clin 22: , 101771. |
[9] | Albert MS , DeKosky ST , Dickson D , Dubois B , Feldman HH , Fox NC , Gamst A , Holtzman DM , Jagust WJ , Petersen RC , Snyder PJ , Carrillo MC , Thies B , Phelps CH ((2011) ) The diagnosis of mild cognitive impairment due to Alzheimer’s disease: Recommendations from the National Institute on Aging-Alzheimer’s Association workgroups on diagnostic guidelines for Alzheimer’s disease. Alzheimers Dement 7: , 270–279. |
[10] | Dubois B , Feldman HH , Jacova C , Hampel H , Molinuevo JL , Blennow K , DeKosky ST , Gauthier S , Selkoe D , Bateman R , Cappa S , Crutch S , Engelborghs S , Frisoni GB , Fox NC , Galasko D , Habert MO , Jicha GA , Nordberg A , Pasquier F , Rabinovici G , Robert P , Rowe C , Salloway S , Sarazin M , Epelbaum S , de Souza LC , Vellas B , Visser PJ , Schneider L , Stern Y , Scheltens P , Cummings JL ((2014) ) Advancing research diagnostic criteria for Alzheimer’s disease: The IWG-2 criteria. Lancet Neurol 13: , 614–629. |
[11] | Jack CR Jr. , Albert MS , Knopman DS , McKhann GM , Sperling RA , Carrillo MC , Thies B , Phelps CH ((2011) ) Introduction to the recommendations from the National Institute on Aging-Alzheimer’s Association workgroups on diagnostic guidelines for Alzheimer’s disease. Alzheimers Dement 7: , 257–262. |
[12] | McKhann GM , Knopman DS , Chertkow H , Hyman BT , Jack CR Jr. , Kawas CH , Klunk WE , Koroshetz WJ , Manly JJ , Mayeux R , Mohs RC , Morris JC , Rossor MN , Scheltens P , Carrillo MC , Thies B , Weintraub S , Phelps CH ((2011) ) The diagnosis of dementia due to Alzheimer’s disease: Recommendations from the National Institute on Aging-Alzheimer’s Association workgroups on diagnostic guidelines for Alzheimer’s disease. Alzheimers Dement 7: , 263–269. |
[13] | Sperling RA , Aisen PS , Beckett LA , Bennett DA , Craft S , Fagan AM , Iwatsubo T , Jack CR Jr. , Kaye J , Montine TJ , Park DC , Reiman EM , Rowe CC , Siemers E , Stern Y , Yaffe K , Carrillo MC , Thies B , Morrison-Bogorad M , Wagster MV , Phelps CH ((2011) ) Toward defining the preclinical stages of Alzheimer’s disease: Recommendations from the National Institute on Aging-Alzheimer’s Association workgroups on diagnostic guidelines for Alzheimer’s disease. Alzheimers Dement 7: , 280–292. |
[14] | Sanchez-Benavides G , Gomez-Anson B , Sainz A , Vives Y , Delfino M , Pena-Casanova J ((2010) ) Manual validation of FreeSurfer’s automated hippocampal segmentation in normal aging, mild cognitive impairment, and Alzheimer disease subjects. Psychiatry Res 181: , 219–225. |
[15] | Boccardi M , Ganzola R , Bocchetta M , Pievani M , Redolfi A , Bartzokis G , Camicioli R , Csernansky JG , de Leon MJ , deToledo-Morrell L , Killiany RJ , Lehericy S , Pantel J , Pruessner JC , Soininen H , Watson C , Duchesne S , Jack CR Jr. , Frisoni GB ((2011) ) Survey of protocols for the manual segmentation of the hippocampus: Preparatory steps towards a joint EADC-ADNI harmonized protocol. J Alzheimers Dis 26 Suppl 3: , 61–75. |
[16] | Niemantsverdriet E , Ribbens A , Bastin C , Benoit F , Bergmans B , Bier JC , Bladt R , Claes L , De Deyn PP , Deryck O , Hanseeuw B , Ivanoiu A , Lemper JC , Mormont E , Picard G , Salmon E , Segers K , Sieben A , Smeets D , Struyfs H , Thiery E , Tournoy J , Triau E , Vanbinst AM , Versijpt J , Bjerke M , Engelborghs S ((2018) ) A Retrospective Belgian Multi-Center MRI Biomarker Study in Alzheimer’s Disease (REMEMBER). J Alzheimers Dis 63: , 1509–1522. |
[17] | Hurtz S , Chow N , Watson AE , Somme JH , Goukasian N , Hwang KS , Morra J , Elashoff D , Gao S , Petersen RC , Aisen PS , Thompson PM , Apostolova LG ((2019) ) Automated and manual hippocampal segmentation techniques: Comparison of results, reproducibility and clinical applicability. Neuroimage Clin 21: , 101574. |
[18] | Struyfs H , Sima DM , Wittens M , Ribbens A , Pedrosa de Barros N , Phan TV , Ferraz Meyer MI , Claes L , Niemantsverdriet E , Engelborghs S , Van Hecke W , Smeets D ((2020) ) Automated MRI volumetry as a diagnostic tool for Alzheimer’s disease: Validation of icobrain dm. Neuroimage Clin 26: , 102243. |
[19] | Martensson G , Hakansson C , Pereira JB , Palmqvist S , Hansson O , van Westen D , Westman E ((2020) ) Medial temporal atrophy in preclinical dementia: Visual and automated assessment during six year follow-up. Neuroimage Clin 27: , 102310. |
[20] | Desikan RS , Cabral HJ , Settecase F , Hess CP , Dillon WP , Glastonbury CM , Weiner MW , Schmansky NJ , Salat DH , Fischl B , Alzheimer’s Disease Neuroimaging Initiative ((2010) ) Automated MRI measures predict progression to Alzheimer’s disease. Neurobiol Aging 31: , 1364–1374. |
[21] | Schmitter D , Roche A , Marechal B , Ribes D , Abdulkadir A , Bach-Cuadra M , Daducci A , Granziera C , Kloppel S , Maeder P , Meuli R , Krueger G , Alzheimer’s Disease Neuroimaging Initiative ((2015) ) An evaluation of volume-based morphometry for prediction of mild cognitive impairment and Alzheimer’s disease. Neuroimage Clin 7: , 7–17. |
[22] | Jessen F , Amariglio RE , van Boxtel M , Breteler M , Ceccaldi M , Chetelat G , Dubois B , Dufouil C , Ellis KA , van der Flier WM , Glodzik L , van Harten AC , de Leon MJ , McHugh P , Mielke MM , Molinuevo JL , Mosconi L , Osorio RS , Perrotin A , Petersen RC , Rabin LA , Rami L , Reisberg B , Rentz DM , Sachdev PS , de la Sayette V , Saykin AJ , Scheltens P , Shulman MB , Slavin MJ , Sperling RA , Stewart R , Uspenskaya O , Vellas B , Visser PJ , Wagner M , Subjective Cognitive Decline Initiative Working Group ((2014) ) A conceptual framework for research on subjective cognitive decline in preclinical Alzheimer’s disease. Alzheimers Dement 10: , 844–852. |
[23] | Smeets D , Ribbens A , Sima DM , Cambron M , Horakova D , Jain S , Maertens A , Van Vlierberghe E , Terzopoulos V , Van Binst AM , Vaneckova M , Krasensky J , Uher T , Seidl Z , De Keyser J , Nagels G , De Mey J , Havrdova E , Van Hecke W ((2016) ) Reliable measurements of brain atrophy in individual patients with multiple sclerosis. Brain Behav 6: , e00518. |
[24] | Jain S , Sima DM , Ribbens A , Cambron M , Maertens A , Van Hecke W , De Mey J , Barkhof F , Steenwijk MD , Daams M , Maes F , Van Huffel S , Vrenken H , Smeets D ((2015) ) Automatic segmentation and volumetry of multiple sclerosis brain lesions from MR images. Neuroimage Clin 8: , 367–375. |
[25] | Boccardi M , Bocchetta M , Apostolova LG , Barnes J , Bartzokis G , Corbetta G , DeCarli C , deToledo-Morrell L , Firbank M , Ganzola R , Gerritsen L , Henneman W , Killiany RJ , Malykhin N , Pasqualetti P , Pruessner JC , Redolfi A , Robitaille N , Soininen H , Tolomeo D , Wang L , Watson C , Wolf H , Duvernoy H , Duchesne S , Jack CR Jr. , Frisoni GB ((2015) ) Delphi definition of the EADC-ADNI Harmonized Protocol for hippocampal segmentation on magnetic resonance. Alzheimers Dement 11: , 126–138. |
[26] | Fischl B , Salat DH , Busa E , Albert M , Dieterich M , Haselgrove C , van der Kouwe A , Killiany R , Kennedy D , Klaveness S , Montillo A , Makris N , Rosen B , Dale AM ((2002) ) Whole brain segmentation: Automated labeling of neuroanatomical structures in the human brain. Neuron 33: , 341–355. |
[27] | Fischl B ((2012) ) FreeSurfer. Neuroimage 62: , 774–781. |
[28] | R Core Team ((2020) ) R Foundation for Statistical Computing, Vienna, Austria. |
[29] | Patil I ((2018) ) ggstatsplot: ‘ggplot2’ Based Plots with Statistical Details. CRAN. https://cran.r-project.org/web/packages/ggstatsplot/index.html |
[30] | Robin X , Turck N , Hainard A , Tiberti N , Lisacek F , Sanchez JC , Muller M ((2011) ) pROC: An open-source package for R and S+to analyze and compare ROC curves. BMC Bioinformatics 12: , 77. |
[31] | DeLong ER , DeLong DM , Clarke-Pearson DL ((1988) ) Comparing the areas under two or more correlated receiver operating characteristic curves: A nonparametric approach. Biometrics 44: , 837–845. |
[32] | Kassambara A ((2020) ) ggpubr: ‘ggplot2’ Based Publication Ready Plots. Version: R package version 0.4.0. https://CRAN.R-project.org/package=ggpubr. |
[33] | Kim JH ((2019) ) Multicollinearity and misleading statistical results. Korean J Anesthesiol 72: , 558–569. |
[34] | Backhausen LL , Herting MM , Buse J , Roessner V , Smolka MN , Vetter NC ((2016) ) Quality control of structural MRI images applied using FreeSurfer-A hands-on workflow to rate motion artifacts. Front Neurosci 10: , 558. |
[35] | Aisen PS , Cummings J , Jack CR Jr. , Morris JC , Sperling R , Frolich L , Jones RW , Dowsett SA , Matthews BR , Raskin J , Scheltens P , Dubois B ((2017) ) On the path to 2025: Understanding the Alzheimer’s disease continuum. Alzheimers Res Ther 9: , 60. |
[36] | Gomar JJ , Bobes-Bascaran MT , Conejero-Goldberg C , Davies P , Goldberg TE , Alzheimer’s Disease Neuroimaging Initiative ((2011) ) Utility of combinations of biomarkers, cognitive markers, and risk factors to predict conversion from mild cognitive impairment to Alzheimer disease in patients in the Alzheimer’s Disease Neuroimaging Initiative. Arch Gen Psychiatry 68: , 961–969. |
[37] | Henneman WJ , Sluimer JD , Barnes J , van der Flier WM , Sluimer IC , Fox NC , Scheltens P , Vrenken H , Barkhof F ((2009) ) Hippocampal atrophy rates in Alzheimer disease: Added value over whole brain volume measures. Neurology 72: , 999–1007. |
[38] | Nestor SM , Rupsingh R , Borrie M , Smith M , Accomazzi V , Wells JL , Fogarty J , Bartha R , Alzheimer’s Disease Neuroimaging Initiative ((2008) ) Ventricular enlargement as a possible measure of Alzheimer’s disease progression validated using the Alzheimer’s disease neuroimaging initiative database. Brain 131: , 2443–2454. |
[39] | Hill NL , Mogle J , Wion R , Munoz E , DePasquale N , Yevchak AM , Parisi JM ((2016) ) Subjective cognitive impairment and affective symptoms: A systematic review. Gerontologist 56: , e109–e127. |
[40] | Liew TM ((2020) ) Subjective cognitive decline, anxiety symptoms, and the risk of mild cognitive impairment and dementia. Alzheimers Res Ther 12: , 107. |
[41] | Miebach L , Wolfsgruber S , Polcher A , Peters O , Menne F , Luther K , Incesoy E , Priller J , Spruth E , Altenstein S , Buerger K , Catak C , Janowitz D , Perneczky R , Utecht J , Laske C , Buchmann M , Schneider A , Fliessbach K , Kalbhen P , Heneka MT , Brosseron F , Spottke A , Roy N , Teipel SJ , Kilimann I , Wiltfang J , Bartels C , Düzel E , Dobisch L , Metzger C , Meiberth D , Ramirez A , Jessen F , Wagner M ((2019) ) Which features of subjective cognitive decline are related to amyloid pathology? Findings from the DELCODE study. Alzheimers Res Ther 11: , 66. |
[42] | Koedam EL , Lehmann M , van der Flier WM , Scheltens P , Pijnenburg YA , Fox N , Barkhof F , Wattjes MP ((2011) ) Visual assessment of posterior atrophy development of a MRI rating scale. Eur Radiol 21: , 2618–2625. |
[43] | Lehmann M , Koedam EL , Barnes J , Bartlett JW , Barkhof F , Wattjes MP , Schott JM , Scheltens P , Fox NC , Alzheimer’s Disease Neuroimaging Initiative ((2013) ) Visual ratings of atrophy in MCI: Prediction of conversion and relationship with CSF biomarkers. Neurobiol Aging 34: , 73–82. |
[44] | Jacobs HI , Van Boxtel MP , Jolles J , Verhey FR , Uylings HB ((2012) ) Parietal cortex matters in Alzheimer’s disease: An overview of structural, functional and metabolic findings. Neurosci Biobehav Rev 36: , 297–309. |
[45] | Franko E , Joly O , Alzheimer’s Disease Neuroimaging Initiative ((2013) ) Evaluating Alzheimer’s disease progression using rate of regional hippocampal atrophy. PLoS One 8: , e71354. |
[46] | Garcia-Ptacek S , Eriksdotter M , Jelic V , Porta-Etessam J , Kareholt I , Manzano Palomo S ((2016) ) Subjective cognitive impairment: Towards early identification of Alzheimer disease. Neurologia 31: , 562–571. |
[47] | Barnes J , Scahill RI , Schott JM , Frost C , Rossor MN , Fox NC ((2005) ) Does Alzheimer’s disease affect hippocampal asymmetry? Evidence from a cross-sectional and longitudinal volumetric MRI study. Dement Geriatr Cogn Disord 19: , 338–344. |
[48] | Shi F , Liu B , Zhou Y , Yu C , Jiang T ((2009) ) Hippocampal volume and asymmetry in mild cognitive impairment and Alzheimer’s disease: Meta-analyses of MRI studies. Hippocampus 19: , 1055–1064. |
[49] | Sarica A , Vasta R , Novellino F , Vaccaro MG , Cerasa A , Quattrone A , Alzheimer’s Disease Neuroimaging Initiative ((2018) ) MRI asymmetry index of hippocampal subfields increases through the continuum from the mild cognitive impairment to the Alzheimer’s disease. Front Neurosci 12: , 576. |
[50] | Carey D , Nolan H , Kenny RA , Meaney J ((2019) ) Dissociable age and memory relationships with hippocampal subfield volumes in vivo: Data from the Irish Longitudinal Study on Ageing (TILDA). Sci Rep 9: , 10981. |
[51] | Zandifar A , Fonov V , Coupe P , Pruessner J , Collins DL , Alzheimer’s Disease Neuroimaging Initiative ((2017) ) A comparison of accurate automatic hippocampal segmentation methods. Neuroimage 155: , 383–393. |
[52] | Hett K , Ta VT , Catheline G , Tourdias T , Manjon JV , Coupe P , Alzheimer’s Disease Neuroimaging Initiative ((2019) ) Multimodal hippocampal subfield grading for Alzheimer’s disease classification. Sci Rep 9: , 13845. |


