
Increased Functional Connectivity of the Precuneus in Individuals with a Family History of Alzheimer’s Disease
Abstract
Background:
First-degree relatives of individuals with late-onset Alzheimer’s disease (AD) have increased risk for AD, with children of affected parents at an especially high risk.
Objective:
We aimed to investigate default mode network connectivity, medial temporal cortex volume, and cognition in cognitively healthy (CH) individuals with (FH+) and without (FH-) a family history of AD, alongside amnestic mild cognitive impairment (aMCI) and AD individuals, to determine the context and directionality of dysfunction in at-risk individuals. Our primary hypothesis was that there would be a linear decline (CH FH- > CH FH+ > aMCI > AD) within the risk groups on all measures of AD risk.
Methods:
We used MRI and fMRI to study cognitively healthy individuals (n = 28) with and without AD family history (FH+ and FH-, respectively), those with aMCI (n = 31) and early-stage AD (n = 25). We tested connectivity within the default mode network, as well as measures of volume and thickness within the medial temporal cortex and selected seed regions.
Results:
As expected, we identified decreased medial temporal cortex volumes in the aMCI and AD groups compared to cognitively healthy groups. We also observed patterns of connectivity across risk groups that suggest a nonlinear relationship of change, such that the FH+ group showed increased connectivity compared to the FH- and AD groups (CH FH+ > CH FH- > aMCI > AD). This pattern emerged primarily in connectivity between the precuneus and frontal regions.
Conclusion:
These results add to a growing literature that suggests compensatory brain function in otherwise cognitively healthy individuals with a family history of AD.
INTRODUCTION
Late-onset Alzheimer’s disease (LOAD) is a neurodegenerative disease associated with the accumulation of amyloid-β (Aβ) and tau accompanied by a loss of neurons and synapses that ultimately lead to loss of memory and cognitive function. There is a growing focus on research into the genetics and heritability of Alzheimer’s disease (AD), especially on brain imaging biomarkers that may identify those at risk for AD. Although LOAD is generally referred to as sporadic, biological first-degree relatives of individuals with AD (FH+) are at 4-to 10-fold higher risk for dementia than individuals with no family history (FH-) [1]. Data from the UK Biobank has highlighted the viability of family history as a proxy-phenotype of AD [2], and proxy-genome-wide association studies have recently been used to identify novel risk-incurring gene loci [3, 4]. AD-proxy individuals cannot be treated as equivalent to AD cases, as many individuals with this risk will not develop AD. However, the high degree of overlap in genetic information between these two groups warrants investigation into the intermediate phenotypes that emerge in these individuals, especially phenotypes involving metabolic changes that may occur before symptoms appear.
Biomarker studies of brain structure and function offer potential opportunities for prodromal detection of AD-related change, and for potentially improving our understanding of factors relating to heritability of risk. There are a growing number of studies using brain imaging to demonstrate that first-degree relatives of individuals with AD have increased markers of risk for AD even in the absence of cognitive decline [5, 6]. We and others have used imaging and cerebrospinal fluid (CSF) biomarkers to identify relationships between maternal family history and AD endophenotypes, e.g., cerebral metabolism [7], higher Aβ burden [6], reduction in gray matter volume [8, 9], and increased global Pittsburgh Compound B (PiB) uptake measured using PiB-PET [9, 10]. Moreover, maternal inheritance patterns may also include a unique prodromal metabolic phenotype [11–15].
Given evidence of decline in metabolic activity in individuals with a family history of AD, we sought to use functional magnetic resonance imaging (fMRI) of the “resting state”, which provides information about the brain’s activation, when undirected to a specific external task. During resting state imaging, several brain regions exhibit low frequency fluctuations in a coordinated and stable manner compared to other regions of the brain [16, 17]. This default mode network (DMN) consists of namely the posterior cingulate cortex (PCC), inferior parietal cortex, midline/lateral frontal cortex, and the medial temporal cortex. Resting state fMRI studies have identified alterations in the connectivity of specific brain networks in AD, including the DMN, that may be present in individuals at the early stages of decline. In fact, the DMN may be uniquely affected by neurodegeneration [18, 19] and pathological deposition of Aβ, even in individuals without a clinical AD diagnosis, making DMN measurements a key early biomarker for AD [20–22]. Individuals with early memory changes without AD, such as those with aMCI have been shown to have possible compensatory increased DMN connectivity (posterior to frontal cortices) and decreased hippocampal to frontal connectivity, with subsequent decline in connectivity in these regions with the onset of AD [23, 24]. Individuals with a first-degree relative with dementia have differences in their resting state connectivity between the posterior cingulate and anterior default mode network regions [25–27]. However, no studies have compared default mode network connectivity profiles of family history positive individuals with individuals with aMCI.
To further characterize patterns of brain biomarkers in the context of AD risk, we measured DMN functional connectivity and regional brain volume in a cross-sectional cohort of low-risk and high-risk cognitively healthy older adults, and individuals with amnestic MCI and late-onset AD. This was a cross-sectional study on a select sample of subjects in specific diagnosis and family history groups to explore structure and function of the brain DMN, based on our previous data showing FH-related abnormalities in these regions [5, 8, 9]. Our primary hypothesis was that there would be a linear decline across the four groups, such that cognitively healthy (CH), FH+ individuals followed by those with cognitive impairment (aMCI and AD), would have abnormal DMN connectivity compared to cognitively healthy, FH- individuals. After seeing a clear increase in connectivity in the FH+ group, we explored the possibility that FH+ individuals would show increased connectivity compared to the other groups. We also hypothesized that cognitively healthy, FH+ individuals would have decreases in volume in the medial temporal lobe, and abnormal posterior DMN connectivity [26], similar to previous reports showing abnormal connectivity in aMCI compared to AD [28, 29].
MATERIALS AND METHODS
Study procedures were approved by the University of Kansas School of Medicine Institutional Review Board and were in accordance with U.S. federal regulations. All participants provided written informed consent.
Participants
Participants were recruited as part of intervention and observational studies at the University of Kansas Alzheimer’s Disease Center (KU ADC) and were part of the Clinical Cohort. We have previously reported results from these investigations [30–32]. The KU ADC is part of the U.S. network of Alzheimer’s Disease Centers of Excellence that support research into brain aging and dementia. The KU ADC has established an infrastructure for the identification, recruitment, and characterization of older adults both with and without dementia. Beginning in 2004, we developed a registry of individuals who have consented to be contacted regarding research studies, details of which have been published elsewhere [33]. Ninety-six participants underwent brain imaging as part of these ongoing observational and intervention-based studies (pre-intervention timepoint only) on fitness, exercise, aging, and risk for AD (ClinicalTrials.gov: NCT01129115, NCT02000583, NCT00267124). All participants also underwent a standard examination, which includes a thorough clinical and cognitive evaluation with a clinician at the KU ADC. This clinical evaluation includes a semi-structured interview (Clinical Dementia Rating, CDR) with the participant and study partner [34], as well as a physical and neurological examination. A psychometrician administers a standard psychometric battery [35]. Clinical evaluation results are used to determine dementia status, which is reviewed along with psychometric battery results and finalized at a consensus diagnostic conference attended by clinicians and psychometricians using the NINCDS-ADRDA criteria. Individuals classified with MCI are also assigned an etiologic diagnosis (e.g., probable AD, cerebrovascular disease, depression). For this study, we included only MCI individuals with an etiologic diagnosis of probable AD.
Subjects completed thorough family history examinations using a standard family history questionnaire, as has been described elsewhere [8]. Briefly, a family history of dementia included at least one first-degree relative whose dementia onset was between the ages of 60 and 80 years. Participants (or their caregivers in the case of those with aMCI and AD) self-reported relationships, dates of birth, age at death, age at onset of disease, and clinical information of affected and unaffected family members. Subjects were not included if both of their parents had not lived to the age at risk of LOAD (i.e., 60 years). Determination of APOE genotype was performed using restriction enzyme isotyping on a subgroup of individuals that had consented for a genetic substudy (n = 62).
Assessment of cognitive function
The neuropsychological examination included tests from the Uniform Data Set (UDS) used by the national ADC network. For our study, we used sex, age, and education-adjusted scores [36]. We computed a “global cognition” score by averaging the normed scores from all individual tests in the UDS test battery, and “domain” scores by averaging scores from the UDS tests that fell into the cognitive domains of Memory (Logical Memory, Immediate and Delayed Recall), Language (Animal and Vegetable Verbal Fluency and Boston Naming Task), Attention (Digit Span Forward and Digit Span Backward), Executive Function (Trail Making Test B), and Processing Speed (Trail Making Test A and Digit Symbol Substitution).
Brain imaging acquisition
All participants underwent magnetic resonance imaging (MRI) of the brain in either a Siemens 3.0 Tesla Allegra or Skyra scanner. We obtained a high resolution T1 weighted image (MP-RAGE; 1×1×1 mm voxels; TR = 2500 ms, TE = 4.38 ms, TI = 1100, FOV = 256×256 with 18% oversample, 1 mm slice thickness, flip angle 8°) for detailed anatomy with high gray-white matter contrast. We obtained a 7-min resting echo planar fMRI scan (BOLD EPI: 3×3×3 mm; TR = 3000, TE = 30 ms, FOV = 448×448, 3 mm slice thickness, flip angle 90°) with the instruction to keep eyes closed and relax but do not sleep. Every scan was checked for image artifacts and gross anatomical abnormalities. The overall time between the cognitive assessment and brain scans ranged from 4–6 weeks.
Structural data preprocessing and analysis
After the acquisition, all images underwent cortical reconstruction and volumetric segmentation with the Freesurfer neuroimaging analysis suite, which is documented and freely available for download (https://surfer.nmr.mgh.harvard.edu/) and described in prior publications [37]. Each image was then visually inspected for the quality of the preprocessing and manually corrected as necessary at multiple stages in the processing stream. If there were any structural abnormalities that severely altered the quality of the segmentations or pial/white matter surfaces after 4 quality checks, those images were excluded.
Measurements of total intracranial, cortical gray matter, cortical white matter, entorhinal cortex thickness, hippocampal and amygdala volume, and hippocampal occupancy score (HOC; an accurate discriminator of disease state [38]) were calculated from Freesurfer’s ASEG analysis [39]. All volumes (except HOC, which is already normalized) were divided by the total intracranial volume to adjust for variability due to head size. These normalized volumes were used for between-group comparisons to evaluate for significant group differences.
Resting state analysis
Functional image processing was performed using Analysis of Functional NeuroImages (AFNI) [40] (https://afni.nimh.nih.gov/afni). We employed a resting state analysis framework as implemented by the afni_restproc.py script distributed with AFNI. Briefly, we applied slice-timing correction and despiked the time series. Images were also filtered using Fast Fourier-Transform based filtering via 3dBandpass, from 0.009 to 0.08 Hz. Nuisance signals were regressed out by creating white matter, grey matter, and ventricle mask regressors with 3dLocalstat, using a radius of 20 mm. A motion censoring threshold of 0.3 was applied to the functional images. We then spatially smoothed the BOLD with a 6 mm Full Width at Half Maximum (FWHM) Gaussian kernel. Seven regions of interest (ROI; posterior cingulate, anterior cingulate, precuneus, frontal cortex (superior and middle frontal gyrus), primary motor cortex, inferior parietal cortex, and hippocampus) were created using segmentations from the anatomical analysis, created in Freesurfer. In addition to the five individual regions, an independent DMN mask ROI was created from the task-negative network by converting the surface mapping to an AFNI-style mask using SUMA [41]. Based on our limited sample size, we opted to limit our analyses to regions highlighted in previous work on family history of dementia. Wang et al. [26] examined a sample of solely cognitively healthy individuals split into two groups (those with a family history of dementia and those without). They identified altered connectivity between the DMN and medial temporal lobe. Thus, we limited our analyses to both a standard seed region, bilateral PCC, as well as bilateral precuneus, both of which act as central hubs of the DMN. We also chose to seed hippocampus, due to its implicated sensitivity in delineating early stages of AD [28, 42, 43]. Inter-regional mean z-transformed correlation coefficients were extracted for our analyses.
Statistical analyses
SPSS 22.0 (IBM Corp., Armonk, NY) was used for the statistical analyses performed outside of imaging space. Continuous demographic, cognitive, and volumetric imaging variables were compared between the family history groups and between the diagnosis groups using the one-way multivariate analysis of covariance (MANCOVA). A chi-square analysis was used to compare categorical demographic variables between groups. To test for connectivity differences across our four groups (CH FH-, CH FH+, aMCI, AD), mean z-transformed correlation coefficient between the seed region and each target ROI were used as the primary outcome, with age, sex, and scanner type used as covariates. We tested education as a covariate but found it did not significantly impact our results. Education further did not differ between groups, so we opted to exclude it as a covariate in our final analysis. Similarly, there were no significant differences in the number of APOE4 carriers in the CH FH- and CH FH+ group. While the AD group had significantly more APOE4 carriers than the CH group (p < 0.004), there were only two APOE4 carriers in each of the CH groups. For these reasons, we excluded APOE4 status in our final analyses.
We first tested differences in FH+ versus FH-, then overall group differences with the omnibus MANCOVA. If the primary MANCOVA identified a significant effect of group, we performed post-hoc testing using contrast analyses, to evaluate for significant differences in connectivity across our groups. Contrasts allow for the testing of differences between groups, representing linear combinations of the model parameters. Our primary hypothesis was that FH+ individuals would have decreased brain volume and DMN connectivity than FH- individuals, and that there would be a linear decline within the risk groups on all measures of AD risk (CH FH- > CH FH+ > aMCI > AD; contrast 3 1 -1 -3). However, we explored a secondary hypothesis that there would be a nonlinear characterization of risk, such that the FH+ group would exhibit compensatory brain changes not predictably intermediate of the aMCI group (CH FH- < CH FH+ > aMCI > AD; contrast 1 3 -1 -3). For all analyses, results were considered significant at p < 0.05. Additional post-hoc power analyses were performed in G*Power 3 to calculate specifically what effect sizes would be necessary to find significant differences in mean connectivity between the FH- and FH+ groups. Given an α of 0.05 an effect size (Cohen’s d) of 1.18 would be required to meet a power of 80% (1.39 considering multiple comparisons). Within our direct comparisons between these two groups, the highest observed effect size (precuneus-to-left M1) was only d = 0.89, corresponding to an achieved power of 56% (37% when adjusting for multiple comparisons).
RESULTS
Of the 96 individuals in the KU ADC Clinical Cohort with resting state images, 7 were excluded because of incomplete FH data, leaving 89 participants. Of those, motion or scanner artifact led to exclusion of 5 participants from structural analysis (leaving n = 12 FH+, n = 16 FH-, n = 31 aMCI, n = 25 AD) and 12 from resting state (leaving n = 11 FH+, n = 14 FH-, n = 32 aMCI, n = 21 AD), and the remainder (52) were used for the diagnostic analysis.
Table 1 shows the demographic and cognitive test measures of all groups. There were no significant differences between the cognitively healthy family history groups (FH+ versus FH-) or across the diagnostic groups (CH versus MCI versus AD) for age and years of education. There were more females in the CH group compared to aMCI and AD groups. There were no significant differences in the number of APOE4 carriers in the CH FH- and CH FH+ group. However, the AD group had significantly more APOE4 carriers than the CH group (p < 0.004). Despite this, due to the relatively low number of APOE4 carriers in the two CH groups (two each), we did not include APOE4 status as a covariate in our analyses. Individuals with early AD had significantly lower cognitive scores compared to CH, with aMCI intermediate in performance, on the UDS Global Cognition and domain scores. There was no difference in cognitive performance between FH+ and FH- group.
Table 1
Demographics and cognitive measures
| p | p | ||||||
| Demographics | ND FH- | ND FH+ | FH - versus FH+ | ND (all) | aMCI | AD | |
| n | 11 | 14 | 28 | 31 | 25 | ||
| Age | 70.64 (6.5) | 70.64 (7.1) | 0.998 | 70.1 (6.5) | 72.9 (6.5) | 72.3 (8) | 0.43 |
| Sex (m/f) | (3/8) | (4/10) | 0.59 | 8/20 | 19/12 | 12/13 | 0.041 |
| MMSE | 29.6 (0.5) | 29.3 (1.1) | 0.353 | 29.3 (1.1) | 27.8 (1.7) | 22.5 (2.7) | <0.001 |
| Education | 16.45 (0.76) | 16.14 (.26) | 0.769 | 16.1 (2.5) | 16.4 (3.3) | 15.1 (2.5) | 0.172 |
| APOE4 Carrier (none/1 E4/ 2 E4 s) | 9/2/0 | 12/2/0 | 0.596 | 23/4/1 | 15/9/6 | 5/11/4 | 0.004 |
| CDR (% 0, | (100%, | (100%, | NA | (100%, | (0%, 100%, | (0%, 20%, | <0.001 |
| % 0.5, % 1.0) | 0%, 0%) | 0%, 0%) | 0%, 0%) | 0%) | 80%) | ||
| Cognitive | 11 | 14 | 27 | 30 | 23 | ||
| Global Cognition | 0.161 (0.64) | 0.252 (0.47) | 0.722 | 0.178 (0.54) | –0.643 (0.60) | –1.73 (0.87) | <0.001 |
| Memory | 0.372 (1.1) | 0.794 (1.0) | 0.144 | 0.545 (1.0) | –1.31 (1.1) | –2.12 (0.76) | <0.001 |
| Attention | –0.007 (1.1) | –0.317 (0.71) | 0.370 | –0.269 (0.89) | –0.481 (0.68) | –0.849 (0.97) | 0.059 |
| Processing Speed | 0.184 (0.88) | 0.697 (0.63) | 0.122 | 0.501 (0.74) | –0.479 (0.94) | –1.7 (2.1) | <0.001 |
| Executive Function | –0.232 (0.95) | –0.027 (1.4) | 0.730 | –0.060 (1.1) | –0.952 (1.7) | –2.6 (2.5) | <0.001 |
| Language | 0.243 (0.97) | 0.437 (0.66) | 0.430 | 0.345 (0.77) | –0.506 (0.72) | –1.17 (0.96) | <0.001 |
Volumetric analysis
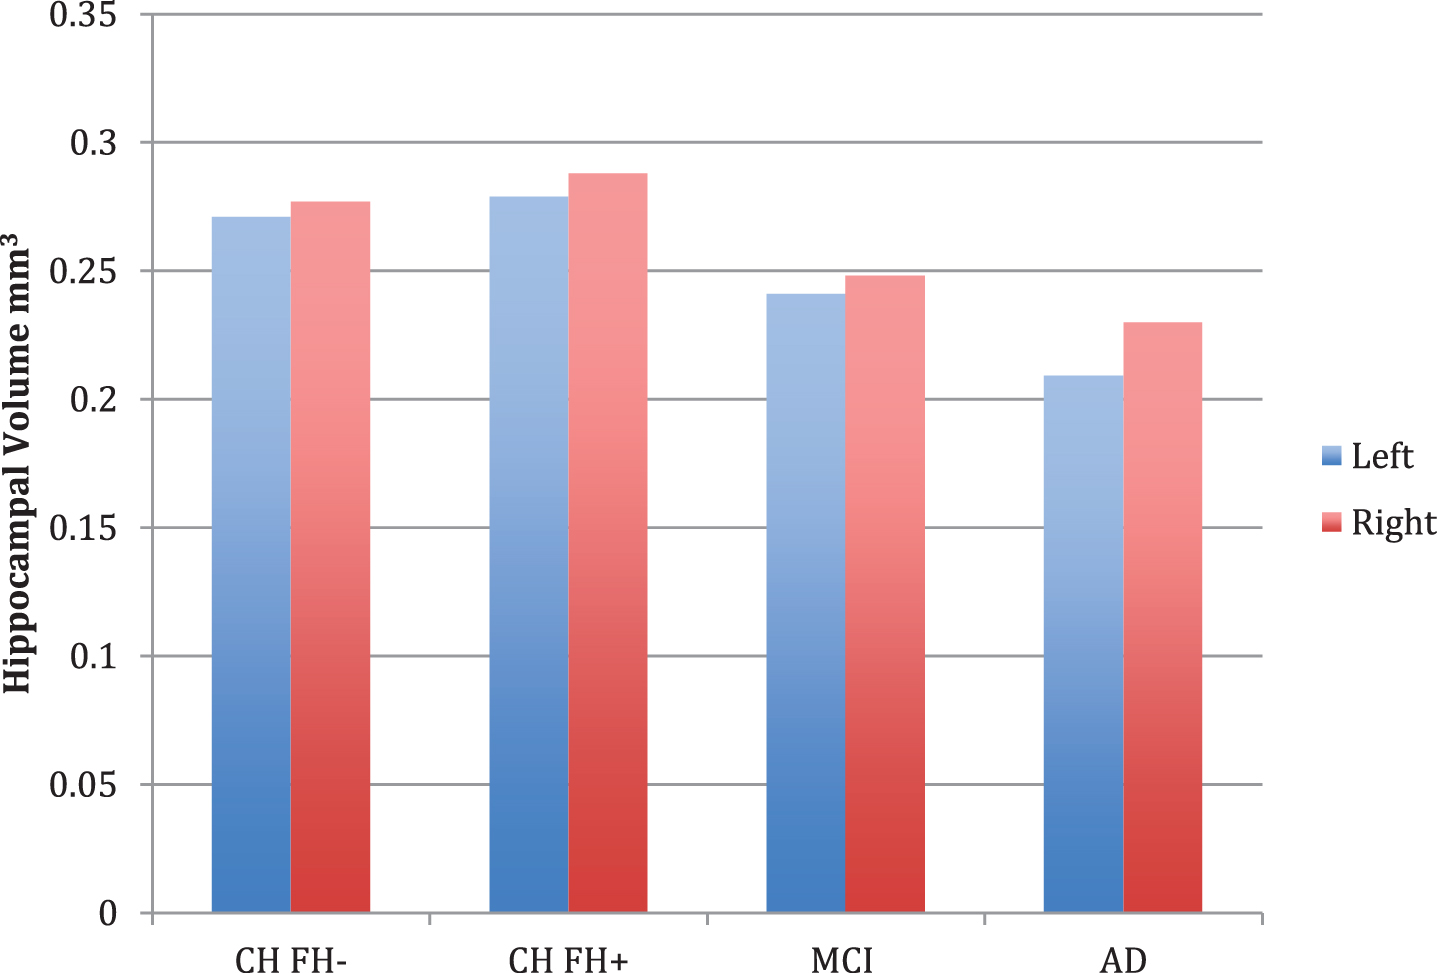
Diagnostic group differences (n = 84) were apparent in volumetric measures of overall gray and white matter, left entorhinal cortex thickness, left amygdala, left and right hippocampus, and left and right hippocampal occupancy score (Table 2). Post-hoc contrast analysis demonstrated a linear relationship for lower volume across risk groups in the (FH- > FH+ > aMCI > AD), with the strongest finding in the left and right HOC (p < 0.001). There were significant differences in the left and right hippocampus across the four groups (p < 0.001 on left, p = 0.011 on right), however not between the CH FH+ and CH FH- groups (Fig. 1). In our subgroup analyses, there were no volumetric differences in FH+ and FH- groups (Table 2).
Table 2
Volumetric analysis between groups
| ND FH- | ND FH+ | aMCI | AD | FH- versus FH+ | Linear | Non-Linear | |
| 12 | 16 | 31 | 25 | p | p | p | |
| Gray Matter Volume* | 0.413 (0.04) | 0.421 (0.03) | 0.399 (0.07) | 0.315 (0.14) | 0.869 | 0.001 | <0.001 |
| White Matter Volume* | 0.322 (0.02) | 0.325 (0.03) | 0.316 (0.04) | 0.288 (0.05) | 0.935 | 0.007 | 0.006 |
| Left Entorhinal Cortex* | 0.127 (0.02) | 0.139 (0.02) | 0.109 (0.02) | 0.100 (0.03) | 0.122 | 0.003 | <0.001 |
| Right Entorhinal Cortex | 0.118 (0.02) | 0.126 (0.02) | 0.105 (0.02) | 0.104 (0.03) | 0.379 | – | – |
| Left Amygdala* | 0.106 (0.02) | 0.109 (0.01) | 0.092 (0.02) | 0.085 (0.02) | 0.808 | 0.002 | 0.071 |
| Right Amygdala | 0.109 (0.02) | 0.106 (0.01) | 0.093 (0.02) | 0.095 (0.03) | 0.334 | – | – |
| Left Hippocampus | 0.271 (0.04) | 0.279 (0.03) | 0.241 (0.05) | 0.209 (0.04) | 0.916 | 0.001 | 0.000 |
| Right Hippocampus | 0.277 (0.03) | 0.288 (0.03) | 0.248 (0.05) | 0.230 (0.05) | 0.569 | 0.011 | 0.004 |
| Left HOC* | 0.890 (0.09) | 0.923 (0.04) | 0.759 (0.13) | 0.668 (0.13) | 0.261 | <0.001 | <0.001 |
| Right HOC* | 0.908 (0.05) | 0.925 (0.04) | 0.766 (0.15) | 0.720 (0.13) | 0.343 | <0.001 | <0.001 |
All units in percent volume, standard deviation in parenthesis. Entorhinal cortex measurement reflects thickness (mm). Hippocampal occupancy score (HOC) is the ratio of hippocampal volume to the sum of hippocampal and inferior lateral ventricle volume. p < 0.05 in bold. *denotes significance in the omnibus test.
Fig. 1
Hippocampal volume measurements for cognitively healthy (CH) individuals (with (FH+) and without (FH-) a family history of late-onset AD, MCI, and AD. Bar graphs show covariate-adjusted hippocampal volume, normalized for intracranial volume. No comparisons between groups were significant.
Default mode network connectivity analysis
We first tested differences in FH+ versus FH-, then overall group differences with an omnibus ANOVA, controlling for age, sex, and scanner type. If no group effect was detected, we did not conduct post-hoc contrast analysis. If a group effect was detected, we tested for linear and non-linear contrasts across the 4 groups. Due to the equal proportion of APOE4 allele and reduced sample size of CH subjects with an APOE4 genotype (only two in each group), we did not include it as a covariate in our analyses.
PCC-seed
Analysis of resting-state low-frequency BOLD signal correlations between diagnostic groups in the full group of subjects (n = 78) did not identify group-wise differences in connectivity with the PCC seed, in either a linear or non-linear approach. However, PCC-seeded connectivity to the frontal ROI showed a significant difference between the FH+ and FH- conditions (p = 0.041). Table 3 includes all seeded connectivity that displayed significance in an overall group test, or in a test solely between family history status (an exhaustive list of all analyses is listed in Supplementary Table 1).
Table 3
Default mode network analysis between groups
| FH- | FH+ | aMCI | AD | FH+ | Linear FH- | Non-Linear | |
| versus FH- | > FH+ > | FH+ > FH- | |||||
| MCI > AD | > MCI > AD | ||||||
| PCC SEED | |||||||
| Left frontal | 0.309 (0.12) | 0.425 (0.16) | 0.329 (0.15) | 0.305 (0.12) | 0.041 | – | – |
| HIPPO SEED | |||||||
| Left PreC* | 0.405 (0.17) | 0.423 (0.18) | 0.363 (0.14) | 0.259 (0.16) | 0.776 | 0.022 | 0.009‡ |
| Right PreC* | 0.386 (0.16) | 0.408 (0.18) | 0.349 (0.14) | 0.237 (0.17) | 0.714 | 0.018 | 0.006‡ |
| Left M1* | 0.219 (0.12) | 0.318 (0.14) | 0.238 (0.15) | 0.187 (0.13) | 0.087 | 0.205 | 0.010‡ |
| Left frontal* | 0.239 (0.14) | 0.324 (0.14) | 0.222 (0.13) | 0.174 (0.11) | 0.142 | 0.088 | 0.004‡ |
| Left ACC* | 0.281 (0.18) | 0.360 (0.15) | 0.231 (0.14) | 0.190 (0.12) | 0.194 | 0.056 | 0.004‡ |
| Right DLPFC | 0.179 (0.13) | 0.302 (0.16) | 0.222 (0.15) | 0.177 (0.14) | 0.027 | – | – |
| DMN* | 0.278 (0.13) | 0.335 (0.15) | 0.253 (0.12) | 0.194 (0.11) | 0.284 | 0.054 | 0.005‡ |
| PREC SEED | |||||||
| Right DLPFC* | 0.336 (0.12) | 0.457 (0.15) | 0.368 (0.18) | 0.322 (0.14) | 0.038 | 0.391 | 0.025 |
| Left M1* | 0.260 (0.13) | 0.392 (0.15) | 0.359 (0.19) | 0.278 (0.13) | 0.036 | 0.578 | 0.045 |
| Right hippo* | 0.280 (0.12) | 0.308 (0.14) | 0.261 (0.13) | 0.189 (0.09) | 0.695 | 0.039 | 0.014‡ |
Values represent mean z-transformed correlation coefficient (standard deviation) between the seed region (capitalized, left aligned) and target region. PCC, posterior cingulate cortex; hippo, hippocampus; PreC, precuneus; M1, primary motor cortex; ACC, anterior cingulate cortex; frontal, middle and superior frontal cortex; DLPFC, dorsolateral prefrontal cortex; DMN, default mode network. p < 0.05 in bold. *indicates significance in the omnibus test. ‡ indicates results that survived multiple comparisons.
Hippocampal-seed
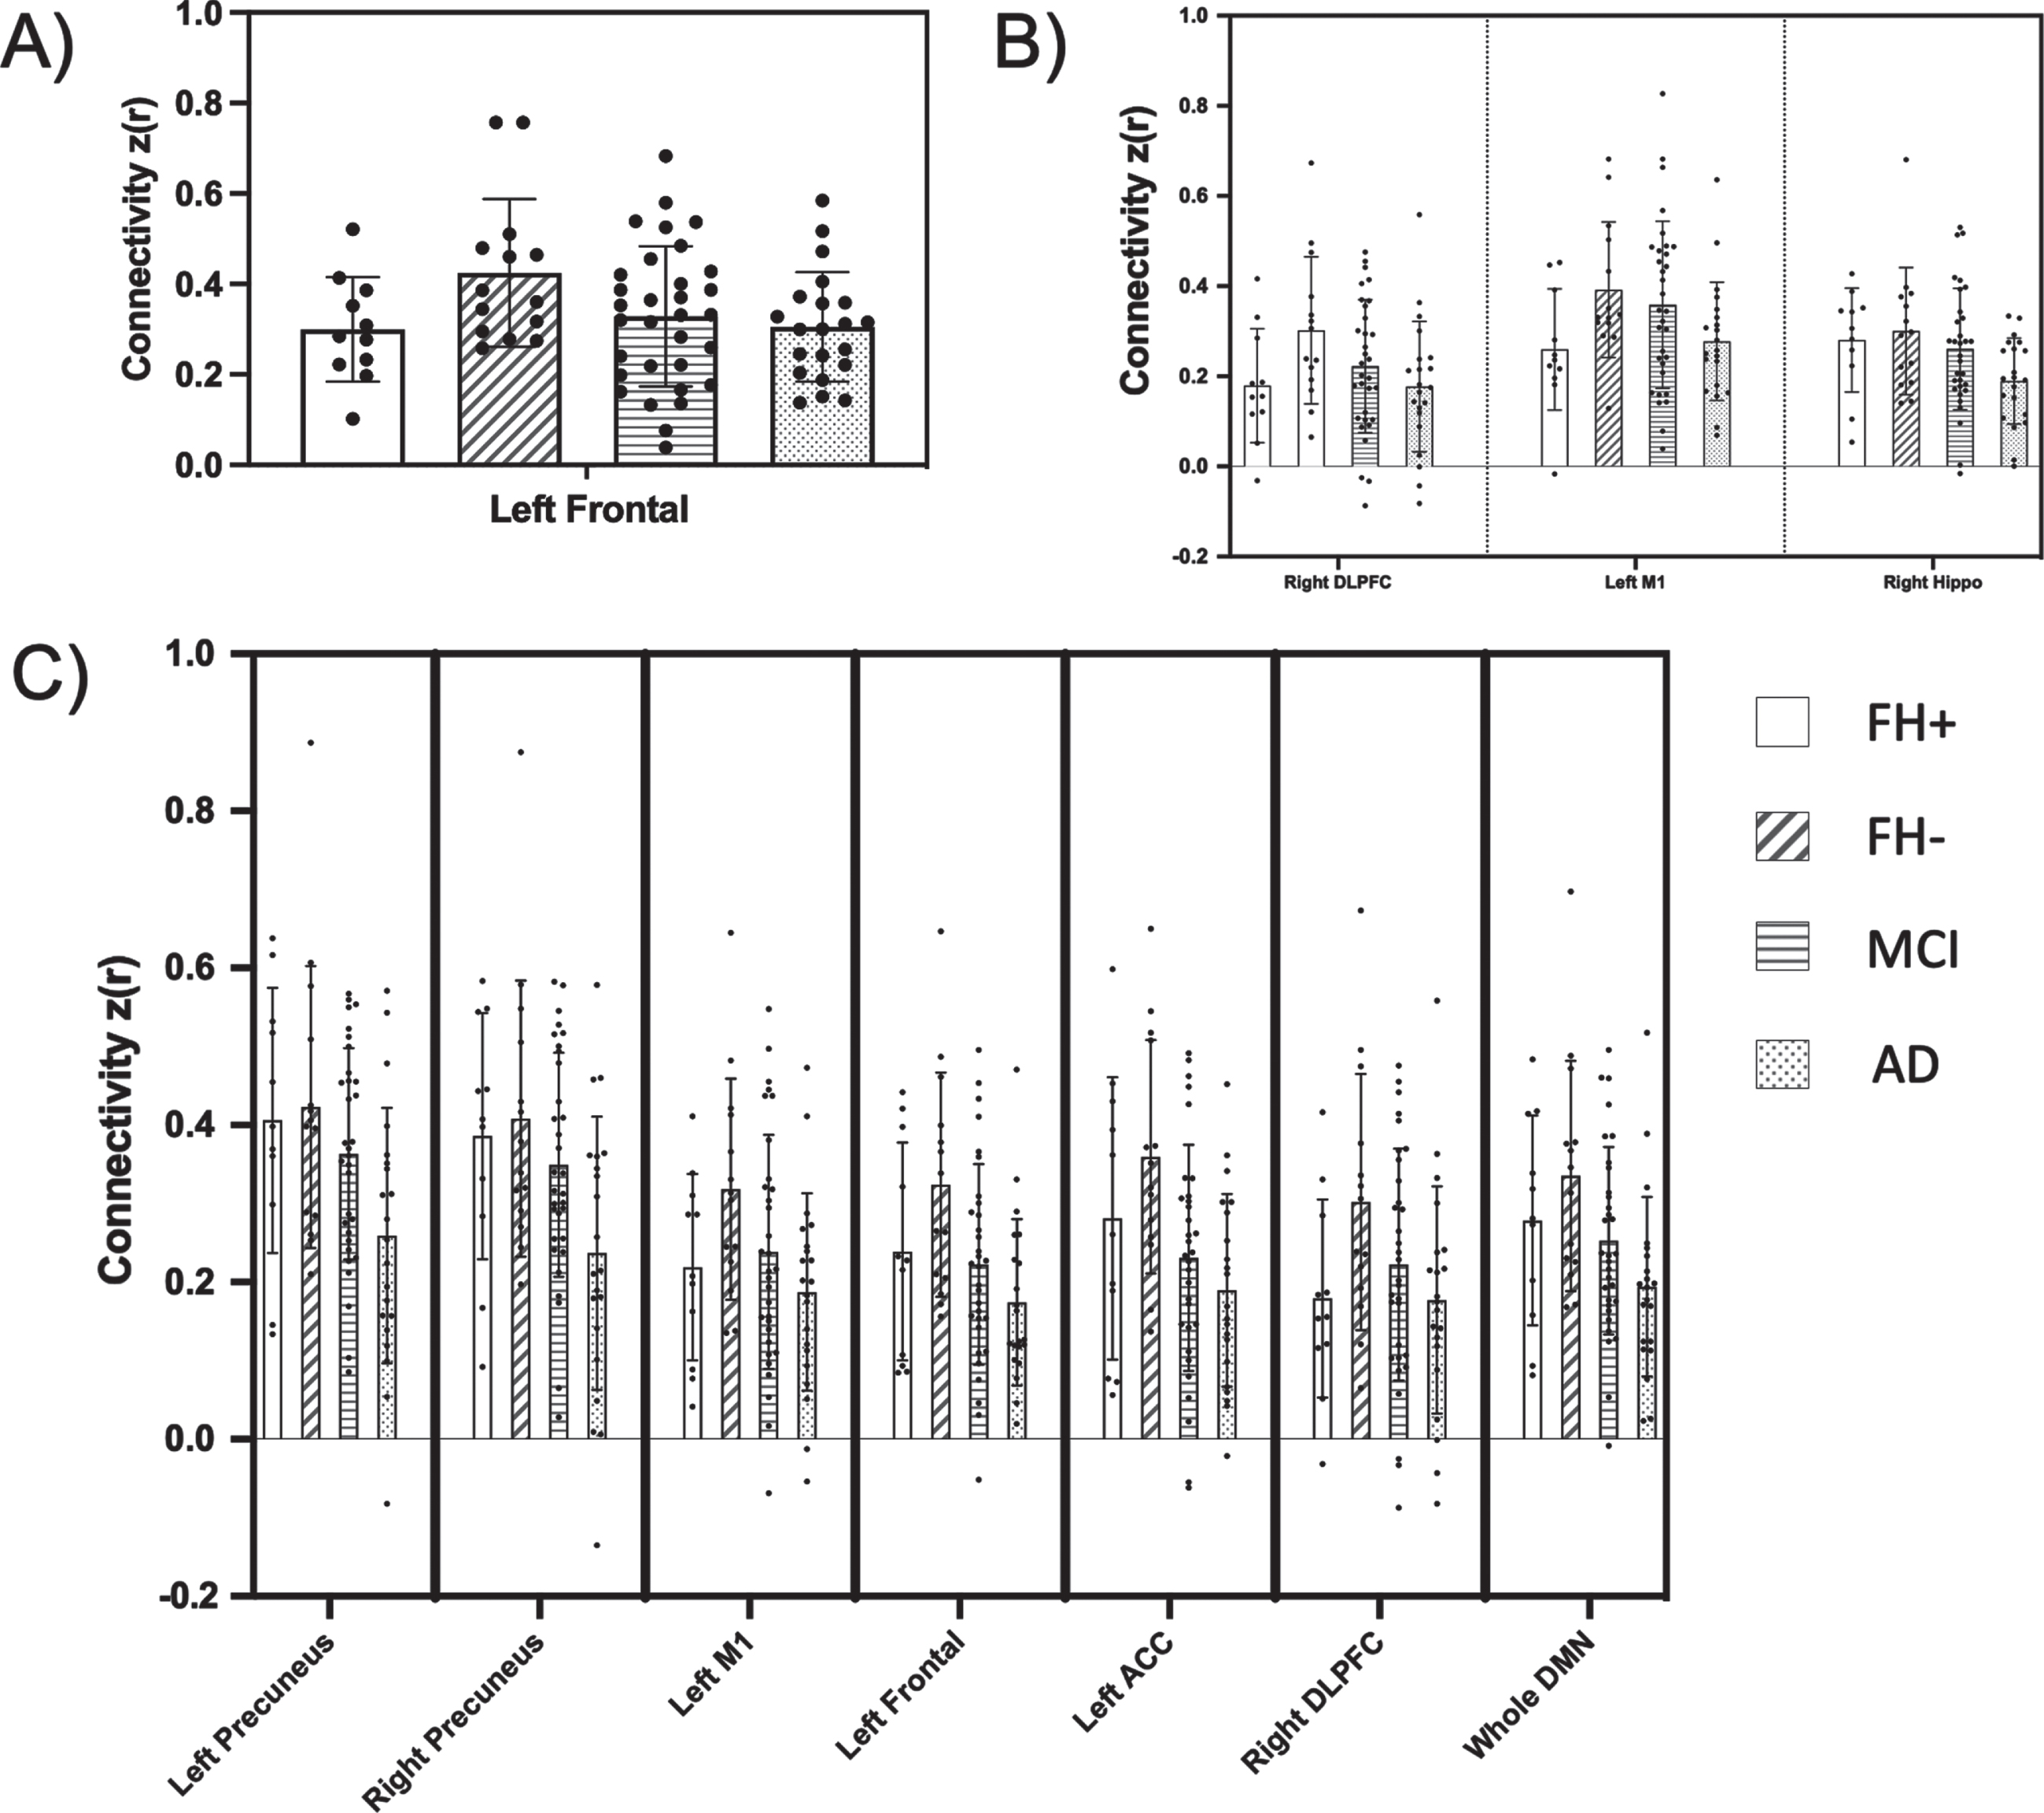
In contrast, the omnibus test revealed several overall diagnostic group differences in hippocampal seed connectivity, namely between the hippocampus seed and regions including left anterior cingulate cortex (p = 0.010), left frontal (p = 0.022), left M1 (p = 0.038), and bilateral precuneus (left, p = 0.018; right, p = 0.008). The hippocampal seed was also significantly correlated with the DMN as a whole (p = 0.027). We performed post-hoc contrast analyses, allowing us to test for differences in means between groups. In our initial contrast analysis, we tested for a ‘linear trend’ of decreasing connectivity across diagnostic groups in a stepwise, ordered fashion (FH- > FH+ > aMCI > AD). However, a ‘nonlinear trend’ of means, where connectivity in the FH+ group was expected to be higher than the FH- group was a much better fit (FH- > FH+ > aMCI > AD) for all hippocampus-seeded connectivity. This non-linear trend for connectivities that emerged as significant in the FH comparison, or in the overall MANCOVA, is visualized clearly in Fig. 2 (visualization of all comparisons made across all three seeds is included in Supplementary Figures 1–3). Because hippocampal volume was significantly decreased in the AD group compared to CH and aMCI, we did an additional analysis including hippocampal volume as a covariate. The results did not change (data not shown). Despite the significant non-linear fit of these networks, hippocampus-seeded connectivity to these regions did not differ between FH groups alone. However, hippocampus-seeded connectivity to right DLPFC, which failed the omnibus test for overall group differences, did display a significant difference between FH groups alone (p = 0.027).
Fig. 2
Functional connectivity compared across family history and cognitive impairment groups. Resting state regional connectivity of all comparisons found to be significant in either the FH direct comparison (t-test) or overall MANCOVA. Bar graphs display the mean z-transformed correlation coefficients (y-axis), with individual data points plotted. Each panel corresponds to a different seed (A, posterior cingulate cortex; B, precuneus; C, hippocampus). The x-axis shows which ROI is represented (PCC, posterior cingulate cortex; hippo, hippocampus; PreC, precuneus; M1, primary motor cortex; ACC, anterior cingulate cortex; frontal, middle and superior frontal cortex; DLPFC, dorsolateral prefrontal cortex; DMN, default mode network).
Precuneus-seed
Precuneus-seeded connectivity to two regions, right DLPFC and left M1, displayed significance in both the overall omnibus and subsequent contrast (non-linear trend) analysis (p = 0.025 and p = 0.045, respectively). Additionally, a significant difference between connectivity in these two networks was found when comparing directly between the FH- and FH+ groups (precuneus-right DLPFC, p = 0.038; precuneus-left M1, p = 0.036). While precuneus-seeded connectivity to right hippocampus showed significance in the omnibus and post-hoc tests (p = 0.014), it failed to show FH group differences (p = 0.695).
DISCUSSION
We hypothesized that cognitively healthy, FH+ individuals would have decreased hippocampal volume and decreased DMN connectivity, similar to other AD risk groups [26]. Contrary to our hypothesis, we found that cognitively healthy, FH+ individuals had no significant volumetric differences compared to FH- individuals, and actually had higher DMN connectivity. This trend was most evident in connectivity between a precuneus seed and the right DLPFC and left M1. In contrast, MCI subjects had a distinctly different profile with overall decreased DMN connectivity and lower medial temporal volumes. As expected, we found that individuals with AD had significantly decreased medial temporal lobe volume, as well as significantly decreased DMN connectivity. Moreover, we found that hippocampal-seeded connectivity was significantly more compromised in AD subjects than PCC-seeded connectivity within the DMN, and this abnormal connectivity was not completely attributable to medial temporal structure volume loss.
DMN connectivity across the AD spectrum
We sought to characterize structural and neural network differences between cognitively healthy (both high and low risk), aMCI and AD individuals. While the probing of functional connectivity patterns across the spectrum of disease are not new, we hoped to add to this limited body of evidence by including dementia-free individuals with and without genetic risk of AD. A large number of studies have shown that an overall decrease in DMN connectivity is a hallmark imaging marker for AD [44, 45]. It is complicated to characterize the initial location of network deterioration along the various stages of AD, and thus identifying a ‘risk’ biomarker for DMN connectivity depends on the regions investigated, and the stage of the disease. For instance, a recent study using left and right hippocampal ‘seeds’ for DMN connectivity analysis found that, across several stages of AD, there was a continuous decrease in connectivity between the hippocampus and the parietal cortices, namely in the later stages of AD. In addition, they found increases in hippocampal-seeded resting state connectivity with the temporal and frontal lobes in aMCI [42]. Longitudinal studies of the DMN have shown some initial increases in functional connectivity in the anterior DMN in AD, followed by decreased functional connectivity in both the anterior and posterior DMN over time compared to cognitively healthy subjects [46]. In the context of the existing literature, we suggest that DMN connectivity as measured by functional neuroimaging follows a nonlinear pattern of change across the risk spectrum [26]. Our work here highlights differences in precuneus to frontal connectivity across the full spectrum of AD, along with small differences in connectivity between the posterior and frontal cortices.
DMN connectivity between FH groups
A growing number of studies have identified structural, metabolic, and amyloid-plaque changes in the posterior cingulate and precuneus, hubs of the DMN network, in individuals with a family history of AD [6, 8, 9]. Moreover, otherwise healthy middle-aged individuals with a maternal family history of AD have hypoperfusion, a measurement of cerebral blood flow that indicates the metabolic state in the brain, in the hippocampus and parieto-temporal regions compared to those with no family history of AD [47]. As neuropathological changes mount and an individual is classified as having aMCI, hippocampal-DMN connectivity may remain high or increase [42]. However, as cognition continues to decline, hippocampal-DMN connectivity falters, evidenced in individuals in this study with probable AD.
Results from this study are inconsistent with previous work demonstrating hippocampal connectivity differences in at risk individuals. Aside from the right DLPFC, our hippocampal seed failed to show connectivity differences in a direct comparison of FH- to FH+, even where the test for the overall non-linear model of connectivity had suggested increased connectivity in FH+ with decreases as AD progresses. A recent study on FH and resting state connectivity with a larger group of cognitively healthy subjects did not find connectivity differences between the PCC and medial prefrontal cortex [48]; however, they did not include the middle frontal and superior frontal gyri in their regions of interest, as this analysis did. Some studies have shown that individuals in the early stages of AD have an increase in connectivity, albeit temporary, between the PCC and frontal cortex [49] (specifically the left in two studies [50]). A study on longitudinal changes in the DMN with aging showed increases in connectivity over the course of several years across most brain regions in controls compared to AD subjects, possibly reflecting aging-related functional compensation that, quite possibly, is exacerbated, albeit on a small scale, in our at-risk cognitively healthy subjects [49]. In the present study, this trend may be mirrored in the results of precuneus-seeded connectivity to right DLPFC and left M1, which showed significant increases in FH+ individuals as compared to FH- individuals, but which clearly decreased in MCI and AD groups. That said, the current study’s post-hoc exploratory analysis correlating DMN connectivity with cognitive performance did not reveal any significant relationship. This was most likely due to low power to study the FH groups, and possibly a lack of variance on cognitive scores in the cognitively healthy group as a whole. Thus, further studies will be necessary to clarify the nature of increased DMN connectivity in family history-associated AD risk.
Volumetric analysis
Of several volumetric measures chosen for this study, we found that overall gray matter, left entorhinal cortex thickness, left amygdala, and bilateral hippocampal occupancy measurements were significantly decreased in individuals with MCI, intermediate to individuals with early AD, who had more decreased volume in all regions investigated. These regionally specific decreases in volume and thickness in MCI, in the presence of DMN decreased connectivity, fit with a growing literature suggesting an initial decrease in entorhinal cortex thickness in preclinical AD, accompanied shortly after by DMN [49]. In light of these progressive processes, we expected to see decreased entorhinal cortex thickness in our FH+ individuals; however, there was no relationship between FH of AD and the medial temporal lobe in our sample.
In this cross-sectional analysis, we did not identify significant medial temporal cortex volume or entorhinal cortex thickness differences between FH- and FH+ cognitively healthy individuals. We and others have previously reported an effect of a family history of AD on medial temporal cortex volume, with mixed results. A recent study in cognitively healthy individuals did find differences in entorhinal cortex thickness or hippocampal volume in FH+ and FH- groups, similar to the current results [26]. In a cross-sectional study of FH+ individuals, Lampert et al. [51]. did not find an effect on hippocampal volume; however, they included CH, MCI, and AD groups in their analysis. In a previous, larger cross-sectional study of FH in cognitively healthy subjects (different cohort than the current study), we found a relationship of FH with brain volume in several regions (parietal, frontal, temporal), but not in the hippocampus [8].
There have also been conflicting reports on preclinical atrophy occurring in cognitively healthy, FH+ individuals. For instance, we did find an effect of FH (namely maternal FH) on parahippocampal atrophy in cognitively healthy subjects [5]. Two other studies have found significant effects of FH status on atrophy in the hippocampus, independent of APOE4, the latter study only in cognitively healthy subjects, and particularly driven by the FH maternal group. However, a recent study from a large sample of MCI individuals in the ADNI dataset did not find any family history-specific effect on regional atrophy, neither in the hippocampus or any other region, that was independent of APOE4 [54]. In this study, we only analyzed family history data in cognitively healthy individuals to avoid other confounding variables associated with MCI and AD that may affect assumptions about risk, and we did not find an effect of FH on overall gray or white matter volume, or volume in the hippocampal, amygdala, or entorhinal cortex, similar to our cross-sectional study of volume in a larger sample of cognitively healthy individuals [8]. Measures of longitudinal atrophy may be more robust characterizations of AD risk and thus discernable in otherwise healthy individuals with a family history of AD. Moreover, it may be particularly pertinent to tease out maternal versus paternal family history effects, as a majority of studies have pointed to maternal family history-specific AD biomarkers.
Limitations
Major limitations of this current study include the small number of subjects in the FH- and FH+ groups and the cross-sectional nature of the study. We believe the limited sample size restricted our ability to find significant differences between the FH- and FH+ that survive multiple comparisons. Post-hoc power analyses were performed in G*Power 3 to calculate specifically what effect sizes would be necessary to find significant differences in mean connectivity between the FH- and FH+ groups. Given an α of 0.05 an effect size (Cohen’s d) of 1.18 would be required to meet a power of 80% (1.39 considering multiple comparisons). Within our direct comparisons between these two groups, the highest observed effect size (precuneus-to-left M1) was only d = 0.89, corresponding to an achieved power of 56% (37% when adjusting for multiple comparisons). Thus, our power was likely too limited to detect a meaningful group difference if one indeed existed. Future studies should prioritize a larger sample size to confidently avoid false negative results, especially when considering the need for multiple comparisons corrections when investigating multiple seed regions. To achieve a power of 80% at an effect size of 0.89, while adjusting for multiple comparisons, a future study on functional connectivity differences between FH- and FH+ individuals alone would require an N of 58. While future studies will need to focus on replicating these effects in sufficiently large samples, we believe the results provided here lay the groundwork for future investigation into early neuroimaging changes in those with a family historyof AD.
Due to the small sample size, no direct correlations could be made between the role of APOE4 and functional or structural differences between the diagnosis groups. Moreover, there could be other genetic factors other than APOE4 that could contribute to AD-risk related brain change. There are a number of coordinated brain networks other than the DMN which we did not analyze in this study, as we wanted to limit the number of tests run on our small sample of subjects to the most commonly studied network in AD [18, 55]. Some of the limitations to this cross-sectional study include our inability to make causal or temporal links between imaging phenotypes and risk or progression of AD, and we are unable to infer any causality. Our future studies will include other networks, as well as longitudinal data, to explore and localize the nature of brain aging in individuals at risk for AD. We were limited in our characterization of family history to a questionnaire; thus, it is possible that some participants whose parents had dementia other than AD were included. Ideally, we would have diagnostic confirmation with neuropathological examination, however this was not available. We also recognize that there appears to be a global connectivity increase (Fig. 1, Supplementary Figures 1 and 2) across all connectivity values for the cognitively healthy groups. We would point out that few of these apparent increases in connectivity are significant, evident in our model testing.
Conclusions
We present distinct structural and functional brain imaging profiles for two AD-risk groups; cognitively healthy, FH+ individuals, and individuals with aMCI. We identified a nonlinear pattern of hippocampal connectivity to DMN nodes in across the AD spectrum, with cognitively healthy, FH+ individuals demonstrating increased connectivity in the DMN, with no decreases in hippocampal volume or cognitive performance. Precuneus-seeded connectivity to the right DLPFC and left primary motor cortex differed across FH- and FH+ individuals without dementia. Individuals at familial risk for AD may be in an intermediate stage of risk, possibly exhibiting compensatory brain activity prior to the level of intermediate decline evident in individuals with aMCI. Further connectivity analyses between hippocampus and DMN regions may ultimately be a more effective biomarker of preclinical change for those at risk for AD due to family history.
ACKNOWLEDGMENTS
This project is supported by funding from the National Institute on Aging, including R01AG062548 and R00AG050490 (JKM), R01AG052954 (JMB), R21AG061548 (EDV), and P30AG035982 (KU Alzheimer’s Disease Research Center).
Authors’ disclosures available online (https://www.j-alz.com/manuscript-disclosures/21-0326r3).
SUPPLEMENTARY MATERIAL
[1] The supplementary material is available in the electronic version of this article: https://dx.doi.org/10.3233/JAD-210326.
REFERENCES
[1] | Cupples LA , Farrer LA , Sadovnick AD , Relkin N , Whitehouse P , Green RC ((2004) ) Estimating risk curves for first-degree relatives of patients with Alzheimer’s disease: The REVEAL study. Genet Med 6: , 192–196. |
[2] | Liu JZ , Erlich Y , Pickrell JK ((2017) ) Case-control association mapping by proxy using family history of disease. Nat Genet 49: , 325–331. |
[3] | Jansen IE , Savage JE , Watanabe K , Bryois J , Williams DM , Steinberg S , Sealock J , Karlsson IK , Hägg S , Athanasiu L , Voyle N , Proitsi P , Witoelar A , Stringer S , Aarsland D , Almdahl IS , Andersen F , Bergh S , Bettella F , Bjornsson S , Brækhus A , Bråthen G , de Leeuw C , Desikan RS , Djurovic S , Dumitrescu L , Fladby T , Hohman TJ , Jonsson PV , Kiddle SJ , Rongve A , Saltvedt I , Sando SB , Selbæk G , Shoai M , Skene NG , Snaedal J , Stordal E , Ulstein ID , Wang Y , White LR , Hardy J , Hjerling-Leffler J , Sullivan PF , van der Flier WM , Dobson R , Davis LK , Stefansson H , Stefansson K , Pedersen NL , Ripke S , Andreassen OA , Posthuma D ((2019) ) Genome-wide meta-analysis identifies new loci and functional pathways influencing Alzheimer’s disease risk. Nat Genet 51: , 404–413. |
[4] | Marioni RE , Harris SE , Zhang Q , McRae AF , Hagenaars SP , Hill WD , Davies G , Ritchie CW , Gale CR , Starr JM , Goate AM , Porteous DJ , Yang J , Evans KL , Deary IJ , Wray NR , Visscher PM ((2018) ) GWAS on family history of Alzheimer’s disease. Transl Psychiatry 8: , 99. |
[5] | Honea RA , Swerdlow RH , Vidoni ED , Burns JM ((2011) ) Progressive regional atrophy in normal adults with a maternal history of Alzheimer disease. Neurology 76: , 822–829. |
[6] | Mosconi L , Rinne JO , Tsui WH , Berti V , Li Y , Wang H , Murray J , Scheinin N , Nagren K , Williams S , Glodzik L , De Santi S , Vallabhajosula S , de Leon MJ ((2010) ) Increased fibrillar amyloid-{beta} burden in normal individuals with a family history of late-onset Alzheimer’s. Proc Natl Acad Sci U S A 107: , 5949–5954. |
[7] | Mosconi L , Mistur R , Switalski R , Tsui WH , Glodzik L , Li Y , Pirraglia E , De Santi S , Reisberg B , Wisniewski T , de Leon MJ ((2009) ) FDG-PET changes in brain glucose metabolism from normal cognition to pathologically verified Alzheimer’s disease. Eur J Nucl Med Mol Imaging 36: , 811–822. |
[8] | Honea RA , Swerdlow RH , Vidoni ED , Goodwin J , Burns JM ((2010) ) Reduced gray matter volume in normal adults with a maternal family history of Alzheimer disease. Neurology 74: , 113–120. |
[9] | Honea RA , Vidoni ED , Swerdlow RH , Burns JM ((2012) ) Maternal family history is associated with Alzheimer’s disease biomarkers. J Alzheimers Dis 31: , 659–668. |
[10] | Maye JE , Betensky RA , Gidicsin CM , Locascio J , Becker JA , Pepin L , Carmasin J , Rentz DM , Marshall GA , Blacker D , Sperling RA , Johnson KA ((2016) ) Maternal dementia age at onset in relation to amyloid burden in non-demented elderly offspring. Neurobiol Aging 40: , 61–67. |
[11] | Mosconi L , Brys M , Switalski R , Mistur R , Glodzik L , Pirraglia E , Tsui W , De Santi S , de Leon MJ ((2007) ) Maternal family history of Alzheimer’s disease predisposes to reduced brain glucose metabolism. Proc Natl Acad Sci U S A 104: , 19067–19072. |
[12] | Mosconi L , De Santi S , Brys M , Tsui WH , Pirraglia E , Glodzik-Sobanska L , Rich KE , Switalski R , Mehta PD , Pratico D , Zinkowski R , Blennow K , de Leon MJ ((2008) ) Hypometabolism and altered cerebrospinal fluid markers in normal apolipoprotein E E4 carriers with subjective memory complaints. Biol Psychiatry 63: , 609–618. |
[13] | Mosconi L , Glodzik L , Mistur R , McHugh P , Rich KE , Javier E , Williams S , Pirraglia E , De Santi S , Mehta PD , Zinkowski R , Blennow K , Pratico D , de Leon MJ ((2010) ) Oxidative stress and amyloid-beta pathology in normal individuals with a maternal history of Alzheimer’s. Biol Psychiatry 68: , 913–921. |
[14] | Mosconi L , Mistur R , Switalski R , Brys M , Glodzik L , Rich K , Pirraglia E , Tsui W , De Santi S , de Leon MJ ((2009) ) Declining brain glucose metabolism in normal individuals with a maternal history of Alzheimer disease. Neurology 72: , 513–520. |
[15] | Mosconi L , Tsui W , Murray J , McHugh P , Li Y , Williams S , Pirraglia E , Glodzik L , De Santi S , Vallabhajosula S , de Leon MJ ((2012) ) Maternal age affects brain metabolism in adult children of mothers affected by Alzheimer’s disease. Neurobiol Aging 33: , 624 e621–629. |
[16] | Raichle ME , MacLeod AM , Snyder AZ , Powers WJ , Gusnard DA , Shulman GL ((2001) ) A default mode of brain function. Proc Natl Acad Sci U S A 98: , 676–682. |
[17] | Küblböck M , Woletz M , Höflich A , Sladky R , Kranz GS , Hoffmann A , Lanzenberger R , Windischberger C ((2014) ) Stability of low-frequency fluctuation amplitudes in prolonged resting-state fMRI. Neuroimage 103: , 249–257. |
[18] | Buckner RL , Andrews-Hanna JR , Schacter DL ((2008) ) The brain’s default network: Anatomy, function, and relevance to disease. Ann N Y Acad Sci 1124: , 1–38. |
[19] | Pereira JB , Ossenkoppele R , Palmqvist S , Strandberg TO , Smith R , Westman E , Hansson O ((2019) ) Amyloid and tau accumulate across distinct spatial networks and are differentially associated with brain connectivity. Elife 8: , e50830. |
[20] | Buckner RL , Sepulcre J , Talukdar T , Krienen FM , Liu H , Hedden T , Andrews-Hanna JR , Sperling RA , Johnson KA ((2009) ) Cortical hubs revealed by intrinsic functional connectivity: Mapping, assessment of stability, and relation to Alzheimer’s disease. J Neurosci 29: , 1860–1873. |
[21] | Sperling RA , Laviolette PS , O’Keefe K , O’Brien J , Rentz DM , Pihlajamaki M , Marshall G , Hyman BT , Selkoe DJ , Hedden T , Buckner RL , Becker JA , Johnson KA ((2009) ) Amyloid deposition is associated with impaired default network function in older persons without dementia. Neuron 63: , 178–188. |
[22] | Palmqvist S , Schöll M , Strandberg O , Mattsson N , Stomrud E , Zetterberg H , Blennow K , Landau S , Jagust W , Hansson O ((2017) ) Earliest accumulation of β-amyloid occurs within the default-mode network and concurrently affects brain connectivity. Nat Commun 8: , 1214. |
[23] | Celone KA , Calhoun VD , Dickerson BC , Atri A , Chua EF , Miller SL , DePeau K , Rentz DM , Selkoe DJ , Blacker D , Albert MS , Sperling RA ((2006) ) Alterations in memory networks in mild cognitive impairment and Alzheimer’s disease: An independent component analysis. J Neurosci 26: , 10222–10231. |
[24] | Das SR , Pluta J , Mancuso L , Kliot D , Orozco S , Dickerson BC , Yushkevich PA , Wolk DA ((2013) ) Increased functional connectivity within medial temporal lobe in mild cognitive impairment. Hippocampus 23: , 1–6. |
[25] | Fleisher AS , Sherzai A , Taylor C , Langbaum JB , Chen K , Buxton RB ((2009) ) Resting-state BOLD networks versus task-associated functional MRI for distinguishing Alzheimer’s disease risk groups. Neuroimage 47: , 1678–1690. |
[26] | Wang L , Roe CM , Snyder AZ , Brier MR , Thomas JB , Xiong C , Benzinger TL , Morris JC , Ances BM ((2012) ) Alzheimer disease family history impacts resting state functional connectivity. Ann Neurol 72: , 571–577. |
[27] | Verfaillie SCJ , Pichet Binette A , Vachon-Presseau E , Tabrizi S , Savard M , Bellec P , Ossenkoppele R , Scheltens P , van der Flier WM , Breitner JCS , Villeneuve S , PREVENT-AD Research Group ((2018) ) Subjective cognitive decline is associated with altered default mode network connectivity in individuals with a family history of Alzheimer’s disease. Biol Psychiatry Cogn Neurosci Neuroimaging 3: , 463–472. |
[28] | Zhou Y , Dougherty JH Jr. , Hubner KF , Bai B , Cannon RL , Hutson RK ((2008) ) Abnormal connectivity in the posterior cingulate and hippocampus in early Alzheimer’s disease and mild cognitive impairment. Alzheimers Dement 4: , 265–270. |
[29] | Bai F , Zhang Z , Yu H , Shi Y , Yuan Y , Zhu W , Zhang X , Qian Y ((2008) ) Default-mode network activity distinguishes amnestic type mild cognitive impairment from healthy aging: A combined structural and resting-state functional MRI study. Neurosci Lett 438: , 111–115. |
[30] | Vidoni ED , Johnson DK , Morris JK , Van Sciver A , Greer CS , Billinger SA , Donnelly JE , Burns JM ((2015) ) Dose-response of aerobic exercise on cognition: A community-based, pilot randomized controlled trial. PLoS One 10: , e0131647. |
[31] | Morris JK , Vidoni ED , Johnson DK , Van Sciver A , Mahnken JD , Honea RA , Wilkins HM , Brooks WM , Billinger SA , Swerdlow RH , Burns JM ((2017) ) Aerobic exercise for Alzheimer’s disease: A randomized controlled pilot trial. PLoS One 12: , e0170547. |
[32] | Morris JK , Zhang G , Dougherty RJ , Mahnken JD , John CS , Lose SR , Cook DB , Burns JM , Vidoni ED , Okonkwo O ((2020) ) Collective effects of age, sex, genotype, and cognitive status on fitness outcomes. Alzheimers Dement (Amst) 12: , e12058. |
[33] | Vidoni ED , Van Sciver A , Johnson DK , He J , Honea R , Haines B , Goodwin J , Laubinger MP , Anderson HS , Kluding PM , Donnelly JE , Billinger SA , Burns JM ((2012) ) A community-based approach to trials of aerobic exercise in aging and Alzheimer’s disease. Contemp Clin Trials 33: , 1105–1116. |
[34] | Morris JC ((1993) ) The Clinical Dementia Rating (CDR): Current version and scoring rules. Neurology 43: , 2412b–2414. |
[35] | Weintraub S , Salmon D , Mercaldo N , Ferris S , Graff-Radford NR , Chui H , Cummings J , DeCarli C , Foster NL , Galasko D , Peskind E , Dietrich W , Beekly DL , Kukull WA , Morris JC ((2009) ) The Alzheimer’s Disease Centers’ Uniform Data Set (UDS): The neuropsychologic test battery. Alzheimer Dis Assoc Disord 23: , 91–101. |
[36] | Shirk SD , Mitchell MB , Shaughnessy LW , Sherman JC , Locascio JJ , Weintraub S , Atri A ((2011) ) A web-based normative calculator for the uniform data set (UDS) neuropsychological test battery. Alzheimers Res Ther 3: , 32. |
[37] | Fischl B , van der Kouwe A , Destrieux C , Halgren E , Segonne F , Salat DH , Busa E , Seidman LJ , Goldstein J , Kennedy D , Caviness V , Makris N , Rosen B , Dale AM ((2004) ) Automatically parcellating the human cerebral cortex. Cereb Cortex 14: , 11–22. |
[38] | Heister D , Brewer JB , Magda S , Blennow K , McEvoy LK ((2011) ) Predicting MCI outcome with clinically available MRI and CSF biomarkers. Neurology 77: , 1619–1628. |
[39] | Fischl B , Salat DH , Busa E , Albert M , Dieterich M , Haselgrove C , van der Kouwe A , Killiany R , Kennedy D , Klaveness S , Montillo A , Makris N , Rosen B , Dale AM ((2002) ) Whole brain segmentation: Automated labeling of neuroanatomical structures in the human brain. Neuron 33: , 341–355. |
[40] | Cox RW ((1996) ) AFNI: Software for analysis and visualization of functional magnetic resonance neuroimages. Comput Biomed Res 29: , 162–173. |
[41] | Fox MD , Snyder AZ , Vincent JL , Corbetta M , Van Essen DC , Raichle ME ((2005) ) The human brain is intrinsically organized into dynamic, anticorrelated functional networks. Proc Natl Acad Sci U S A 102: , 9673–9678. |
[42] | Sohn WS , Yoo K , Na DL , Jeong Y ((2014) ) Progressive changes in hippocampal resting-state connectivity across cognitive impairment: A cross-sectional study from normal to Alzheimer disease. Alzheimer Dis Assoc Disord 28: , 239–246. |
[43] | Sperling RA , Dickerson BC , Pihlajamaki M , Vannini P , LaViolette PS , Vitolo OV , Hedden T , Becker JA , Rentz DM , Selkoe DJ , Johnson KA ((2010) ) Functional alterations in memory networks in early Alzheimer’s disease. Neuromolecular Med 12: , 27–43. |
[44] | Greicius MD , Srivastava G , Reiss AL , Menon V ((2004) ) Default-mode network activity distinguishes Alzheimer’s disease from healthy aging: Evidence from functional MRI. Proc Natl Acad Sci U S A 101: , 4637–4642. |
[45] | Buckner RL , Snyder AZ , Shannon BJ , LaRossa G , Sachs R , Fotenos AF , Sheline YI , Klunk WE , Mathis CA , Morris JC , Mintun MA ((2005) ) Molecular, structural, and functional characterization of Alzheimer’s disease: Evidence for a relationship between default activity, amyloid, and memory. J Neurosci 25: , 7709–7717. |
[46] | Damoiseaux JS , Prater KE , Miller BL , Greicius MD ((2012) ) Functional connectivity tracks clinical deterioration in Alzheimer’s disease. Neurobiol Aging 33: , 828 e819–830. |
[47] | Okonkwo OC , Xu G , Oh JM , Dowling NM , Carlsson CM , Gallagher CL , Birdsill AC , Palotti M , Wharton W , Hermann BP , LaRue A , Bendlin BB , Rowley HA , Asthana S , Sager MA , Johnson SC ((2014) ) Cerebral blood flow is diminished in asymptomatic middle-aged adults with maternal history of Alzheimer’s disease. Cereb Cortex 24: , 978–988. |
[48] | Killiany RJ , Hyman BT , Gomez-Isla T , Moss MB , Kikinis R , Jolesz F , Tanzi R , Jones K , Albert MS ((2002) ) MRI measures of entorhinal cortex vs hippocampus in preclinical AD. Neurology 58: , 1188–1196. |
[49] | Balachandar R , John JP , Saini J , Kumar KJ , Joshi H , Sadanand S , Aiyappan S , Sivakumar PT , Loganathan S , Varghese M , Bharath S ((2015) ) A study of structural and functional connectivity in early Alzheimer’s disease using rest fMRI and diffusion tensor imaging. Int J Geriatr Psychiatry 30: , 497–504. |
[50] | Esposito R , Mosca A , Pieramico V , Cieri F , Cera N , Sensi SL ((2013) ) Characterization of resting state activity in MCI individuals. PeerJ 1: , e135. |
[51] | Lampert EJ , Roy Choudhury K , Hostage CA , Petrella JR , Doraiswamy PM , Alzheimer’s Disease Neuroimaging Initiative ((2013) ) Prevalence of Alzheimer’s pathologic endophenotypes in asymptomatic and mildly impaired first-degree relatives. PLoS One 8: , e60747. |
[52] | Andrawis JP , Hwang KS , Green AE , Kotlerman J , Elashoff D , Morra JH , Cummings JL , Toga AW , Thompson PM , Apostolova LG ((2012) ) Effects of ApoE4 and maternal history of dementia on hippocampal atrophy. Neurobiol Aging 33: , 856–866. |
[53] | Okonkwo OC , Xu G , Dowling NM , Bendlin BB , Larue A , Hermann BP , Koscik R , Jonaitis E , Rowley HA , Carlsson CM , Asthana S , Sager MA , Johnson SC ((2012) ) Family history of Alzheimer disease predicts hippocampal atrophy in healthy middle-aged adults. Neurology 78: , 1769–1776. |
[54] | Lampert EJ , Roy Choudhury K , Hostage CA , Rathakrishnan B , Weiner M , Petrella JR , Doraiswamy PM , Alzheimer’s Disease Neuroimaging Initiative ((2014) ) Brain atrophy rates in first degree relatives at risk for Alzheimer’s. Neuroimage Clin 6: , 340–346. |
[55] | Zhu DC , Majumdar S , Korolev IO , Berger KL , Bozoki AC ((2013) ) Alzheimer’s disease and amnestic mild cognitive impairment weaken connections within the default-mode network: A multi-modal imaging study. J Alzheimers Dis 34: , 969–984. |


