
Medical Care and Long-Term Care Expenditures Attributable to Alzheimer’s Disease Onset: Results from the LIFE Study
Abstract
Background:
Alzheimer’s disease (AD) can increase both medical care and long-term care (LTC) costs, but the latter are frequently neglected in estimates of AD’s economic burden.
Objective:
To elucidate the economic burden of new AD cases in Japan by estimating patient-level medical care and LTC expenditures over 3 years using a longitudinal database.
Methods:
The study was performed using monthly claims data from residents of 6 municipalities in Japan. We identified patients with new AD diagnoses between April 2015 and March 2016 with 3 years of follow-up data. Medical care and LTC expenditures were estimated from 1 year before onset until 3 years after onset. To quantify the additional AD-attributable expenditures, AD patients were matched with non-AD controls using propensity scores, and their differences in expenditures were calculated.
Results:
After propensity score matching, the AD group and non-AD group each comprised 1748 individuals for analysis (AD group: mean age±standard deviation, 81.9±7.6 years; women, 66.0%). The total additional expenditures peaked at $1398 in the first month, followed by $1192 and $1031 in the second and third months, respectively. The additional LTC expenditures increased substantially 3 months after AD onset ($227), and gradually increased thereafter. These additional LTC expenditures eventually exceeded the additional medical care expenditures in the second year after AD onset.
Conclusion:
Although total AD-attributable expenditures peaked just after disease onset, the impact of LTC on these expenditures rose over time. Failure to include LTC expenditures would severely underestimate the economic burden of AD.
INTRODUCTION
In 2019, the prevalence of dementia in Japan was 24.8 persons per 1000 population, which was the highest among the Organisation for Economic Co-operation and Development countries [1]. Japan’s Ministry of Health, Labour and Welfare estimated that there were more than 5 million people with dementia throughout the country in 2018 [2], and this prevalence continues to rise [3]. Accordingly, dementia—and especially Alzheimer’s disease (AD) as its most common form—has grown to become one of Japan’s most pressing health problems.
From the economic perspective, dementia and AD are distinct from many other major health problems in that their costs are not limited to the medical care expenditures incurred by patients, but also encompass high long-term care (LTC) costs borne by patients, caregivers, and society. A systematic review of cost-of-illness studies identified LTC as a major cost driver in dementia care [4], which highlights the importance of including this cost component in disease burden estimates. Although previous studies have assessed the economic impact of dementia and AD [5, 6], many of these studies are constrained by issues such as the non-inclusion of LTC expenditures [7–11], short follow-up periods [7, 8, 12, 13], small sample sizes [12, 13], and lack of comparisons with persons without dementia or AD [13, 14]. Therefore, the following questions remain unanswered: “What are the additional AD-attributable expenditures for AD patients when compared to persons without AD?”, “What are the long-term changes in these additional expenditures after AD onset?”, and “What proportions of these additional expenditures are represented by medical care expenditures and LTC expenditures?”. Answering these questions may help to provide more accurate cost estimates that can be used in cost-effectiveness analyses of prevention and management programs.
Despite the high prevalence of AD in Japan [1–3], there have been no longitudinal estimates of its economic burden over several years that include LTC-related expenditures. In 2000, Japan developed an LTC Insurance system to alleviate the economic burden of extended caregiving for chronic conditions such as dementia [15]. This system covers LTC services (e.g., long-term preventive care services and assistance with activities of daily living) provided over extended periods of time at patients’ homes and LTC facilities. Under the LTC Insurance system, claims data are produced for a wide range of LTC services, which can be used to calculate LTC expenditures. Japan also utilizes National Health Insurance and Latter-Stage Elderly Healthcare systems that cover the provision of medical care services (e.g., inpatient/outpatient care), and the associated claims data can be used to calculate medical care expenditures. Claims data from these insurance systems can be analyzed together to generate more detailed and inclusive estimates of AD’s economic burden in Japan. In addition, these claims data include various information (e.g., sex, age, comorbidities, and care needs) that can be used to match AD patients and non-AD controls through propensity scores for AD occurrence. This would enable the formation and analysis of comparable groups while reducing the risk of selection bias.
This study aimed to quantify the additional medical care and LTC expenditures attributable to new AD onset in Japan by comparing propensity score–matched AD patients and non-AD controls using claims data. In order to ascertain the changes in these additional expenditures over time, the subjects were tracked for 3 years after AD onset.
METHODS
Study database
This study was conducted using a database produced by the Longevity Improvement & Fair Evidence (LIFE) Study. The LIFE Study is a longitudinal cohort study that collects and links administrative claims data and health checkup data of residents in participating municipalities. The database included information from National Health Insurance enrollees (comprising mainly retirees aged ≤74 years, self-employed people, non-regularly employed people, and primary industry workers), Latter-Stage Elderly Healthcare system enrollees (comprising all residents aged ≥75 years), and LTC Insurance enrollees (comprising residents aged ≥65 years with certified care needs and residents aged 40–64 years with a debilitating disease such as dementia) from April 2015 onward. The National Health Insurance and Latter-Stage Elderly Healthcare systems cover medical care services, and the LTC Insurance system covers LTC services. The number of municipalities participating in the LIFE Study varies at the monthly level.
The study was approved by the Kyushu University Institutional Review Board for Clinical Research (Approval no. 2019-045).
Study subjects
The study subjects were selected from the National Health Insurance enrollees, Latter-Stage Elderly Healthcare System enrollees, and LTC Insurance enrollees residing in 6 LIFE Study municipalities (designated Cities A to F) that were able to consistently provide data over the study period. All 6 municipalities were located in Fukuoka Prefecture, Japan.
We first identified candidate subjects with a recorded diagnosis of AD (International Classification of Diseases, 10th Revision code: G30) in their medical care claims data between April 2016 and March 2017. The first recorded AD diagnosis of each patient during this period was designated his/her index diagnosis. Subsequently, we identified new AD cases as patients without any previous diagnosis of AD within 6 months before the index diagnosis.
Outcomes
The primary outcome measures were medical care expenditures and LTC expenditures. These expenditures were calculated based on each subject’s total expenditures (including both insurer reimbursements and patient out-of-pocket copayments) for the use of medical care services and LTC services. The cost components of medical care expenditures and LTC expenditures are listed in Supplementary Table 1.
The secondary outcome measures were the cost component–specific expenditures for medical care and LTC expenditures. Medical care expenditures were divided into hospitalization/consultation expenditures, drug expenditures, procedure/surgery expenditures, test expenditures, and other expenditures (e.g., meals and dental care). LTC expenditures were divided into care planning expenditures, residence expenditures, facility expenditures, preventive care expenditures, community-based care expenditures, and other expenditures (e.g., home modifications for disabilities and rental/purchase of assistive technology devices). Under Japan’s healthcare system, providers are reimbursed according to a prospective payment system that determines comprehensive payments based on patients’ diagnosis groups. This places fixed limits on reimbursements regardless of the actual quantity of care provided (e.g., number of blood tests) in inpatient and outpatient settings. For this reason, the simple summation of expenditures for individual components does not always match the actual total expenditures. Therefore, we calculated the share of each component by setting that component’s expenditure as the numerator and setting the combined total expenditures of all components in medical care or LTC as the denominator.
Statistical analysis
This analysis sought to quantify the additional medical care and LTC expenditures associated with new AD onset, and to track the monthly changes in these expenditures over the 3-year follow-up period. To do so, the AD patients (i.e., individuals who developed AD between April 2016 and March 2017) were matched with non-AD controls (i.e., individuals who did not develop AD between April 2016 and March 2017) using propensity scores, and their differences in medical care and LTC expenditures were calculated. These differences were considered to be additional expenditures attributable to AD onset.
The propensity scores were calculated for AD patients and non-AD controls using a logistic regression model with the following covariates based on data from 2015: age, sex, income level, presence/absence of 8 major comorbidities (cardiovascular disease, cerebrovascular disease, diabetes, cancer, hypertension, pulmonary disease, bone fracture, and arthritis), care needs level, and the pre-AD medical care and LTC expenditures from April 2015 to March 2016 (both the unadjusted values and squared values of these expenditures were included as covariates). In Japan, residence tax is based on income, and persons from households with low income levels are exempted from paying this tax. Although our database did not include actual income data, it specified patients with this tax exemption. Using this information, subjects were categorized into low-income individuals (i.e., persons from households with residence tax exemptions) and non–low-income individuals (i.e., all others). Care needs level were categorized into 6 levels (comprising a support needs level and 5 care needs levels; Supplementary Table 2) as recorded in the claims data, with each patient’s level certified by a municipal-based approval board. We then performed 1:1 matching between AD patients and non-AD controls without replacement using a caliper width of 0.25 standard deviations of the logit of each propensity score. Standardized differences were used to test for balances between the case and control groups. Studies have proposed absolute standardized differences of less than 0.10 and 0.25 to assess covariate balance after propensity score matching [16, 17]. In this study, we used absolute standardized differences below 0.10 to determine covariate balance between the groups.
In each AD patient, the month of AD onset was set as the index month indicating the start of follow-up. Each non-AD control used the same index month as their matched AD patient. The total medical care expenditures and total LTC expenditures were calculated for the 3-year period beginning from this index month. In cases where an AD patient or non-AD control moved out from their original municipality of residence or died during the follow-up period, their 3-year expenditures were calculated with expenditures set to 0 yen from the month of either event. However, medical care can increase substantially in the period immediately preceding death, which may skew these expenditure estimates. Therefore, we also conducted a sensitivity analysis that excluded matched pairs in which either the AD patient or non-AD control had died during the follow-up period.
All expenditures were converted from Japanese yen to US dollars using the purchasing power parity rate in 2019 ($1 = ¥ 103.0). Statistical analyses were performed using Stata Release 15.1 (StataCorp, College Station, TX, US). Two-tailed p values below 0.05 were considered significant.
RESULTS
We first identified 1,848 patients who received new diagnoses of AD between April 2016 and March 2017 in the 6 study municipalities. Of these, 1,748 AD patients were successfully matched with non-AD controls using the propensity scores. The baseline characteristics of the AD and non-AD groups before and after propensity score matching are shown in Table 1. After propensity score matching, the mean (standard deviation) ages of the AD and non-AD groups were 81.9 (7.6) years and 82.2 (7.9) years, respectively. The sample included 31 patients aged 45–64 years with early-onset AD. In the AD group, 66%were women, 7.7%were designated low-income individuals, and 62.5%had hypertension. In addition, 67.9%of the AD group did not have any care needs certification in 2015. The absolute standardized differences of almost all covariates were below 0.1, with the absolute standardized difference of “care needs level: none” marginally higher at 0.113. This showed that there were almost no significant differences in baseline characteristics between the AD and non-AD groups after propensity score matching. The distribution of AD patients across the 6 municipalities was as follows: 167 patients (9.6%) in City A, 278 patients (15.9%) in City B, 242 patients (13.8%) in City C, 264 patients (15.1%) in City D, 347 patients (19.9%) in City E, and 450 patients (25.7%) in City F. A total of 325 AD patients (18.6%) and 212 non-AD controls (12.1%) died during the 3-year follow-up period beginning from the index month.
Table 1
Baseline characteristics of the Alzheimer’s disease (AD) patients and non-AD controls in 2015a
| Before Matching | After Matching | |||||
| Non-AD (n = 172,103) | AD (n = 1,848) | Standardized Difference | Non-AD (n = 1,748) | AD (n = 1,748) | Standardized Difference | |
| Age, y | 58.4 [22.8] | 82.1 [7.6] | 1.397 | 82.2 [7.9] | 81.9 [7.6] | –0.051 |
| Women | 94,506 (54.9%) | 1,232 (66.7%) | 0.242 | 1,182 (67.6%) | 1,154 (66%) | –0.034 |
| Low income | 6,339 (3.6%) | 141 (7.6%) | 0.171 | 114 (6.5%) | 135 (7.7%) | 0.047 |
| Comorbidities | ||||||
| Cardiovascular disease | 13,965 (8%) | 382 (20.7%) | 0.364 | 328 (18.8%) | 357 (20.4%) | 0.042 |
| Cerebrovascular disease | 20,821 (11.9%) | 624 (33.8%) | 0.533 | 560 (32%) | 582 (33.3%) | 0.027 |
| Diabetes | 29,357 (16.7%) | 441 (23.9%) | 0.169 | 449 (25.7%) | 411 (23.5%) | –0.05 |
| Cancer | 2,696 (1.5%) | 23 (1.2%) | –0.027 | 14 (0.8%) | 22 (1.3%) | 0.045 |
| Hypertension | 58,442 (33.3%) | 1,163 (62.9%) | 0.606 | 1,077 (61.6%) | 1,093 (62.5%) | 0.019 |
| Pulmonary disease | 5,780 (3.3%) | 155 (8.4%) | 0.215 | 121 (6.9%) | 146 (8.4%) | 0.054 |
| Bone fracture | 3,683 (2.1%) | 147 (8%) | 0.268 | 131 (7.5%) | 134 (7.7%) | 0.006 |
| Arthritis | 4,789 (2.7%) | 89 (4.8%) | 0.106 | 88 (5%) | 80 (4.6%) | –0.021 |
| Medical expenditures from Apr 2015 to Mar 2016 | 4,147 [11,002] | 7,835 [13,018] | 0.298 | 6,914 [11,153] | 7,747 [12,676] | 0.07 |
| Long-term care expenditures from Apr 2015 to Mar 2016 | 644 [3,768] | 4,132 [8,743] | 0.516 | 3,275 [8,035] | 4,016 [8,680] | 0.089 |
| Care needs level | ||||||
| None | 165,827 (94.4%) | 1,233 (66.7%) | –0.742 | 1,277 (73.1%) | 1,187 (67.9%) | –0.113 |
| Support Needs Level | 3,038 (1.7%) | 142 (7.7%) | 0.282 | 137 (7.8%) | 132 (7.6%) | –0.011 |
| Care Needs Level 1 | 1,411 (0.8%) | 146 (7.9%) | 0.352 | 99 (5.7%) | 131 (7.5%) | 0.074 |
| Care Needs Level 2 | 1,664 (1%) | 121 (6.6%) | 0.297 | 86 (4.9%) | 111 (6.4%) | 0.062 |
| Care Needs Level 3 | 1,269 (0.7%) | 82 (4.4%) | 0.235 | 47 (2.7%) | 73 (4.2%) | 0.082 |
| Care Needs Level 4 | 1,463 (0.8%) | 74 (4%) | 0.206 | 59 (3.4%) | 65 (3.7%) | 0.019 |
| Care Needs Level 5 | 1,024 (0.6%) | 50 (2.7%) | 0.167 | 43 (2.5%) | 49 (2.8%) | 0.021 |
aBefore AD onset in the AD patients. Age and expenditures are presented as mean [standard deviation]. All other values are presented as n (%).
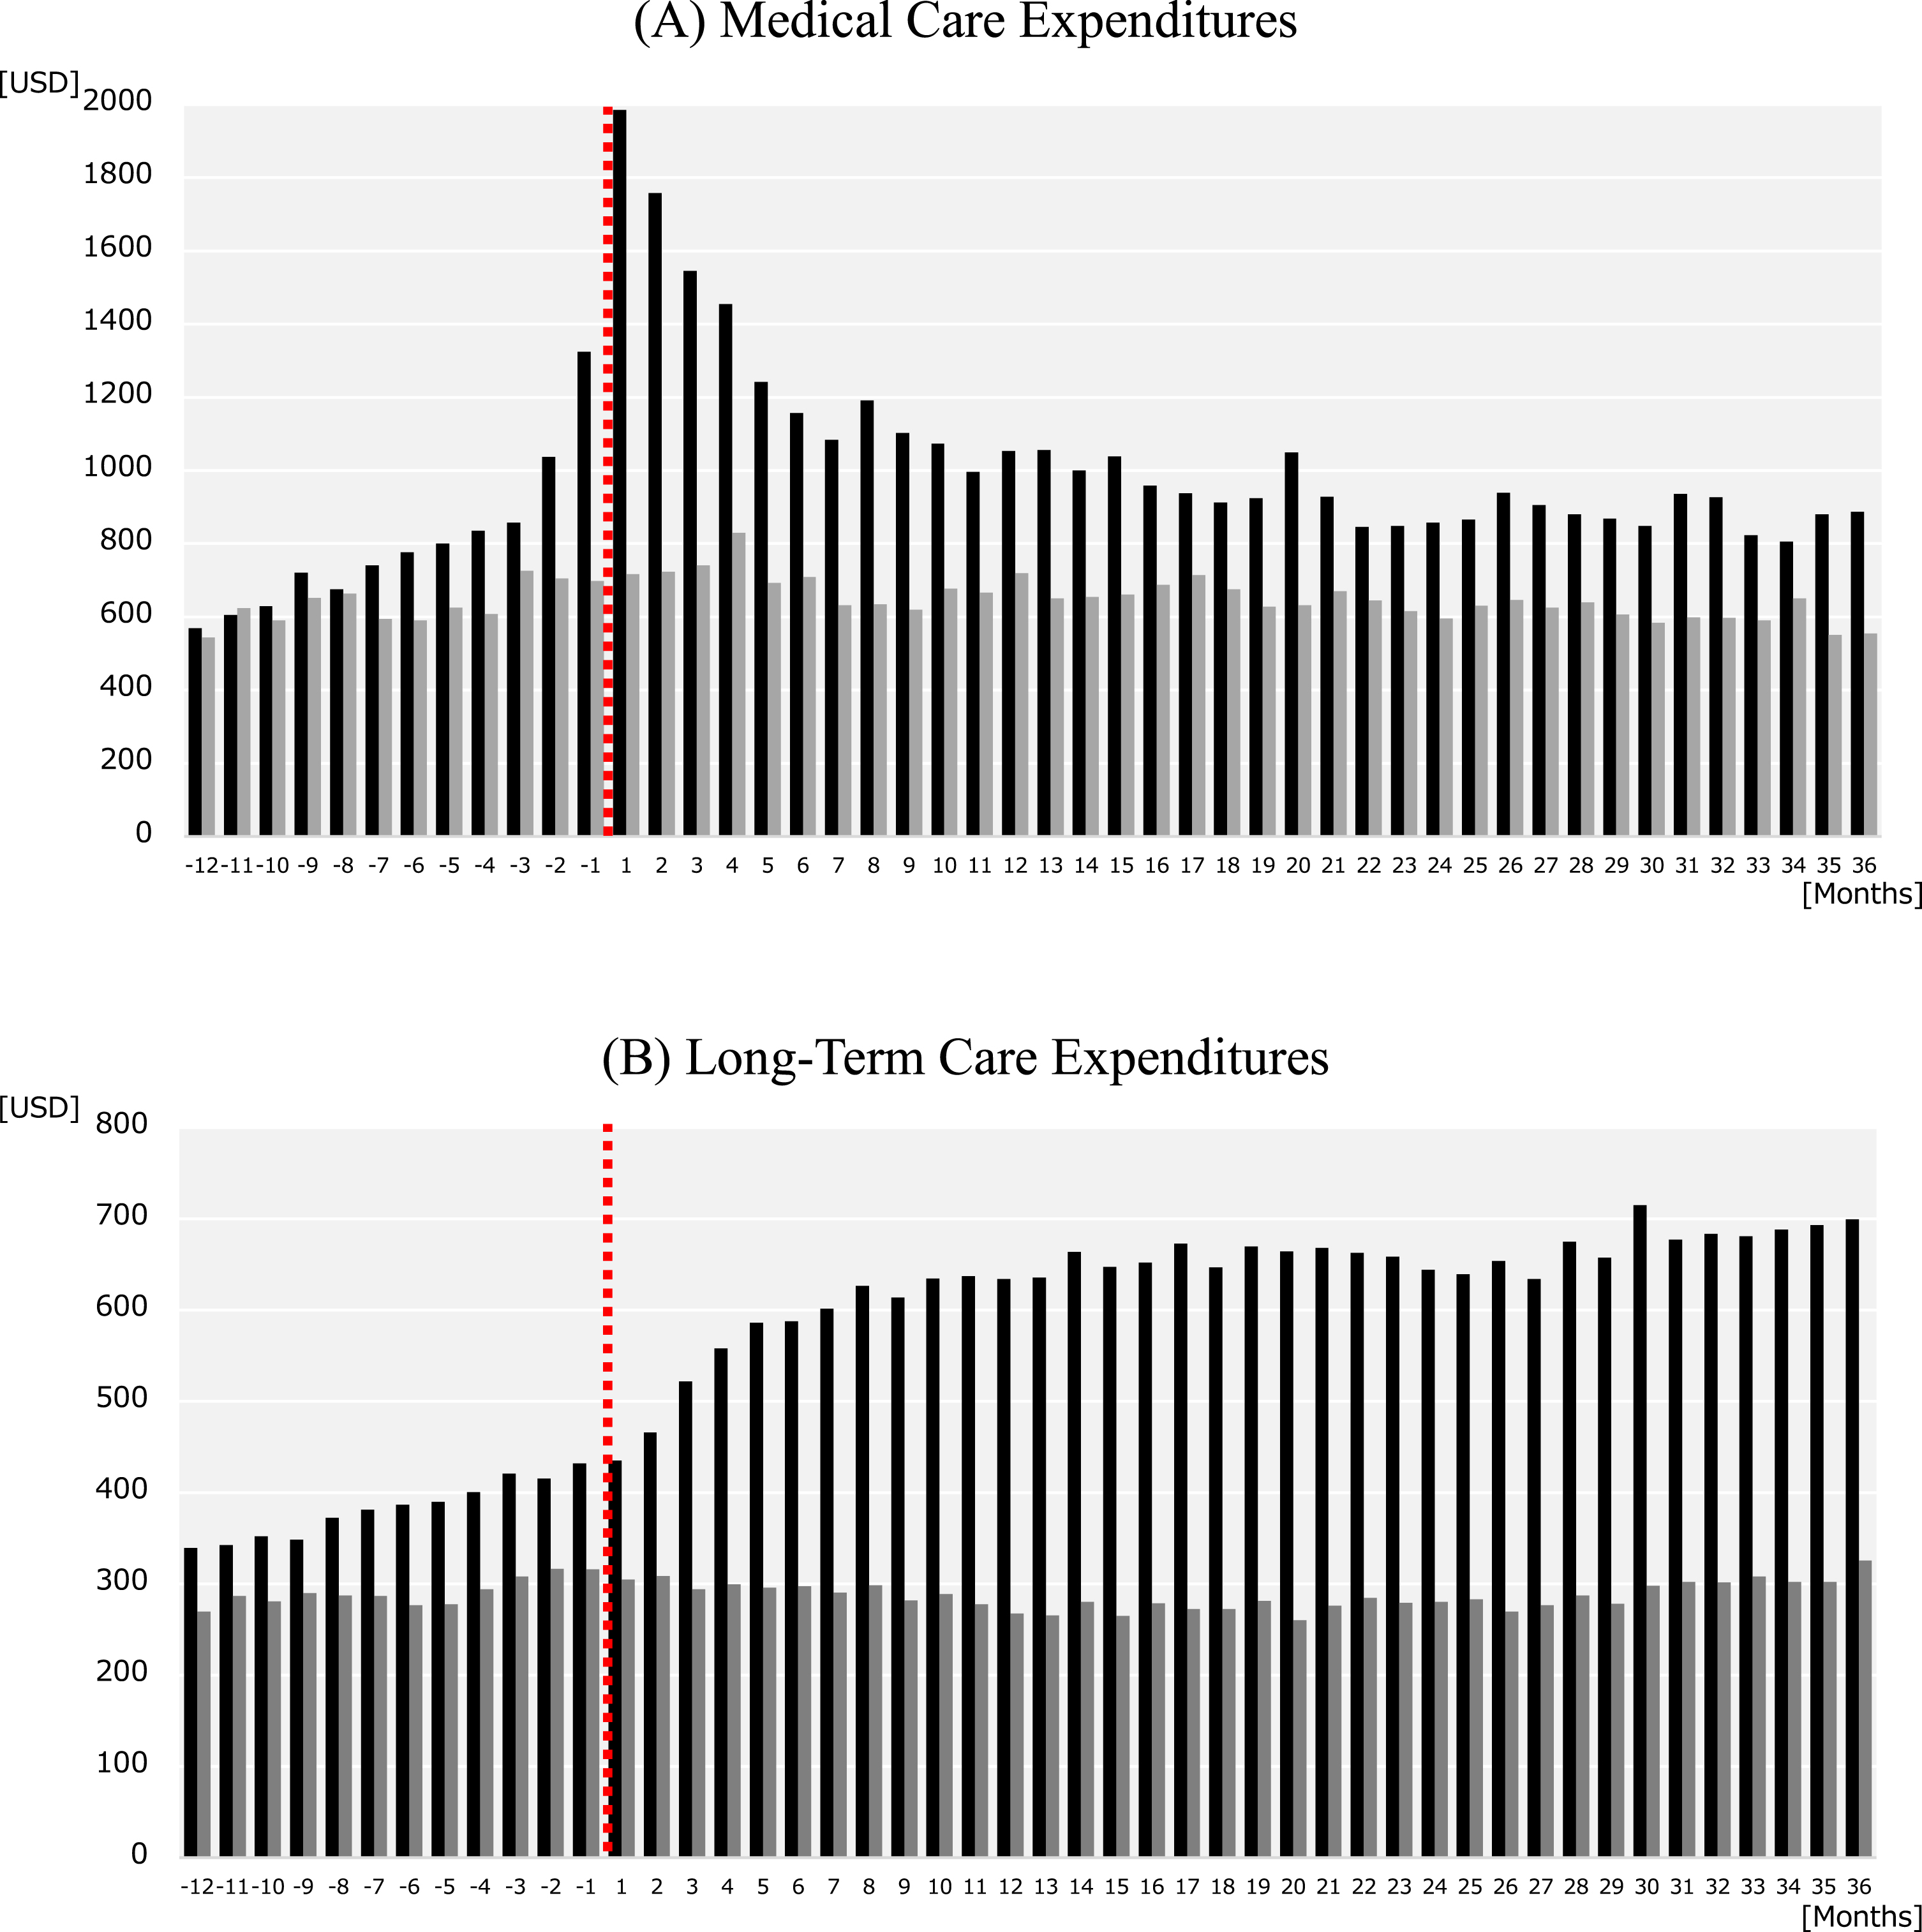
Figure 1 shows the trends in monthly medical care and LTC expenditures for the AD and non-AD groups. The medical care expenditures (Fig. 1A) in the AD group peaked in the first (index) month after AD onset ($1985), but decreased over the second ($1758), third ($1545), and fourth ($1454) months. These expenditures generally continued to decrease until the 21st month and stabilized thereafter. We also observed a steady increase in medical care expenditures in the year before AD onset, with large increases 2 months ($1038) and 1 month ($1325) before the index month. In contrast, the non-AD group did not exhibit any notable changes in medical care expenditures over the study period, with monthly expenditures stable at approximately $650. For LTC expenditures, the AD group showed a gradual increase in expenditures in the year before AD onset (Fig. 1B). These expenditures increased substantially in the third ($522), fourth ($558), and fifth ($587) months after AD onset. Thereafter, the LTC expenditures generally continued to increase until the end of the follow-up period. In contrast, the non-AD group did not exhibit any large changes in LTC expenditures over the study period, with monthly expenditures stable at approximately $290. Overall, the AD group had higher medical expenditures and LTC expenditures than the non-AD group over most of the study period.
Fig. 1
Trends in monthly expenditures in Alzheimer’s disease (AD) patients and non-AD controls. The graphs show the monthly (A) medical care expenditures and (B) long-term care expenditures from 12 months before and 36 months after the index month. The black bars indicate the expenditures for AD patients and the gray bars indicate the expenditures for non-AD controls. The dashed line indicates the index month in which an AD patient was newly diagnosed with AD. Each non-AD control used the same index month as their matched AD patient.
The annual additional medical care and LTC expenditures for AD patients in the 3 years after AD onset are provided in Table 2. These expenditures are also presented according to sex and age category. The mean annual additional medical care expenditures (95%confidence intervals) were $7280 ($6192–8367) in the first year, $3528 ($2505–4551) in the second year, and $3292 ($2295–4290) in the third year. There was a significant decrease in these expenditures from the first to second year (p < 0.05). The mean annual additional LTC expenditures (95%confidence intervals) were $3398 ($2871–3925) in the first year, $4589 ($3992–5185) in the second year, and $4561 ($3919–5203) in the third year. There was a significant increase in these expenditures over the 3-year period. Across all age groups, the additional medical care expenditures were higher in women, whereas the additional LTC expenditures were higher in men. For the sensitivity analysis, we excluded 1423 matched pairs in which either the AD patient or non-AD control had died during the follow-up period. After these exclusions, the mean annual additional medical care expenditures (95%confidence intervals) were $5594 (4493–6695) in the first year, $3126 (2050–4202) in the second year, and $4923 (3774–6071) in the third year. The mean annual additional LTC expenditures (95%confidence intervals) were $3338 (2772–3904) in the first year, $5655 (5000–6311) in the second year, and $6527 (5812–7241) in the third year.
Table 2
Annual additional expenditures over 3 years after AD onset in Alzheimer’s disease (AD) patients according to sex and agea
| Additional Medical Care Expenditures (USD) | Additional Long-Term Care Expenditures (USD) | ||||||
| n | First Year | Second Year | Third Year | First Year | Second Year | Third Year | |
| Total | 1,748 | 7,280 (6,192 –8,367) | 3,528 (2,505 –4,551) | 3,292 (2,295 –4,290) | 3,398 (2,871 –3,925) | 4,589 (3,992 –5,185) | 4,561 (3,919 –5,203) |
| Men | |||||||
| ≤69 y | 58 | 11,856 (5,972 –17,740) | 10,957 (2,858 –19,057) | 124,77 (6,036 –18,919) | 3,358 (1,357 –5,359) | 3,234 (1,396 –50,73) | 3,431 (1,274 –5,588) |
| 70–79 y | 194 | 10,392 (6,714 –14,070) | 4,830 (1,282 –8,378) | 6,129 (2,779 –9,479) | 2,886 (1,791 –3,981) | 4,392 (2,935 –58,49) | 3,796 (2,252 –5,339) |
| 80–89 y | 284 | 10,364 (7,244 –13,483) | 3,400 (877 –5,924) | 1,453 (–806 –3,712) | 2,286 (1,065 –3,508) | 3,271 (1,855 –4,687) | 2,560 (1,060 –4,060) |
| ≥90 y | 58 | 11,663 (6,033 –17,293) | 1,021 (–3,990 –6,031) | 162 (–4,136 –4,460) | –1,092 (–5,014 –2,831) | –709 (–4,676 –3,259) | –2,746 (–6,394 –903) |
| Women | |||||||
| ≤69 y | 53 | 3,498 (–2,649 –9,646) | 6,857 (–496 –14,210) | 3,378 (–862 –7,618) | 3,984 (1,491 –6,476) | 5,095 (1,945 –8,246) | 6,082 (2,816 –9,347) |
| 70–79 y | 305 | 6,665 (4,471 –8,859) | 3,026 (819 –5,234) | 3,835 (1,441 –6,229) | 3,047 (2,042 –4,053) | 4,400 (3,250 –5,551) | 5,548 (4,241 –6,854) |
| 80–89 y | 597 | 5,006 (3,265 –6,747) | 3,765 (2,075 –5,456) | 2,803 (1,072 –4,534) | 4,338 (3,400 –5,276) | 6,187 (5,132 –7,242) | 6,650 (5,482 –7,818) |
| ≥90 y | 199 | 6,004 (2,558 –9,451) | 176 (–2,601 –2,953) | 2,000 (–1,013 –5,014) | 4,365 (2,150 –6,579) | 3,958 (1,536 –6,380) | 2,435 (–5 –4,875) |
aAge at 2015. Values are presented as mean (95%confidence interval).
The monthly trends in additional medical care and LTC expenditures attributable to AD are shown in Fig. 2. When compared with the non-AD controls, the AD patients had additional medical care expenditures of $1268 in the first month following AD onset, $1034 in the second month, and $804 in the third month (Fig. 2A). The additional LTC expenditures increased substantially in the third month after AD onset, with $227 in the third month and $258 in the fourth month; these additional LTC expenditures continued to increase gradually thereafter (Fig. 2B). The additional LTC expenditures eventually exceeded the additional medical care expenditures 11 months after AD onset. The total additional medical care and LTC expenditures were highest at $1398 in the first month following AD onset. This decreased to $1192 in the second month and $1031 in the third month. Furthermore, the total additional expenditures were observed to increase in the month ($742) before AD onset (Fig. 2C). However, there were no large changes in total additional expenditures from the sixth month onward, with monthly additional expenditures stable at approximately $687.
Fig. 2
Trends in monthly additional expenditures attributable to Alzheimer’s disease (AD) in AD patients. The graphs show the monthly additional (A) medical care expenditures, (B) long-term care expenditures, and (C) medical care and long-term care expenditures in AD patients from 12 months before and 36 months after the index month. Month 1 indicates the index month in which an AD patient was newly diagnosed with AD.
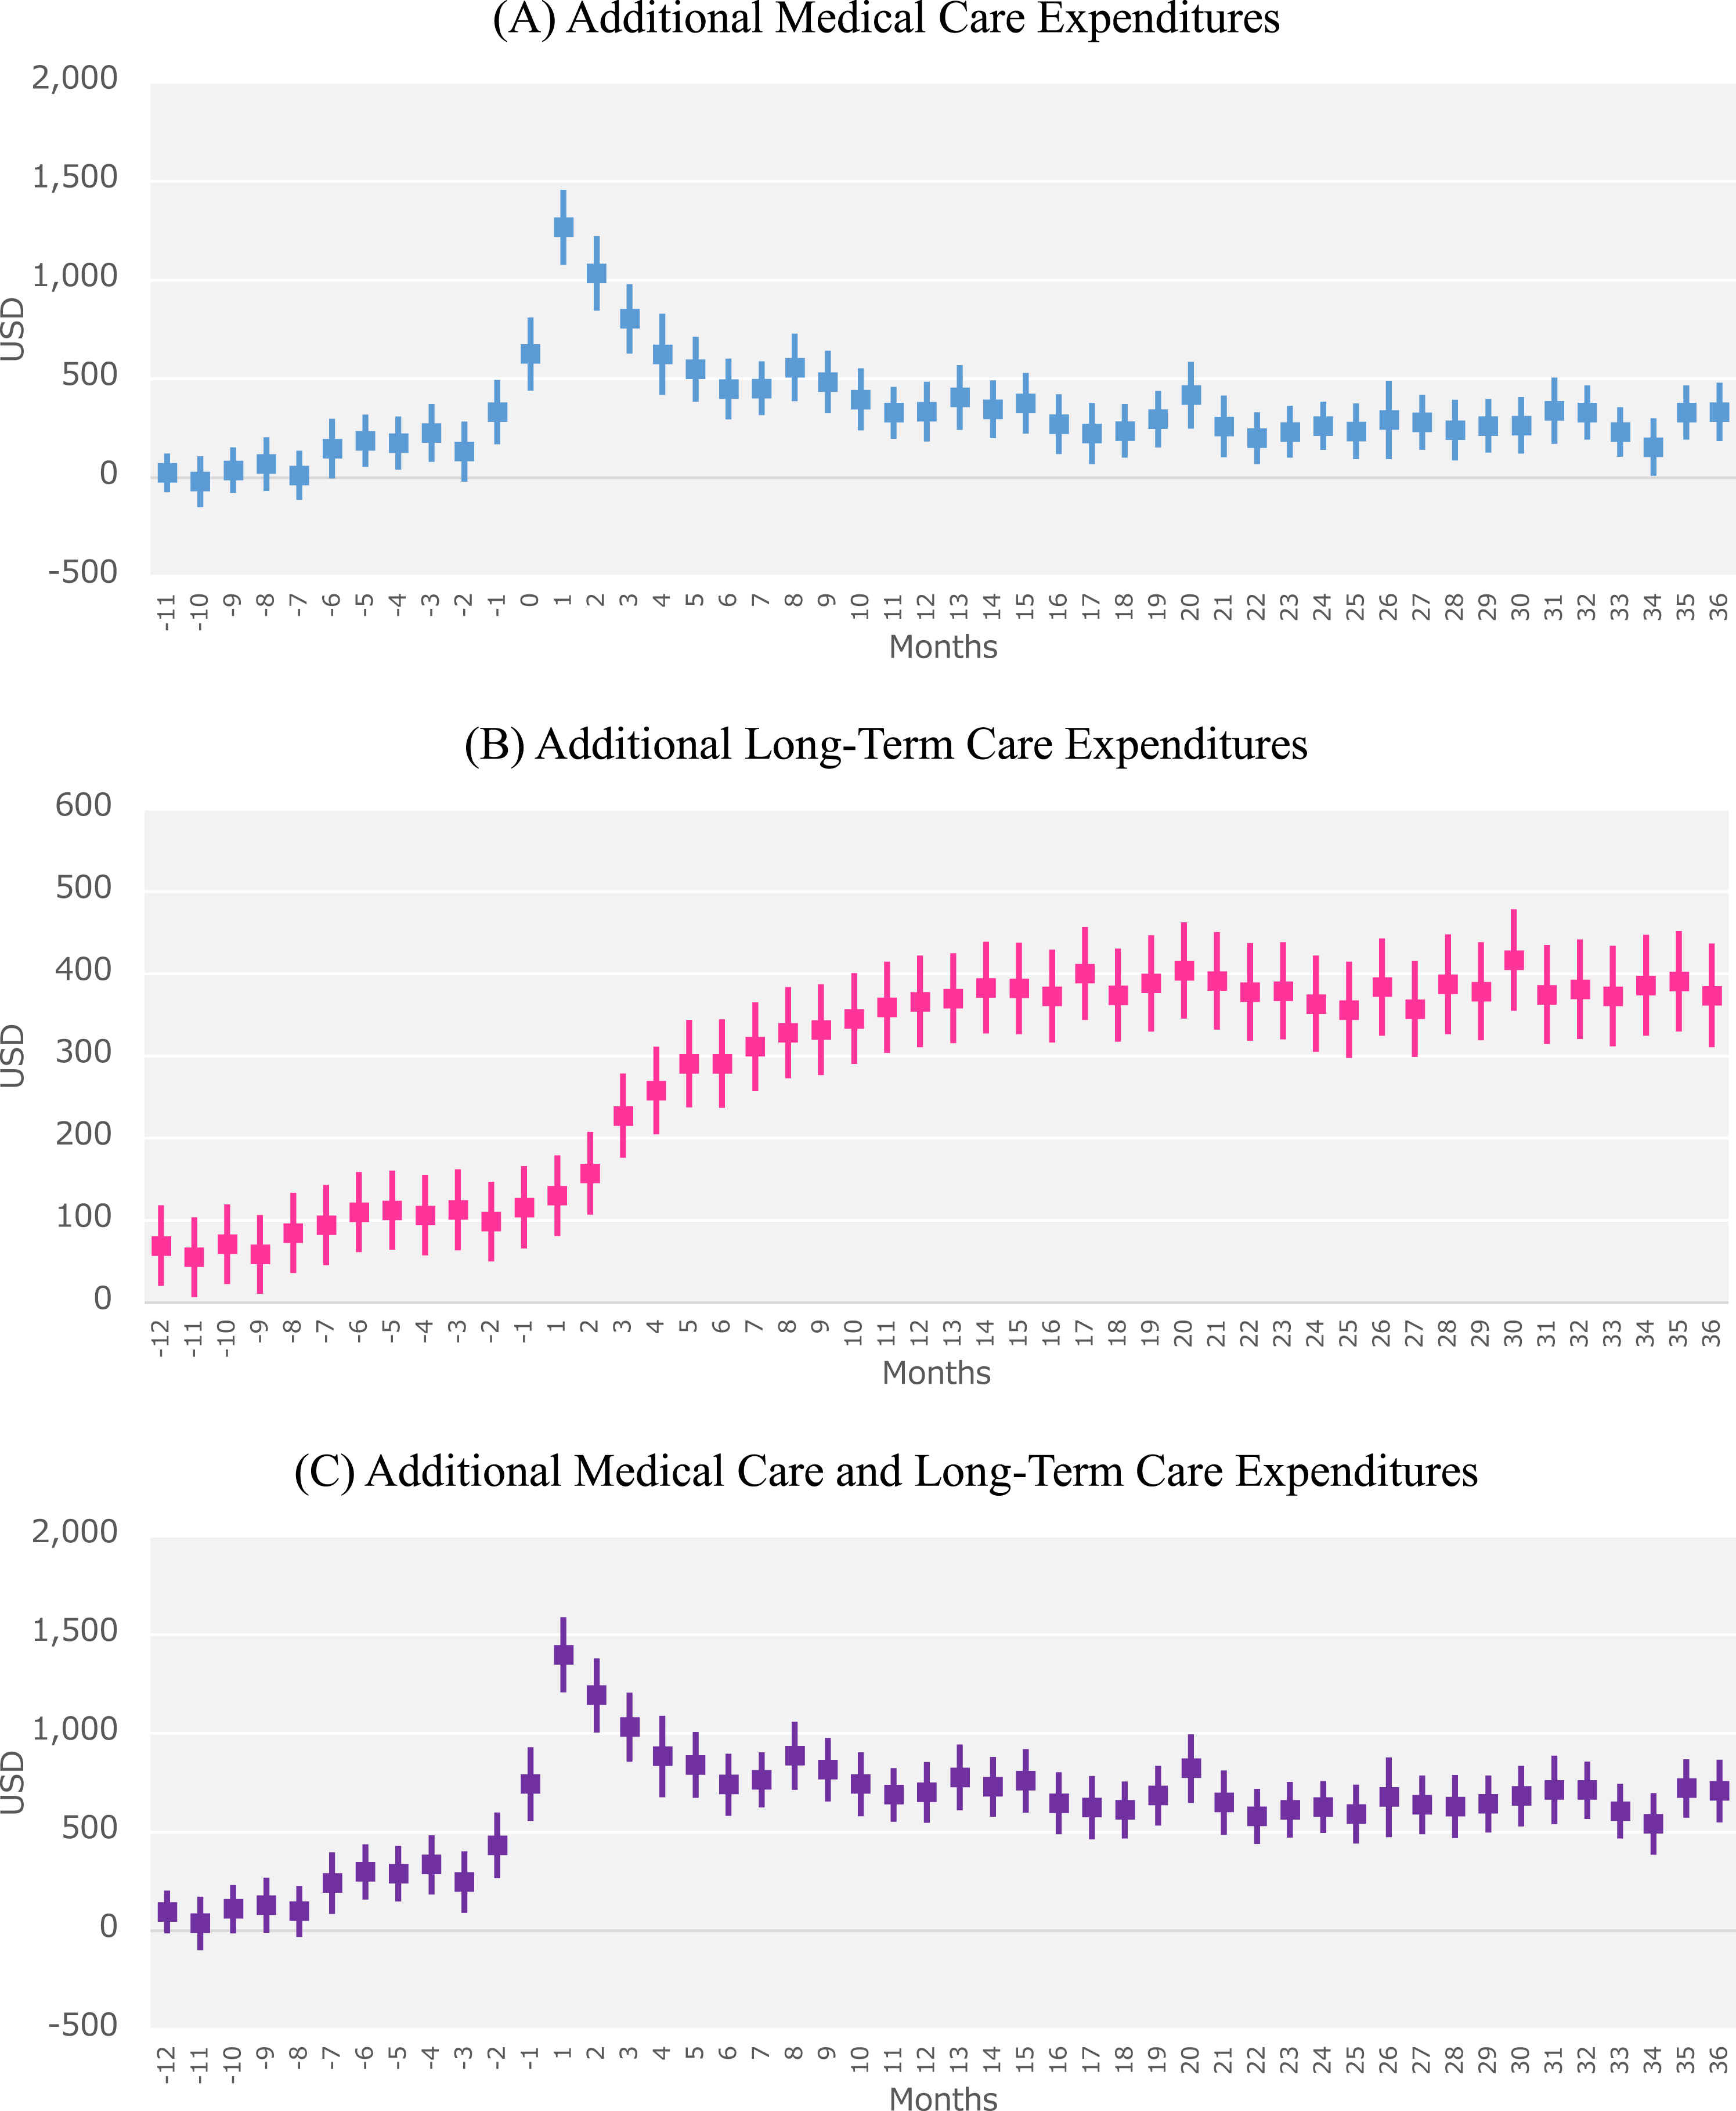
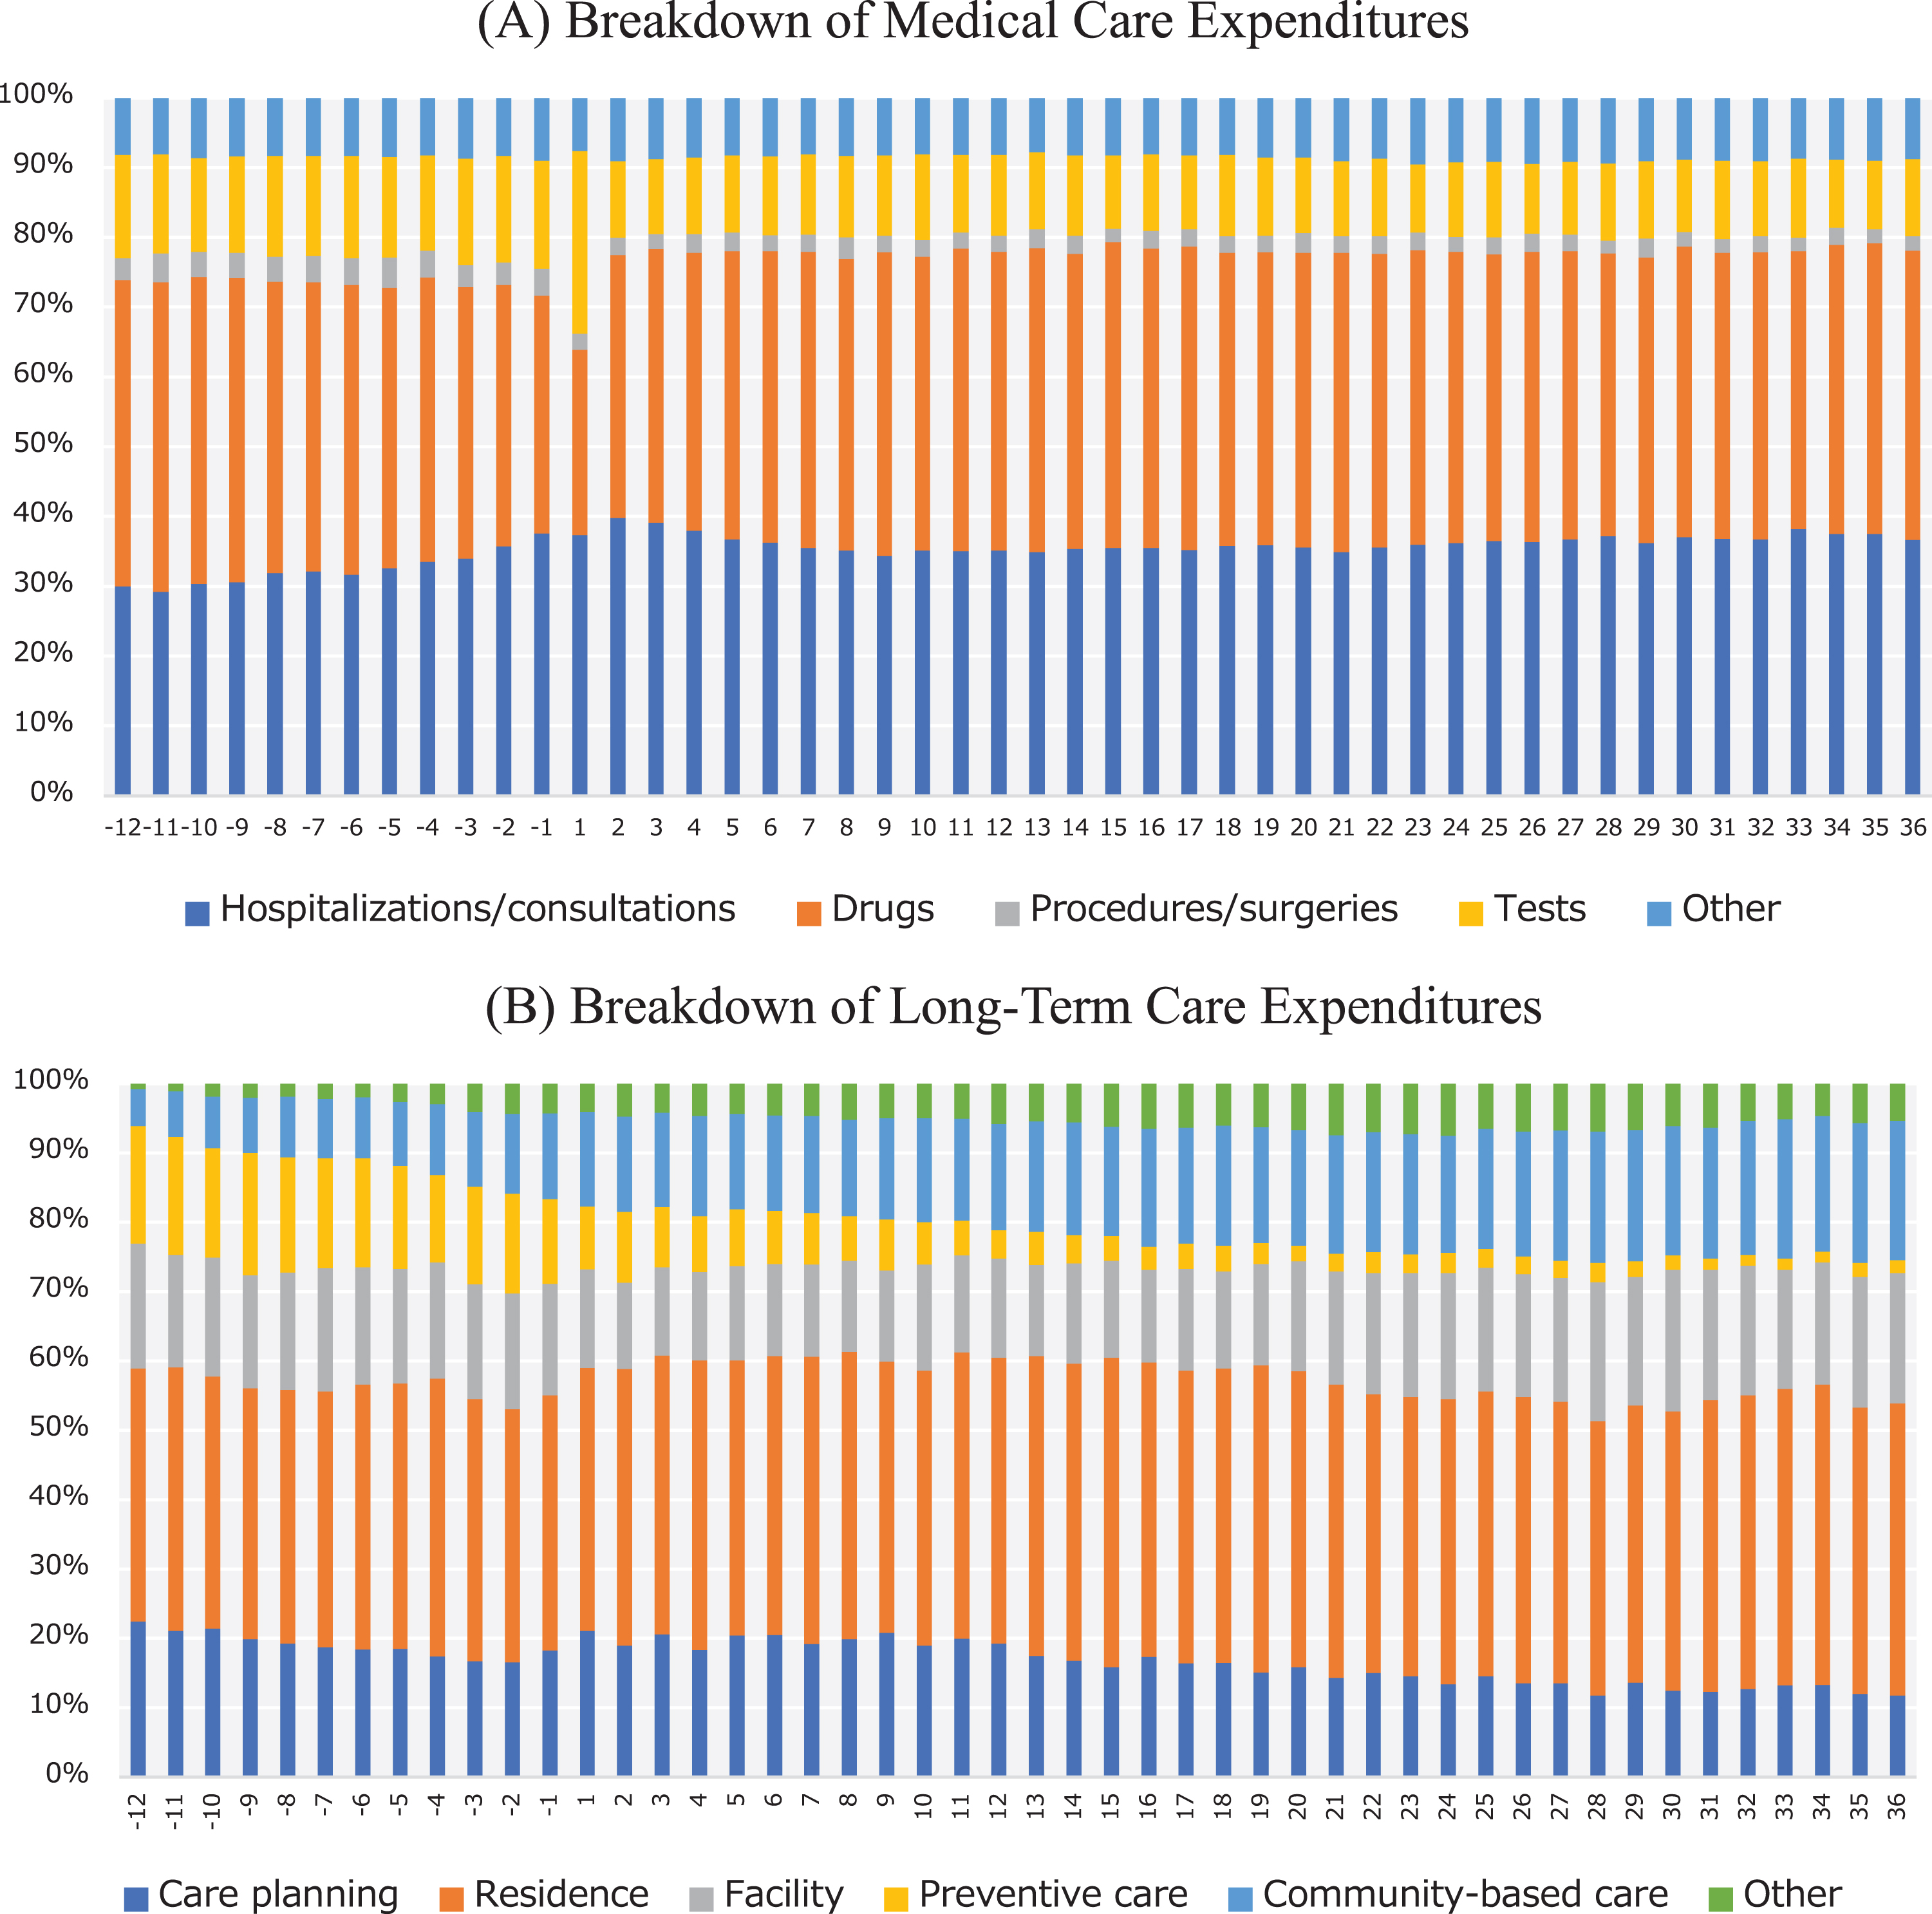
Figure 3 shows the breakdown of monthly component-specific expenditures among the AD patients. Expenditures for tests accounted for a large proportion (26.2%) of medical care expenditures in the first month after AD onset (Fig. 3A). The proportion of expenditures incurred by hospitalizations/consultations increased substantially before and after AD onset. In the breakdown of LTC expenditures, the proportion of expenditures incurred by preventive care decreased following AD onset, whereas community-based care accounted for a larger proportion of these expenditures (Fig. 3B).
Fig. 3
Breakdown of monthly expenditures according to cost component in Alzheimer’s disease (AD) patients. The graphs show the breakdown of monthly (A) medical care expenditures and (B) long-term care expenditures according to cost component in AD patients from 12 months before and 36 months after the index month. Month 1 indicates the index month in which an AD patient was newly diagnosed with AD.
DISCUSSION
In this study, we quantified the additional medical care and LTC expenditures attributable to AD over 3 years in patients from 6 Japanese municipalities.
This study has two major findings. First, we calculated the additional expenditures attributable to AD by comparing propensity score–matched AD patients and non-AD controls. Previous studies have produced estimates on AD-attributable expenditures by comparing AD and non-AD groups after adjusting for variations in preexisting conditions [7], using ordinary least squares regression models [8, 10, 12], using generalized linear models [13], using two-part models [11], and using propensity score matching [9]. As healthcare-related expenditures have complex distributions, the inappropriate selection of regression models can lead to substantial errors in estimates. For this study, we used propensity score matching to avoid these potential problems, which was the same approach employed by Lin et al. [9]. Second, we found that the mean annual additional medical care expenditures peaked at $7280 in the first year but decreased to $3528 in the second year and $3292 in the third year. In contrast, the mean annual additional LTC expenditures rose from $3398 in the first year to $4589 and $4561 in the second and third years, respectively. Our findings that medical care expenditures peaked in the first year after AD onset and decreased thereafter are concordant with previous studies that had follow-up durations exceeding 1 year. In an analysis of 25,916 patients over 2 years, Lin et al. reported an increase of $17,852 in the first year after disease onset, which then dropped by over 50%($7327) in the second year [9]. Similarly, White et al. reported large reductions in dementia-attributable expenditures over time, with $7264 in the first year, $4241 in the second year, $2520 in the third year, $1302 in the fourth year, and $377 in the fifth year after disease onset [11]. Our results also showed that additional LTC expenditures exceeded the additional medical care expenditures in the second year after AD onset. This supports the findings of a systematic review that home-based LTC and nursing home services accounted for more than half of all dementia costs [4]. Our study provides novel insight in that it compared both the medical care expenditures and LTC expenditures in a total of 3496 AD and non-AD patients over 3 years in Japan.
Furthermore, this study also examined the AD-attributable expenditures according to sex and age. Additional medical care expenditures were found to be higher in men among all patients aged ≤79 years and in women among all patients aged ≥80 years. This suggests that the age-related mortality risks differed between the sexes. In addition, our results indicated that medical care expenditures were higher in younger patients, which was consistent with the findings of Taylor and Sloan [10]. In contrast, Ku et al. found no significant association between age and medical care expenditures [13]. White et al. reported that medical care expenditures tend to be higher in women, and their results also suggested that this sex difference was due to a differential mortality risk [11]. Among men aged ≥90 years, non-AD controls had higher LTC expenditures than AD patients, although this difference was not statistically significant. This observation may have been influenced by the high 3-year mortality rate (39.1%) among men aged ≥90 years.
Our base case analysis included patients who had died during the follow-up period, whereas the sensitivity analysis excluded these patients. Among the 325 AD patients who died during follow-up, 159 died in the first year, 110 died in the second year, and 39 died in the third year. Among the 212 non-AD controls who died during follow-up, 89 died in the first year, 82 died in the second year, and 41 died in the third year. When compared with the sensitivity analysis, the base case analysis showed higher medical care expenditures in the first year, which may have been due to the increased expenditures incurred at the end of life by the large number of patients who died. However, these patients would no longer incur any expenditures after death, which would explain why the base case analysis produced lower medical care expenditures in the third year than the sensitivity analysis. In contrast, LTC expenditures typically do not increase at the end of life, which may have influenced the lower estimates of the base case analysis for the second and third years.
This study had 4 limitations. First, we could not perform assessments according to different levels of disease severity. While previous studies have used the Clinical Dementia Rating [18] or Mini-Mental State Examination [19] to account for variations in dementia severity, our claims database did not contain this information. As our study focused on patients who had just begun treatment for newly diagnosed AD, it is possible that our subjects included a high proportion of patients with relatively mild symptoms. Second, the study was conducted using data from 6 municipalities in Fukuoka Prefecture, Japan, and our findings may have limited generalizability to other populations. Nonetheless, the trends in medical care and LTC expenditures were largely similar across all 6 municipalities. Although the study cohort accounted for 3.07%of the available population, the cohort from City F only comprised 1.11%of its population. A study from another municipality in the same prefecture reported a dementia prevalence of 12.2%[3], indicating that our study cohort may be an underrepresentation of the target population. Because our subjects were limited to patients whose claims data showed records of AD treatments, they did not include cases with mild cognitive impairment preceding AD and cases with latent AD that have yet to be diagnosed at a medical institution. The absence of such cases could account for our seemingly low AD prevalence. Third, although our study incorporated LTC expenditures, we were unable to examine all components of informal care costs. The establishment of the LTC Insurance system in Japan led to decreases in the informal care costs of family caregivers [15], which suggests that LTC expenditures may represent a portion of these costs. Nevertheless, the informal care costs of AD patients’ family members remain relatively high [14]. Therefore, the economic burden of AD in Japan should be assessed using both the results of this study and Nakanishi et al. [14]. Finally, our sample did not include any early-onset AD patients aged below 45 years. However, there were no patients aged 40–44 years in our sample even though they were covered in the inclusion criteria. Therefore, it is unlikely that the number of younger patients with AD would affect our observations.
Despite the above limitations, our study presents important cost data that can be utilized in cost-effectiveness analyses when developing and implementing interventions for AD prevention and care. In addition to these cost data, cost-effectiveness analyses also require information on the effectiveness of each intervention. While the effectiveness of various interventions has been assessed through clinical research and other analyses, there is a lack of comprehensive cost data that incorporate both medical care and LTC expenditures, especially in Japan. Moreover, our cost estimates are presented according to sex, age, and year after onset; and could therefore be applied to cost-effectiveness analyses in a diverse range of settings. Our findings that LTC expenditures surpassed medical care expenditures in the second year after AD onset may be particularly useful as this allows for the consideration of major shifts in costs over time. Japan’s official guidelines for cost-effectiveness evaluations of drugs and medical devices (which guide their price schedules) are based on medical care expenditures without consideration to LTC expenditures [20]. As a result, the costs of LTC services have generally been neglected in Japan’s healthcare policies despite their heavy impact. Our results highlight the need to include LTC expenditures when calculating the economic burden of diseases such as dementia and AD.
Conclusion
The total additional medical care and LTC expenditures attributable to AD onset were highest in the month following AD diagnosis, and gradually decreased for several months before stabilizing. However, the additional LTC expenditures exceeded the additional medical care expenditures in the second year after AD onset. These findings underscore the importance of including LTC expenditures when quantifying the economic burden of AD in real-world settings.
ACKNOWLEDGMENTS
The construction of the study database was funded by JSPS KAKENHI Grants (Grant Numbers JP19K21590 and JP20H00563). Data analysis and publication were funded by grants from Eisai Co., Ltd. and Biogen Inc.
Authors’ disclosures available online (https://www.j-alz.com/manuscript-disclosures/20-1508r3).
SUPPLEMENTARY MATERIAL
[1] The supplementary material is available in the electronic version of this article: https://dx.doi.org/10.3233/JAD-201508.
REFERENCES
[1] | Organisation for Economic Co-operation and Development (2019) Health at a Glance. https://www.oecd.org/els/health-systems/health-at-a-glance-19991312.htm, Accessed on August 31, 2021. |
[2] | Ministry of Health, Labour and Welfare of Japan (2019) Framework of the Promotion of Measures for Dementia. https://www.mhlw.go.jp/content/000522832.pdf, Accessed on August 31, 2021. [in Japanese] |
[3] | Ohara T , Hata J , Yoshida D , Mukai N , Nagata M , Iwaki T , Kitazono T , Kanba S , Kiyohara Y , Ninomiya T ((2017) ) Trends in dementia prevalence, incidence, and survival rate in a Japanese community. Neurology 88: , 1925–1932. |
[4] | Schaller S , Mauskopf J , Kriza C , Wahlster P , Kolominsky-Rabas P ((2015) ) The main cost drivers in dementia: A systematic review. Int J Geriatr Psychiatry 30: , 111–129. |
[5] | Quentin W , Riedel-Heller S , Luppa M , Rudolph A , König H ((2010) ) Cost-of-illness studies of dementia: A systematic review focusing on stage dependency of costs. Acta Psychiatr Scand 121: , 243–259. |
[6] | Mauskopf J , Racketa J , Sherrill E ((2010) ) Alzheimer’s disease: The strength of association of costs with different measures of disease severity. J Nutr Health Aging 14: , 655–663. |
[7] | Weiner M , Powe N , Weller W , Shaffer T , Anderson G ((1998) ) Alzheimer’s disease under managed care: Implications from medicare utilization and expenditure patterns. J Am Geriatr Soc 46: , 762–770. |
[8] | Bynum JP , Rabins PV , Weller W , Niefeld M , Anderson GF , Wu AW ((2004) ) The relationship between a dementia diagnosis, chronic illness, Medicare expenditures, and hospital use. J Am Geriatr Soc 52: , 187–194. |
[9] | Lin PJ , Zhong Y , Fillit HM , Chen E , Neumann PJ ((2016) ) Medicare expenditures of individuals with Alzheimer’s disease and related dementias or mild cognitive impairment before and after diagnosis. J Am Geriatr Soc 64: , 1549–1557. |
[10] | Taylor DH Jr , Sloan FA ((2000) ) How much do persons with Alzheimer’s disease cost Medicare? J Am Geriatr Soc 48: , 639–646. |
[11] | White L , Fishman P , Basu A , Crane PK , Larson EB , Coe NB ((2019) ) Medicare expenditures attributable to dementia. Health Serv Res 54: , 773–781. |
[12] | Hurd MD , Martorell P , Delavande A , Mullen KJ , Langa KM ((2013) ) Monetary costs of dementia in the United States. N Engl J Med 368: , 1326–1334. |
[13] | Ku L , Pai M , Shih P ((2016) ) Economic impact of dementia by disease severity: Exploring the relationship between stage of dementia and cost of care in Taiwan. PLoS One 11: , e0148779. |
[14] | Nakanishi M , Igarashi A , Ueda K , Brnabic A , Treuer T , Sato M , Kahle-Wrobleski K , Meguro K , Yamada M , Mimura M , Arai H ((2020) ) Costs and resource use associated with community-dwelling patients with Alzheimer’s disease in Japan: Baseline results from the prospective observational GERAS-J Study. J Alzheimers Dis 74: , 127–138. |
[15] | Tamiya N , Noguchi H , Nishi A , Reich MR , Ikegami N , Hashimoto H , Shibuya K , Kawachi I , Campbell JC ((2011) ) Population ageing and wellbeing: Lessons from Japan’s long-term care insurance policy. Lancet 378: , 1183–1192. |
[16] | Ali MS , Prieto-Alhambra D , Lopes LC , Ramos D , Bispo N , Ichihara MY , Pescarini JM , Williamson E , Fiaccone RL , Barreto ML , Smeeth L ((2019) ) Propensity score methods in health technology assessment: Principles, extended applications, and recent advances. Front Pharmacol 10: , 973. |
[17] | Jackson JW , Schmid I , Stuart EA ((2017) ) Propensity scores in pharmacoepidemiology: Beyond the horizon. Curr Epidemiol Rep 4: , 271–280. |
[18] | Leon J , Cheng CK , Neumann PJ ((1998) ) Alzheimer’s disease care: Costs and potential savings. Health Aff (Millwood) 17: , 206–216. |
[19] | Wang G , Cheng Q , Zhang S , Bai L , Zeng J , Cui PJ , Zhang T , Sun ZK , Ren RJ , Deng YL , Xu W , Wang Y , Chen SD ((2008) ) Economic impact of dementia in developing countries: An evaluation of Alzheimer-type dementia in Shanghai, China. J Alzheimers Dis 15: , 109–115. |
[20] | Shiroiwa T , Fukuda T , Ikeda S , Takura T , Moriwaki K ((2017) ) Development of an official guideline for the economic evaluation of drugs/medical devices in Japan. Value Health 20: , 372–378. |


