
Race/Ethnic Disparities in Mild Cognitive Impairment and Dementia: The Northern Manhattan Study
Abstract
Background:
Variability in dementia rates across racial and ethnic groups has been estimated at 60%. Studies suggest disparities in Caribbean Hispanic and Black populations, but community-based data are limited.
Objective:
Estimate the prevalence of mild cognitive impairment (MCI) and dementia in the racially and ethnically diverse community-based Northern Manhattan Study cohort and examine sociodemographic, vascular risk factor, and brain imaging correlates.
Methods:
Cases of MCI and dementia were adjudicated by a team of neuropsychologists and neurologists and prevalence was estimated across race/ethnic groups. Ordinal proportional odds models were used to estimate race/ethnic differences in the prevalence of MCI or dementia adjusting for sociodemographic variables (model 1), model 1 plus potentially modifiable vascular risk factors (model 2), and model 1 plus structural imaging markers of brain integrity (model 3).
Results:
There were 989 participants with cognitive outcome determinations (mean age 69±9 years; 68% Hispanic, 16% Black, 14% White; 62% women; mean (±SD) follow-up five (±0.6) years). Hispanic and Black participants had greater likelihood of MCI (20%) and dementia (5%) than White participants accounting for age and education differences. Hispanic participants had greater odds of MCI or dementia than both White and Black participants adjusting for sociodemographic variables, vascular risk factors, and brain imaging factors. White matter hyperintensity burden was significantly associated with greater odds of MCI or dementia (OR = 1.3, 1.1 to 1.6), but there was no significant interaction by race/ethnicity.
Conclusion:
In this diverse community-based cohort, cross-sectional data revealed significant race/ethnic disparities in the prevalence of MCI and dementia. Longer follow-up and incidence data are needed to further clarify these relationships.
INTRODUCTION
Variability in dementia rates across racial and ethnic groups has been estimated at 60%, underscoring the importance of work to understand ethnoracial disparities [1]. Improving our understanding and reducing rates of cognitive impairment and dementia disparities is a major goal of the National Alzheimer’s Plan (NAPA). Understanding the factors underlying these disparities, including the importance of modifiable risk factors and susceptibility to pathological processes and resistance to them, is a priority to appropriately target interventional strategies.
Research in diverse cohorts plays an important role in clarifying race/ethnic differences, and disparities in the risk of mild cognitive impairment (MCI) and dementia have been reported for Black people in multiple studies over the past decades, but data on Hispanics is more limited [1–5]. Diverse cohorts that include multiple ethnic and racial groups with deep phenotyping of key behavioral and modifiable risk factor exposures, intermediate markers of brain integrity, and cognitive outcomes are needed to improve our understanding of disparities, especially in vascular cognitive impairment and dementia risk. White matter hyperintensities, subclinical brain infarcts, and brain atrophy measures detected by MRI can be particularly helpful in this regard. We examined ethnoracial disparities in the prevalence of MCI and dementia in a diverse population-based cohort of Caribbean Hispanic, Black, and White people living in the Northern Manhattan community of New York City.
MATERIALS AND METHODS
Study population
The NOMAS sample enrolled adults aged 40 and older (range 40–94) who had resided in Northern Manhattan for more than three months at the time of recruitment and had never been diagnosed with a stroke. Participants were recruited between 1993 and 2001 using random-digit dialing to participate in a baseline interview and assessment. The enrollment response rate was 75%, yielding participants (N = 3,298) of diverse race/ethnic backgrounds (Hispanic: 61% Dominican, 14% Puerto Rican, 12% Cuban, and 13% other; Black 22%, and White 32%). Annual telephone and in-person follow-up continues (loss to follow up < 5%). In 2003, the MRI sub-study began recruitment during annual telephone follow-up and included NOMAS participants who were clinically stroke-free, age 50 and older, and had no contraindications to MRI. An additional 199 household members were recruited to yield a final sample size of 1,290 by 2008. The study is approved by the IRBs of Columbia University Medical Center and the University of Miami School of Medicine and all subjects provided written informed consent.
Baseline evaluation
Participants had a thorough evaluation of vascular risk factors and medical history at the time of enrollment, including a physical/neurological examination by study physicians. Race/ethnicity was self-identified based on questions adapted from the 2000 US census and classified into four categories (White non-Hispanic, Black non-Hispanic, Hispanic, and non-Hispanic other race). Years of educational attainment, including degree achieved, were self-reported. Participants were asked about a history of hypertension and high blood pressure, diabetes mellitus and high blood sugar, high cholesterol, congestive heart failure, angina, coronary artery disease, atrial fibrillation, valvular heart disease, and peripheral vascular disease based on standardized questions adapted from the Behavioral Risk Factor Surveillance System of the Centers for Disease Control. Questionnaires were used to identify medical history, medication use, and health behaviors [6]. Medications for seizures, psychiatric indications, and pain were also documented. Smoking was categorized as current (within the past year), former, or never smoker of cigarettes, cigars, or pipes. Leisure-time physical activity was assessed by self-report using a questionnaire adapted from the National Health Interview Survey and moderate to heavy physical activity was defined as participation in at least one of several rigorous physical activities in a typical 14-day period [7]. Moderate alcohol use was defined as current drinking of one drink per month up to two drinks per day. Fasting blood specimens were analyzed at the Core Laboratory of the Irving Center for Clinical Research to determine blood glucose and lipoprotein levels using published methods [8]. Plasma levels of cholesterol subfractions were measured using standardized enzymatic procedures with a Hitachi 705 automated spectrophotometer (Boehringer Mannheim, Mannheim, Germany). Waist and hip circumferences were measured in inches with a flexible tape measure while participants were standing and wearing no heavy outer garments. Waist circumference (WC) was measured at the level of the umbilicus, and hip circumference was measured at the level of the bilateral greater trochanters, as previously described [9]. Systolic and diastolic blood pressures were calculated by averaging two measurements (before and after the physical examination) from the right brachial artery after a 10-minute rest in a seated position (Dinamap Pro100, Critikon Inc).
Brain MRI
Imaging was performed on a 1.5-Tesla MRI system (Philips Medical Systems, Best, The Netherlands) at the Columbia University Hatch Research Center. To segment white matter hyperintensities, semiautomated measurements of pixel distributions using mathematical modeling of pixel-intensity histograms for cerebrospinal fluid and brain white and gray matter were used to identify the optimal pixel-intensity threshold to distinguish cerebrospinal fluid from brain matter, using a custom-designed image analysis package (QUANTA 6.2 using a Sun Microsystems Ultra 5 workstation) [10]. For subclinical brain infarct readings, methods to identify and classify MRI-defined subclinical infarcts (SBI) have been published [11]. Two independent raters used a superimposed image of the subtraction, fluid attenuated inversion recovery (FLAIR), proton density, and T2-weighted images at 3×magnified view for interpretation of lesion characteristics. Agreement among raters has been good (published kappa values, 0.73–0.90) [12]. Processing of MRI scans to calculate total intracranial volumes (ICV), total cerebral volumes, and white matter hyperintensity volumes (WMHV), has been previously described [13]. To correct for head size, WMHV was calculated as percent total ICV and log-transformed to a normal distribution (log-WMHV). Proportion of total cerebral volume to total ICV was examined as brain parenchymal fraction. SBI were rated as present or absent.
Cognitive and functional assessment
Participants in the MRI sub-study were recruited between 2003 and 2008 and assessed in-person (defined as visit 1) and were interviewed by a trained research assistant, who administered structured questionnaires, a neuropsychological (NP) battery, and rated cognitive and functional status based on a structured interview. Adequacy of hearing and vision were assessed qualitatively by the research assistant and documented along with current medications. All tests were administered in English or Spanish based on participant preference. The Mini-Mental State Examination (MMSE) and Cognitive Failures Questionnaire (CFQ) were administered at the time of the NP battery in a designated quiet room. Most testing was on the day of MRI [14, 15]. Episodic memory was measured using three sub-scores derived from a 12-word five trial list-learning task: list learning total score, delayed recall score, and delayed recognition score. Executive function was assessed with two sub-scores: the difference in time to complete the Color Trails test Form 1 and Form 2, and the sum of the Odd-Man-Out subtests 2 and 4 [16]. Processing speed was assessed with the Grooved Pegboard task non-dominant hand time and the Color Trails test Form 1 [17, 18]. Working memory was assessed with the Digit Ordering and Letter Number Sequencing tests [19, 20]. Semantic memory was measured using three tests: picture naming (modified Boston Naming), category fluency (Animal Naming) and phonemic fluency (C, F, L in English speakers and P, S, V in Spanish speakers) [21, 22]. The Visual-Motor Integration test and the Symbol Digit Modalities tests were also administered [17, 23]. At the initial visit we estimated premorbid intelligence and literacy with the Peabody Picture Vocabulary Test (Test de Vocabulario en Imagenes Peabody for Spanish speakers), the Wide Range Achievement Test (English speakers) and the Word Accentuation Test (Spanish speakers) [24–26]. Depressive symptoms were quantified with the Center for Epidemiological Studies Depression scale (CES-D), a 20-item scale assessing depressive affect, somatic complaints, positive affect, and interpersonal relations [27].
A mean of 5.0±0.6 years after the initial neuropsychological assessment, a second in-person asse-ssment was conducted between 2008 and 2015 (visit 2). At the second visit, the CFQ, CES-D, MMSE, and neuropsychological battery were repeated with the addition of the Letter Number Sequencing test. The Informant Questionnaire of Cognitive Decline in the Elderly (IQCODE) was administered to a family member or friend of the participant as close in time to the neuropsychological assessment as possible [28]. The relationship of the informant to the participant was documented and aided adjudication.
Ascertainment of mild cognitive impairment and dementia
In 2015 NOMAS entered its fifth consecutive grant cycle and for the first time was funded to ascertain MCI and dementia status. A team of neuropsychologists and neurologists with dementia expertise used criteria from the National Institute on Aging–Alzheimer’s Association (NIA-AA) and the Diagnostic and Statistical Manual of Mental Disorders (5th Edition) for case ascertainment [29, 30]. MCI was based on 1) concern elicited from the participant (CFQ), informant (IQCODE), or other witness about a decline in cognition, 2) decline from a previous level of performance in at least one cognitive domain, 3) lack of significant functional impairment, and 4) lack of a psychiatric or other diagnosis that would explain the cognitive status. Dementia (major neurocognitive disorder) was based on 1) evidence of a decline from a previous level of performance in at least one cognitive domain, 2) functional impairment, and 3) lack of a psychiatric or other diagnosis that would explain the cognitive status. Each pair of adjudicators reviewed data from both visit 1 and visit 2 and completed a visit 2 grading form documenting cognitive status as healthy, MCI (with notation of amnestic and non-amnestic sub-types), dementia, other psychiatric disorder, or unable to classify.
To assess cognitive performance, we used individual neuropsychological test scores and cognitive domain-specific scores. Cognitive domains (episodic memory, semantic memory, processing speed and executive function) were created based on an exploratory factor analysis and prior findings. Because NOMAS participants have low educational attainment, literacy, and socio-economic status, and there are limited established norms that consider these factors, we constructed NOMAS-specific norms using neuropsychological test scores from visit 1. The normative values for each NP test were calculated from age (50–60, 61–70, 71–80 and > 80 years old) and education (0–6, 7–12 and > 12 years of education) group-specific means and standard deviations, excluding participants rated as likely to have dementia by the interviewer at visit 1. Each NP test score was standardized against its normative values, and each cognitive domain Z score was obtained by taking the average of the standardized NP test scores for the available component tests in a given domain.
Adjudicators accessed a Redcap web portal that displayed demographic information, visit eyesight and hearing status, neuropsychological domain and literacy Z-scores, dementia rating, MMSE and CES-D scores, most recent medication list and prior history of antidepressant and other psychiatric medications, psychiatric history, CFQ score, IQCODE score (cutoff for dementia > 3.6), and stroke history between visits (if applicable) [15]. Downloadable case-specific test forms were available for review to aid in assessments. Adjudicators were randomly assigned cases blinded to each other’s ratings based on an algorithm that identified participants with possible cognitive impairment. We derived an algorithm to segregate cases who had neuropsychological testing at Visit 2 into one of two pools: 1) those requiring adjudication, and 2) those rated as cognitively healthy based on an algorithm. The inclusion criteria for consensus adjudication were:
• Missing at least one of the 11 NP battery tests; or
• Two or more age and education normalized NP test Z-scores < –1.5; or
• One or more domain Z-scores < –1.5.
• Healthy: no cognitive domain Z-scores below –1.5, no evidence of dementia on the participant interview or IQCODE (score < 3.6).
• MCI: any domain Z-score below –1.5 and no evidence of dementia on the IQCODE (score < 3.6).
• Dementia: any domain Z-score below –1.5 and an IQCODE score 3.6 or greater.
Statistical analysis
Participant characteristics were compared across race/ethnicities. Characteristics of participants who only attended visit 1 and those who returned for visit 2 were also compared. We used ordinal proportional odds models to examine race/ethnic differences in prevalence using a three-level ordinal dependent variable of healthy, MCI, and dementia, and difference of association across the three ethnic groups collectively was tested using a likelihood ratio test with 2 degrees of freedom (LRT 2 df). Less than 2% of the sample self-identified as other race (Asian or Pacific Islander, American Indian or Alaskan Native) and were excluded from the analysis. Hispanic and non-Hispanic Black (referred to as Black) were entered into the model (reference = White). Odds of MCI or dementia comparing Hispanic participants to White and to Black participants, and comparing Black to White participants were calculated. Model 1 was adjusted for age, sex, years of educational attainment, medical insurance status (proxy for income), and literacy; model 2 was adjusted for variables in model 1 plus systolic and diastolic blood pressure, antihypertensive medication use, diabetes mellitus, smoking status, moderate alcohol use, physical activity, low and high density lipoprotein levels, and waist-to-hip ratio; model 3 was adjusted for variables in model 1 plus brain parenchymal fraction, log-WMHV, and SBI status. We tested for potential effect modifiers of race and ethnicity by entering multiplicative terms for significant covariates into the model. We performed a sensitivity analysis among participants with healthy cognition at visit 1 (MMSE > 26) to limit confounding by pre-morbid cognitive problems. Analyses were conducted using SAS 9.4 (SAS Institute, Cary, NC).
RESULTS
Characteristics of the study sample are shown in Table 1 (mean age = 69, IQR 63–74; 68% Hispanic, 16% Black, 14% White, 2% other race). In an unadjusted analysis, there were race/ethnic differences in those who returned for the second visit compared to those who only attended the first (flow across visits shown in Fig. 1). Hispanics were more likely to return than Black or White participants. There was significant heterogeneity in this unadjusted analysis across age, education, medical insurance status, smoking, diabetes, mellitus, diastolic blood pressure, high density lipoprotein levels, and percent WMHV (see Supplementary Table 1 for details). Further, Hispanic and Black participants who did not return for visit 2 had lower global cognitive domain scores, and Blacks had lower performance on literacy tests (Supplementary Table 1). In a multivariable adjusted model, there was no significant difference in returners versus non-returners across race/ethnic groups. However, compared to participants who only attended visit 1, those who returned for visit 2 were younger (OR = 0.96, 95% CI = 0.93 to 0.99), more likely to be women (OR = 1.6, 95% CI 1.0 to 2.3), had lower systolic (OR = 0.7, 95% CI = 0.6 to 0.9) and higher diastolic (OR = 1.3, 95% CI = 1.1 to 1.6) blood pressures, and had better global cognitive domain scores at visit 1 (OR = 1.8 per SD, 95% CI = 1.4 to 2.5; Supplementary Table 2).
Table 1
Participant characteristics
| Total (N = 989) | Hispanic (N = 672) | Black (N = 162) | White (N = 134) | p* | |
| Age, y | 69±9 | 68±8 | 72±9 | 72±9 | < 0.0001 |
| Years of education | 10±5 | 8±5 | 13±3 | 15±3 | < 0.0001 |
| Health insurance status | |||||
| Medicaid or no insurance (%) | 484 (49) | 434 (65) | 35 (22) | 12 (9) | < 0.0001 |
| Medicare or private insurance | 505 (51) | 238 (35) | 127 (78) | 122 (91) | |
| Women | 610 (62) | 425 (63) | 111 (69) | 67 (50) | 0.002 |
| Current smoker | 155 (16) | 97 (14) | 39 (24) | 18 (13) | 0.003 |
| Moderate or heavy physical activity | 97 (10) | 45 (7) | 19 (12) | 28 (21) | < 0.0001 |
| Diabetes mellitus | 267 (27) | 207 (31) | 42 (26) | 15 (11) | < 0.0001 |
| Systolic BP, mm Hg | 136±17 | 136±17 | 139±18 | 132±17 | 0.0003 |
| Diastolic BP, mm Hg | 79±9 | 79±9 | 80±10 | 76±10 | 0.0032 |
| Anti-hypertensive use | 590 (60) | 414 (62) | 109 (67) | 60 (45) | < 0.0001 |
| HDL, mg/dL | 53±17 | 50±14 | 61±20 | 59±20 | < 0.0001 |
| LDL, mg/dL | 116±36 | 118±36 | 111±35 | 114±35 | 0.314 |
| Waist hip ratio | 0.91 (0.08) | 0.92 (0.08) | 0.90 (0.08) | 0.92 (0.09) | 0.016 |
| Literacy/vocabulary | |||||
| WRAT and WAT, Z-score | 0.01±1.0 | –0.01±1.0 | –0.25±1.0 | 0.410±0.8 | < 0.0001 |
| Peabody, Z-score | 0.05±1.0 | 0.02±1.0 | –0.19±1.0 | 0.478±0.8 | < 0.0001 |
| Percent WMHV** | 0.5±0.7 | 0.5±0.7 | 0.9±1.0 | 0.6±0.8 | 0.0007 |
| Brain parenchymal fraction*** | 0.73±0.04 | 0.74±0.04 | 0.71±0.04 | 0.71±0.05 | < 0.0001 |
| Cognitive domain z-score¥ | |||||
| Memory | 0.025±1.059 | –0.002±1.047 | –0.050±1.067 | 0.266±1.094 | 0.003 |
| Language | –0.163±1.104 | –0.240±1.053 | –0.184±1.082 | 0.247±1.282 | < 0.0001 |
| Processing speed | –0.197±1.088 | –0.219±1.076 | –0.275±1.174 | 0.008±1.023 | 0.023 |
| Executive function | –0.130±1.038 | –0.237±0.988 | –0.097±1.153 | 0.365±1.000 | < 0.0001 |
| MMSE$ | 27±3 | 26±4 | 28±2 | 29±1 | < 0.0001 |
*p-values for age adjusted global comparison among 3 race-ethnicity groups (2 degrees of freedom). **Percent total cranial volume adjusted WMHV. ***Total cranial volume adjusted (proportion). ¥Age and education group normalized z-scores at visit 2. $Mini-Mental State Examination at visit 1. BP, blood pressure; HDL, high density lipoprotein; LDL, low density lipoprotein; WRAT, Wide Range Achievement Test; WAT, Word Accentuation Test; Peabody, Peabody Picture Vocabulary Test; WMHV, white matter hyperintensity volume.
Fig. 1
Flow chart showing NOMAS MRI sample participation in first and second in-person assessments. *Loss to follow-up may be temporary as attempts to recontact continue.
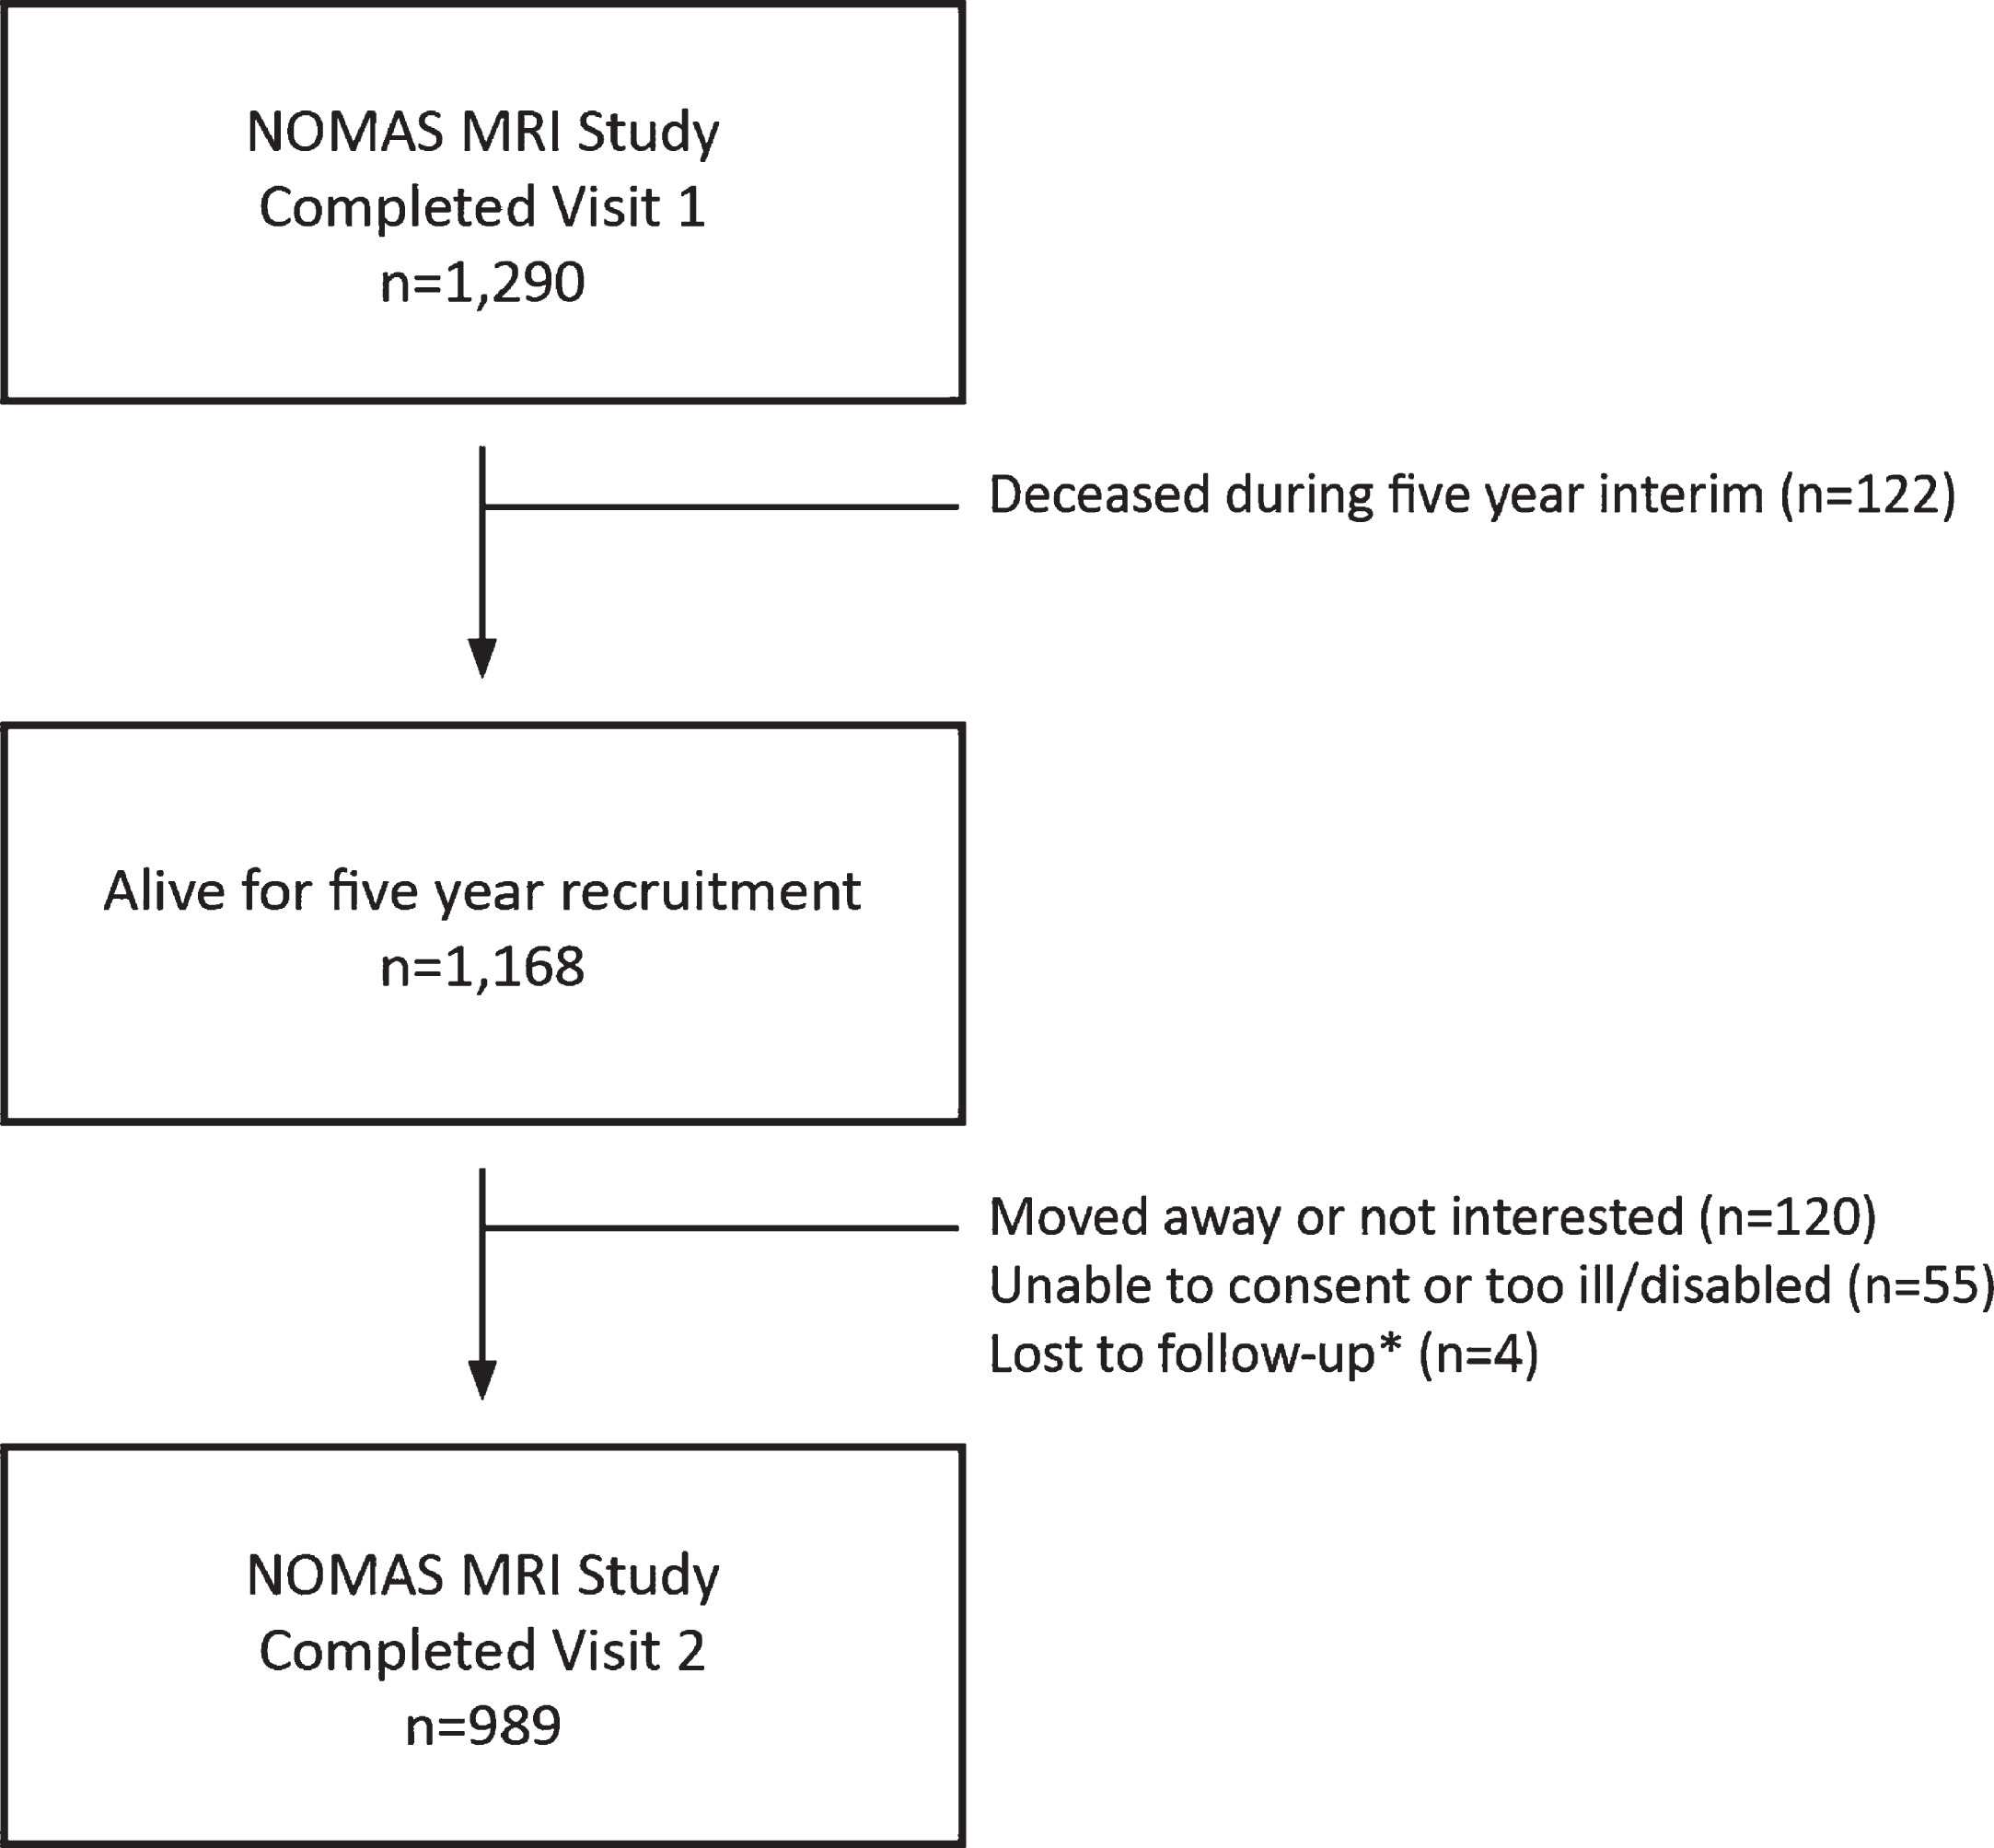
We ascertained the cognitive status of 989 NOMAS participants who attended visit 2. One hundred ninety-nine participants were adjudicated as having MCI (20%), 45 as having dementia (5%), 8 as Other or Unable to classify (< 1%), and 737 participants were adjudicated or identified by algorithm as having no cognitive impairment (74%). The breakdown of cognitive status by race/ethnicity is shown in Table 2. The ordinal odds of MCI or dementia was significantly greater for Black and Hispanic participants as a group compared to Whites adjusting for sociodemographic variables (LRT 2df, p < 0.0001; Table 3). Table 3 shows that adjusting for sociodemographic factors and literacy, each race/ethnicity had significantly greater odds of MCI or dementia than Whites (two-fold for Blacks and four-fold for Hispanics). Also, Hispanic participants had two-fold greater odds than Black participants of having MCI or dementia. Adjusting further for vascular risk factors in model 2, the association across race/ethnicity remained significant (LRT 2df, p < 0.0001). The associations were similar for each race/ethnic group, and Hispanics had significantly greater odds of MCI or dementia than both White and Black participants, but the difference between Black and White participants was no longer significant (Table 3). No individual risk factor was significantly associated with the odds of MCI or dementia in this model (data not shown). When we adjusted for sociodemographic variables and brain imaging markers in model 3, the odds of MCI or dementia remained significantly greater for Black and Hispanic participants than Whites (LRT 2df, p < 0.0001). Each race/ethnicity had similar odds of MCI or dementia as in Model 2. The associations were attenuated by almost 25% for Blacks compared to model 1 (OR = 1.7, 95% CI = 0.9 to 3.32) and did not change for Hispanics (OR = 4.2, 95% CI = 2.0 to 8.8). In this model, each unit greater log-WMHV burden was associated with 1.3 times greater odds of MCI or dementia (OR = 1.3, 95% CI = 1.1 to 1.6), but neither smaller brain parenchymal fraction nor SBI status was significantly associated with odds of MCI or dementia in model 3. There was no significant interaction between Black race and log-WMHV (p for interaction 0.47). The results were similar when we ran logistic regression models with dementia as the outcome grouping cognitively healthy and MCI together as the reference, and with MCI and dementia grouped together as the outcome versus those who were cognitively healthy (Supplementary Table 3). Restricting the primary analyses to NOMAS participants with normal MMSE scores (27 or greater) at visit 1, we found similar results (Supplementary Table 2).
Table 2
Mild cognitive impairment and dementia status by race/ethnicity at visit 2
| Cognitive status | Total (N = 989) | Hispanic (N = 672) | Black (N = 162) | White (N = 134) | p |
| Healthy, N (%)* | 737 (74) | 488 (74) | 116 (72) | 114 (86) | < 0.0001** |
| MCI | 199 (20) | 141 (20) | 40 (25) | 16 (12) | |
| Dementia | 45 (5) | 36 (5) | 6 (3) | 3 (2) |
*Rounded to whole numbers. **Chi-Squared with 4 degrees of freedom. MCI, mild cognitive impairment.
Table 3
Multivariable model of race/ethnicity and ordinal outcomes of MCI/dementia
| Parameter | OR¥ | 95% CI of OR¥ | p* | p† | |
| Model 1 | < 0.0001 | ||||
| Black versus | 1.9 | 1 | 3.7 | 0.048 | |
| White | |||||
| Hispanic versus | 4.5 | 2.3 | 8.9 | < 0.0001 | |
| White | |||||
| Hispanic versus | 2.3 | 1.3 | 4 | 0.003 | |
| Black | |||||
| Model 2 | < 0.0001 | ||||
| Black versus | 1.8 | 0.9 | 3.6 | 0.213 | |
| White | |||||
| Hispanic versus | 4.5 | 2.2 | 9.2 | 0.0002 | |
| White | |||||
| Hispanic versus | 2.6 | 1.4 | 4.9 | 0.003 | |
| Black | |||||
| Model 3 | < 0.0001 | ||||
| Black versus | 1.7 | 0.9 | 3.3 | 0.113 | |
| White | |||||
| Hispanic versus | 4.3 | 2.2 | 8.5 | < 0.0001 | |
| White | |||||
| Hispanic versus | 2.5 | 1.4 | 4.4 | 0.001 | |
| Black | |||||
¥ Odds Ratio and 95% CI based on ordinal regression. *p-value for pairwise comparison. †p-value for Likelihood Ratio Test with 2 degrees of freedom based on ordinal regression. Model 1 adjusted for age, education, medical insurance status, literacy. Model 2 adjusted for variables in model 1 and smoking, leisure time physical activity, diabetes mellitus, systolic and diastolic blood pressure, antihypertensive use, low- and high-density lipoprotein levels, waist hip ratio, and reported ethanol use. Model 3 adjusted for variables in model 1 and brain parenchymal fraction, subclinical infarct status, and log white matter hyperintensity volume.
DISCUSSION
This analysis of MCI and dementia prevalence in NOMAS represents the first estimate in the sample since expert adjudication of cognitive status was initiated in 2016. We found the prevalence of MCI and dementia to be similar to a number of other cohorts that have examined Hispanic, Black, and White people [5, 31–33]. For dementia the relatively low prevalence of 5% is similar to other cohorts that included people below the age of 65, and studies have generally reported that the proportion of people with dementia rises dramatically with age [4]. We found marked race/ethnic differences in this study. Black participants were twice as likely as White participants to have MCI or dementia adjusting for sociodemographic factors, and Caribbean Hispanic participants in NOMAS were more than four times as likely as White participants, and twice as likely as Black participants, to have MCI or dementia adjusting for sociodemographic and vascular risk factors as well as imaging markers of brain integrity. These findings were similar when the primary analysis was restricted to those with normal MMSE scores at visit 1.
Racial and ethnic disparities in dementia risk have been known for many years and are well supported by studies in different groups, including in a sample of Medicare participants in Northern Manhattan [34]. However, more recent data reported temporal trends showing sharp reductions in dementia rates across race/ethnic groups with greater declines for non-Hispanic Blacks and Whites [35]. The biracial Atherosclerosis Risk in Communities (ARIC) Neurocognitive Study found a greater prevalence of dementia, but not MCI, in Blacks compared to Whites [31]. Few studies have included Hispanics to be able to compare MCI and dementia prevalence across racial and ethnic groups [4, 5]. Continued follow-up in NOMAS will provide incidence data in a sample that included people as young as 50 at the time of the first evaluation of MCI and dementia status (visit 1).
Given the importance of midlife as opposed to late life vascular risk factors in the development of vascular cognitive impairment and dementia, opportunities to study these relationships in diverse cohorts are needed. Especially those where participants live in the same community, allowing comparison across groups without confounding introduced by different environments and heterogeneity in other local factors. The greater burden of some vascular risk factors that has been found in studies that have included Blacks or Hispanics might be expected to explain some of these disparities. Interestingly, in this cross-sectional analysis, adjusting for potentially modifiable vascular risk factors did not explain much of the variance in the association of race/ethnicity with MCI and dementia status, although the association for Blacks was attenuated slightly. Not all studies have confirmed links with vascular risk factor exposures. In the ARIC study, Blacks were at elevated risk of dementia compared to Whites but midlife risk factor burden did not play a key role [3]. Similarly, in the Health, Aging, and Body Composition study, Blacks were at elevated risk of dementia compared to Whites and adjusting for vascular and other comorbidities did not attenuate this effect [36]. Among Black and Caribbean Hispanic Medicare recipients in Northern Manhattan, diabetes contributed significantly to MCI and dementia risk [37, 38]. Diabetes mellitus was also a risk factor for MCI in the Hispanic Communities Health Study that includes Caribbean Hispanic participants, such as in NOMAS, and other groups [39]. In the community-based participatory research approach-based Health and Aging Brain among Latino Elders (HABLE) study, comorbid depression and diabetes was associated with greater odds of MCI in Mexican Americans [40]. In NOMAS, we did not find that diabetes was a significant contributor to the odds of MCI or dementia prevalence, but continued follow-up is needed. Almost two-thirds of NOMAS participants are from the Dominican Republic and we lacked power to examine associations across countries of origin among Hispanics. Midlife hypertension has also been associated with MCI and dementia risk in diverse cohorts, but the risk for dementia was greater for White than Black participants in ARIC [41, 42]. There are a number of reasons why midlife risk factors would not explain later cognitive outcomes, including variability in duration of exposure and competing risk of death.
Brain imaging studies can help clarify disparities in the downstream effects of exposure to behavioral and vascular risk factors as well as capture evidence of neurodegeneration. White matter lesion burden has been associated with conversion from healthy to MCI and rate of decline from MCI to dementia [43, 44]. This is of particular interest because WMH are related to cerebral small vessel disease, providing an opportunity for prevention through risk factor control especially hypertension [45]. Both Black and Hispanic participants have been found to have a greater burden of WMH in several studies, and WMH burden was related to ideal cardiovascular health in NOMAS [46, 47]. In a study among Mexican Americans both hippocampal volume and WMH burden were independent predictors of dementia [48]. In keeping with this, the current analysis found that WMH burden explained some of the variance in the odds of MCI and dementia between Black and non-Hispanic White NOMAS participants. However, sociodemographic variables, vascular risk factors, and brain imaging markers did not explain much of the disparity between Hispanic and White, or Hispanic and Black, participants. The reason for this is not clear, but degree of risk factor control and length of exposure were not captured by risk factor adjustment and could be of explanatory value.
Strengths of this study include the well-pheno-typed diverse cohort that includes behavioral and risk factor data as well as imaging markers of brain integrity. Survival of participants to participate in the MRI sub-cohort yielded a younger, healthier group with better cognitive performance than the original population-based NOMAS sample. Given the likelihood of differential dropout due to mortality leading up to the waves of cognitive assessments, it is likely that some bias was introduced. We did not conduct analyses of the competing risk of mortality for this study. Prospective data collection is underway and will allow the current prevalence estimates to establish a baseline for incidence studies where competing risk models will be of value. Differential rates of decline across ethnoracial groups could also have affected our cross-sectional estimates. As with all cross-sectional observational studies, unmeasured confounding of risk factors for cognitive and brain health are another potential source of bias.
In conclusion, data from this racially and ethnically diverse cohort study show that Black and Caribbean Hispanic people were more likely than Whites to have MCI or dementia at the second visit even if they had no more than mild cognitive problems at the first. These disparities in MCI and dementia prevalence were independent of sociodemographic and vascular risk factors and imaging markers of brain integrity. Prospective data from NOMAS will help clarify these findings in the future.
ACKNOWLEDGMENTS
This study was supported by the National Institute of Neurological Disorders and Stroke (grant NS 29993).
Authors’ disclosures available online (https://www.j-alz.com/manuscript-disclosures/20-1370r2).
SUPPLEMENTARY MATERIAL
[1] The supplementary material is available in the electronic version of this article: https://dx.doi.org/10.3233/JAD-201370.
REFERENCES
[1] | Mayeda ER , Glymour MM , Quesenberry CP , Whitmer RA ((2016) ) Inequalities in dementia incidence between six racial and ethnic groups over 14 years. Alzheimers Dement 12: , 216–224. |
[2] | Gurland BJ , Wilder DE , Lantigua R , Stern Y , Chen J , Killeffer EHP , Mayeux R ((1999) ) Rates of dementia in three ethnoracial groups. Int J Geriatr Psychiatry 14: , 481–493. |
[3] | Gottesman RF , Albert MS , Alonso A , Coker LH , Coresh J , Davis SM , Deal JA , McKhann GM , Mosley TH , Sharrett AR , Schneider ALC , Windham BG , Wruck LM , Knopman DS ((2017) ) Associations between midlife vascular risk factors and 25-year incident dementia in the Atherosclerosis Risk in Communities (ARIC) cohort. JAMA Neurol 74: , 1246–1254. |
[4] | Mehta KM , Yeo GW ((2017) ) Systematic review of dementia prevalence and incidence in United States race/ethnic populations. Alzheimers Dement 13: , 72–83. |
[5] | Gonzalez HM , Tarraf W , Schneiderman N , Fornage M , Vasquez PM , Zeng D , Youngblood M , Gallo LC , Daviglus ML , Lipton RB , Kaplan R , Ramos AR , Lamar M , Thomas S , Chai A , DeCarli C ((2019) ) Prevalence and correlates of mild cognitive impairment among diverse Hispanics/Latinos: Study of Latinos-Investigation of Neurocognitive Aging results. Alzheimers Dement 15: , 1507–1515. |
[6] | Centers for Disease Control and Prevention, Behavioral Risk Factor Sureveillance System, U.S. Government, https://www.cdc.gov/brfss/questionnaires/pdf-ques/93brfss.pdf, Last reviewed August 28, 2020, Accessed December 17, 2020. |
[7] | Sacco RL , Gan R , Boden-Albala B , Lin IF , Kargman DE , Hauser WA , Shea S , Paik MC ((1998) ) Leisure-time physical activity and ischemic stroke risk: The Northern Manhattan Stroke Study. Stroke 29: , 380–387. |
[8] | Matthews DR , Hosker JP , Rudenski AS , Naylor BA , Treacher DF , Turner RC ((1985) ) Homeostasis model assessment: Insulin resistance and beta-cell function from fasting plasma glucose and insulin concentrations in man. Diabetologia 28: , 412–419. |
[9] | Caunca MR , Gardener H , Simonetto M , Cheung YK , Alperin N , Yoshita M , DeCarli C , Elkind MSV , Sacco RL , Wright CB , Rundek T ((2019) ) Measures of obesity are associated with MRI markers of brain aging: The Northern Manhattan Study. Neurology 93: , e791–e803. |
[10] | DeCarli C , Murphy DG , Teichberg D , Campbell G , Sobering GS ((1996) ) Local histogram correction of MRI spatially dependent image pixel intensity nonuniformity. J Magn Reson Imaging 6: , 519–528. |
[11] | Prabhakaran S , Wright CB , Yoshita M , Delapaz R , Brown T , DeCarli C , Sacco RL ((2008) ) Prevalence and determinants of subclinical brain infarction: The Northern Manhattan Study. Neurology 70: , 425–430. |
[12] | DeCarli C , Fletcher E , Ramey V , Harvey D , Jagust WJ ((2005) ) Anatomical mapping of white matter hyperintensities (WMH): Exploring the relationships between periventricular WMH, deep WMH, and total WMH burden. Stroke 36: , 50–55. |
[13] | Dong C , Nabizadeh N , Caunca M , Cheung YK , Rundek T , Elkind MS , DeCarli C , Sacco RL , Stern Y , Wright CB ((2015) ) Cognitive correlates of white matter lesion load and brain atrophy: The Northern Manhattan Study. Neurology 85: , 441–449. |
[14] | Folstein MF , Folstein SE , McHugh PR ((1975) ) “Mini-mental state”. A practical method for grading the cognitive state of patients for the clinician. J Psychiatr Res 12: , 189–198. |
[15] | Broadbent DE , Cooper PF , FitzGerald P , Parkes KR ((1982) ) The Cognitive Failures Questionnaire (CFQ) and its correlates. Br J Clin Psychol 21: , 1–16. |
[16] | D’Elia L , Satz P , Uchiyama CL , White T (1994) Color Trails Test Professional Manual, Psychological Assessment Resources, Odessa. |
[17] | Beery K ((1989) ) The VMI, Developmental Test of Visual Motor Integration, Modern Curriculum Press, Cleveland, OH. |
[18] | Ruff RM , Parker SB ((1993) ) Gender- and age-specific changes in motor speed and eye-hand coordination in adults: Normative values for the Finger Tapping and Grooved Pegboard Tests. Percept Mot Skills 76: , 1219–1230. |
[19] | Weschler D (1997) Wechsler adult intelligence scale - third edition, Psychological Corporation. |
[20] | Hoppe CD , Muller UD , Werheid KD , Thone AD , von Cramon YD ((2000) ) Digit Ordering Test: Clinical, psychometric, and experimental evaluation of a verbal working memory test. Clin Neuropsychol 14: , 38–55. |
[21] | Goodglass H , Kaplan E ((1983) ) The assessment of aphasia and related disorders, Lea & Febiger, Philadelphia. |
[22] | Benton AL , Hamsher K , Sivan AB ((1994) ) Manual for the Multiligual Aphasia Examination, AJA Associates, Inc., 3rd Ed., Iowa City. . |
[23] | Smith A (1982) Symbol digit modalities test: Manual.Western Psychological Services. |
[24] | Dunn LM , Dunn LM (1997) Peabody picture vocabulary test, American Guidance Service, Circle Pines. |
[25] | Stone M , Jastak S , Wilkinson G ((1995) ) Wide Range Achievement Test. Rasch Measurement Transactions 8: , 403. |
[26] | Del Ser T , Gonzalez-Montalvo JI , Martinez-Espinosa S , Delgado-Villapalos C , Bermejo F ((1997) ) Estimation of premorbid intelligence in Spanish people with the Word Accentuation Test and its application to the diagnosis of dementia. Brain Cogn 33: , 343–356. |
[27] | Radloff LS ((1977) ) The CES-D Scale: A self-report depression scale for research in the general population. Appl Psychol Measure 1: , 385–401. |
[28] | Jorm AF ((1994) ) A short form of the Informant Questionnaire on Cognitive Decline in the Elderly (IQCODE): Development and cross-validation. Psychol Med 24: , 145–153. |
[29] | Albert MS , DeKosky ST , Dickson D , Dubois B , Feldman HH , Fox NC , Gamst A , Holtzman DM , Jagust WJ , Petersen RC , Snyder PJ , Carrillo MC , Thies B , Phelps CH ((2011) ) The diagnosis of mild cognitive impairment due to Alzheimer’s disease: Recommendations from the National Institute on Aging-Alzheimer’s Association workgroups on diagnostic guidelines for Alzheimer’s disease. Alzheimers Dement 7: , 270–279. |
[30] | American Psychiatric Association (2013) DSM-5 Task Force. Diagnostic and statistical manual of mental disorders: DSM-5. Washington, DC. |
[31] | Knopman DS , Gottesman RF , Sharrett AR , Wruck LM , Windham BG , Coker L , Schneider AL , Hengrui S , Alonso A , Coresh J , Albert MS , Mosley TH Jr. ((2016) ) Mild cognitive impairment and dementia prevalence: The Atherosclerosis Risk in Communities Neurocognitive Study (ARIC-NCS). Alzheimers Dement (Amst) 2: , 1–11. |
[32] | Petersen RC , Roberts RO , Knopman DS , Geda YE , Cha RH , Pankratz VS , Boeve BF , Tangalos EG , Ivnik RJ , Rocca WA ((2010) ) Prevalence of mild cognitive impairment is higher in men. The Mayo Clinic Study of Aging. Neurology 75: , 889–897. |
[33] | Lopez OL , Jagust WJ , DeKosky ST , Becker JT , Fitzpatrick A , Dulberg C , Breitner J , Lyketsos C , Jones B , Kawas C , Carlson M , Kuller LH ((2003) ) Prevalence and classification of mild cognitive impairment in the Cardiovascular Health Study Cognition Study: Part 1. Arch Neurol 60: , 1385–1389. |
[34] | Gurland BJ , Wilder DE , Lantigua R , Stern Y , Chen J , Killeffer EH , Mayeux R ((1999) ) Rates of dementia in three ethnoracial groups. Int J Geriatr Psychiatry 14: , 481–493. |
[35] | Noble JM , Schupf N , Manly JJ , Andrews H , Tang MX , Mayeux R ((2017) ) Secular trends in the incidence of dementia in a multi-ethnic community. J Alzheimers Dis 60: , 1065–1075. |
[36] | Yaffe K , Falvey C , Harris TB , Newman A , Satterfield S , Koster A , Ayonayon H , Simonsick E ((2013) ) Effect of socioeconomic disparities on incidence of dementia among biracial older adults: Prospective study. BMJ 347: , f7051. |
[37] | Luchsinger JA , Reitz C , Patel B , Tang MX , Manly JJ , Mayeux R ((2007) ) Relation of diabetes to mild cognitive impairment. Arch Neurol 64: , 570–575. |
[38] | Cheng D , Noble J , Tang MX , Schupf N , Mayeux R , Luchsinger JA ((2011) ) Type 2 diabetes and late-onset Alzheimer’s disease. Dement Geriatr Cogn Disord 31: , 424–430. |
[39] | Gonzalez HM , Tarraf W , Gonzalez KA , Fornage M , Zeng D , Gallo LC , Talavera GA , Daviglus ML , Lipton RB , Kaplan R , Ramos AR , Lamar M , Cai J , DeCarli C , Schneiderman N ((2020) ) Diabetes, cognitive decline, and mild cognitive impairment among diverse Hispanics/Latinos: Study of Latinos-Investigation of Neurocognitive Aging Results (HCHS/SOL). Diabetes Care 43: , 1111–1117. |
[40] | Johnson LA , Gamboa A , Vintimilla R , Cheatwood AJ , Grant A , Trivedi A , Edwards M , Hall JR , O’Bryant SE ((2015) ) Comorbid depression and diabetes as a risk for mild cognitive impairment and Alzheimer’s disease in elderly Mexican Americans. J Alzheimers Dis 47: , 129–136. |
[41] | Walker KA , Sharrett AR , Wu A , Schneider ALC , Albert M , Lutsey PL , Bandeen-Roche K , Coresh J , Gross AL , Windham BG , Knopman DS , Power MC , Rawlings AM , Mosley TH , Gottesman RF ((2019) ) Association of midlife to late-life blood pressure patterns with incident dementia. JAMA 322: , 535–545. |
[42] | Reitz C , Tang MX , Manly J , Mayeux R , Luchsinger JA ((2007) ) Hypertension and the risk of mild cognitive impairment. Arch Neurol 64: , 1734–1740. |
[43] | Bangen KJ , Preis SR , Delano-Wood L , Wolf PA , Libon DJ , Bondi MW , Au R , DeCarli C , Brickman AM ((2018) ) Baseline white matter hyperintensities and hippocampal volume are associated with conversion from normal cognition to mild cognitive impairment in the Framingham Offspring Study. Alzheimer Dis Assoc Disord 32: , 50–56. |
[44] | Tosto G , Zimmerman ME , Carmichael OT , Brickman AM , Alzheimer’s Disease Neuroimaging Initiative ((2014) ) Predicting aggressive decline in mild cognitive impairment: The importance of white matter hyperintensities. JAMA Neurol 71: , 872–877. |
[45] | SPRINT MIND Investigators for the SPRINT Research Group Nasrallah IM , Pajewski NM , Auchus AP , Chelune G , Cheung AK , Cleveland ML , Coker LH , Crowe MG , Cushman WC , Cutler JA , Davatzikos C , Desiderio L , Doshi J , Erus G , Fine LJ , Gaussoin SA , Harris D , Johnson KC , Kimmel PL , Kurella Tamura M , Launer LJ , Lerner AJ , Lewis CE , Martindale-Adams J , Moy CS , Nichols LO , Oparil S , Ogrocki PK , Rahman M , Rapp SR , Reboussin DM , Rocco MV , Sachs BC , Sink KM , Still CH , Supiano MA , Snyder JK , Wadley VG , Walker J , Weiner DE , Whelton PK , Wilson VM , Woolard N , Wright JT Jr. , Wright CB , Williamson JD , Bryan RN ((2019) ) Association of intensive vs standard blood pressure control with cerebral white matter lesions. JAMA 322: , 524–534. |
[46] | Brickman AM , Schupf N , Manly JJ , Luchsinger JA , Andrews H , Tang MX , Reitz C , Small SA , Mayeux R , DeCarli C , Brown TR ((2008) ) Brain morphology in older African Americans, Caribbean Hispanics, and whites from northern Manhattan. Arch Neurol 65: , 1053–1061. |
[47] | Gardener H , Caunca M , Dong C , Cheung Ying K , Alperin N , Rundek T , ElkindMSV, WrightCB, SaccoRL ((2018) ) Ideal cardiovascular health and biomarkers of subclinical brain aging: The Northern Manhattan Study. J Am Heart Assoc 7: , e009544. |
[48] | Wu CC , Mungas D , Petkov CI , Eberling JL , Zrelak PA , Buonocore MH , Brunberg JA , Haan MN , Jagust WJ ((2002) ) Brain structure and cognition in a community sample of elderly Latinos. Neurology 59: , 383–391. |


