
Metabolic, Phenotypic, and Neuropathological Characterization of the Tg4-42 Mouse Model for Alzheimer’s Disease
Abstract
Background:
Preclinical Alzheimer’s disease (AD) research strongly depends on transgenic mouse models that display major symptoms of the disease. Although several AD mouse models have been developed representing relevant pathologies, only a fraction of available mouse models, like the Tg4-42 mouse model, display hippocampal atrophy caused by the death of neurons as the key feature of AD. The Tg4-42 mouse model is therefore very valuable for use in preclinical research. Furthermore, metabolic biomarkers which have the potential to detect biochemical changes, are crucial to gain deeper insights into the pathways, the underlying pathological mechanisms and disease progression.
Objective:
We thus performed an in-depth characterization of Tg4-42 mice by using an integrated approach to analyze alterations of complex biological networks in this AD in vivo model.
Methods:
Therefore, untargeted NMR-based metabolomic phenotyping was combined with behavioral tests and immunohistological and biochemical analyses.
Results:
Our in vivo experiments demonstrate a loss of body weight increase in homozygous Tg4-42 mice over time as well as severe impaired learning behavior and memory deficits in the Morris water maze behavioral test. Furthermore, we found significantly altered metabolites in two different brain regions and metabolic changes of the glutamate/4-aminobutyrate-glutamine axis. Based on these results, downstream effects were analyzed showing increased Aβ42 levels, increased neuroinflammation as indicated by increased astro- and microgliosis as well as neuronal degeneration and neuronal loss in homozygous Tg4-42 mice.
Conclusion:
Our study provides a comprehensive characterization of the Tg4-42 mouse model which could lead to a deeper understanding of pathological features of AD. Additionally this study reveals changes in metabolic biomarker which set the base for future preclinical studies or drug development.
INTRODUCTION
Alzheimer’s disease (AD), the most common cause of dementia, is an irreversible and progressive neurodegenerative disease that slowly destroys cognitive functions and memory. With the significant increase of AD cases in a rapidly aging population in developing and developed countries, AD is a growing problem around the world [1]. While the underlying mechanisms and pathways of AD are still not fully understood, considerable evidence points to amyloid-β (Aβ) peptides as a key player in the pathogenesis of AD. Main Aβ variants detected in human brains are Aβ1–40 and Aβ1–42; however, a significant proportion of AD brains contains N-terminally modified Aβ which is described to enhance aggregation and neurotoxicity [2–4]. The mechanism by which Aβ42 exerts neurotoxicity is poorly understood but many different mechanisms have been hypothesized [5].
In order to further elucidate the toxicity of Aβ42 the transgenic mouse model Tg4-42 was developed. This mouse model overexpresses human Aβ4–42 which leads to an intracellular Aβ accumulation in the brain of these mice albeit without plaque formation [6, 7].
Although none of the many published AD transgenic mouse models fully replicates the human disease the ability to study similar pathological processes in living animals has provided new insights into the effects and biological basis of the disease and opportunities to test new therapeutic approaches. Several AD mouse models have been developed which represent disease relevant features. Nevertheless, only a fraction of available mouse models display hippocampal atrophy caused by the death of neurons, which is one of the main features of AD. The here investigated Tg4-42 mouse model exhibits microgliosis and astrogliosis, severe synaptic impairments, and neuronal loss and therefore represent a promising model for the development of new drugs or drug efficacy studies [8, 9]. Although the phenotype of homozygous Tg4-42 mice could be influenced by retinoic acid receptor beta knockout [10], therapeutic intervention studies rather indicate that the observed phenotype is caused by the Aβ4–42 transgene [9, 11].
Besides Aβ peptide depositions and neurofibrillary tangles in AD brains, which are the major hallmarks in AD, many other factors contribute in a complex manner to the pathogenesis of AD [12]. Therefore, metabolites are becoming of increasing interest in order to be able to detect biochemical changes which lead to an understanding how perturbations in metabolism are related to AD neuropathology. In the last years, NMR spectroscopy has evolved as one of the principal analytical techniques used in metabolomics [13–15]. Untargeted metabolic phenotyping is a powerful tool for mapping global biochemical changes in disease and treatment [16, 17]. In contrast to targeted biochemical approaches which focus on single metabolites, these approaches can simultaneously identify hundreds to thousands of metabolites. Disturbances in the metabolic network can help to better understand biochemical pathways, underlying disease progression and further provide complementary markers for the evaluation of mouse models for pre-clinical research [18–21].
In this study, we performed behavioral tests to validate and expand the already known phenotype which shows that Tg4-42 +/+ mice develop severe learning and spatial reference memory deficits [7, 9]. Furthermore, untargeted metabolic phenotyping was carried out to evaluate involved metabolites and pathways. To further analyze this mouse model in detail and to examine downstream effects, we determined neuroinflammation, Aβ42 levels, and neurodegeneration. Our results verify the in vivo experiments by Bouter et al., extend these results, and uncover metabolic markers for a disease mouse model which can set the base for further pre-clinical studies.
MATERIAL AND METHODS
Animals
Male homozygous (Tg4-42 +/+) and non-tr-ansgenic (NTG) control mice with a C57BL6 background at different ages (3, 6, and 9 months) were used in this study. As Tg4-42 +/+ mice were bred using homozygous breeders, no NTG control mice could be received from this breeding. To ensure that the genetic background of study groups does not influence the animal’s phenotype, a control study was performed comparing the NTG control mice with C57BL6 background with male homozygous, hemizygous mice, and NTG littermates of a hemizygous breeding at the age of 6 months. This analysis resulted in no significant differences between the two NTG control groups in the Open field test, Elevated plus maze test, Irwin test, and Morris water maze test, suggesting that the background of the study groups does not influence the study’s results. Detailed information about the transgene integration sides, promotors, etc., about this mouse model is previously described in Hinteregger et al. [10]. All mice were bred and housed in individually ventilated cages in a controlled environment on a 12/12 h light/dark cycle (lights on from 6 a.m.–6 p.m.). The room temperature (RT) was kept at approximately 21°C and the relative humidity between 40 to 70%. Animals were fed with dried pelleted standard rodent chow (Altromin®, Lage, Germany) and normal tap water ad libitum in an AAALAC-accredited animal facility. Each animal was checked regularly for any clinical signs and all efforts were made to minimize suffering.
All experiments including animal tissue were performed in accordance with the Austrian guidelines for the care and use of laboratory animals (Tierversuchsgesetz 2012-TVG 2012, BGBl. I Nr. 114/2012). Animal housing and euthanasia were approved by the Styrian government (Amt der Steiermärkischen Landesregierung, Abteilung 13 –Umwelt und Raumordnung Austria; ABT13-78JO-215/2017).
Behavioral tests
All behavioral tests were performed during the early phase of the light cycle and animals were habituated to the experimental room for at least 1 h. Animals were tested in the Irwin test at 3, 6, and 9 months of age to evaluate physical characteristics, conspicuities and to test sensorimotor reflexes and motor abilities (Wire suspension test). The Morris water maze test (MWM) was performed at an age of 9 months to analyze spatial learning of all mice. Animals were randomly placed at three different starting positions of a circular pool with a diameter of 100 cm filled with water (22±1°C). Mice had to find a transparent platform which was always placed on the same position of the pool. Visual cues displayed on the wall helped the mice to orientate. Light conditions were kept constant at 60±5 Lux. The MWM was performed using the following protocol: Four trials on each of four consecutive days were performed. In all trials, the platform was located in the northeast (NE) quadrant of the pool. Mice started from predefined positions (southeast, southwest, northwest). A single trial lasted for a maximum of 60 s. In case the mouse did not find the hidden, diaphanous platform within the given time, the experimenter guided the mouse to the platform. Mice were allowed to rest on the platform for around 15 s to orientate in the surrounding. On day 5, mice were tested in the probe trial (PT). During the PT, the platform was removed from the pool and the number of crossings over the former target position, the latency to first visit the target zone as well as the time spent in the target quadrant was recorded. For all readouts, a computerized video tracking system (Biobserve Viewer III, Bonn, Germany) was used.
Tissue preparation
Mice were deeply anesthetized by i.p. injection of 600 mg/kg pentobarbital at the age of 9 months. Once animals were deeply anesthetized, cerebrospinal fluid (CSF) was collected and afterwards blood was drawn by heart puncture of the left ventricle. Then mice were transcardially perfused with physiological (0.9%) saline. Thereafter, brains were removed and hemisected, and the left hemisphere was subdivided into different brain areas, immediately frozen on dry ice and stored at –80°C. The right brain hemisphere was fixed by immersion at 4°C in fresh 4%formaldehyde in phosphate buffer (pH 7.4) for 2 h at room temperature. Thereafter, the tissue was transferred to a 15%sucrose/phosphate buffered saline solution until sunk to ensure cryoprotection. On the next day, the fixed hemisphere was shock frozen, embedded in OCT media using cryo-molds in cooled liquid isopentane, and stored at –80°C until used for histological analyses.
NMR metabolic profiling
NMR experiments were performed at 310 K on an Avance Neo Bruker Ultrashield 600 MHz spectrometer equipped with a TXI probe head with Bruker Topspin version 4.0.2. For one-dimensional experiments the cpmgpr 1d pulse sequence (Bruker, size of fid 73728, 11904.76 Hz spectral width, 128 scans, d1 = 4 s and L4 of 128) was used. To preci-pitate proteins and to quench enzymatic reactions in the samples, a mixture of –20°C cooled metha-nol/ultrapure water (2:1) was added to the tissue. After homogenization with the Precellys tissue homogenizer system, samples were frozen at –20°C for 1 h. Afterwards samples were centrifuged at 13000 rpm at 4°C for 30 min. After that supernatants were lyophilized, re-dissolved with 500μl NMR buffer (0.08 M Na2HPO4, 0.04 %NaN3, 5 mM TSP dissolved in 2H2O and adjusted to pH 7.3 with 12.2 M HCl and 5 M NaOH) and transferred to NMR tubes. Metabolites were measured as described previously [22–24]. For chemical shift referencing (set to 0 ppm) TSP (Sodium trimethylsilyl [2, 2, 3, 3-2H4] propionate) was used as internal standard. NMR raw data were imported to Matlab2014b software processed, regions around the water, TSP, and methanol signals were excluded and a phase and baseline correction was performed. In order to correct for sample dilution, NMR spectra were aligned, and a probabilistic quotient normalization was performed. For the statistical analysis of these complex data, MetaboAnalyst 4.0 was used to carry out Principal Component Analysis (PCA) as well as Orthogonal-Partial Least Square-Discriminant Analysis (O-PLS-DA). For the identification of metabolites Chenomx NMR Suite Professional 8.2 (Chenomx Inc.) was used. Quantification of metabolites was applied by using the integral area of the metabolite of interest of the normalized NMR spectra.
Biochemical measurement of human Aβ42
Left cortex samples were homogenized in tissue homogenization buffer (THB; 250 mM Sucrose, 1 mM EDTA, 1 mM EGTA, 20 mM Tris pH 7.4), aliquoted and stored at –80°C until further use.
For extraction of non-plaque associated proteins, THB homogenate was mixed with 1 part diethylamine (DEA) solution (0.4%DEA, 100 mM NaCl). The mixture was centrifuged for 120 min at 20,000×g, 4°C. After that the supernatant was neutralized with 1/10 of the volume 0.5 M Tris-HCl, pH 6.8, vortexed briefly and stored at –20°C. For extraction of deposited proteins, THB homogenate was mixed with 2.2 parts cold formic acid (FA), sonicated for 30 s on ice and centrifuged for 120 min at 20,000×g at 4°C. Then the supernatant was mixed with 19 parts FA Neutralization Solution (1 M Tris, 0.5 M Na2HPO4, 0.05%NaN3), vortexed briefly and stored at –20°C. Aβ42 was measured in the DEA and FA fractions from cortex samples by an immunosorbent assay (Aβ Peptide Panel 1 (6E10); K15200E-2; Meso Scale Discovery, Rockville, MD, USA) according to the manufacturer’s instructions. Aβ42 levels in study samples were evaluated in comparison to calibration curves provided in the kit and are expressed as pg/mg brain wet weight.
Measurement of neurofilament light chain levels in CSF
For analysis of neurofilament-light chain (NF-L) in CSF samples, the NF-light®ELISA 10-7001 CE from UmanDiagnostics (Umea, Sweden) was used. Therefore, samples were diluted 1:15 in assay buffer and analyzed according to the manufacturers protocol. In brief, after dilution 50μl of each sample was added to the pre-coated wells and incubated for 1 h at RT with gentle agitation (800 rpm). Wells were washed three times with assay wash buffer and 100μl of the tracer antibody were added. After 45 min incubation (RT, 800 rpm) wells were again washed three times. Thereafter 100μl of conjugate were added and incubated for 30 min (RT, 800 rpm). After 3× washing, 100μl of TMB substrate were added to each well and incubated for 15 min at RT. 50μl stop reagent were added and after short gentle agitation, the plate was read at 450 nm (reference 620–650 nm) on the μQuant reader (Biotek, Winooski, VT, USA). Data were evaluated in comparison to calibration curves provided in the kit and are expressed as pg/ml.
Histology
Frozen brain hemispheres were sagittally sectioned at 10μm thickness on a Leica CM3050S cryotome. Sectioning levels were chosen according to the brain atlas of Paxinos and Franklin (“The Mouse Brain in Stereotaxic Coordinates”, 2nd edition, 2001). Collection of sections started at a level ∼0.5 mm lateral from midline and extended through the hemisphere in order to ensure systematic random sampling across the target regions. Sections were mounted on polysine slides (Thermo Scientific, Waltham, MA, USA) and stored at –20°C. Five sections per animal covering different medio-lateral levels per were used for immunofluorescent labeling.
Labeling
Cryosections were air-dried for 45 min, washed in PBS for 10 min, treated with freshly prepared 1 mg/ml sodium borohydride/PBS solution for 4 min, washed in PBS again and subsequently blocked with M.O.M. blocking reagent (Vector Laboratories, Burlingame, CA, USA) in 0.1 %TritonX-100/PBS for 60 min in a humid chamber. After that, sections were washed 3×5 min in PBS and incubated with primary antibodies (see labeling below) in M.O.M. diluent (Vector Laboratories) over night at 4°C in a humid chamber. Binding of the primary antibodies was visualized using highly cross-absorbed labeled secondary antibodies (see labeling below) for 60 min in a damp and light-protected chamber at RT. After further washing in PBS, slides were incubated with 4, 6-Diamidin-2-phenylindol (DAPI, PanReac AppliChem GmbH, Darmstadt, Germany) for 15 min to stain cell nuclei and afterwards covered with Mowiol and cover slips using a Leica CV5030 coverslipper.
GAD67/Glutaminase/NeuN labeling
Primary antibodies. GAD67 (1:800, 198006, syna-ptic systems, Goettingen, Germany), Glutaminase (1:1000, ab93434, abcam, Cambridge, MA, USA), NeuN (1:2000, 266004, synaptic systems).
Secondary antibodies. Alexa Fluor555 (1:500, ab150066, abcam), Alexa Fluor647 (1:500, 703-605-155, Jackson ImmunoResearch, West Grove, PA, USA), Alexa Fluor488 (1:500, 706-545-148, Jackson ImmunoResearch).
GFAP/Iba-1/Aβ42 labeling
Primary antibodies. GFAP (1:2000, MAB360, Millipore, Burlington, MA, USA), Iba-1 (1:2000, 234004, synaptic systems), Aβ1-42 (1:1000, 700254, Invitrogen, Carlsbad, CA, USA).
Secondary antibodies. DyLight488 (1:500, ab98794, abcam), Alexa Fluor647 (1:500, 706-605-148, Jackson ImmunoResearch), Alexa Fluor555 (1:500, ab150066, abcam).
Whole slide scans of labelled sections were recorded on a Zeiss automatic microscope AxioScan Z1 with high aperture lenses, equipped with a Zeiss Axiocam 506 mono and a Hitachi 3CCD HV-F202SCL camera and Zeiss ZEN 2.3 software. Image analysis was performed with Image Pro 6 (Media Cybernetics, Silver Spring, MD, USA). Image analysis was performed as described previously [25]. Target areas (cortex, caudate putamen and hippocampus) were identified by drawing areas of interest (AOI). The image analysis was macro-based and ran automatically so that the results are operator-independent and fully reproducible. Raw data were edited in Excel and transferred to GraphPad Prism for statistical analysis and preparation of graphs.
Statistical analysis
All statistical analyses and graphs were performed using GraphPad Prism 8 software (GraphPad Software, San Diego, CA, USA). Descriptive statistical analyses were performed on all evaluated parameters including the evaluation of normal distribution using the Kolmogorov-Smirnov test. Graphs show group means and standard error of the mean (SEM). An α-error level of p < 0.05 was considered significant. A detailed description of performed statistical analysis and exact sample size are given in the corresponding figure legend. Group differences were evaluated by unpaired t-test or two-way ANOVA and Bonferroni’s post hoc test corrected for multiple comparisons. Actual animal numbers are given in the figure legends.
RESULTS
Control study, general health, and learning and memory deficits in Tg4-42 +/+ mice
In order to check the genetic influence of the homozygous breeding on the phenotype of mice, a control study was performed comparing male NTG control mice with C57BL6 background and male homozygous, hemizygous and NTG littermates of a hemizygous Tg4-42 breeding at the age of 6 months. This analysis resulted in no significant differences between the two NTG control groups and the Tg4-42 of the different breedings in all performed behavior tests (Open field test, Elevated plus maze test, Irwin test, Morris water maze test) suggesting that animals’ genetic background does not influence their behavior (data not shown).
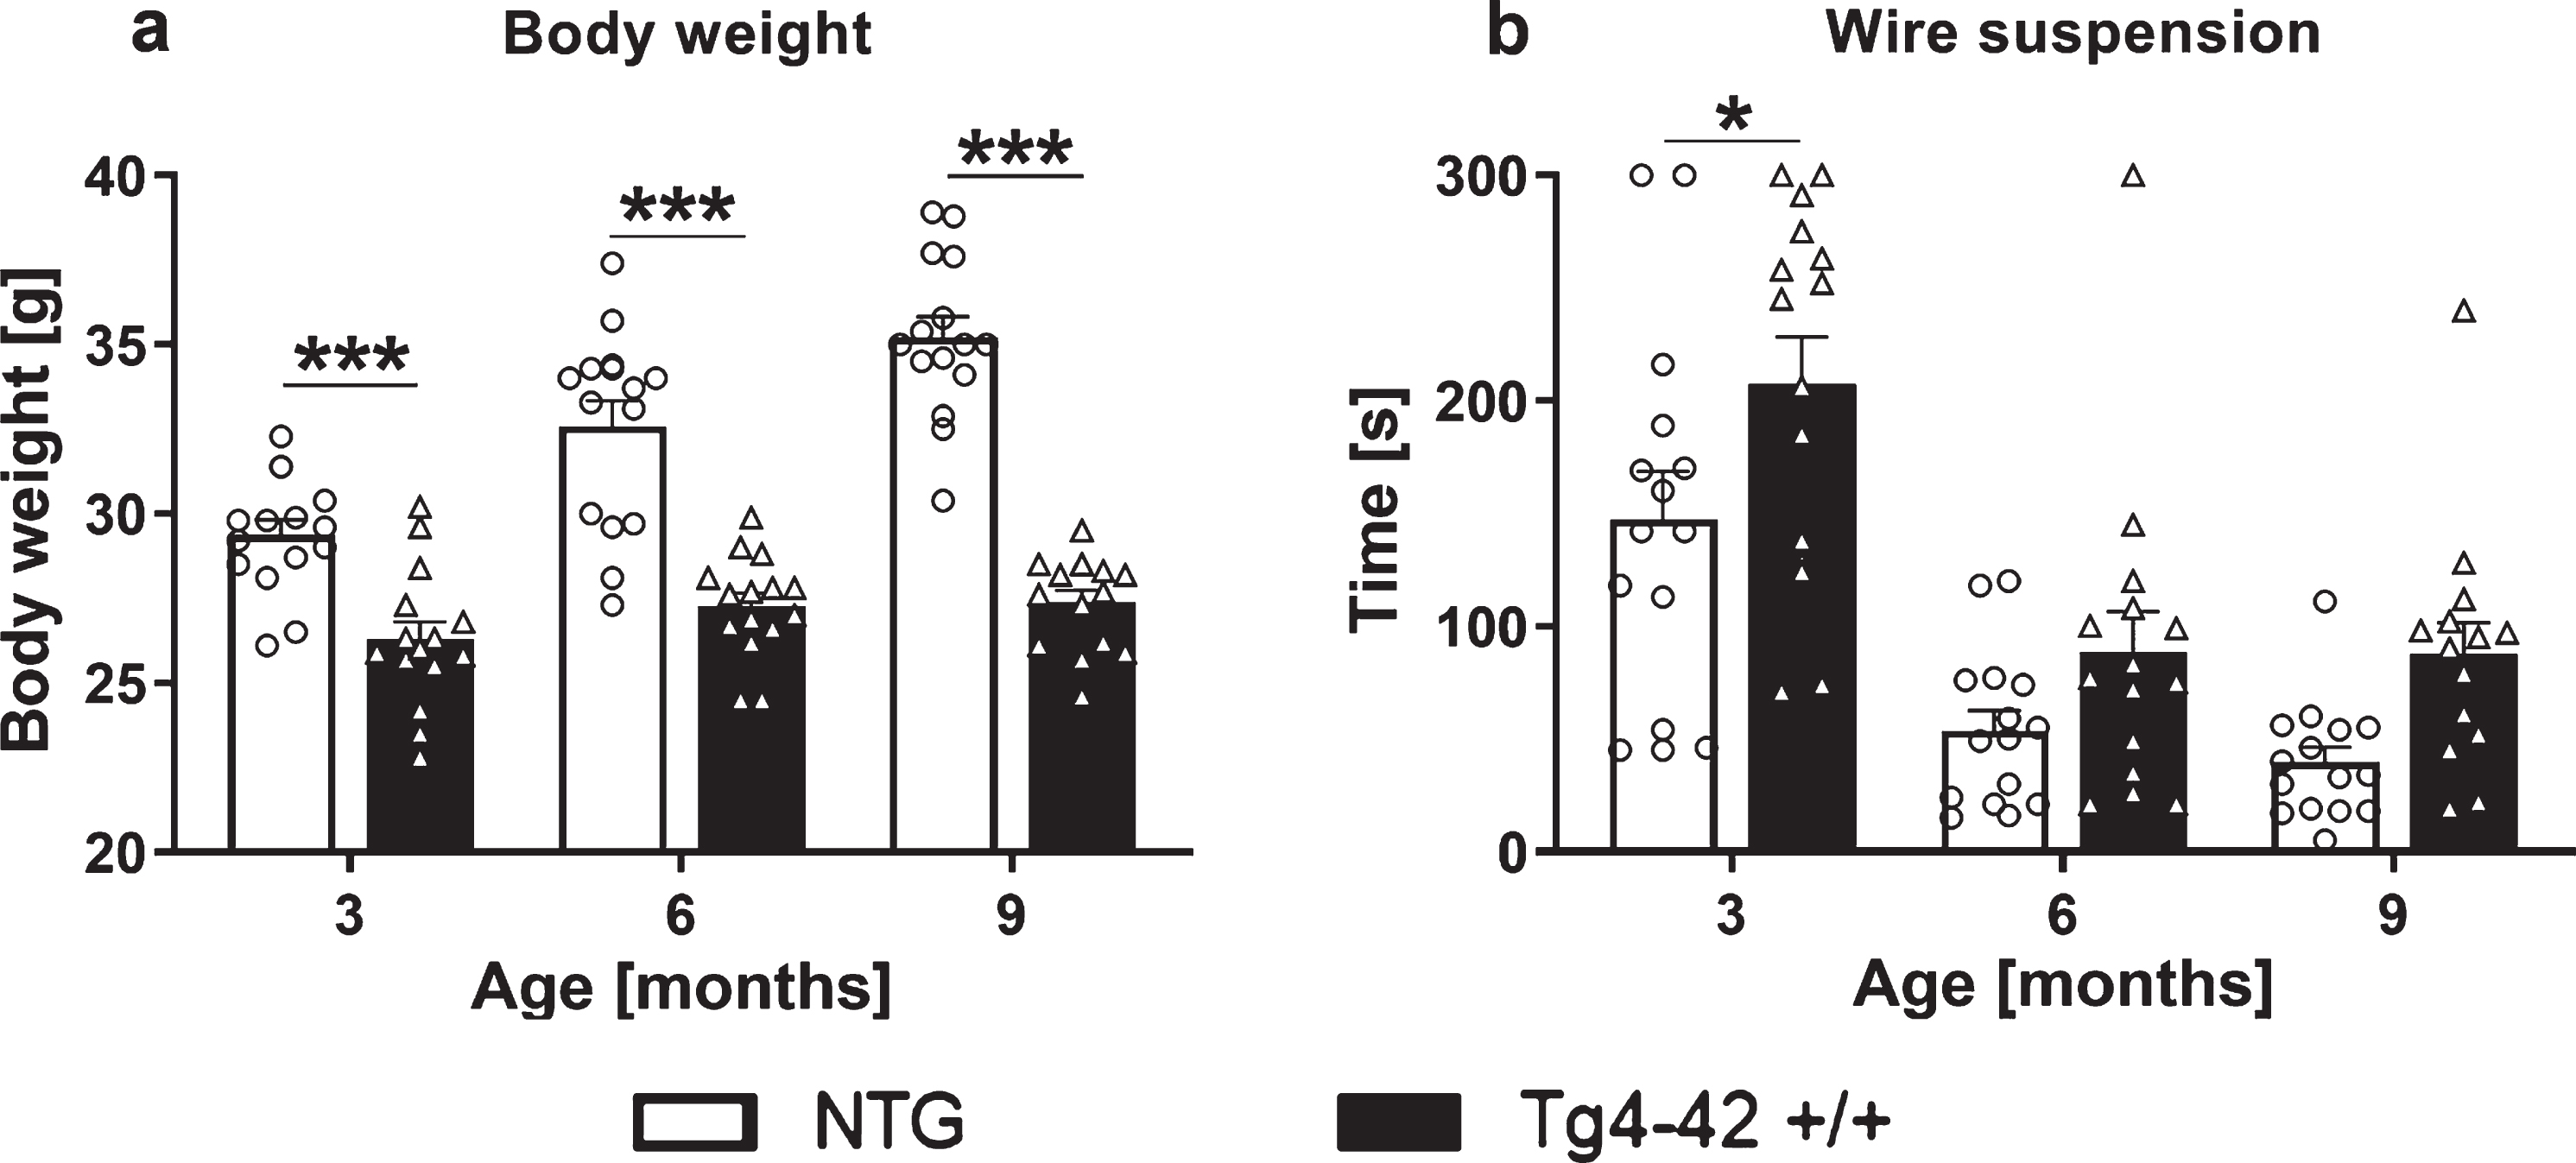
To evaluate the general health condition of the Tg4-42 +/+ mouse model, the body weight was determined at 3, 6, and 9 months of age. The decrease in the body weight in Tg4-42 +/+ mice was highly significant already at 3 months of age. Furthermore, Tg4-42 +/+ mice did not increase their body weight over age as observed for age-matched NTG animals (Fig. 1a). Furthermore, motor behavior was evaluated at 3, 6, and 9 months of age by performing the Wire suspension test. Tg4-42 +/+ mice were able to stay on the grid significantly longer at 3 month of age and did not show any motor deficits at 6 as well as 9 months (Fig. 1b).
Fig. 1
Body weight and wire suspension time in 3-, 6-, and 9-month-old Tg4-42 +/+ mice. Body weight in gram (a) and time in seconds animals were able to hold the grid (b). a, b) Two-way ANOVA followed by Bonferroni’s post hoc test. n = 15 per group. Mean + SEM. *p < 0.05, ***p < 0.001.
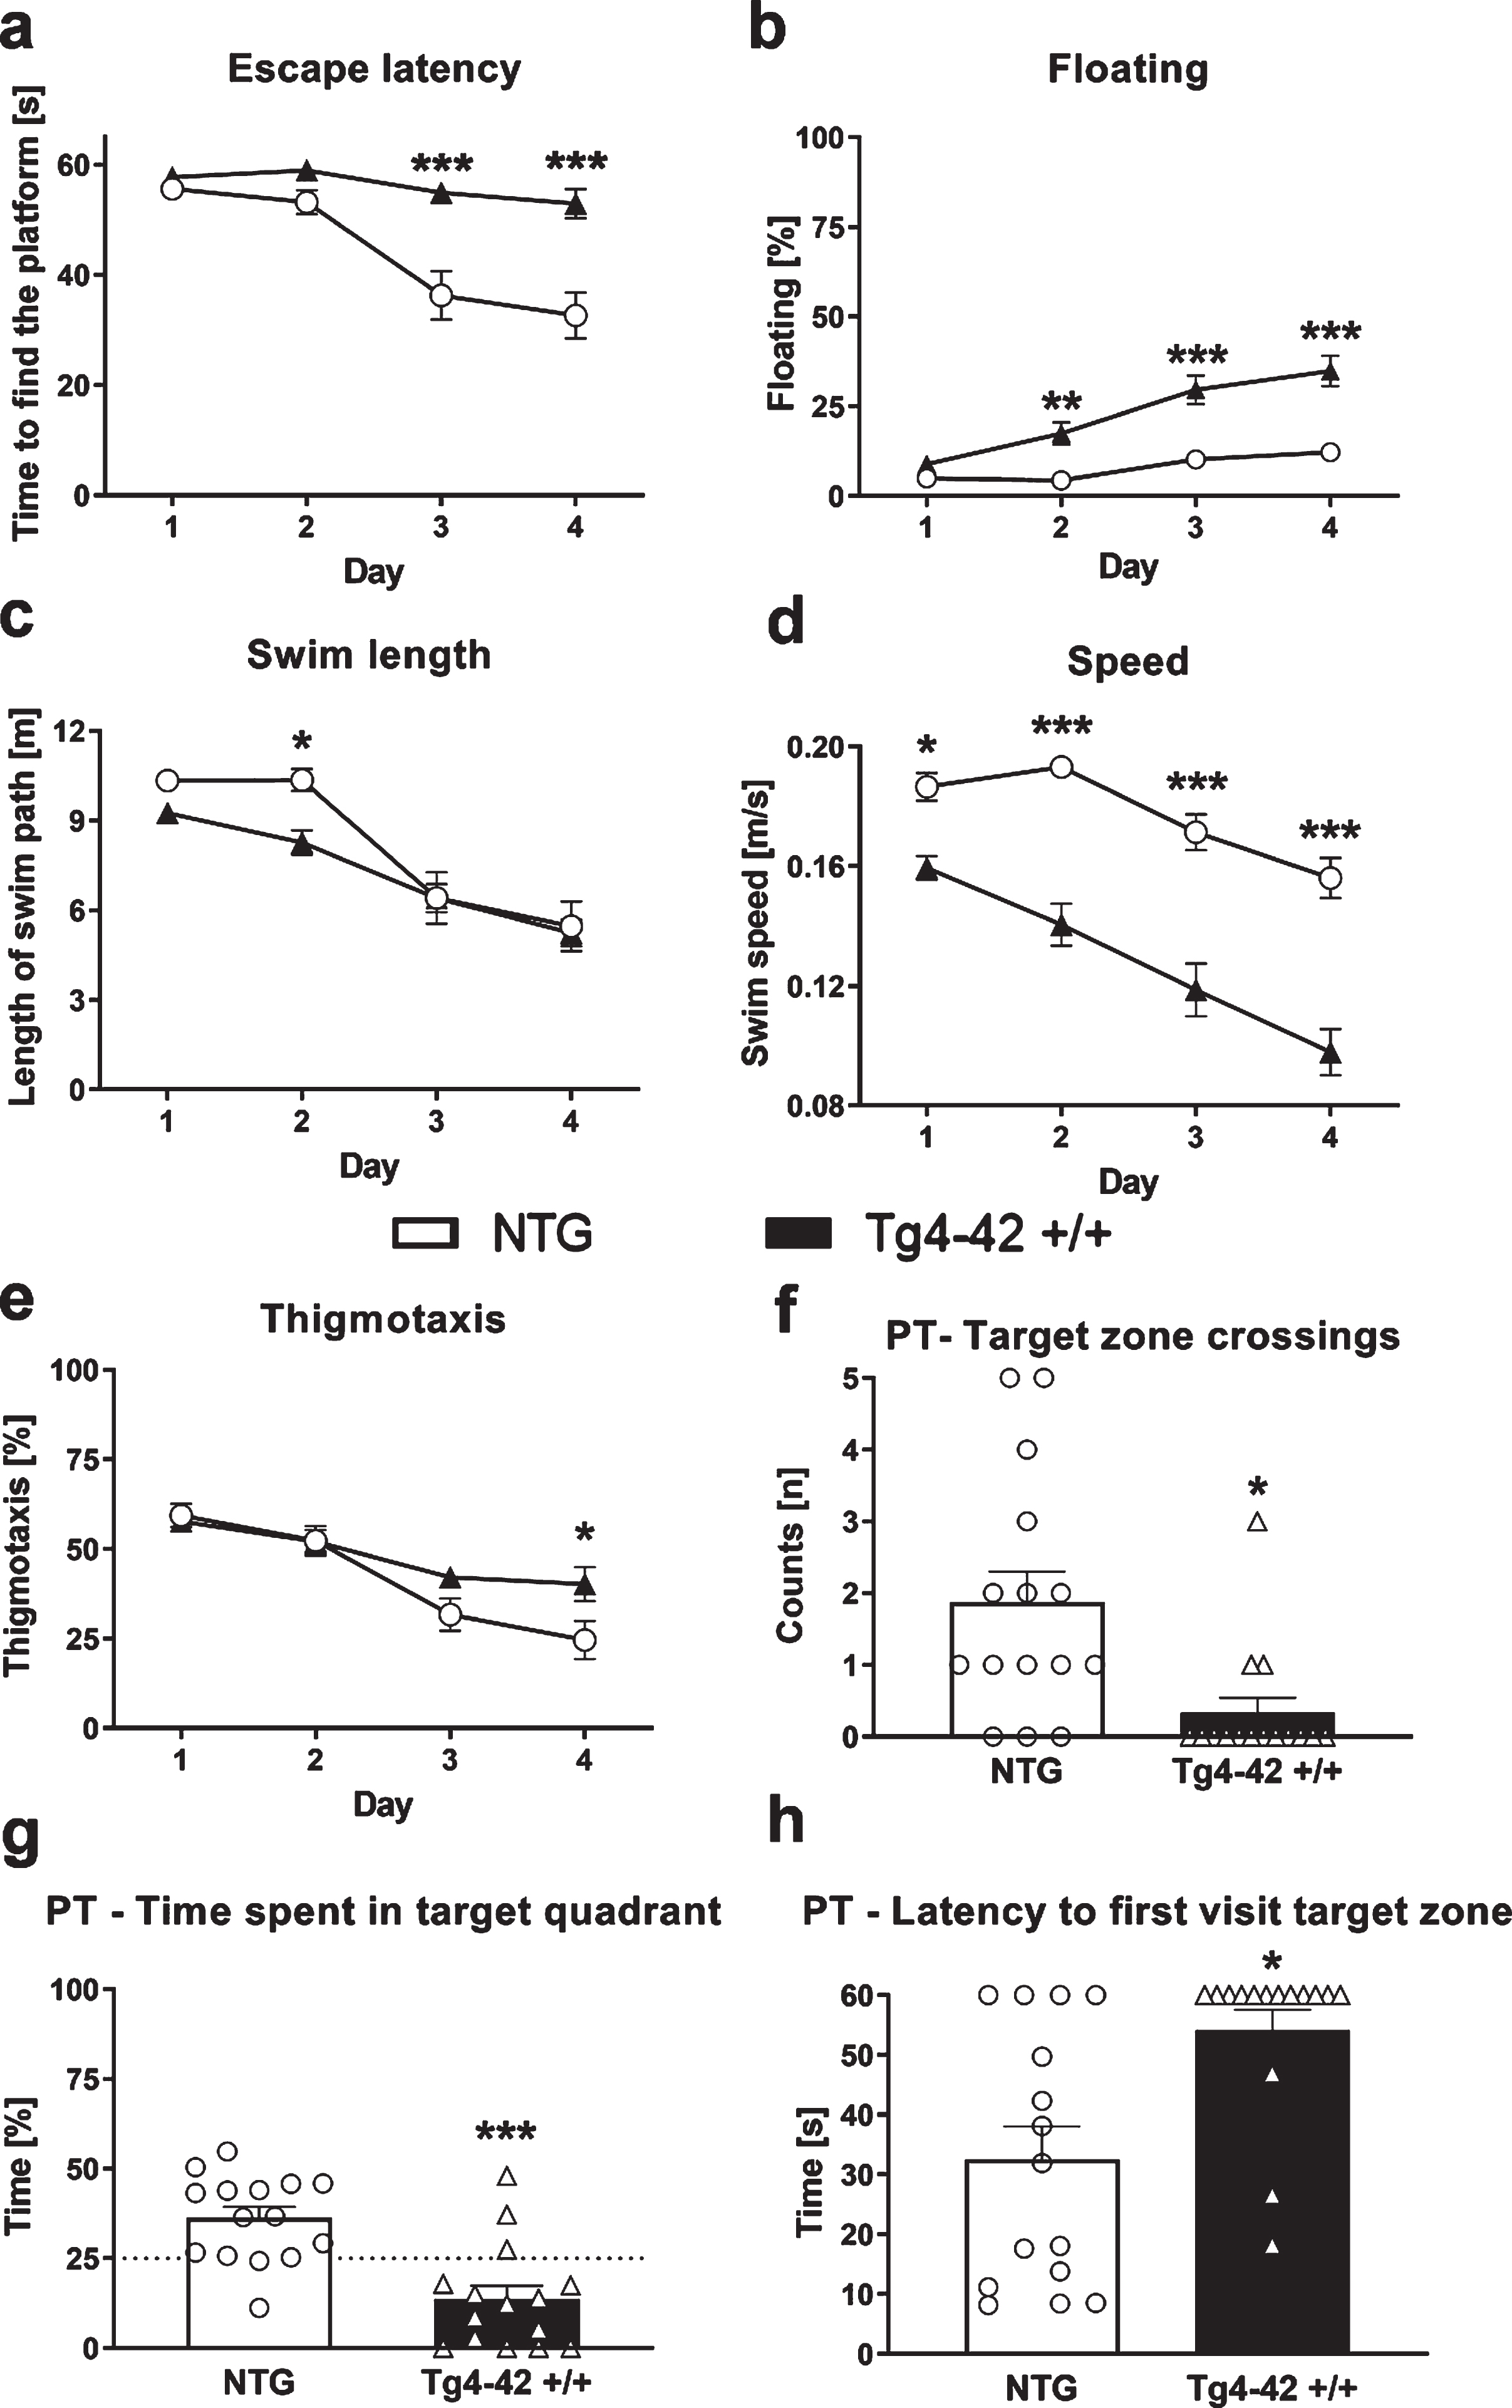
To further investigate the phenotype and to assess learning and memory deficits of these mice the MWM test was performed. 9-month-old Tg4-42 +/+ mice needed significantly longer to find the diaphanous platform and did not show learning behavior over the 4 consecutive days of training (Fig. 2a). Moreover, floating behavior increased in Tg4-42 +/+ mice compared to NTG animals (Fig. 2b). The lengths of the swim paths were not significantly different between groups except day 2, but the speed was significantly lower in Tg4-42 +/+ compared to NTG animals (Fig. 2c, d). In addition, Tg4-42 +/+ mice showed significantly higher thigmotaxis on day 4 compared to NTG mice (Fig. 2e). On the last testing day, Tg4-42 +/+ animals crossed the target zone significantly less often and spent less time in the target quadrant (Fig. 2f, g). To further characterize spatial learning, the time animals needed to first visit the target zone area was evaluated. The time in seconds Tg4-42 +/+ mice needed to first visit the target zone was significantly higher compared to NTG mice (Fig. 2h). All these readouts were almost the same between all three tested age groups and demonstrate impaired spatial learning and memory deficits in Tg4-42 +/+ mice. To advance the understanding of the underlying disease mechanism in this animal model of AD untargeted metabolic phenotyping was carried out in the next step.
Fig. 2
Learning deficits in 9-month-old Tg4-42 +/+ mice. Time the animals needed to find the platform (a), floating behavior (b), length of swim path in meter (c), swim speed (d), and thigmotaxis (e) in the Morris water maze test. Number of target zone crossings (f), time in percent animals spent in the target quadrant (NE quadrant) (g) and time in seconds animals needed to first visit the target zone (h) in the probe trial (PT) of the Morris water maze test. a-e) Two-way ANOVA followed by Bonferroni’s post hoc test. f-h) Unpaired t-test. a-h) n = 15 per group. Mean±SEM. *p < 0.05, **p < 0.01, ***p < 0.001.
Identification and quantification of altered metabolites inTg4-42 +/+ brain samples
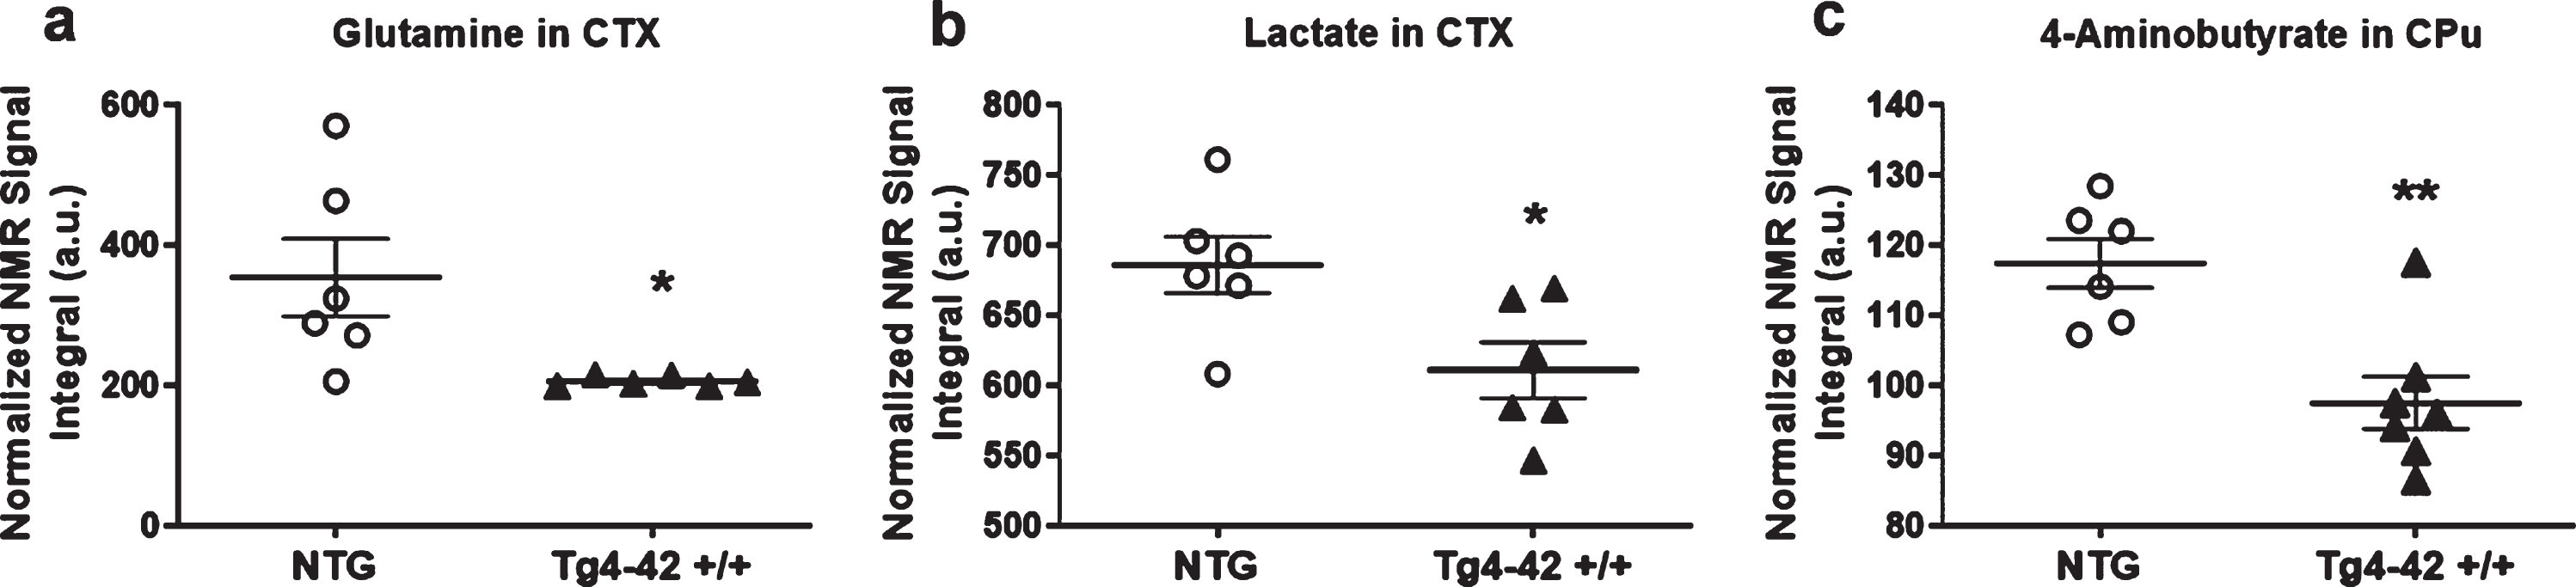
In order to assess metabolic differences between 9-month-old Tg4-42 +/+ and NTG mice, nuclear magnetic resonance (NMR) metabolic profiling was performed in cortex and caudate putamen brain samples. Comparing metabolic fingerprints between both groups revealed clustering in the PCA (Fig. 3a, d) and a strong clustering in O-PLS-DA of both brain regions with correlation coefficients R2 of up to 0.6 and a Q2 of 0.3 (Fig. 3b, c, e, f). Reduced NMR spectra showed altered metabolite levels in normalized cortex and caudate putamen brain samples (Fig. 3c, f) and indicated that the levels of lactate, glutamine as well as 4-aminobutyrate were lower in the cortex and caudate putamen of Tg4-42 +/+ mice. Subsequently the amount of lactate, glutamine, and 4-aminobutyrate was analyzed by integrating the signals in the normalized spectra. In line with the multivariate statistical analysis, all three metabolites were significantly decreased in Tg4-42 +/+ animals compared to NTG mice (Fig. 4a-c). Because of the reported changes in glutamate, GABA, and glutamine levels in AD patients [26–28], it was decided to focus on the glutamate pathway in this study. For that reason, a histological verification of these results was performed by analyzing the involved enzymes of the glutamate/GABA-glutamine cycle.
Fig. 3
NMR metabolic profiling. a) PCA and b) O-PLS-DA plot of cortex samples. c) Reduced NMR spectra reveal altered metabolites in normalized cortex samples.1: lactate, 2: 4-aminobutyrate, 3: glutamine. d) PCA and e) O-PLS-DA plot of caudate putamen (CPu) samples. f) Reduced NMR spectra reveal altered metabolites in normalized caudate putamen samples.1: 4-aminobutyrate. c, f) Positive covariance corresponds to increased metabolite levels, whereas negative covariance corresponds to decreased metabolite levels in 9-month-old homozygote animals (Tg4-42 +/+) compared to non-transgenic controls (NTG). Predictivity is represented by R2 and Q2.
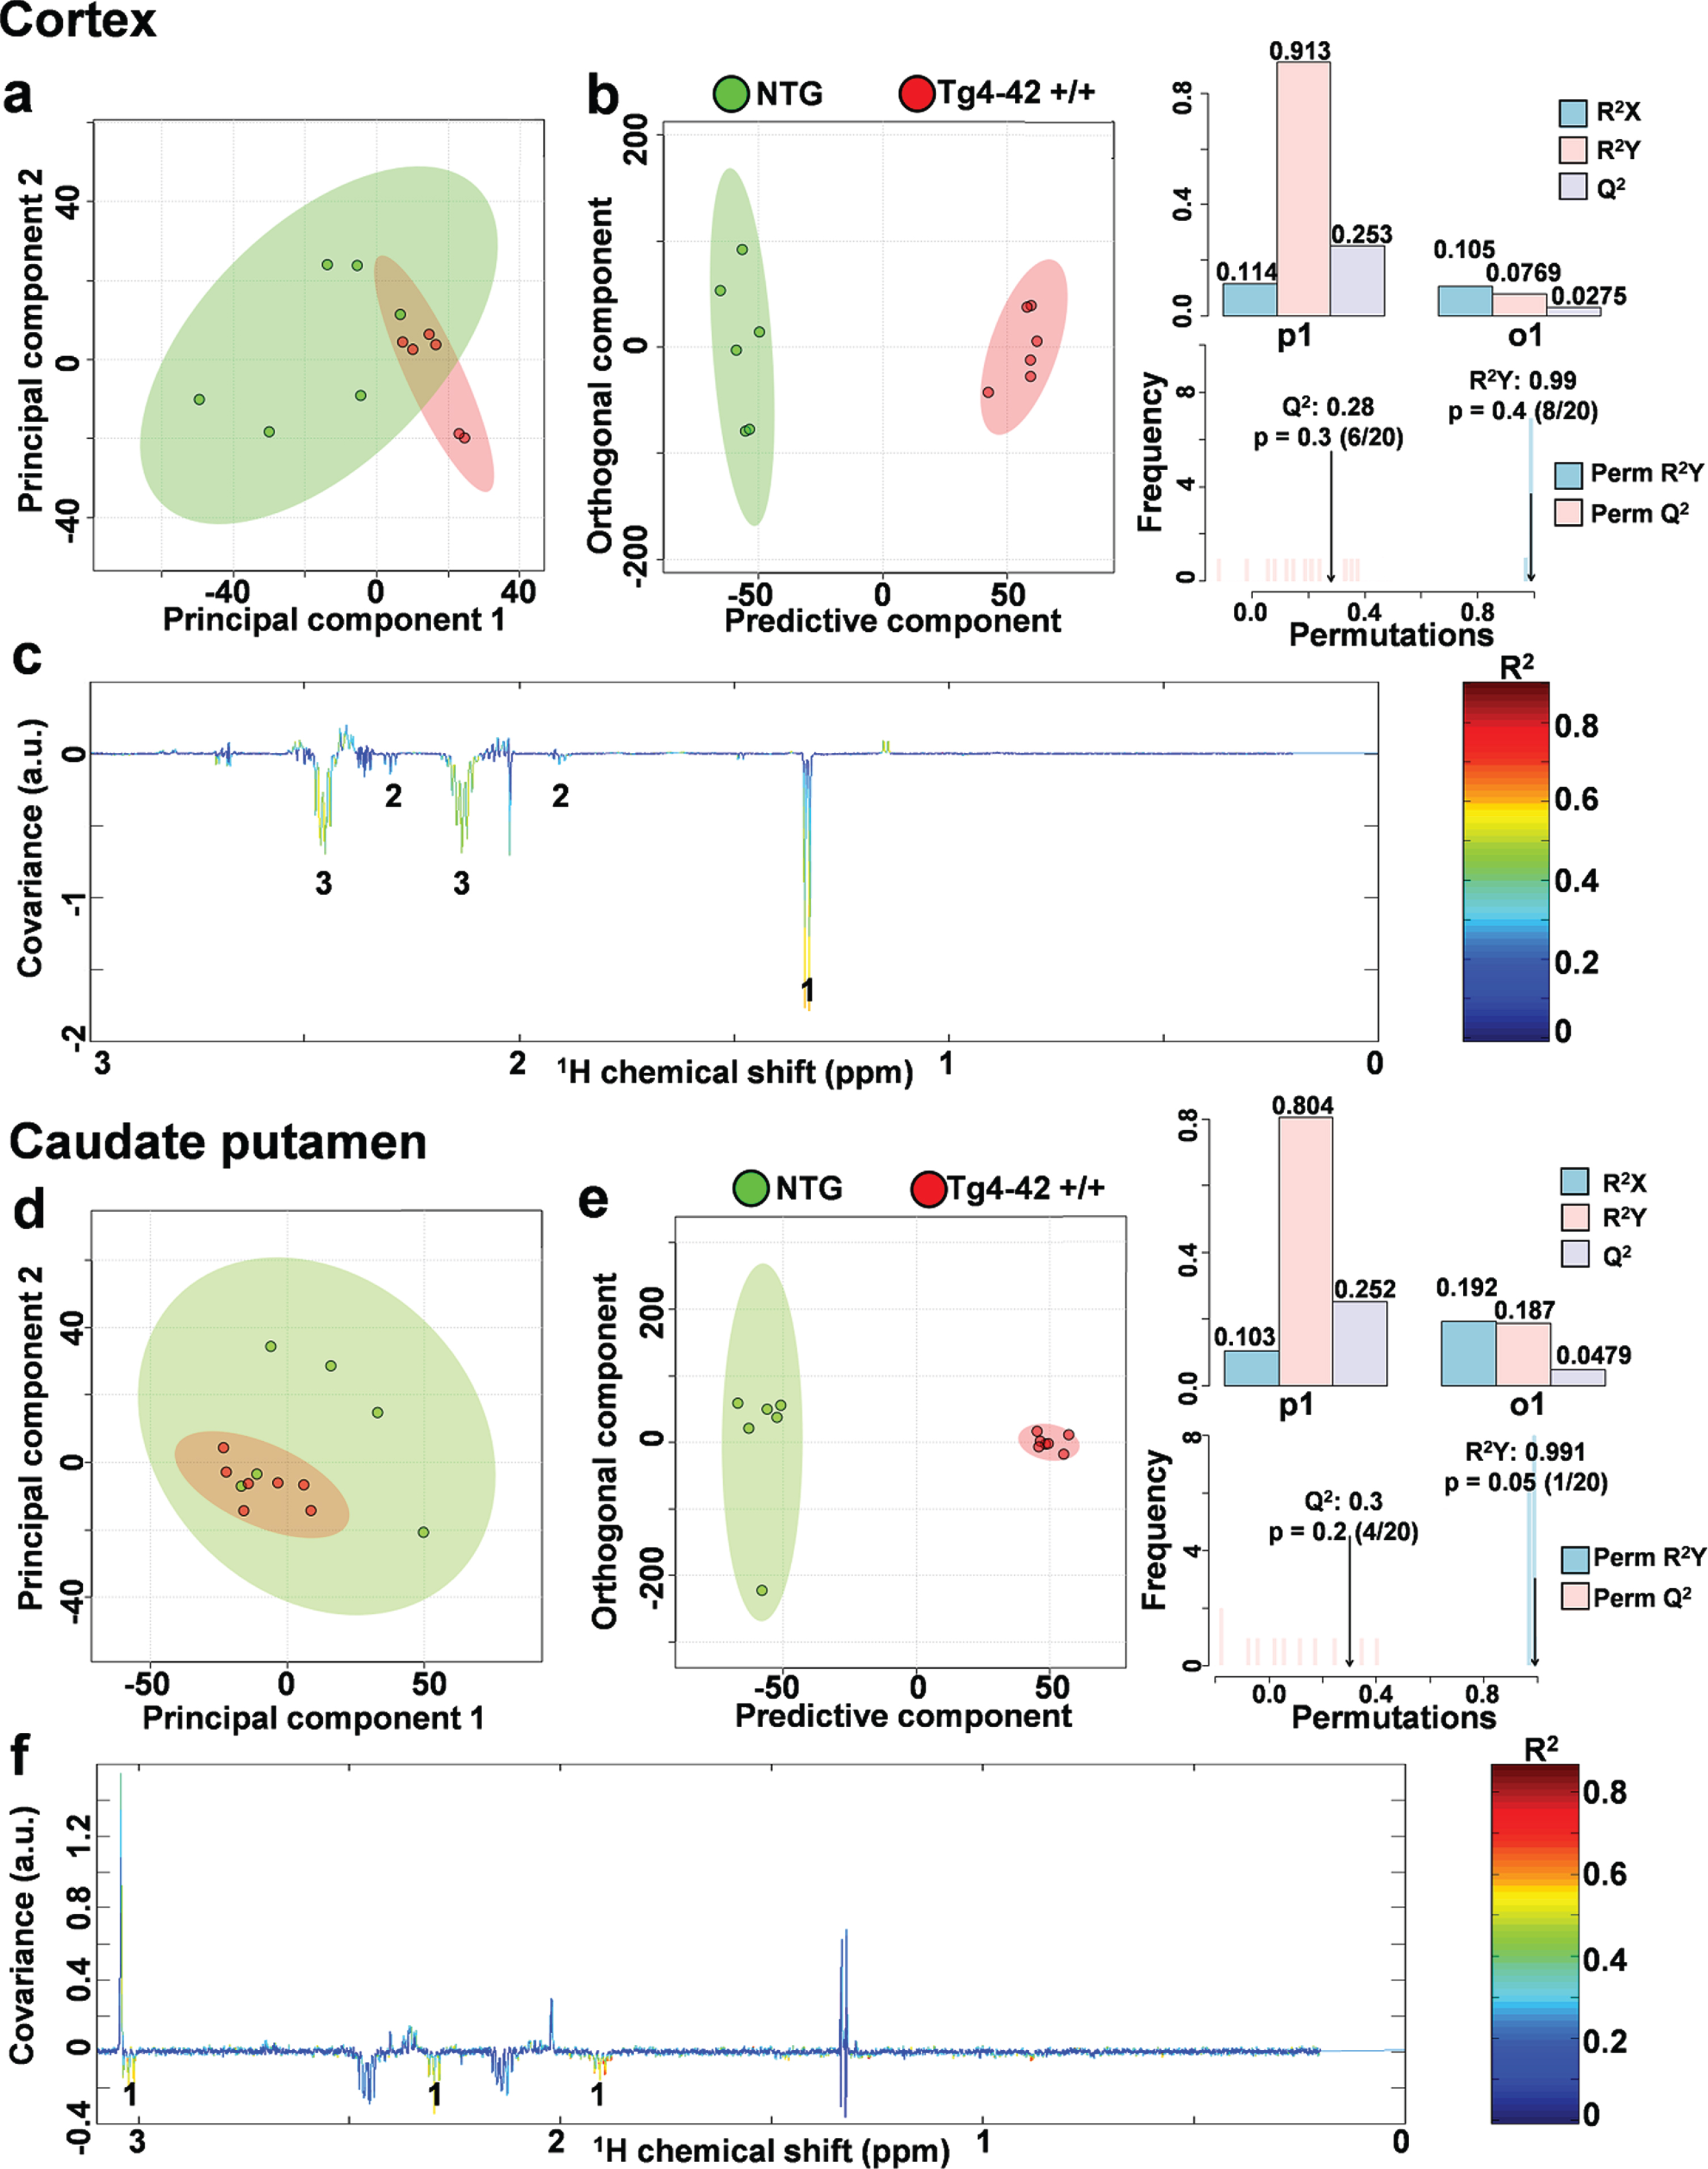
Fig. 4
Quantification of altered metabolites. a) Quantification of glutamine in cortex (CTX) samples (n = 6). b) Quantification of 4-Aminobutyrate in caudate putamen (CPu) samples (n = 7). One NTG sample was removed from the calculations because of contamination. a, b) Mean±SEM. *p < 0.05, **p < 0.01 as determined by Unpaired t-test.
Expression of glutamate-decarboxylase and glutaminase in Tg4-42 +/+ mice
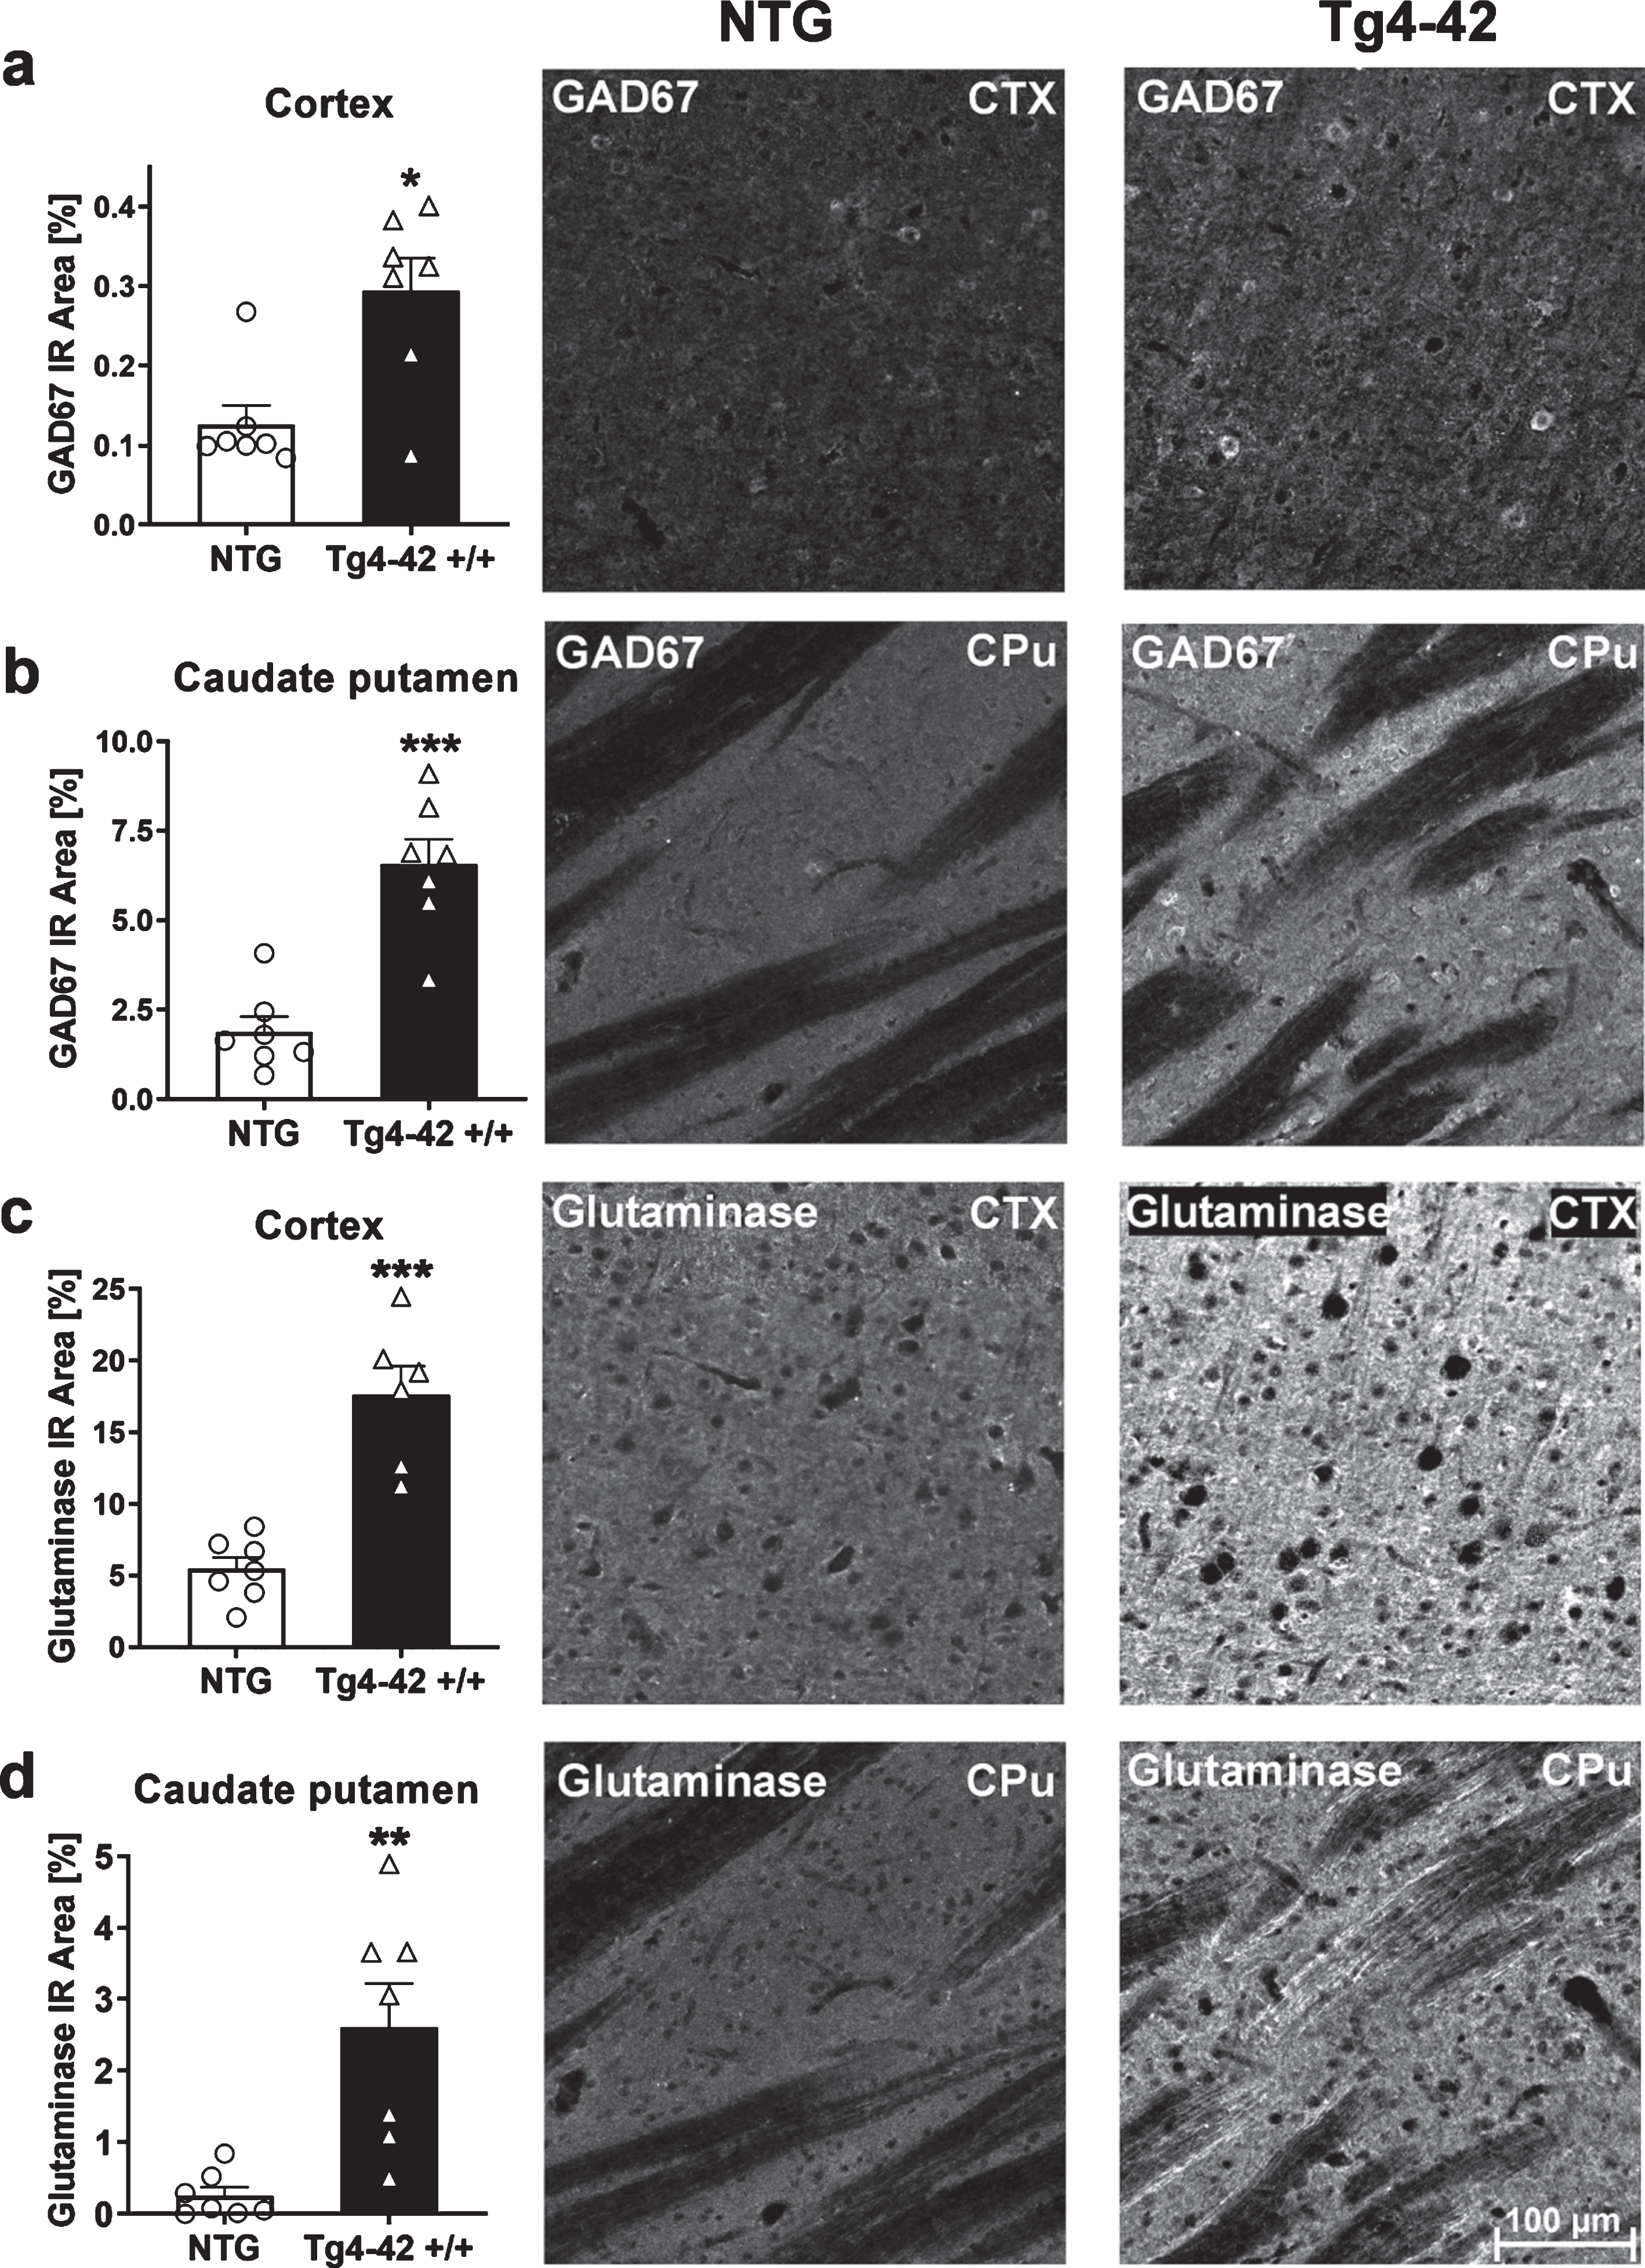
To further examine the effects of altered metabolites on changes in metabolic pathways, histological analysis of glutamate-decarboxylase 67 (GAD67) and glutaminase were carried out. To do this, the immunoreactive area of GAD67 and glutaminase was quantified. At 9 months of age, Tg4-42 +/+ mice showed significantly increased GAD67 and glutaminase levels in the cortex and caudate putamen (Fig. 5a-d). These results are also demonstrated in representative images of NTG and Tg4-42 +/+ brain sections shown in Fig. 5. Based on these results further downstream effects like Aβ42 levels were analyzed.
Fig. 5
Expression of glutamate-decarboxylase (GAD67) and glutaminase in 9-month-old Tg4-42 +/+ mice. Quantitative GAD67 expression in cortex (CTX) (a) and caudate putamen (CPu) (b) and glutaminase expression in cortex (c) and caudate putamen (d) shown as immunoreactive (IR) area in percent. Representative images of NTG and Tg4-42 +/+ brain sections. Scale bar 100μm for all images. (a-d) n = 7 per group. Mean + SEM. Unpaired t-test. *p < 0.05, **p < 0.01, ***p < 0.001.
Aβ42 levels in the central nervous system of Tg4-42 +/+ mice
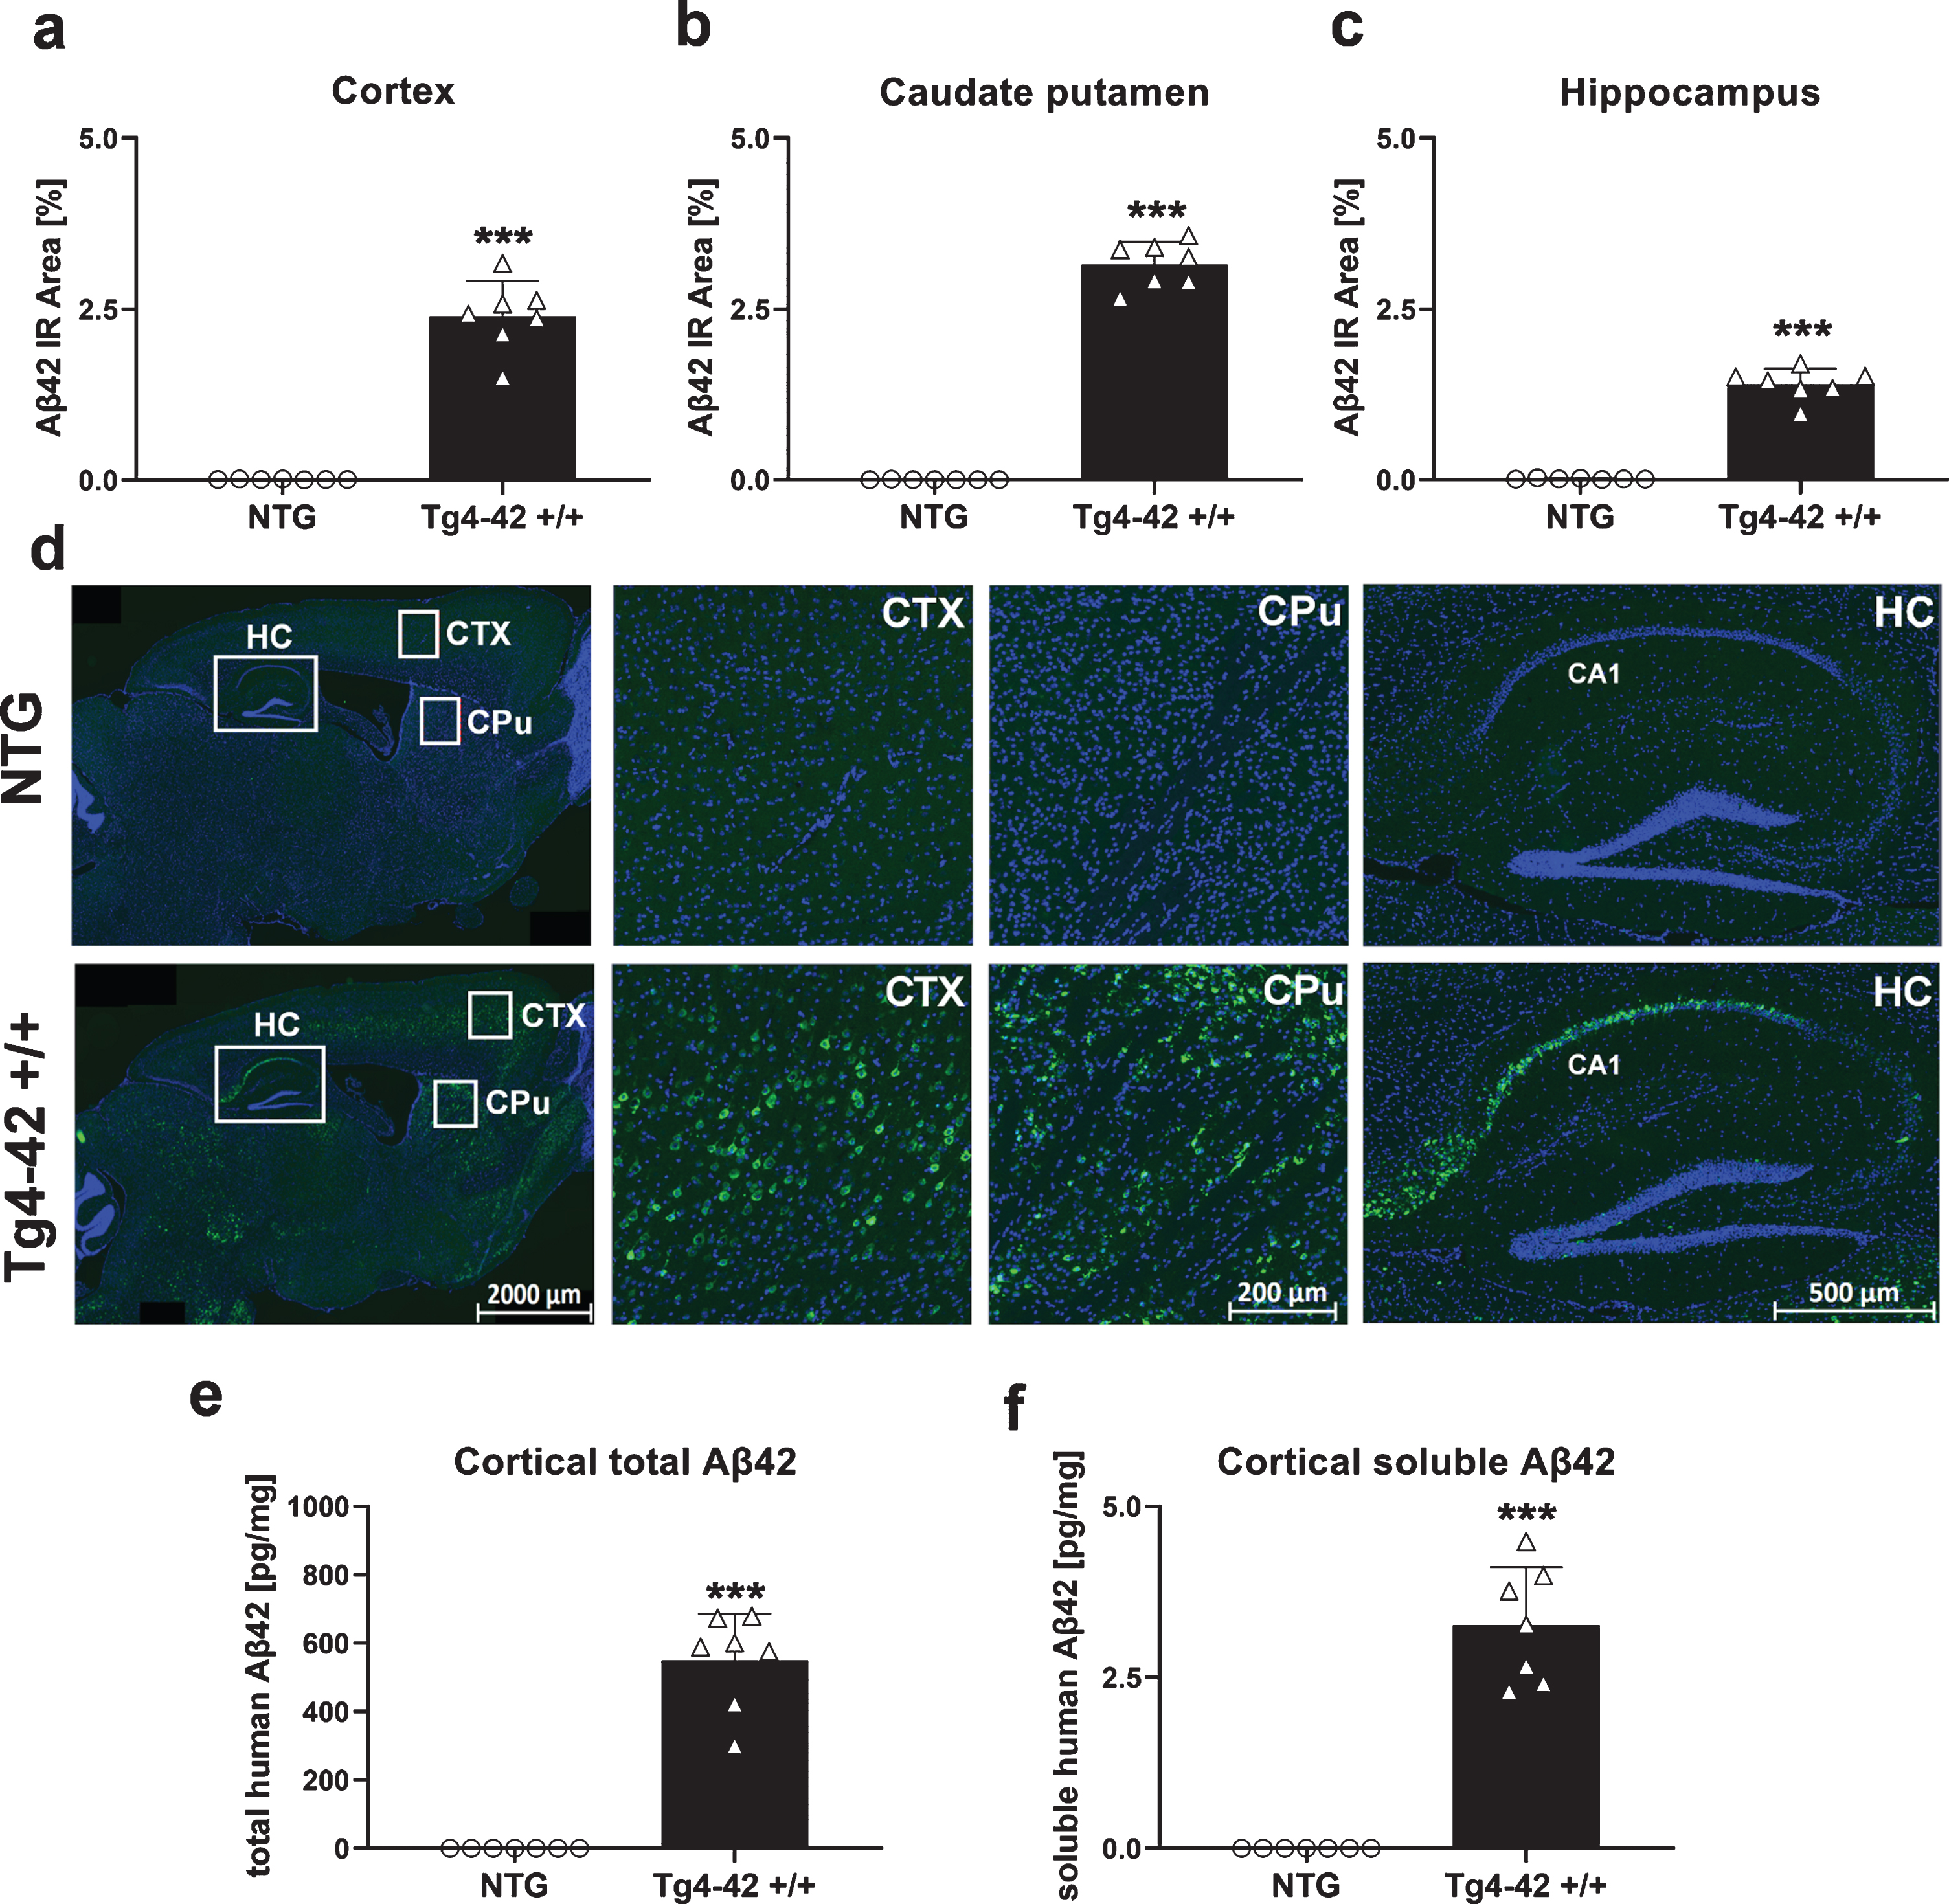
Aβ42 levels were analyzed by quantification of the immunoreactive area in different brain regions of Tg4-42 +/+ mice. Significantly increased Aβ42 levels in Tg4-42 +/+ mice compared to NTG animals could be found in the cortex (Fig. 6a), caudate putamen (Fig. 6b), and hippocampus (Fig. 6c) at the age of 9 months. These increased Aβ42 levels in Tg4-42 +/+ mice are also shown in the representative images in Fig. 6d where highest Aβ42 levels were found in the CA1 region of the hippocampus. In order to evaluate total and soluble human Aβ42 concentrations, corresponding cortex samples were further analyzed using the Meso Scale Discovery assay. As expected, these results were in line with the histological evaluation, showing a significant increase of total and also soluble human Aβ42 levels in Tg4-42 +/+ cortex samples (Fig. 6e, f). To further investigate the effects of increased Aβ42 levels, a measurement of neuroinflammation markers was carried out in the next step.
Fig. 6
Quantification of Aβ42 expression in the central nervous system of Tg4-42 +/+ mice. Histological quantification of Aβ42 expression in cortex (a), caudate putamen (b), and hippocampus (c) in 9-month-old Tg4-42 +/+ mice. d) Representative images of Aβ42 (green) and DAPI (blue) labeling in 9-month-old Tg4-42 +/+ and non-transgenic mice. e) Biochemical quantification of cortical total human Aβ42 levels in pg/mg and (f) soluble human Aβ42 levels in pg/mg. (a-f) n = 7 per group. Mean + SEM. Unpaired t-test. ***p < 0.001.
Neuroinflammation in Tg4-42 +/+ mice
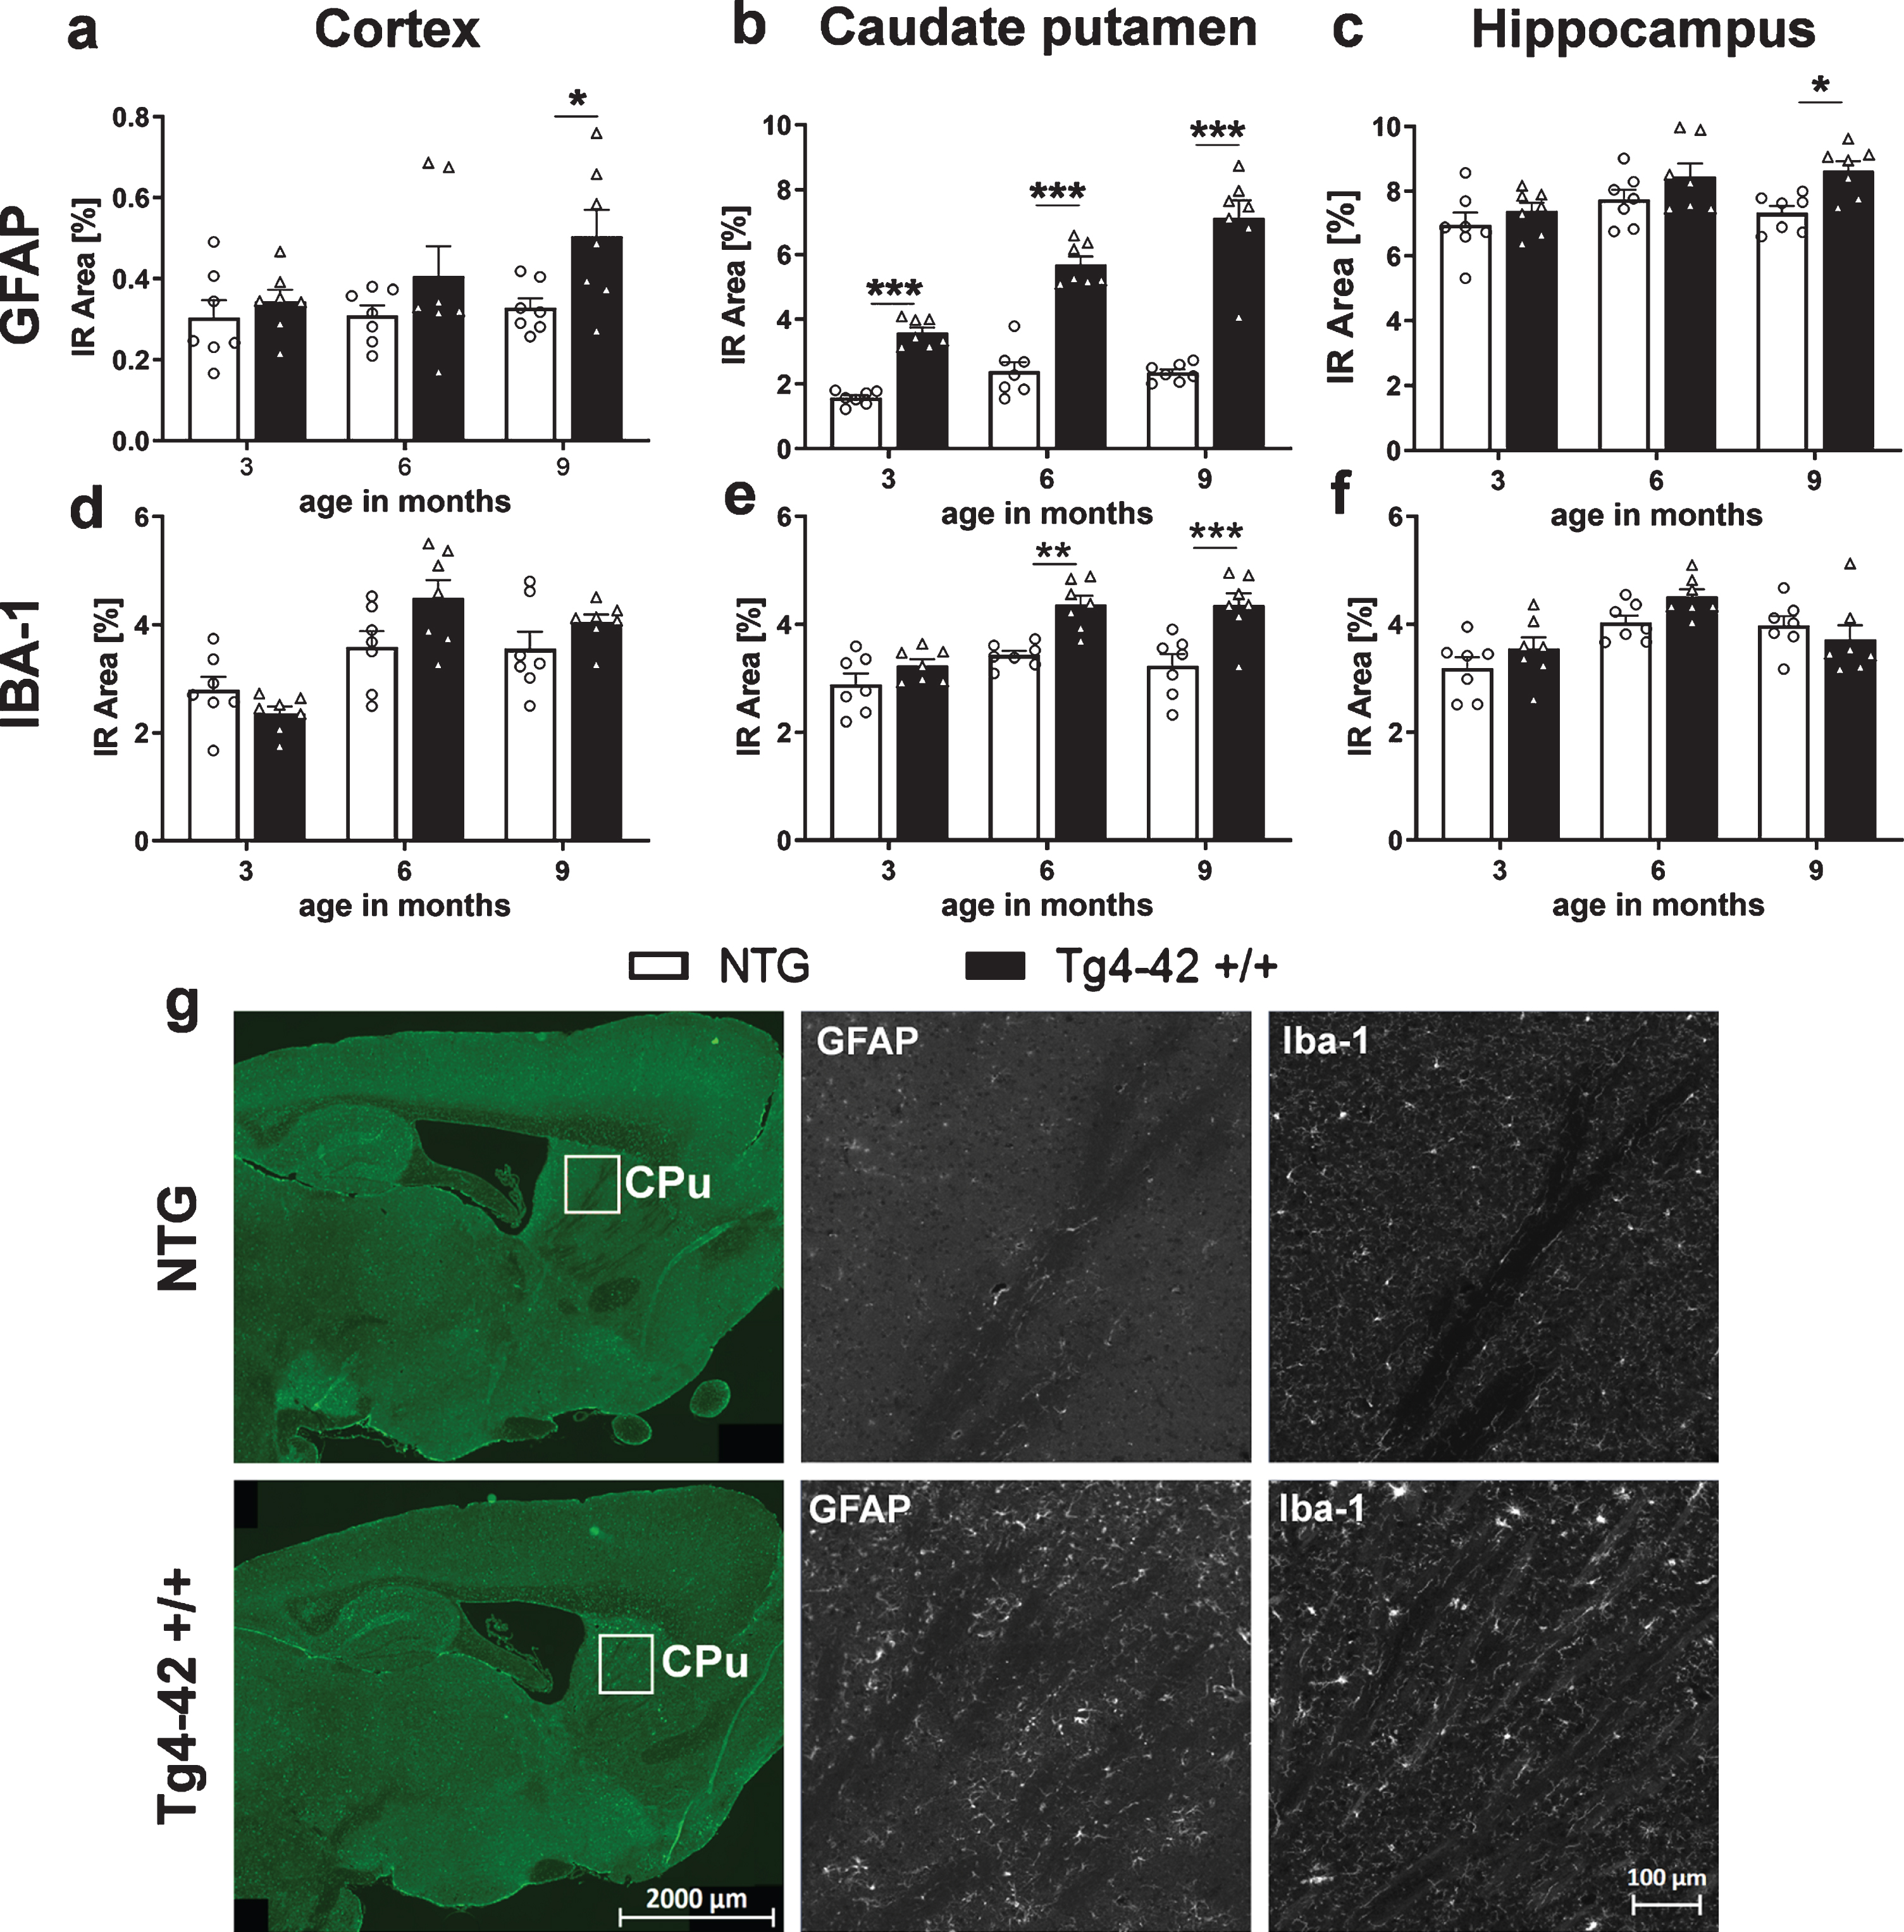
Quantification of the immunofluorescence signal was used to measure neuroinflammation, as it was described to play a significant role in neurodegenerative diseases like AD [1, 29]. For this reason, the immunoreactive area of glial fibrillary acidic protein (GFAP) as a marker for reactive astrocytes and ionized calcium binding adaptor molecule 1 (Iba1) as a marker for activated microglia, was quantified over age. Significantly increased levels of GFAP in Tg4-42 +/+ mice compared to NTG animals were found at 9 months of age in the cortex (Fig. 7a) and hippocampus (Fig. 7c). In the caudate putamen, an age-dependent increase of astrocytosis could be observed in Tg4-42 +/+ mice (Fig. 7b) starting already at 3 months of age. Analysis of Iba-1 immunoreactive area in the cortex and hippocampus revealed no significant difference between genotypes (Fig. 7d, f). In the caudate putamen, Iba-1 levels were significantly increased in Tg4-42 +/+ mice compared to NTG animals at 6 and 9 months of age (Fig. 7e). Representative images of GFAP and Iba-1 labeling in the caudate putamen region are shown in Fig. 7g and representative images of GFAP and Iba-1 labeling in the cortex and hippocampus are shown in Supplementary Figure 1a and b. As inflammatory processes and also Aβ42 levels contribute to neurodegeneration [30], further investigations to analyze this pathology were performed.
Fig. 7
Progressive neuroinflammation in Tg4-42 +/+ mice. Immunoreactive (IR) area in percent of GFAP expression levels labeling reactive astrocytes in the cortex (a), caudate putamen (b), hippocampus (c), and Iba-1 expression levels labeling activated microglia in the cortex (d), caudate putamen (e), and hippocampus (f). a-f) n = 7 per group. Mean + SEM. Two-way ANOVA followed by Bonferroni’s post hoc test. *p < 0.05, **p < 0.01, ***p < 0.001. g) Representative images of GFAP and Iba-1 labeling of caudate putamen samples in 9-month-old Tg4-42 +/+ and non-transgenic mice (NTG).
Neurodegeneration
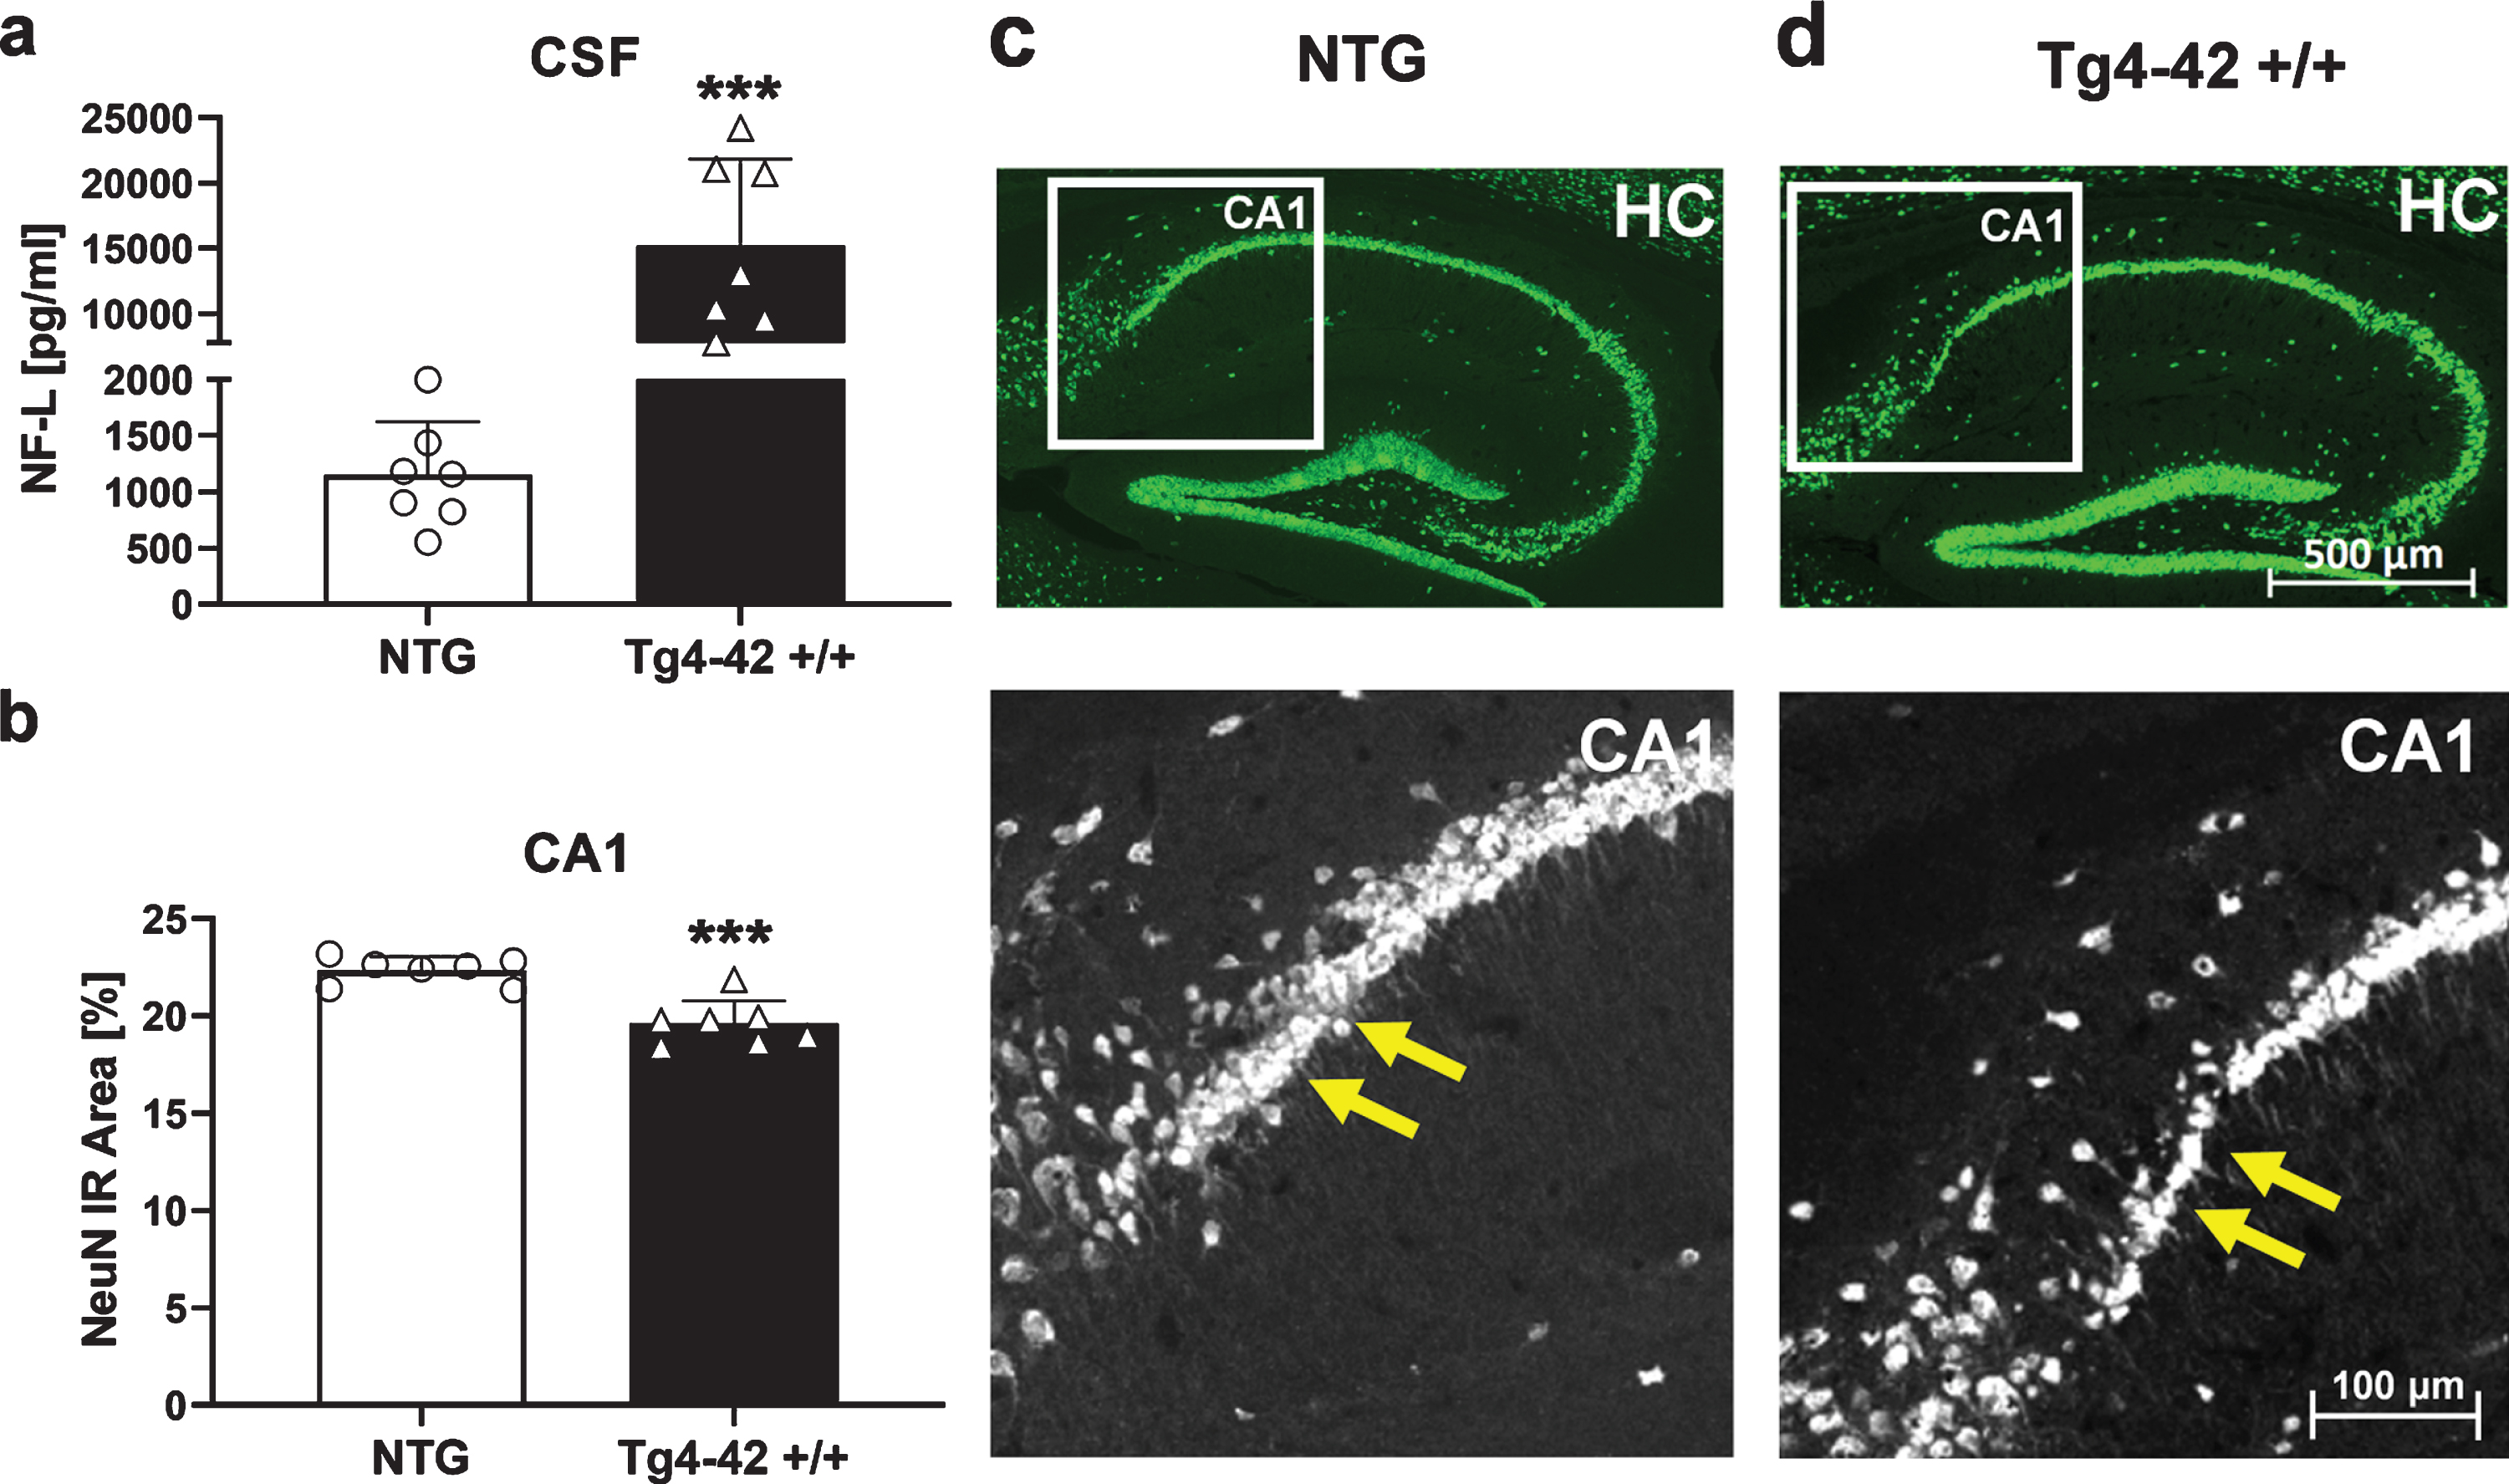
As a well-established biomarker for neurodegeneration [31], concentration of neurofilament light chain was determined in the CSF of Tg4-42 +/+ mice. Results revealed significantly increased NF-L levels in 9-month-old Tg4-42 +/+ mice compared to NTG animals (Fig. 8a). Furthermore, histological analysis and quantification of neuronal nuclei (NeuN) in the proximal CA1 region of the hippocampus revealed a significant decrease of neurons in this region (Fig. 8b). Representative images of NeuN labeling in hippocampus samples are shown in Fig. 8c and d.
Fig. 8
Quantification of neurons in the hippocampus of 9-month-old Tg4-42 +/+ mice. a) Murine neurofilament light chain levels (NF-L) in CSF samples as pg/ml. b) NeuN expression levels labeling neurons in the proximal CA1 region of the hippocampus as immunoreactive (IR) area in percent. a, b) n = 7 per group. Mean + SEM. Unpaired t-test. ***p < 0.001. c, d) Representative images of NeuN labeling in hippocampus samples of 9-month-old Tg4-42 +/+ and non-transgenic mice (NTG). Yellow arrows indicate region of neuronal loss.
DISCUSSION
In this study, we performed a behavioral, biochemical, and histological characterization of the phenotype of Tg4-42 +/+ mice. As it is one of the few mouse models which develops neuronal loss in the CA1 region of the hippocampus [9], it is a promising model for the pre-clinical evaluation of new drug candidates against AD. For that reason, the aim of this study was to perform a comprehensive characterization of the Tg4-42 +/+ mouse, to gain a better understanding of disease pathology, altered pathways, and disease progression.
Analysis of the general health status of Tg4-42 +/+ mice demonstrated a significant decrease in body weight, which did not increase over age compared to NTG controls. Similar but not significant results that 3- or 7-month-old homozygous Tg4-42 mice have a lower body weight than age-matched wild type mice were already shown in the literature [32]. For that reason, it is important to be aware that different body weights can influence behavioral results and therefore to pay attention to a similar weight distribution between all groups at study start.
The results of the MWM behavioral test strengthen previous basic results showing that 9-month-old Tg4-42 +/+ mice develop severe learning and memory deficits [6, 7, 9, 33]. In contrast to Bouter et al., where 8-month-old Tg4-42 +/+ mice showed progressively decreased times to find the platform over the four days of training, our 9-month-old Tg4-42 +/+ mice did not show any learning behavior [6]. Furthermore, the swim speed decreased over the four days of training and the floating behavior increased which indicates, that our 9-month-old Tg4-42 +/+ mice developed a loss of motivation to perform the task. Any motor deficits, which are described in the literature as a possible reason for the fact that the swim speed of groups are significantly different, could be ruled out after performing the wire suspension test with our 9-month-old Tg4-42 +/+ mice. Hartmann et al. associated spatial learning deficits in rats in the absence of other behavior impairments with neurodegeneration in the dorsal hippocampal CA1 region [34]. In line with these results, Volpe et al. showed that the volume of hippocampal damage did not predict the rats’ performance but that the extent of CA1 pyramidal neuron loss correlated significantly with delayed spatial performance [35]. Additionally, Olsen et al. demonstrated in male Wistar rats a significant impairment of spatial memory performance as the number of viable CA1 neurons declined [36]. These results indicate that the severe hippocampal dysfunctions in Tg4 42 +/+ mice are very likely related to the severe neuron loss in the CA1 region of the hippocampus in these mice. Furthermore, floating behavior increased significantly in Tg4-42 +/+ mice compared to NTG controls which indicates a progressive loss of motivation over the 4 days of consecutive training. These and similar symptoms like apathy are often described in AD patients and are the most common behavioral changes, associated with cortical pathology [37, 38].
Due to the retinoic acid receptor beta knockout, which we previously reported in Tg4-42 +/+ mice [10], a possible influence on the phenotype of these mice cannot be excluded. Nevertheless, two different therapeutic intervention studies using I: a monoclonal antibody and II: enriched housing conditions, exhibited a rescue of this phenotype and were able to show reduced hippocampal neuronal loss as well as a rescue of spatial reference memory deficits in Tg4-42 +/+ mice [9, 11]. These data rather indicate that the observed phenotype in these mice is caused by the Aβ4–42 transgene.
In order to discover new biomarkers and to gain deeper insight into the metabolic pathways underlying disease progression, NMR spectroscopy has been used to determine alternations in metabolite profiles between Tg4-42 mice and NTG controls. In the present study, for the first time two different brain regions of 9-month-old Tg4-42 +/+ mice were characterized with NMR spectroscopy. Two of the significantly decreased metabolites glutamine and 4-aminobutyrate are known to play a key role in the glutamate/4-aminobutyrate-glutamine cycle which is necessary for neurotransmission and a normal brain function. Glutamate is synthesized and converted to glutamine in astrocytes, transported to neurons where it is converted to glutamate and released into the extracellular space [39]. This action of glutamate is terminated by its removal from receptor sites by transportation mostly into perisynaptic astrocytes. Malfunctions in this pathway result in excitotoxicity which is a fundamental mechanism leading to neurodegeneration [40]. Interestingly, a study by Doert et al. using 1H- and 13C-NMR spectroscopy in the APPSL mouse model of AD showed decreased glutamine and glutamate concentrations while GABA levels were elevated in this mouse model [41]. Furthermore, reduced glucose metabolism was detected via 18F-FDG-PET in the cerebellum of aged Tg4-42 mice [32]. In line with our findings, several publications describe metabolic changes and alterations in glutamine and GABA as well as lactate levels in the brain of AD patients [42–45]. Seidl et al. determined a number of different amino acids like glutamate, aspartate, GABA, glycine, taurine, glutamine, serine, arginine in postmortem tissue of AD patients with the result of increased levels of GABA, glutamate, and aspartate concentrations in some of the investigated brain areas [26]. Additionally, further studies assessed metabolic changes and decreased glutamate and glutamine levels in AD patients, which may be a potential biomarker in the early clinical diagnosis of AD [27, 28].
To investigate this further, we analyzed glutamate and GABA metabolizing enzymes like glutamate-decarboxylase, glutaminase as well as glutamine synthetase by immunofluorescent labeling. Based on a co-labeling with GFAP, we found that glutamine synthetase is mainly expressed in astrocytes (Supplementary Figure 2), although this analysis was not quantified. While glutamine synthetase was unaltered in the cortex and hippocampus of Tg4-42 mice (Supplementary Figure 3), GAD67 as well as glutaminase were significantly increased in the brain of Tg4-42 mice. In line with our results, Boissiere and colleagues demonstrated that the expression of GAD67 mRNA in the caudate nucleus and putamen was higher in AD patients than in control subjects [46]. Another study investigated glutamate metabolizing enzymes like glutamine synthetase, glutamate dehydrogenase, and phosphate-activated glutaminase in the prefrontal cortex of AD patients. Levels of these enzymes were found to be significantly increased in AD patients which may suggest pathological changes of regulatory enzymes of glutamate metabolism in AD brains like in our study [47]. All these findings strongly indicate impairments of the glutamate/GABA-glutamine cycle in 9-month-old Tg4-42 mice.
Astroglial glutamate uptake can be inhibited by Aβ peptides, and this in turn can result in neuronal cell death mediated by neurotoxic glutamate [48, 49]. To investigate whether this neuropathological process occurs in the here presented Tg4-42 mouse model, total and soluble Aβ42 levels were determined. Furthermore, it has previously been described that Aβ42 toxicity can initiate downstream pathologic processes that represent key effectors of cellular dysfunction and cell death [50]. Beyond that, Aβ oligomers and Aβ depositions are also associated with impaired spatial memory in amyloid APP transgenic mice [51], which was also obtained in the Tg4-42 mouse model. Previous Tg4-42 mouse studies showed strong Aβ accumulation in the CA1 cell layer of the hippocampus using a pan-Aβ antibody by immunohistochemistry [52, 53].
Furthermore, based on the original findings of Aβ4–42 by Bouter et al. [6], we further characterized Aβ4–42 expression in this model. N-truncated Aβ peptides which are not produced under physiological conditions are known to aggregate quickly and irreversible into soluble toxic oligomers. As these N-truncated Aβ4–42 peptides are more toxic in vitro and in vivo compared to full-length Aβ1–42, these peptides which are overexpressed without any mutation in the Tg4-42 transgenic mouse model, represent an ideal therapeutic target to be investigated in AD [54, 55].
In addition, we used two different methods and antibodies to observe Aβ42 accumulation immunohistochemically in specific brain regions and to evaluate differences between concentrations of total and soluble Aβ42 levels. Moreover, Wang et al. described a significant decrease of Aβ production in a crossbreeding of 5xFAD mice with GAD67 haploinsufficient mice due to a reduction of GAD67 [56]. As the levels of GAD67 as well as all Aβ42 levels were increased in Tg4-42 mice compared to NTG animals in the here presented study, this indicates a connection between regulatory enzymes of the glutamate pathway and Aβ.
The toxicity of Aβ oligomers is well described in AD brains and can lead to an alteration in the balance between pro- and anti-oxidative processes which could result in an increased activation of surrounding astrocytes and microglia [57]. For this reason, levels of key inflammatory markers GFAP and Iba-1 were determined in the brains of Tg4-42 +/+ mice. Results revealed increased astrocytosis in the cortex as well as hippocampus of 9-month-old mice and in the caudate putamen region starting already at 3 months and increasing over age. Increased microgliosis was only observed in the caudate putamen of Tg4-42 +/+ mice starting at 6 months of age. These findings show for the first time the progressive increase of neuroinflammation over age in Tg4-42 +/+ mice. Increased GFAP and Iba-1 levels in 9-month-old Tg4-42 +/+ mice are in line with previous basic studies showing increased astrogliosis and microgliosis in different brain regions of 2-month-old hemizygous and 7-8-month-old homozygous Tg4-42 mice [6, 33].
It has been described that activation of microglia and the subsequent release of pro-inflammatory factors induces the loss of brain homeostasis, causing neuronal injury and eventually leading to neuronal death [1, 12]. NF-L levels are promising biomarker in blood or CSF to detect neurodegeneration in brain disorders like AD. For that reason, we observed NF-L levels in the here presented Tg4-42 +/+ mice which revealed increased NF-L levels in CSF samples which indicates severe cerebral axonal degeneration. The very large increase in NF-L levels observed in Tg4-42 +/+ mice suggest that neurodegeneration could affect regions other than just CA1 and that additional pathology may also be found elsewhere. In Aβ positive AD patients, levels of neurofilament light chain were associated with hypometabolism in AD-vulnerable regions [58]. Further studies described significantly increased NF-L levels in plasma and CSF of AD patients and high NF-L levels correlated with poor cognition, AD-related atrophy, and brain hypometabolism [59, 60].
Moreover, neuronal dysfunction and neuron loss are the most severe hallmarks in AD patients but most AD mouse models do not develop neuronal loss and lack this key feature of AD [8]. Therefore, we further investigated neuronal loss in 9-month-old Tg4-42 +/+ animals with a neuronal immunohistology staining which revealed a significantly decreased number of neurons in the CA1 region of the hippocampus. These findings are comparable with some other studies, where massive age-dependent neuron loss was described in this mouse model [6]. Due to this observation that Tg4-42 mice develop a massive neuronal loss these mice represent a promising model for the development of new drugs or drug efficacy studies.
CONCLUSION
In summary, our in vivo experiments showed severe memory deficits in the MWM behavior test in Tg4-42 +/+ mice which are in line with previous work by Bouter et al. [6]. Furthermore, we show key pathological features in this mouse model of AD including significantly altered metabolites in two different brain regions and metabolic changes of the glutamate/GABA-glutamine cycle as well as increased neurofilament light chain levels which indicate neuronal degeneration. Neuronal dysfunction as well as changes in the underlying pathways occur long before neuronal loss and can therefore function as early markers of AD. Moreover, we identified increased Aβ42 levels, neuroinflammation levels over age and neuronal loss in homozygous Tg4-42 mice. Our study provides a comprehensive characterization of the Tg4-42 +/+ mouse model and offers researchers the opportunity to gain a deeper understanding of pathological features in AD. Based on our overall results the Tg4-42 mice seem to be a promising AD mouse model for pre-clinical research as well as for the development of new drugs or drug efficacy studies.
AVAILABILITY OF DATA AND MATERIAL
All data generated or analyzed during this study are included in this published article and its supplementary figure or are available from the corresponding authors on request.
ACKNOWLEDGMENTS
This work was supported by the Austrian Research Promotion Agency (FFG: 856804) as well as QPS Austria GmbH. This research was supported by the Austrian Science Foundation (P28854, I3792, DK-MCD W1226 to TM), the Austrian Research Promotion Agency (FFG: 864690, 870454), the Integrative Metabolism Research Center Graz, the Austrian infrastructure program 2016/2017, the Styrian government (Zukunftsfonds) and BioTechMed/Graz.
BH was trained within the frame of the PhD program Molecular Medicine of the Medical University of Graz, Austria. We greatly thank the whole research team of QPS Austria GmbH for their technical support.
Authors’ disclosures available online (https://www.j-alz.com/manuscript-disclosures/20-1204r2).
SUPPLEMENTARY MATERIAL
[1] The supplementary material is available in the electronic version of this article: https://dx.doi.org/10.3233/JAD-201204.
REFERENCES
[1] | Cai Z , Hussain MD , Yan LJ ((2014) ) Microglia, neuroinflammation, and beta-amyloid protein in Alzheimer’s disease. Int J Neurosci 124: , 307–321. |
[2] | Dunys J , Valverde A , Checler F ((2018) ) Are N- and C-terminally truncated Abeta species key pathological triggers in Alzheimer’s disease? J Biol Chem 293: , 15419–15428. |
[3] | Wirths O , Walter S , Kraus I , Klafki HW , Stazi M , Oberstein TJ , Ghiso J , Wiltfang J , Bayer TA , Weggen S ((2017) ) N-truncated Abeta4-x peptides in sporadic Alzheimer’s disease cases and transgenic Alzheimer mouse models. Alzheimers Res Ther 9: , 80. |
[4] | Perez-Garmendia R , Hernandez-Zimbron LF , Morales MA , Luna-Munoz J , Mena R , Nava-Catorce M , Acero G , Vasilevko V , Viramontes-Pintos A , Cribbs DH , Gevorkian G ((2014) ) Identification of N-terminally truncated pyroglutamate amyloid-beta in cholesterol-enriched diet-fed rabbit and AD brain. J Alzheimers Dis 39: , 441–455. |
[5] | Eimer WA , Vassar R ((2013) ) Neuron loss in the 5XFAD mouse model of Alzheimer’s disease correlates with intraneuronal Abeta42 accumulation and Caspase-3 activation. Mol Neurodegener 8: , 2. |
[6] | Bouter Y , Dietrich K , Wittnam JL , Rezaei-Ghaleh N , Pillot T , Papot-Couturier S , Lefebvre T , Sprenger F , Wirths O , Zweckstetter M , Bayer TA ((2013) ) N-truncated amyloid beta (Abeta) 4-42 forms stable aggregates and induces acute and long-lasting behavioral deficits. Acta Neuropathol 126: , 189–205. |
[7] | Bouter Y , Kacprowski T , Weissmann R , Dietrich K , Borgers H , Brauß A , Sperling C , Wirths O , Albrecht M , Jensen LR , Kuss AW , Bayer TA ((2014) ) Deciphering the molecular profile of plaques, memory decline and neuron loss in two mouse models for Alzheimer’s disease by deep sequencing. Front Aging Neurosci 6: , 75. |
[8] | Schaeffer EL , Figueiro M , Gattaz WF ((2011) ) Insights into Alzheimer disease pathogenesis from studies in transgenic animal models. Clinics (Sao Paulo) 66: (Suppl 1), 45–54. |
[9] | Antonios G , Borgers H , Richard BC , Brauss A , Meissner J , Weggen S , Pena V , Pillot T , Davies SL , Bakrania P , Matthews D , Brownlees J , Bouter Y , Bayer TA ((2015) ) Alzheimer therapy with an antibody against N-terminal Abeta 4-X and pyroglutamate Abeta 3-X. Sci Rep 5: , 17338. |
[10] | Hinteregger B , Loeffler T , Flunkert S , Neddens J , Birner-Gruenberger R , Bayer TA , Madl T , Hutter-Paier B ((2020) ) Transgene integration causes RARB downregulation in homozygous Tg4–42 mice. Sci Rep 10: , 6377. |
[11] | Huttenrauch M , Brauss A , Kurdakova A , Borgers H , Klinker F , Liebetanz D , Salinas-Riester G , Wiltfang J , Klafki HW , Wirths O ((2016) ) Physical activity delays hippocampal neurodegeneration and rescues memory deficits in an Alzheimer disease mouse model. Transl Psychiatry 6: , e800. |
[12] | Saito T , Saido TC ((2018) ) Neuroinflammation in mouse models of Alzheimer’s disease. Clin Exp Neuroimmunol 9: , 211–218. |
[13] | Emwas AH ((2015) ) The strengths and weaknesses of NMR spectroscopy and mass spectrometry with particular focus on metabolomics research. Methods Mol Biol 1277: , 161–193. |
[14] | Emwas AH , Roy R , McKay RT , Tenori L , Saccenti E , Gowda GAN , Raftery D , Alahmari F , Jaremko L , Jaremko M , Wishart DS ((2019) ) NMR spectroscopy for metabolomics research. Metabolites 9: , 123. |
[15] | Larive CK , Barding GA Jr. , Dinges MM ((2015) ) NMR spectroscopy for metabolomics and metabolic profiling. Anal Chem 87: , 133–146. |
[16] | Holmes E , Wilson I , Nicholson J ((2008) ) Metabolic phenotyping in health and disease. Cell 134: , 714–717. |
[17] | Amberg A , Riefke B , Schlotterbeck G , Ross A , Senn H , Dieterle F , Keck M ((2017) ) NMR and MS methods for metabolomics. Methods Mol Biol 1641: , 229–258. |
[18] | Wang H , Tan L , Wang HF , Liu Y , Yin RH , Wang WY , Chang XL , Jiang T , Yu JT ((2015) ) Magnetic resonance spectroscopy in Alzheimer’s disease: Systematic review and meta-analysis. J Alzheimers Dis 46: , 1049–1070. |
[19] | Motsinger-Reif AA , Zhu H , Kling MA , Matson W , Sharma S , Fiehn O , Reif DM , Appleby DH , Doraiswamy PM , Trojanowski JQ , Kaddurah-Daouk R , Arnold SE ((2013) ) Comparing metabolomic and pathologic biomarkers alone and in combination for discriminating Alzheimer’s disease from normal cognitive aging. Acta Neuropathol Commun 1: , 28. |
[20] | Kaddurah-Daouk R , Rozen S , Matson W , Han X , Hulette CM , Burke JR , Doraiswamy PM , Welsh-Bohmer KA ((2011) ) Metabolomic changes in autopsy-confirmed Alzheimer’s disease. Alzheimers Dement 7: , 309–317. |
[21] | Casanova R , Varma S , Simpson B , Kim M , An Y , Saldana S , Riveros C , Moscato P , Griswold M , Sonntag D , Wahrheit J , Klavins K , Jonsson PV , Eiriksdottir G , Aspelund T , Launer LJ , Gudnason V , Legido Quigley C , Thambisetty M ((2016) ) Blood metabolite markers of preclinical Alzheimer’s disease in two longitudinally followed cohorts of older individuals. Alzheimers Dement 12: , 815–822. |
[22] | Alkan HF , Walter KE , Luengo A , Madreiter-Sokolowski CT , Stryeck S , Lau AN , Al-Zoughbi W , Lewis CA , Thomas CJ , Hoefler G , Graier WF , Madl T , Vander Heiden MG , Bogner-Strauss JG ((2018) ) Cytosolic aspartate availability determines cell survival when glutamine is limiting. Cell Metab 28: , 706–720.e706. |
[23] | Prokesch A , Graef FA , Madl T , Kahlhofer J , Heidenreich S , Schumann A , Moyschewitz E , Pristoynik P , Blaschitz A , Knauer M , Muenzner M , Bogner-Strauss JG , Dohr G , Schulz TJ , Schupp M ((2017) ) Liver p53 is stabilized upon starvation and required for amino acid catabolism and gluconeogenesis. FASEB J 31: , 732–742. |
[24] | Radovic B , Vujic N , Leopold C , Schlager S , Goeritzer M , Patankar JV , Korbelius M , Kolb D , Reindl J , Wegscheider M , Tomin T , Birner-Gruenberger R , Schittmayer M , Groschner L , Magnes C , Diwoky C , Frank S , Steyrer E , Du H , Graier WF , Madl T , Kratky D ((2016) ) Lysosomal acid lipase regulates VLDL synthesis and insulin sensitivity in mice. Diabetologia 59: , 1743–1752. |
[25] | Neddens J , Temmel M , Flunkert S , Kerschbaumer B , Hoeller C , Loeffler T , Niederkofler V , Daum G , Attems J , Hutter-Paier B ((2018) ) Phosphorylation of different tau sites during progression of Alzheimer’s disease. Acta Neuropathol Commun 6: , 52. |
[26] | Seidl R , Cairns N , Singewald N , Kaehler ST , Lubec G ((2001) ) Differences between GABA levels in Alzheimer’s disease and Down syndrome with Alzheimer-like neuropathology. Naunyn Schmiedebergs Arch Pharmacol 363: , 139–145. |
[27] | Hattori N , Abe K , Sakoda S , Sawada T ((2002) ) Proton MR spectroscopic study at 3 Tesla on glutamate/glutamine in Alzheimer’s disease. Neuroreport 13: , 183–186. |
[28] | Antuono PG , Jones JL , Wang Y , Li SJ ((2001) ) Decreased glutamate+glutamine in Alzheimer’s disease detected in vivo with (1)H-MRS at 0.5 T. Neurology 56: , 737–742. |
[29] | Calsolaro V , Edison P ((2016) ) Neuroinflammation in Alzheimer’s disease: Current evidence and future directions. Alzheimers Dement 12: , 719–732. |
[30] | Gupta A , Goyal R ((2016) ) Amyloid beta plaque: A culprit for neurodegeneration. Acta Neurol Belg 116: , 445–450. |
[31] | Dhiman K , Blennow K , Zetterberg H , Martins RN , Gupta VB ((2019) ) Cerebrospinal fluid biomarkers for understanding multiple aspects of Alzheimer’s disease pathogenesis. Cell Mol Life Sci 76: , 1833–1863. |
[32] | Wagner JM , Sichler ME , Schleicher EM , Franke TN , Irwin C , Low MJ , Beindorff N , Bouter C , Bayer TA , Bouter Y ((2019) ) Analysis of motor function in the Tg4-42 mouse model of Alzheimer’s disease. Front Behav Neurosci 13: , 107. |
[33] | Bouter C , Henniges P , Franke TN , Irwin C , Sahlmann CO , Sichler ME , Beindorff N , Bayer TA , Bouter Y ((2019) ) (18)F-FDG-PET detects drastic changes in brain metabolism in the Tg4-42 model of Alzheimer’s disease. Front Aging Neurosci 10: , 425. |
[34] | Hartman RE , Lee JM , Zipfel GJ , Wozniak DF ((2005) ) Characterizing learning deficits and hippocampal neuron loss following transient global cerebral ischemia in rats. Brain Res 1043: , 48–56. |
[35] | Volpe BT , Davis HP , Towle A , Dunlap WP ((1992) ) Loss of hippocampal CA1 pyramidal neurons correlates with memory impairment in rats with ischemic or neurotoxin lesions. Behav Neurosci 106: , 457–464. |
[36] | Olsen GM , Scheel-Krüger J , Møller A , Jensen LH ((1994) ) Relation of spatial learning of rats in the Morris water maze task to the number of viable CA1 neurons following four-vessel occlusion. Behav Neurosci 108: , 681–690. |
[37] | Landes AM , Sperry SD , Strauss ME , Geldmacher DS ((2001) ) Apathy in Alzheimer’s disease. J Am Geriatr Soc 49: , 1700–1707. |
[38] | Thomas P , Clement JP , Hazif-Thomas C , Leger JM ((2001) ) Family, Alzheimer’s disease and negative symptoms. Int J Geriatr Psychiatry 16: , 192–202. |
[39] | McKenna MC ((2007) ) The glutamate-glutamine cycle is not stoichiometric: Fates of glutamate in brain. J Neurosci Res 85: , 3347–3358. |
[40] | Walton HS , Dodd PR ((2007) ) Glutamate–glutamine cycling in Alzheimer’s disease. Neurochem Int 50: , 1052–1066. |
[41] | Doert A , Pilatus U , Zanella F , Muller WE , Eckert GP ((2015) ) (1)H- and (1)(3)C-NMR spectroscopy of Thy-1-APPSL mice brain extracts indicates metabolic changes in Alzheimer’s disease. J Neural Transm (Vienna) 122: , 541–550. |
[42] | Huang D , Liu D , Yin J , Qian T , Shrestha S , Ni H ((2017) ) Glutamate-glutamine and GABA in brain of normal aged and patients with cognitive impairment. Eur Radiol 27: , 2698–2705. |
[43] | Gueli MC , Taibi G ((2013) ) Alzheimer’s disease: Amino acid levels and brain metabolic status. Neurol Sci 34: , 1575–1579. |
[44] | Liu P , Fleete MS , Jing Y , Collie ND , Curtis MA , Waldvogel HJ , Faull RL , Abraham WC , Zhang H ((2014) ) Altered arginine metabolism in Alzheimer’s disease brains. Neurobiol Aging 35: , 1992–2003. |
[45] | Manyevitch R , Protas M , Scarpiello S , Deliso M , Bass B , Nanajian A , Chang M , Thompson SM , Khoury N , Gonnella R , Trotz M , Moore DB , Harms E , Perry G , Clunes L , Ortiz A , Friedrich JO , Murray IVJ ((2018) ) Evaluation of metabolic and synaptic dysfunction hypotheses of Alzheimer’s disease (AD): A meta-analysis of CSF markers. Curr Alzheimer Res 15: , 164–181. |
[46] | Boissiere F , Faucheux B , Duyckaerts C , Hauw JJ , Agid Y , Hirsch EC ((1998) ) Striatal expression of glutamic acid decarboxylase gene in Alzheimer’s disease. J Neurochem 71: , 767–774. |
[47] | Burbaeva G , Boksha IS , Tereshkina EB , Savushkina OK , Starodubtseva LI , Turishcheva MS ((2005) ) Glutamate metabolizing enzymes in prefrontal cortex of Alzheimer’s disease patients. Neurochem Res 30: , 1443–1451. |
[48] | Matos M , Augusto E , Oliveira CR , Agostinho P ((2008) ) Amyloid-beta peptide decreases glutamate uptake in cultured astrocytes: Involvement of oxidative stress and mitogen-activated protein kinase cascades. Neuroscience 156: , 898–910. |
[49] | Ong WY , Tanaka K , Dawe GS , Ittner LM , Farooqui AA ((2013) ) Slow excitotoxicity in Alzheimer’s disease. J Alzheimers Dis 35: , 643–668. |
[50] | Glabe CG , Kayed R ((2006) ) Common structure and toxic function of amyloid oligomers implies a common mechanism of pathogenesis. Neurology 66: , S74–78. |
[51] | Sadowski M , Pankiewicz J , Scholtzova H , Ji Y , Quartermain D , Jensen CH , Duff K , Nixon RA , Gruen RJ , Wisniewski T ((2004) ) Amyloid-β deposition is associated with decreased hippocampal glucose metabolism and spatial memory impairment in APP/PS1 mice. J Neuropathol Exp Neurol 63: , 418–428. |
[52] | Lopez-Noguerola JS , Giessen NME , Ueberück M , Meißner JN , Pelgrim CE , Adams J , Wirths O , Bouter Y , Bayer TA ((2018) ) Synergistic effect on neurodegeneration by N-truncated Aβ and pyroglutamate Aβ in a mouse model of Alzheimer’s disease. Front Aging Neurosci 10: , 64. |
[53] | Dietrich K , Bouter Y , Muller M , Bayer TA ((2018) ) Synaptic alterations in mouse models for Alzheimer disease-a special focus on N-truncated Abeta 4-42. Molecules 23: , 718. |
[54] | Bayer TA , Wirths O ((2014) ) Focusing the amyloid cascade hypothesis on N-truncated Abeta peptides as drug targets against Alzheimer’s disease. Acta Neuropathol 127: , 787–801. |
[55] | Lemere CA ((2009) ) Developing novel immunogens for a safe and effective Alzheimer’s disease vaccine. Prog Brain Res 175: , 83–93. |
[56] | Wang Y , Wu Z , Bai YT , Wu GY , Chen G ((2017) ) Gad67 haploinsufficiency reduces amyloid pathology and rescues olfactory memory deficits in a mouse model of Alzheimer’s disease. Mol Neurodegener 12: , 73. |
[57] | Cieslik M , Czapski GA , Wojtowicz S , Wieczorek I , Wencel PL , Strosznajder RP , Jaber V , Lukiw WJ , Strosznajder JB ((2020) ) Alterations of transcription of genes coding anti-oxidative and mitochondria-related proteins in amyloid beta toxicity: Relevance to Alzheimer’s disease. Mol Neurobiol 57: , 1374–1388. |
[58] | Benedet AL , Ashton NJ , Pascoal TA , Leuzy A , Mathotaarachchi S , Kang MS , Therriault J , Savard M , Chamoun M , Schöll M , Zimmer ER , Gauthier S , Labbe A , Zetterberg H , Blennow K , Neto PR ((2019) ) Plasma neurofilament light associates with Alzheimer’s disease metabolic decline in amyloid-positive individuals. Alzheimers Dement (Amst) 11: , 679–689. |
[59] | Lin Y-S , Lee W-J , Wang S-J , Fuh J-L ((2018) ) Levels of plasma neurofilament light chain and cognitive function in patients with Alzheimer or Parkinson disease. Sci Rep 8: , 17368–17368. |
[60] | Mattsson N , Andreasson U , Zetterberg H , Blennow K ((2017) ) Association of plasma neurofilament light with neurodegeneration in patients with Alzheimer disease. JAMA Neurol 74: , 557–566. |


