
Machine Learning-Supported Analyses Improve Quantitative Histological Assessments of Amyloid-β Deposits and Activated Microglia
Abstract
Background:
Detailed pathology analysis and morphological quantification is tedious and prone to errors. Automatic image analysis can help to increase objectivity and reduce time. Here, we present the evaluation of the DeePathology STUDIO™ for automatic analysis of histological whole-slide images using machine learning/artificial intelligence.
Objective:
To evaluate and validate the use of DeePathology STUDIO for the analysis of histological slides at high resolution.
Methods:
We compared the DeePathology STUDIO and our current standard method using macros in AxioVision for the analysis of amyloid-β (Aβ) plaques and microglia in APP-transgenic mice at different ages. We analyzed density variables and total time invested with each approach. In addition, we correlated Aβ concentration in brain tissue measured by ELISA with the results of Aβ staining analysis.
Results:
DeePathology STUDIO showed a significant decrease of the time for establishing new analyses and the total analysis time by up to 90%. On the other hand, both approaches showed similar quantitative results in plaque and activated microglia density in the different experimental groups. DeePathology STUDIO showed higher sensitivity and accuracy for small-sized plaques. In addition, DeePathology STUDIO allowed the classification of plaques in diffuse- and dense-packed, which was not possible with our traditional analysis.
Conclusion:
DeePathology STUDIO substantially reduced the effort needed for a new analysis showing comparable quantitative results to the traditional approach. In addition, it allowed including different objects (categories) or cell types in a single analysis, which is not possible with conventional methods.
INTRODUCTION
In clinical routine, pathologists use visual evaluation, semi-quantitation, and morphology for diagnostics. However, this approach is subjective and may lead to discrepancies in the diagnosis and, therefore, treatment approach. In addition, in clinical and preclinical research, data from images must be quantitative to allow statistical analysis, needed for characterization of pathological changes and evaluation of potential new treatments. This translates to cell or plaque counting, intensity quantification, or shape classification. This approach, when manually performed, is tedious and prone to errors. In addition, it requires investment of time and is, therefore, often avoided, lacking published studies of this crucial information [1]. Thus, several groups have developed semi-automatic approaches that reduce the time invested but need experts in computer science for the design and validation of every analysis performed. However, for comparison of results there is a need for increased reproducibility among users. The use of macros in imaging software can help to increase objectivity in the analysis but input from the user is still needed, which may be a source of variability.
In this study, we present the first evaluation of DeePathology STUDIO (DeePathology Ltd., Ra’anana, Israel) that allows automatic morphological analysis of histological images using deep learning. Deep learning offers the possibility of performing image analysis without the need of self-designing complex algorithms or previous knowledge of programming. DeePathology STUDIO uses deep learning methodologies that do not need large amounts of images to reach a high prediction accuracy.
In order to evaluate and validate the use of Dee-Pathology STUDIO for the analysis of histological slide images, we have compared two strategies for the analysis of amyloid-β (Aβ) deposition and microglia activation in a β-amyloidosis mouse model of Alzheimer’s disease [2]. First, we analyzed stained brain sections using the AxioVision software package v4.8 (Zeiss Microsystems GmbH, Jena, Germany) and in-house specific programmed macros used for routine assessment in our laboratory [3–10]. Then, we used the same slides for the analysis in DeePathology STUDIO software previously trained with our slides.
To assess the differences between conventional analysis using image segregation/geometrical tools and morphological analysis using deep learning support, we compared the overall results obtained in the two analyses, the variables that were analyzed, and the total time invested with each approach.
MATERIAL AND METHODS
Animals
APP-transgenic (APPtg) mice (APPPS1–21 [2]) were housed in the animal care facility of the Department of Comparative Medicine at the University Hospital in Oslo (Norway) with a 12 h/12 h light/dark cycle at a mean temperature of 22°C with free access to food and autoclaved water. All experiments performed were conducted according the European Union Directive and regional laws and were approved by the local animal ethics committee.
For histology assessment, mice were killed at different time points (75, 100, 125, and 150 days of age) aiming to have a wide distribution of plaque density and microglia activation. After cervical dislocation, mice were perfused with ice-cold PBS and brains were removed. One hemisphere was fixed in paraformaldehyde (PFA 4% in PBS) and the other hemisphere was snap frozen in liquid nitrogen.
Immunostaining
Formalin-fixed hemispheres from APPtg mice were embedded in paraffin and cut in 4-μm-thick coronal sections. Slices were stained using a BOND-MAX® automated immunostaining system (Leica Biosystems GmbH, Germany). Sections (approximately Bregma –2.0 mm) were stained for microglia (IBA1, 1:1,000, Wako, 019–19741), and Aβ (anti-human Aβ clone 4G8; 1:2,000, HiSS Diagnostics, SIG-39220-1000). Sections for Aβ staining were pre-treated 5 minutes with 98% formic acid before being stained. After staining, tissue sections were digitized at 230 nm resolution using a Pannoramic MidiII slide scanner (3DHistotech, Budapest, Hungary) [3, 4, 10–12].
Image analysis
Stained slides were analyzed semi-automatically using two different approaches.
First, AxioVision software was used to program macros for labelling with IBA1 and 4G8 primary antibodies, respectively, based on a procedure described by Scheffler et al. [9]. Regions of interest were defined including parietal, somatosensory, auditory, and temporal cortices. Then, the software segregated the image according to the staining intensity, which is recognized in the green channel. Afterwards, the investigator manually separated adjacent objects and discarded false positives. The software provided the number of objects (cells or plaques, depending on the staining) and the size of each object. These data were used to calculate percentage of coverage and average size of cells/plaques. In addition, Aβ plaques were categorized as small (<400μm2), medium (400–700μm2), and large (>700μm2) plaques. Finally, results were normalized to 10 mm2 area to compare density between experimental groups.
On the other hand, the identical brain slides were analyzed using machine learning (ML) algorithms of the DeePathology STUDIO software. To this aim, the software was trained separately to 1) recognize Aβ plaques or 2) activated microglial cells. For the training, we used representative images for each staining. Then, we created the corresponding categories (background and diffuse/dense plaques or microglia) and delineated representative objects for each category. After delineating a few objects, the built algorithm is applied and the recognized objects are delineated by the deep learning algorithm. During the learning phase, the results are immediately presented to the user, who can provide additional corrections to refine the learning. The user can confirm or change the classification of each individual object as part of the training. This procedure is repeated until the training phase is concluded satisfactorily.
In addition, we created two categories for plaques, differentiating between diffuse and dense-core plaques. Once the training was completed, brain slides were analyzed automatically by DeePathology STUDIO after delineating the region of interest, which included the identical areas as for the analysis with the AxioVision software. Differently to the macro analysis, the ML-based solution was trained to detect only activated microglia and not isolated projections. For comparison to the ML-based approach, we filtered only the objects corresponding to the size of activated microglia (>60μm2, set according to ML calculations).
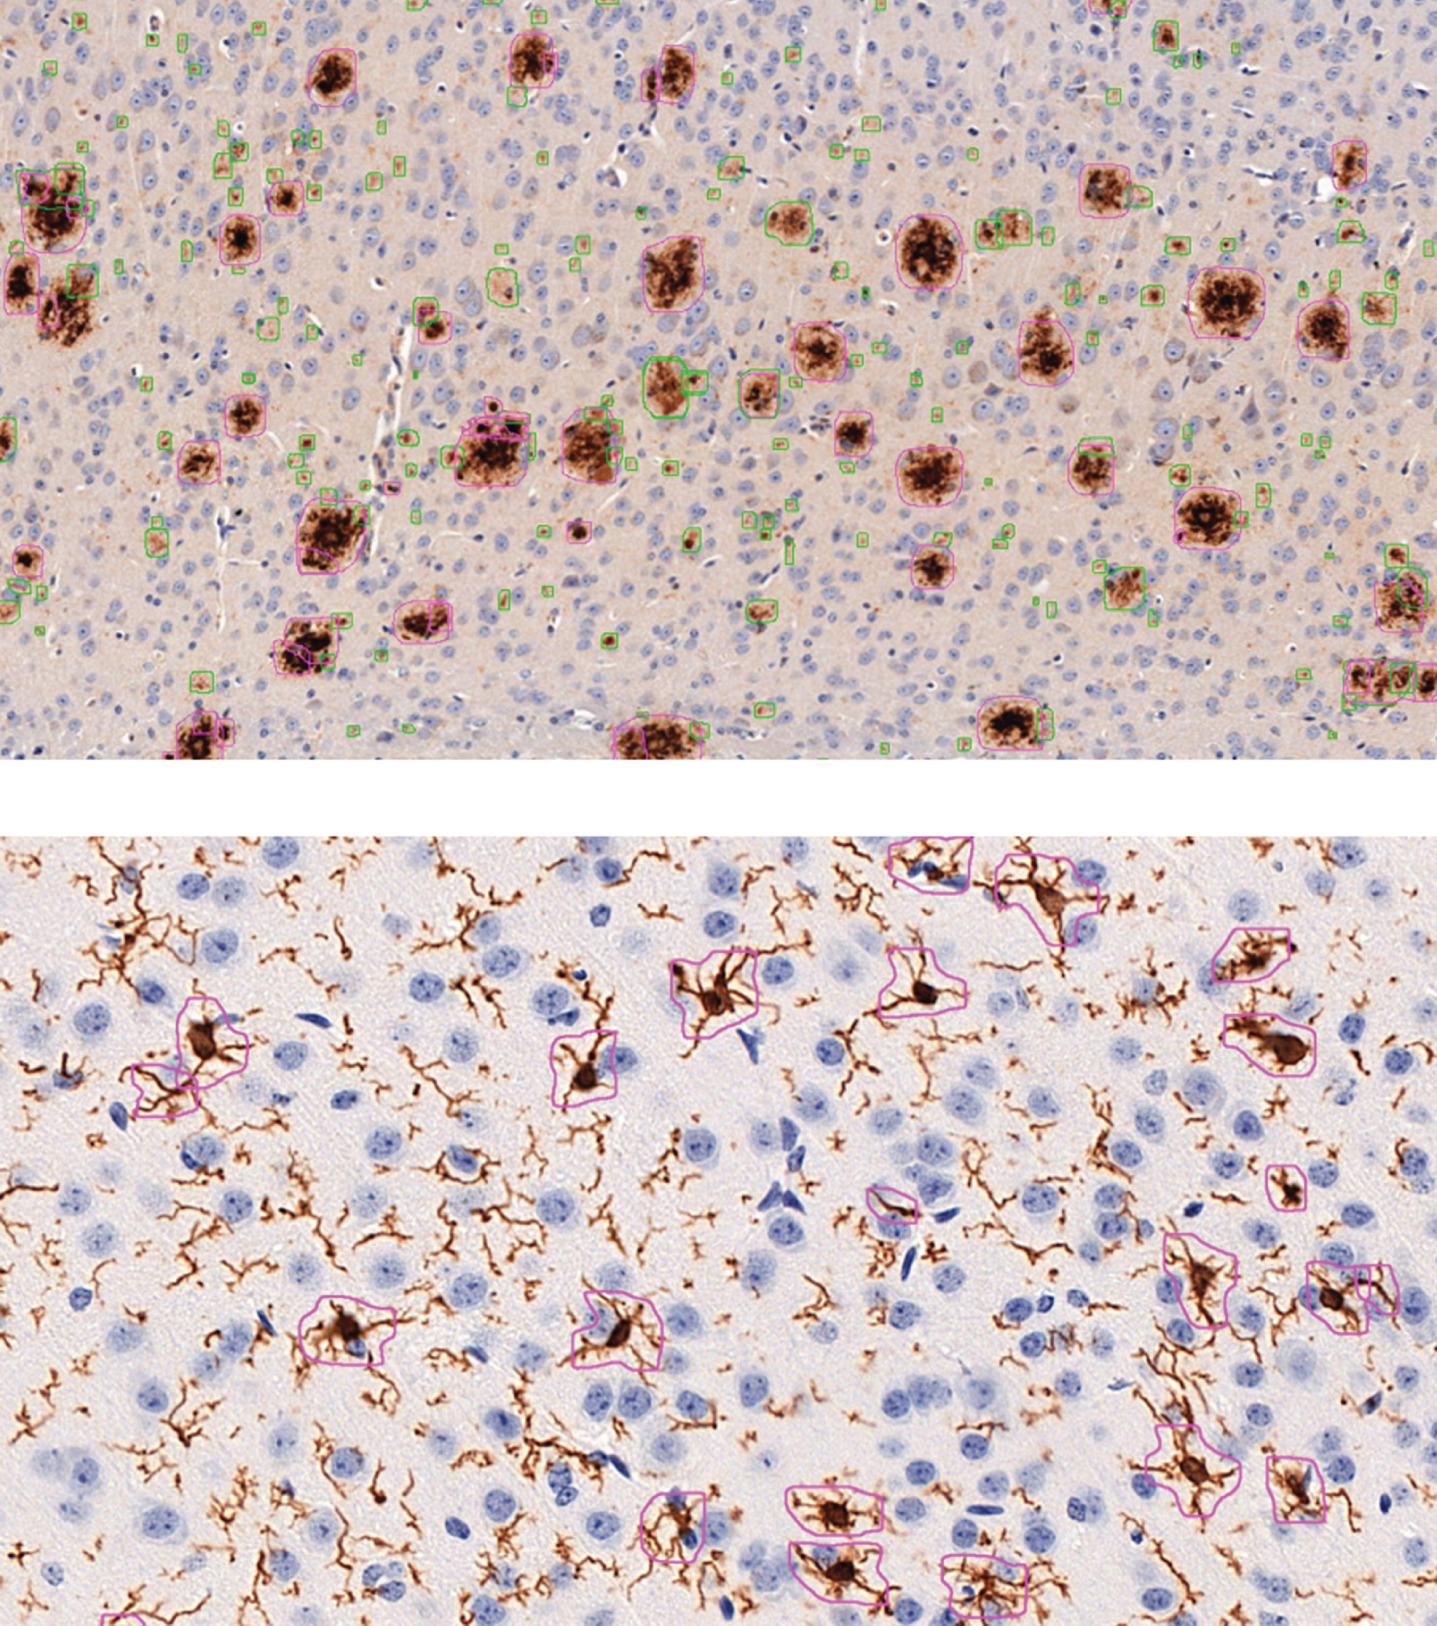
Fig. 1
Example images of automatic analysis with DeePathology STUDIO for Aβ (above; anti-Aβ (clone 4G8) staining) and microglia (below; anti-Iba1 staining). Aβ analysis was trained to distinguish between diffuse- (green) and dense-packed (pink) plaques. Microglial analysis was set to detect only activated microglia but no isolated projections or resting microglia.
Learning algorithm in DeePathology Studio
DeePathology STUDIO is a platform that allows pathologists and researchers to create custom deep learning-based image analysis for morphological studies. The STUDIO software has different modes for creating algorithms that span the different tasks in Digital Pathology and supports combinations of them: ‘Regions’ for region segmentation, ‘Cells’ for detection and classification of cells, ‘Objects’ for performing Instance Segmentation on other types of objects, and ‘Tiles’ for analyzing predetermined larger fields for pattern/tissue recognition.
The starting point for using DeePathology STUDIO is data annotation of the objects of choice in the ‘objects’ mode, done interactively in parallel to the training of the algorithm. Active Learning is used to suggest objects/cells what could be annotated next. The annotation in general is done by running the algorithm multiple times, and then, either correcting the results or adding the results to the previous training set, generating a growing collection of training objects.
As the interactive annotation advances, the platform creates an initial version of the algorithm. The user can run the generated algorithm on a selected field of view, assess the performance of the generated algorithm and provide feedback on the detections to correct mistakes. It is also possible to add new data from the detections to the training set. The training mode can be switched off during analysis and be resumed adding new slides and annotations if needed.
2.5Quantification of amyloid-β
Additionally, we performed quantification of brain Aβ using an electrochemiluminescence immunoassay. To this aim, we homogenized contralateral hemispheres to the ones used for histology. Then, soluble and insoluble Aβ fractions were extracted in TBS and guanidine buffer respectively. Enzyme linked immune sorbent assays (ELISAs) were performed for the quantification of TBS and guanidine buffer soluble Aβ42 levels using the V-PLEX Plus Aβ42 Peptide (4G8) Kit and a MESO QuickPlex SQ120 machine according to manufacturer’s recommendations (K150SLG, Mesoscale Discovery, USA). Results were normalized to sample protein concentration, which was calculated using a spectrophotometer (ScanDrop, Analytikjena AG, Germany). Brain Aβ42 content was calculated as pg/mg total protein.
Statistics
Differences were analyzed by ANOVA testing followed by Dunnet’s post-hoc test with 75 days as control group. Data are presented as mean±standard deviation (SD). Correlation coefficient between analysis methods were analyzed using Pearson’s correlation test. Differences were considered statistically significant when p value was less than 0.05.
RESULTS
To assess the accuracy and efficiency of DeePathology STUDIO in comparison to our standard Axio-Vision procedure, we calculated the average time needed for the analysis for each case.
The use of the DeePathology STUDIO showed a significant reduction of the time needed per analysis as compared to AxioVision image segregation and manual cleanup. First, programming the macros for AxioVision analysis needed approximately 20 h for Aβ (4G8) and Iba1 staining, respectively. On the other hand, the ML training with DeePathology STUDIO took 4 h for plaque detection and 6 h for microglia detection using eight different slides as a subset of the experimental samples. For the detection of Aβ plaques, we needed 8–10 min per sample using DeePathology STUDIO while we needed 60 to 90 min with our standard protocol. For the analysis of activated microglia, we invested 8 to 10 min per sample using DeePathology STUDIO.
Table 1
Comparative table of the time spent by the user in analyzing one slide using AxioVision or DeePathology STUDIO depending on the staining analysed.* Microglia analysis differed between both programs. Analysis with AxioVision detected all activated and resting microglia as well as their cell projections. Analysis by DeePathology STUDIO was more specific and only outlined the cells of interest (activated microglia)
| AxioVision | DeePathology | ||
| v4.8 | STUDIO | ||
| Aβ plaques | Programming | ≈20 h | ≈4 h |
| Detection | 60–90 min | 6–9 min | |
| microglia | Programming | ≈20 h | ≈6 h |
| Detection | 90–120 min* | 8–10 min* |
After automatic outline, an experienced researcher supervised each slide analysis and the amount of non-detected objects (false negatives) was noted. ML-based analysis showed an average rate of false negative of 1.19% (average of three (3.04) missed plaques of a total average of 214 big (>70μm2) plaques per animal). The false negative rate was proportional to the density of objects, showing a similar percentage in each experimental group.
Accuracy of assessing Aβ plaques
Comparing AxioVision software and DeePathology STUDIO, both analyses showed an increase of the coverage and number of Aβ plaques with age in APPtg mice (Fig. 2).
Fig. 2
Comparison between DeePathology STUDIO and AxioVision analysis for Aβ plaques in animals of 75, 100, 125, and 150 days of age. A) Representative images of Aβ (4G8 antibody) immunostaining with hematoxylin counterstaining at the different experimental ages. Plaque coverage shows similar evolution in DeePathology STUDIO (B) and AxioVision (C), increasing with age. Both analyses show high correlation (D). Although both analyses show increased number of plaques with age, DeePathology STUDIO (E) detected higher plaque density than AxioVision (F), being more noticeable at later ages. Nevertheless, they showed high correlation also for plaque density (G). Data shown as mean±SD (*p < 0.05).
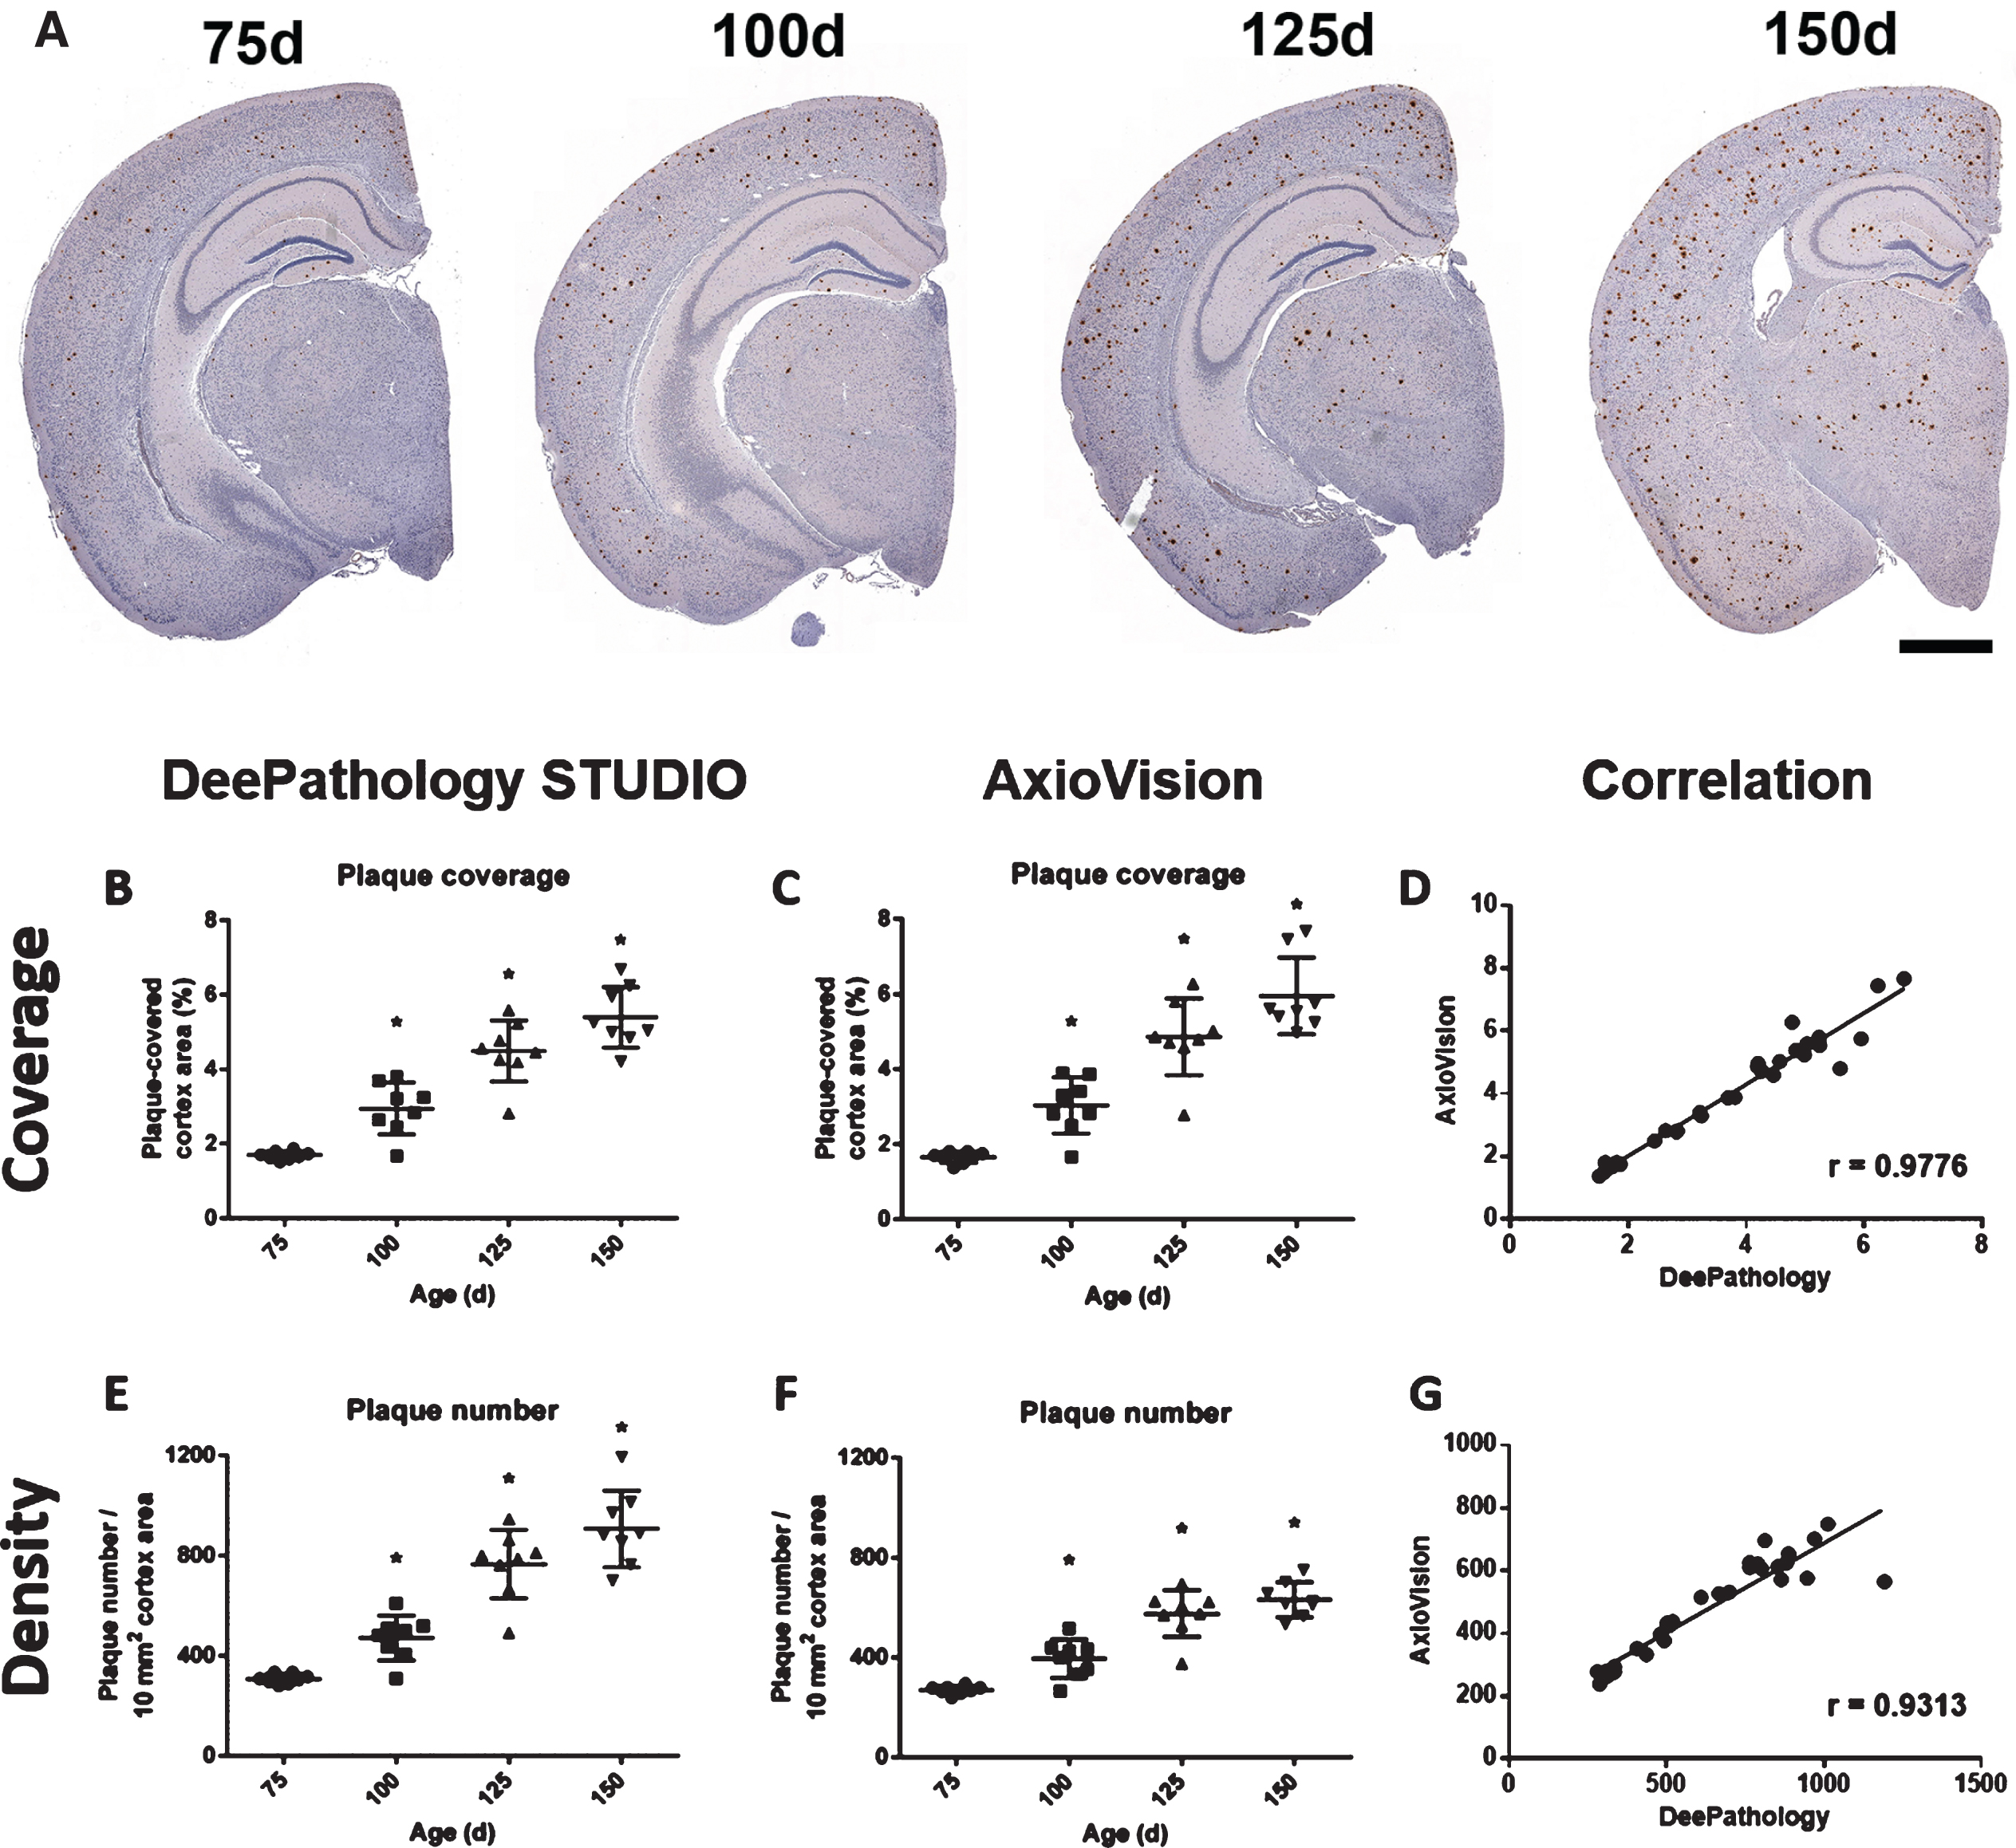
In DeePathology STUDIO analysis, coverage significantly increased constantly from 1.7±0.1% at 75 days of age up to 5.4±0.1% at 150 days of age (p < 0.05 at every age when compared to the younger group). In addition, we observed an increase of plaque numbers in parallel to the coverage, from 308±19 plaques/10 mm2 at 75 days of age until 907±143 plaques/10 mm2 at 150 days of age (p < 0.05 when comparing to the youngest group).
This increase was also seen with the semi-automatic standard protocol with AxioVision software obtaining similar values to the ML analysis for the plaque coverage (75 days: 1.7±0.3%; 150 days: 6.0±1.1%). However, although the AxioVision analysis also detected an increase in the plaque number with age, the increase was not as pronounced as with DeePathology STUDIO, especially in the late time points (150 days: 634±96 versus 907±143 plaques/10 mm2 with ML). Correlation studies indicated that the sensitivity of DeePathology STUDIO analysis is comparable to the analysis using the in-house macro in AxioVision showing similar distribution of plaque density (r = 0.98, p < 0.001) and plaque number (r = 0.93, p < 0.001; Fig. 2D,2G).
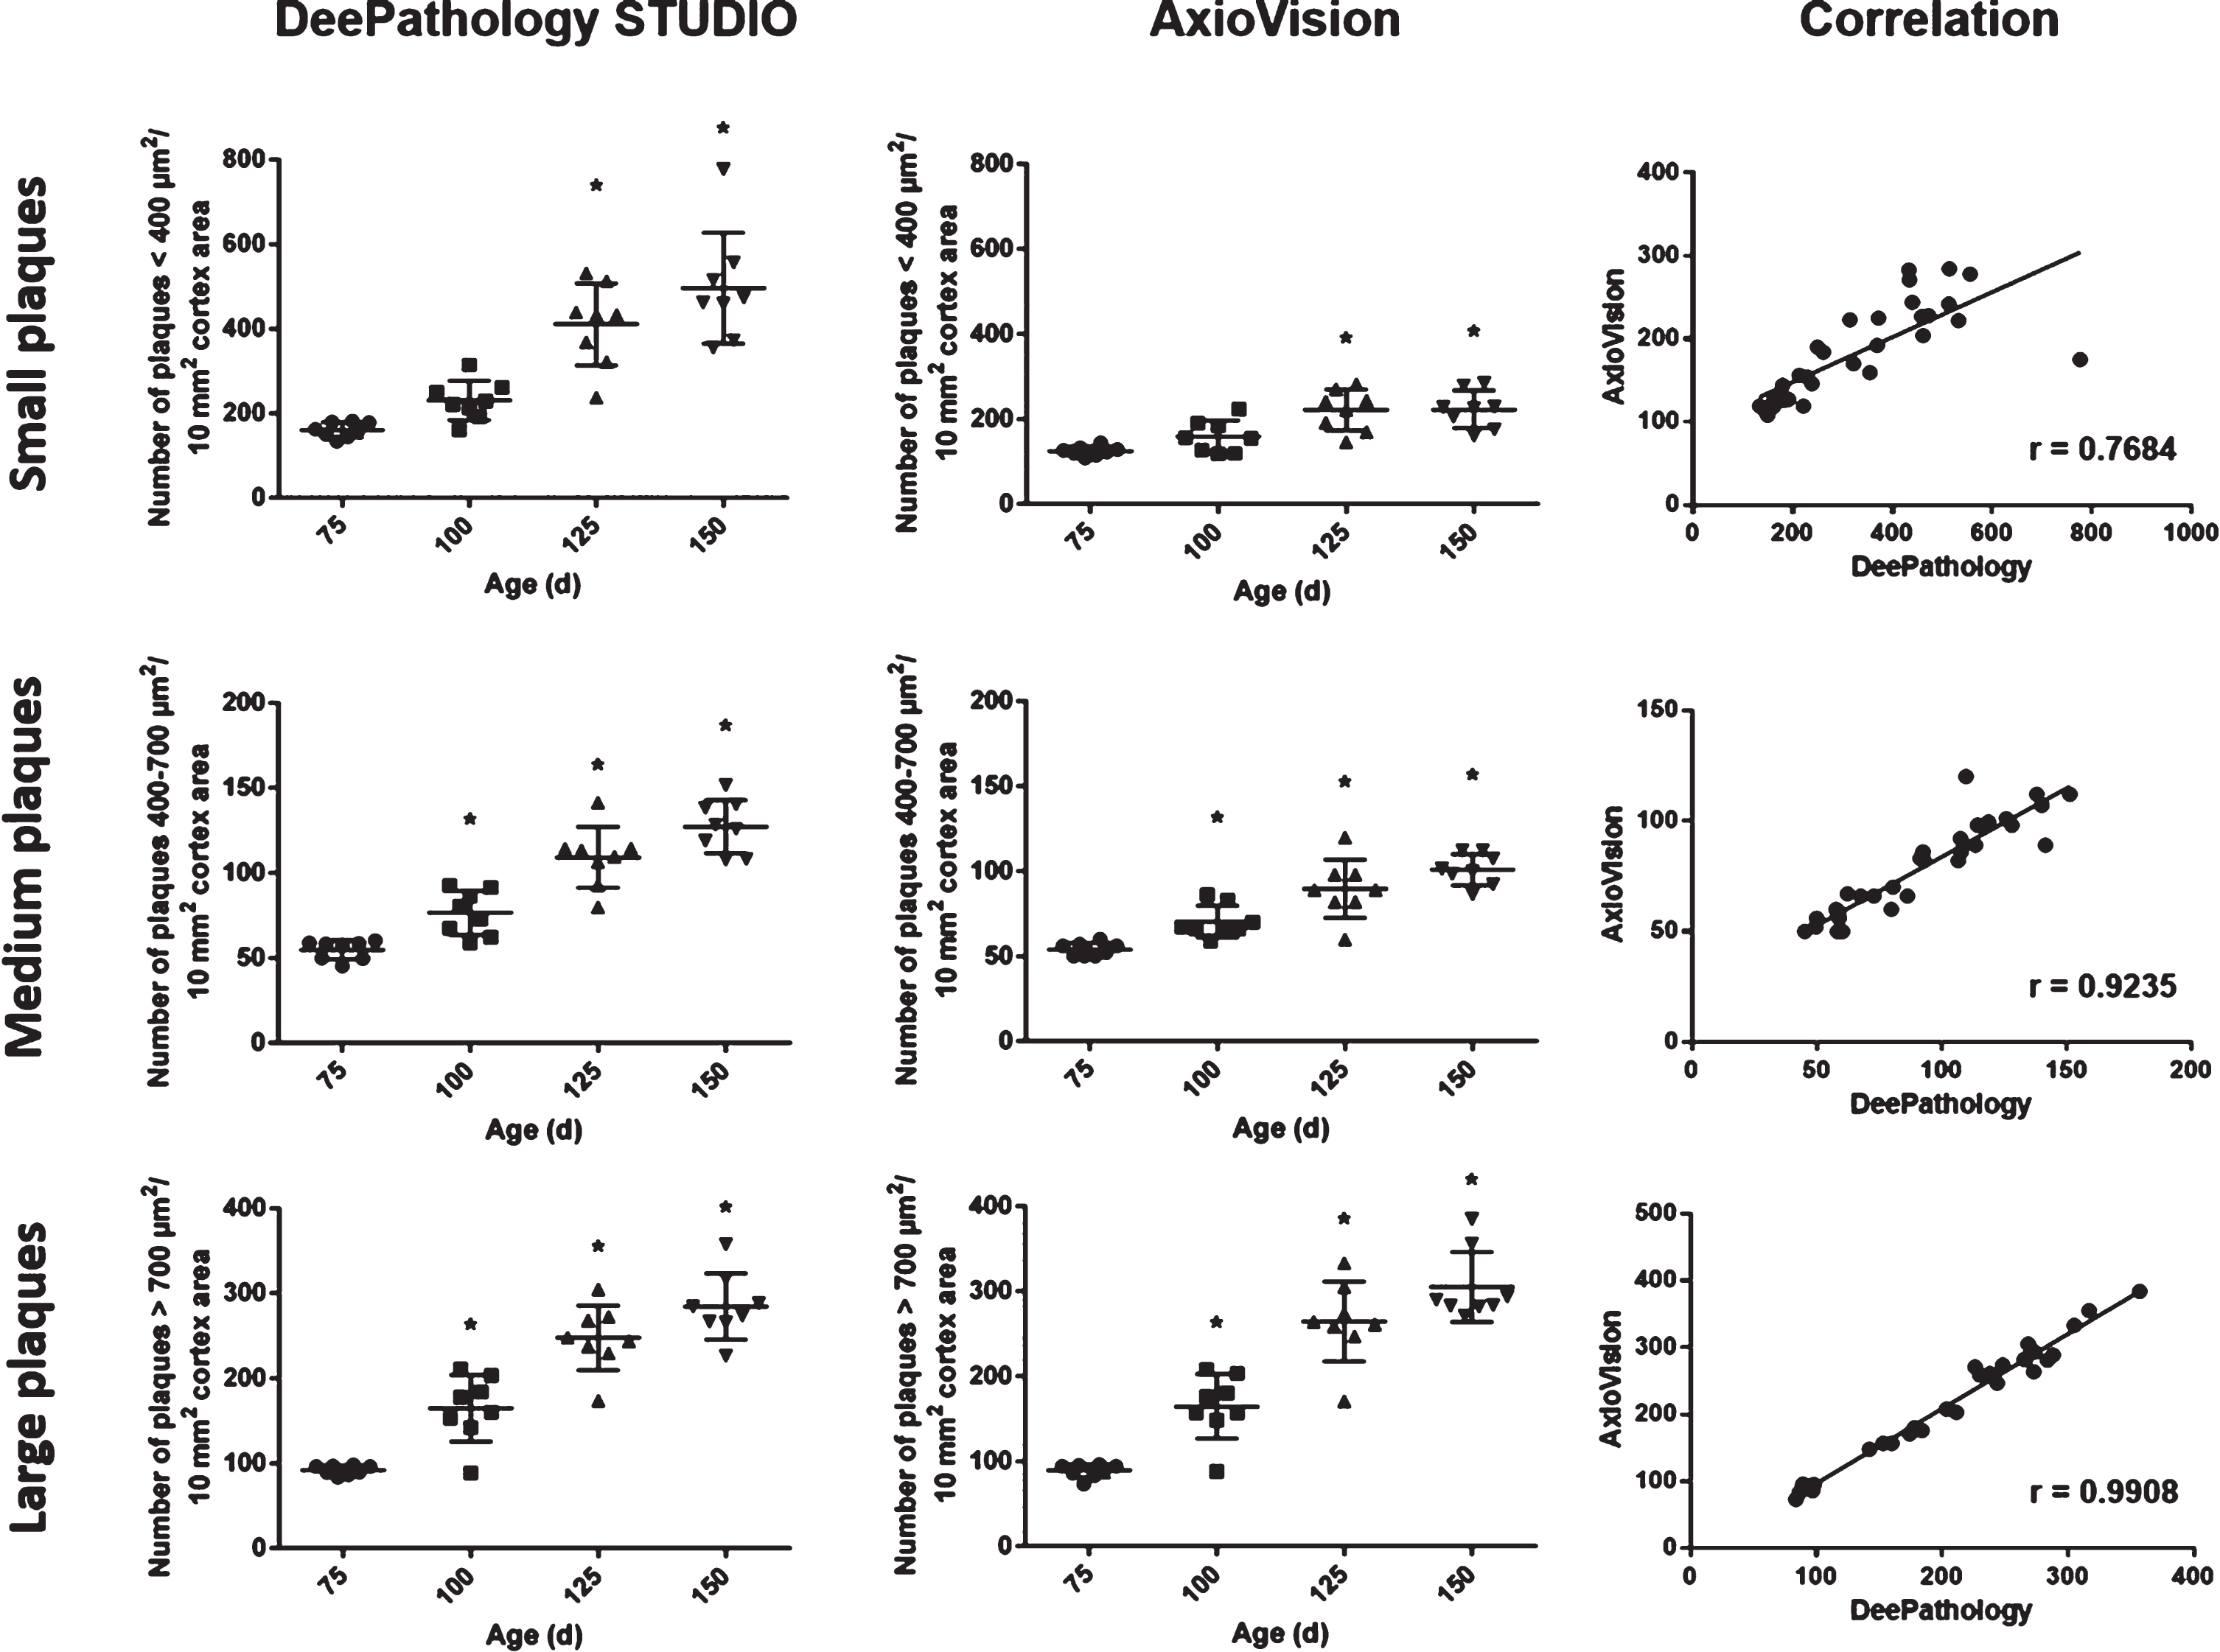
When classifying the plaques by size in small, medium, and large plaques, it showed similar distribution in large and medium plaques with both analysis methods (r = 0.99 and r = 0.92, respectively (Fig. 3). However, the detection of small plaques differed: DeePathology STUDIO showed a better detection of small plaques with age while the macro analysis showed only a subtle increase in older mice (r = 0.77).
Fig. 3
Dot plots showing plaque density categorized by size: small (<400μm2; upper row), medium (400–700μm2; middle row), and big plaques (>700μm2; low row) in the different experimental groups according to DeePathology STUDIO (left column) and AxioVision (middle column). Both analyses show high correlations (right column) for big and medium plaques. Detection of small plaques differed between the two methods. DeePathology STUDIO enables a higher identification of small plaques compared to AxioVision analysis. Data shown as mean±SD (*p < 0.05).
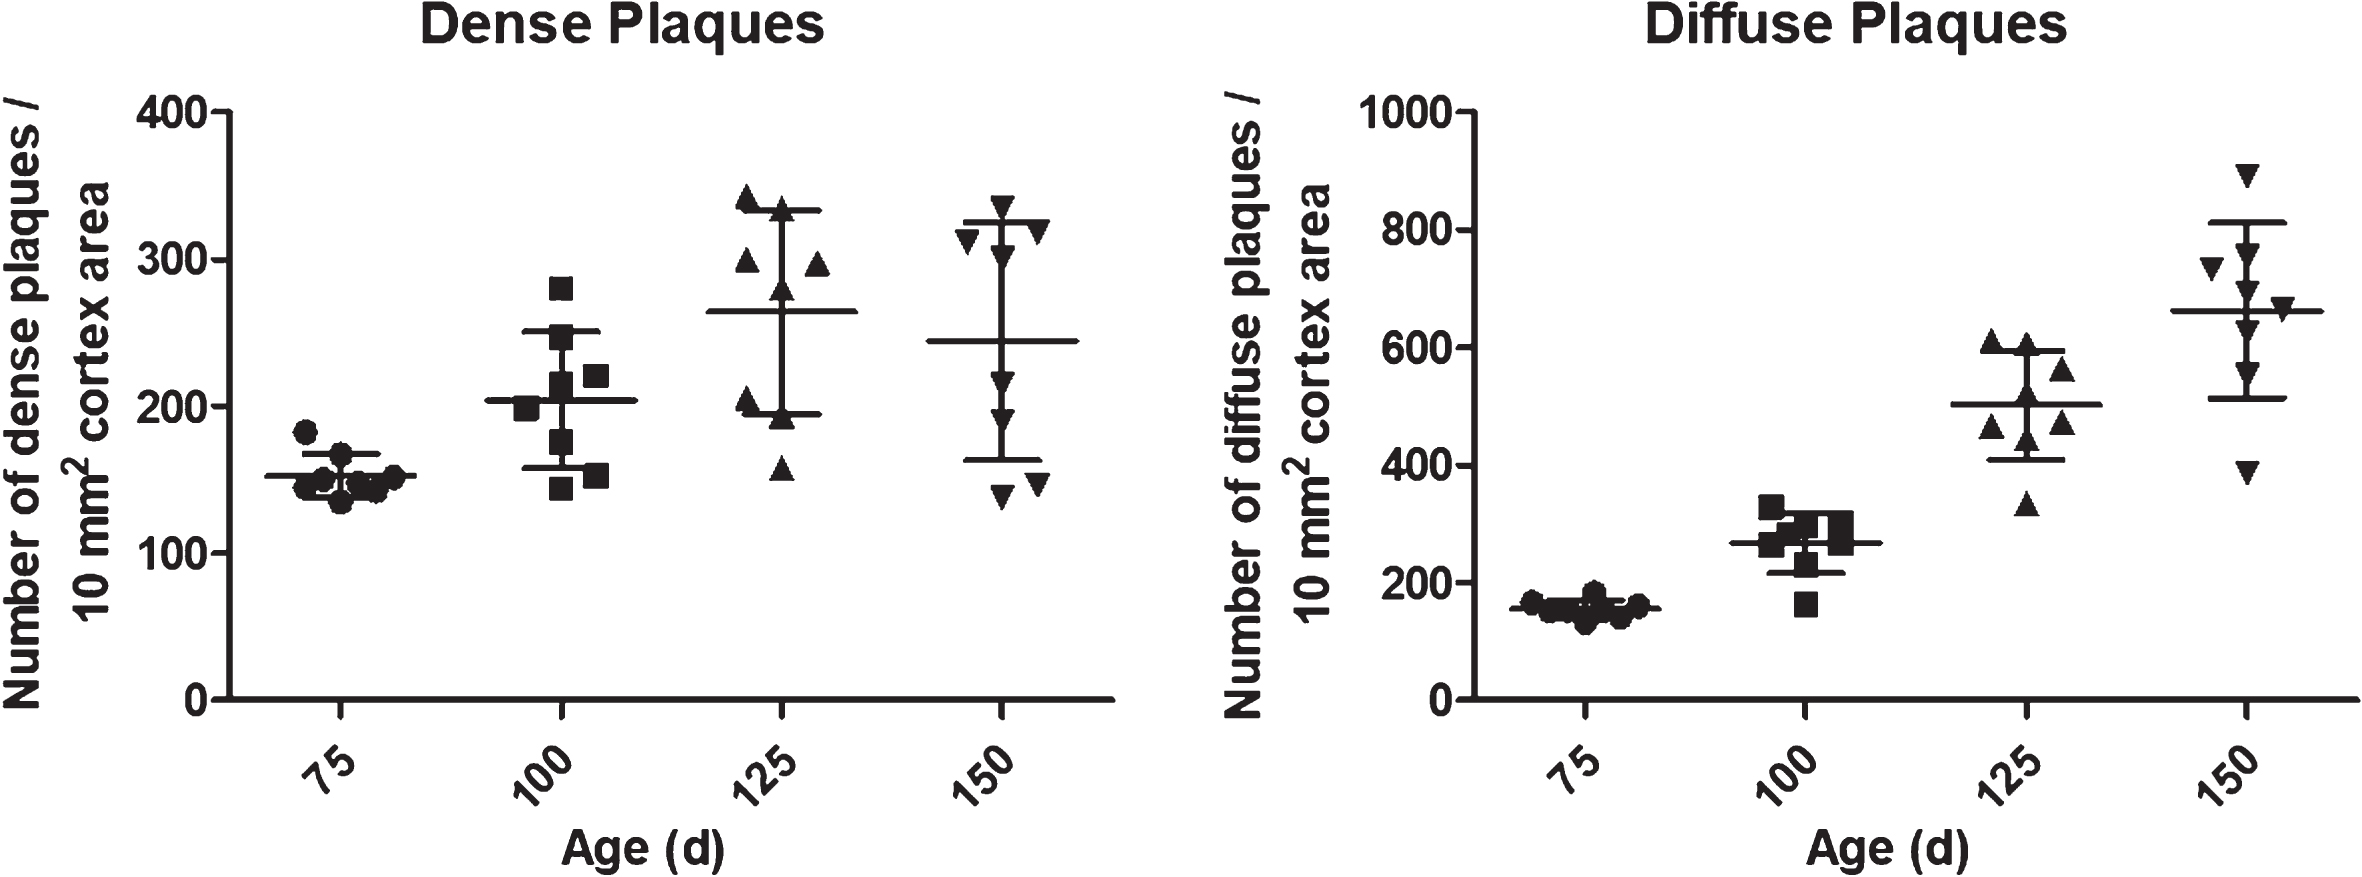
In addition, classification of objects allowed by DeePathology STUDIO showed an increase of both dense-cored and diffuse plaques in older animals as compare to younger animals (166±16 diffuse plaques/10 mm2 at 75d versus 772±168 diffuse plaques/10 mm2 at 150d; Fig. 4). Differentiation of diffuse and dense-cored plaques is not possible to be performed with our AxioVision macros.
Fig. 4
Dense- and diffuse-packed plaques distribution according to age performed by DeePathology STUDIO. Diffuse plaques show continuous growing while dense plaques do not change significantly after 100 days of age. Data shown as mean±SD (*p < 0.05).
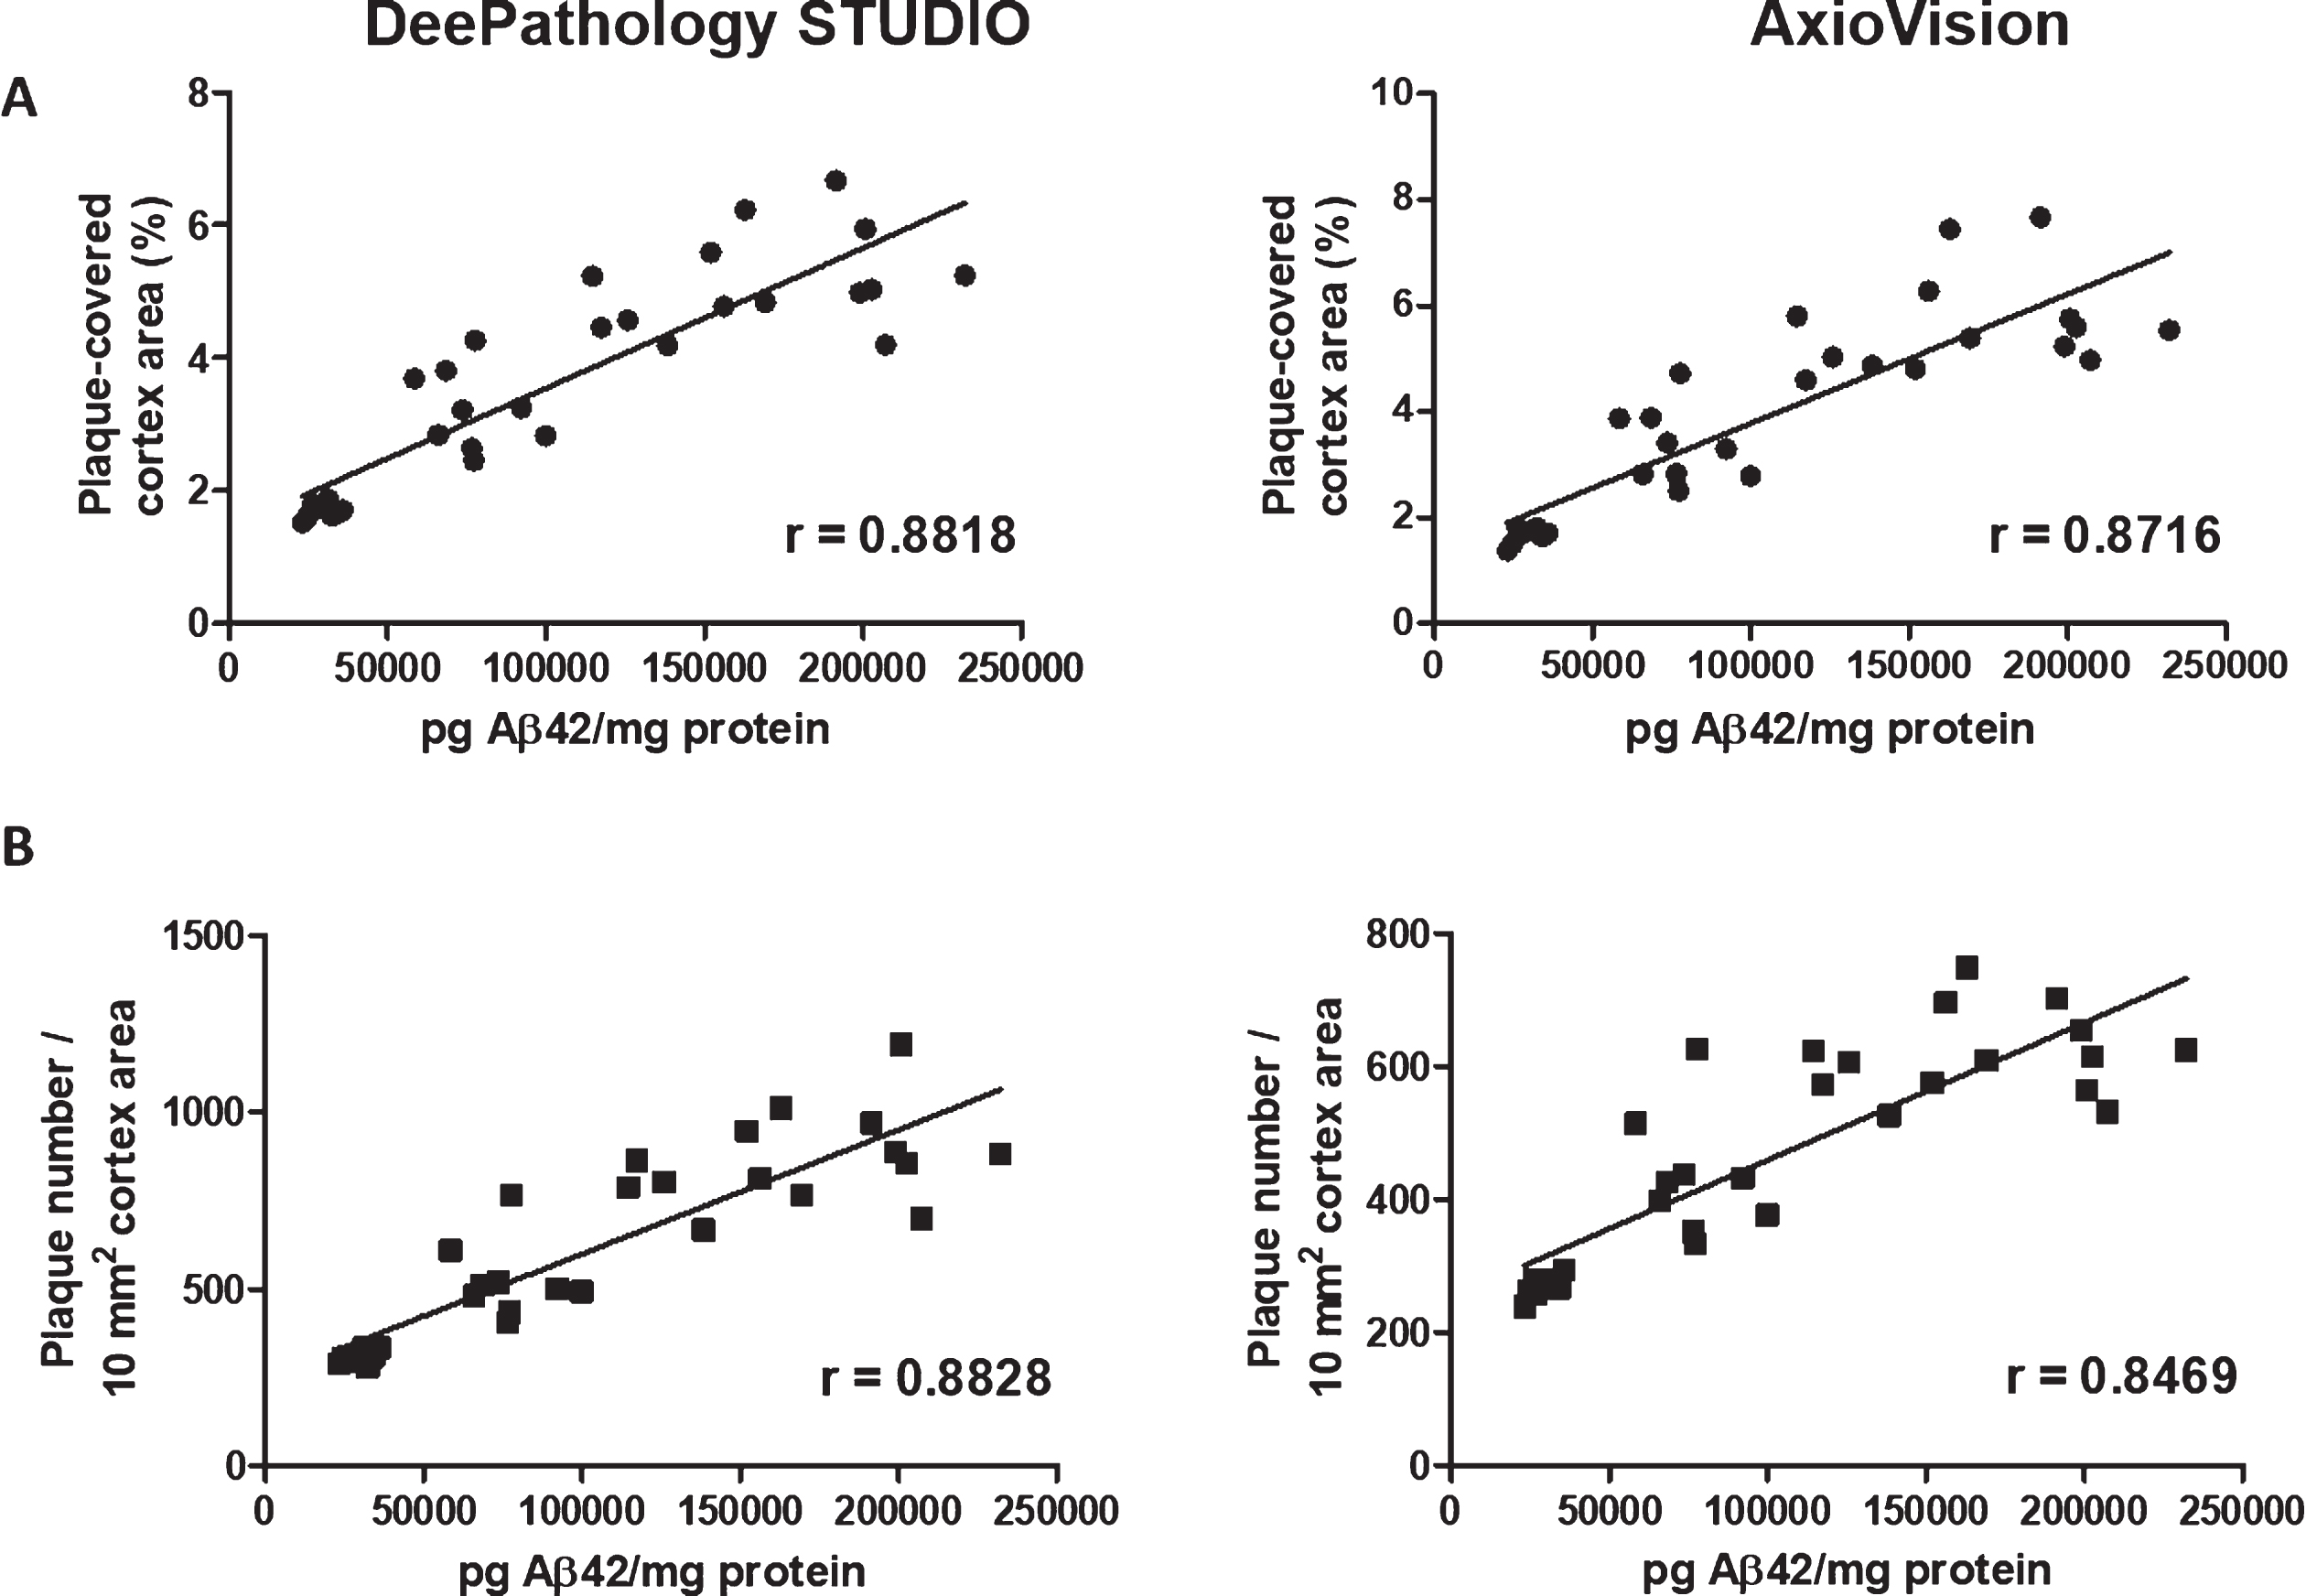
To evaluate the accuracy of each method measuring Aβ plaques, we compared the results from each method to insoluble Aβ concentration in the same animals measured by ELISA. Both analyses showed a high correlation between percentage coverage (r = 0.88 and r = 0.87, respectively) and in the number of plaques to Aβ42 concentration measured by ELISA (r = 0.88 versus r = 0.85); Fig. 5.
Fig. 5
Correlation analysis of Aβ42 concentration measured by (A) ELISA and plaque coverage and (B) plaque density calculated with DeePathology STUDIO (left) and AxioVision (right). Both analyses show similar high correlation to Aβ concentration.
Accuracy of assessing activated microglia
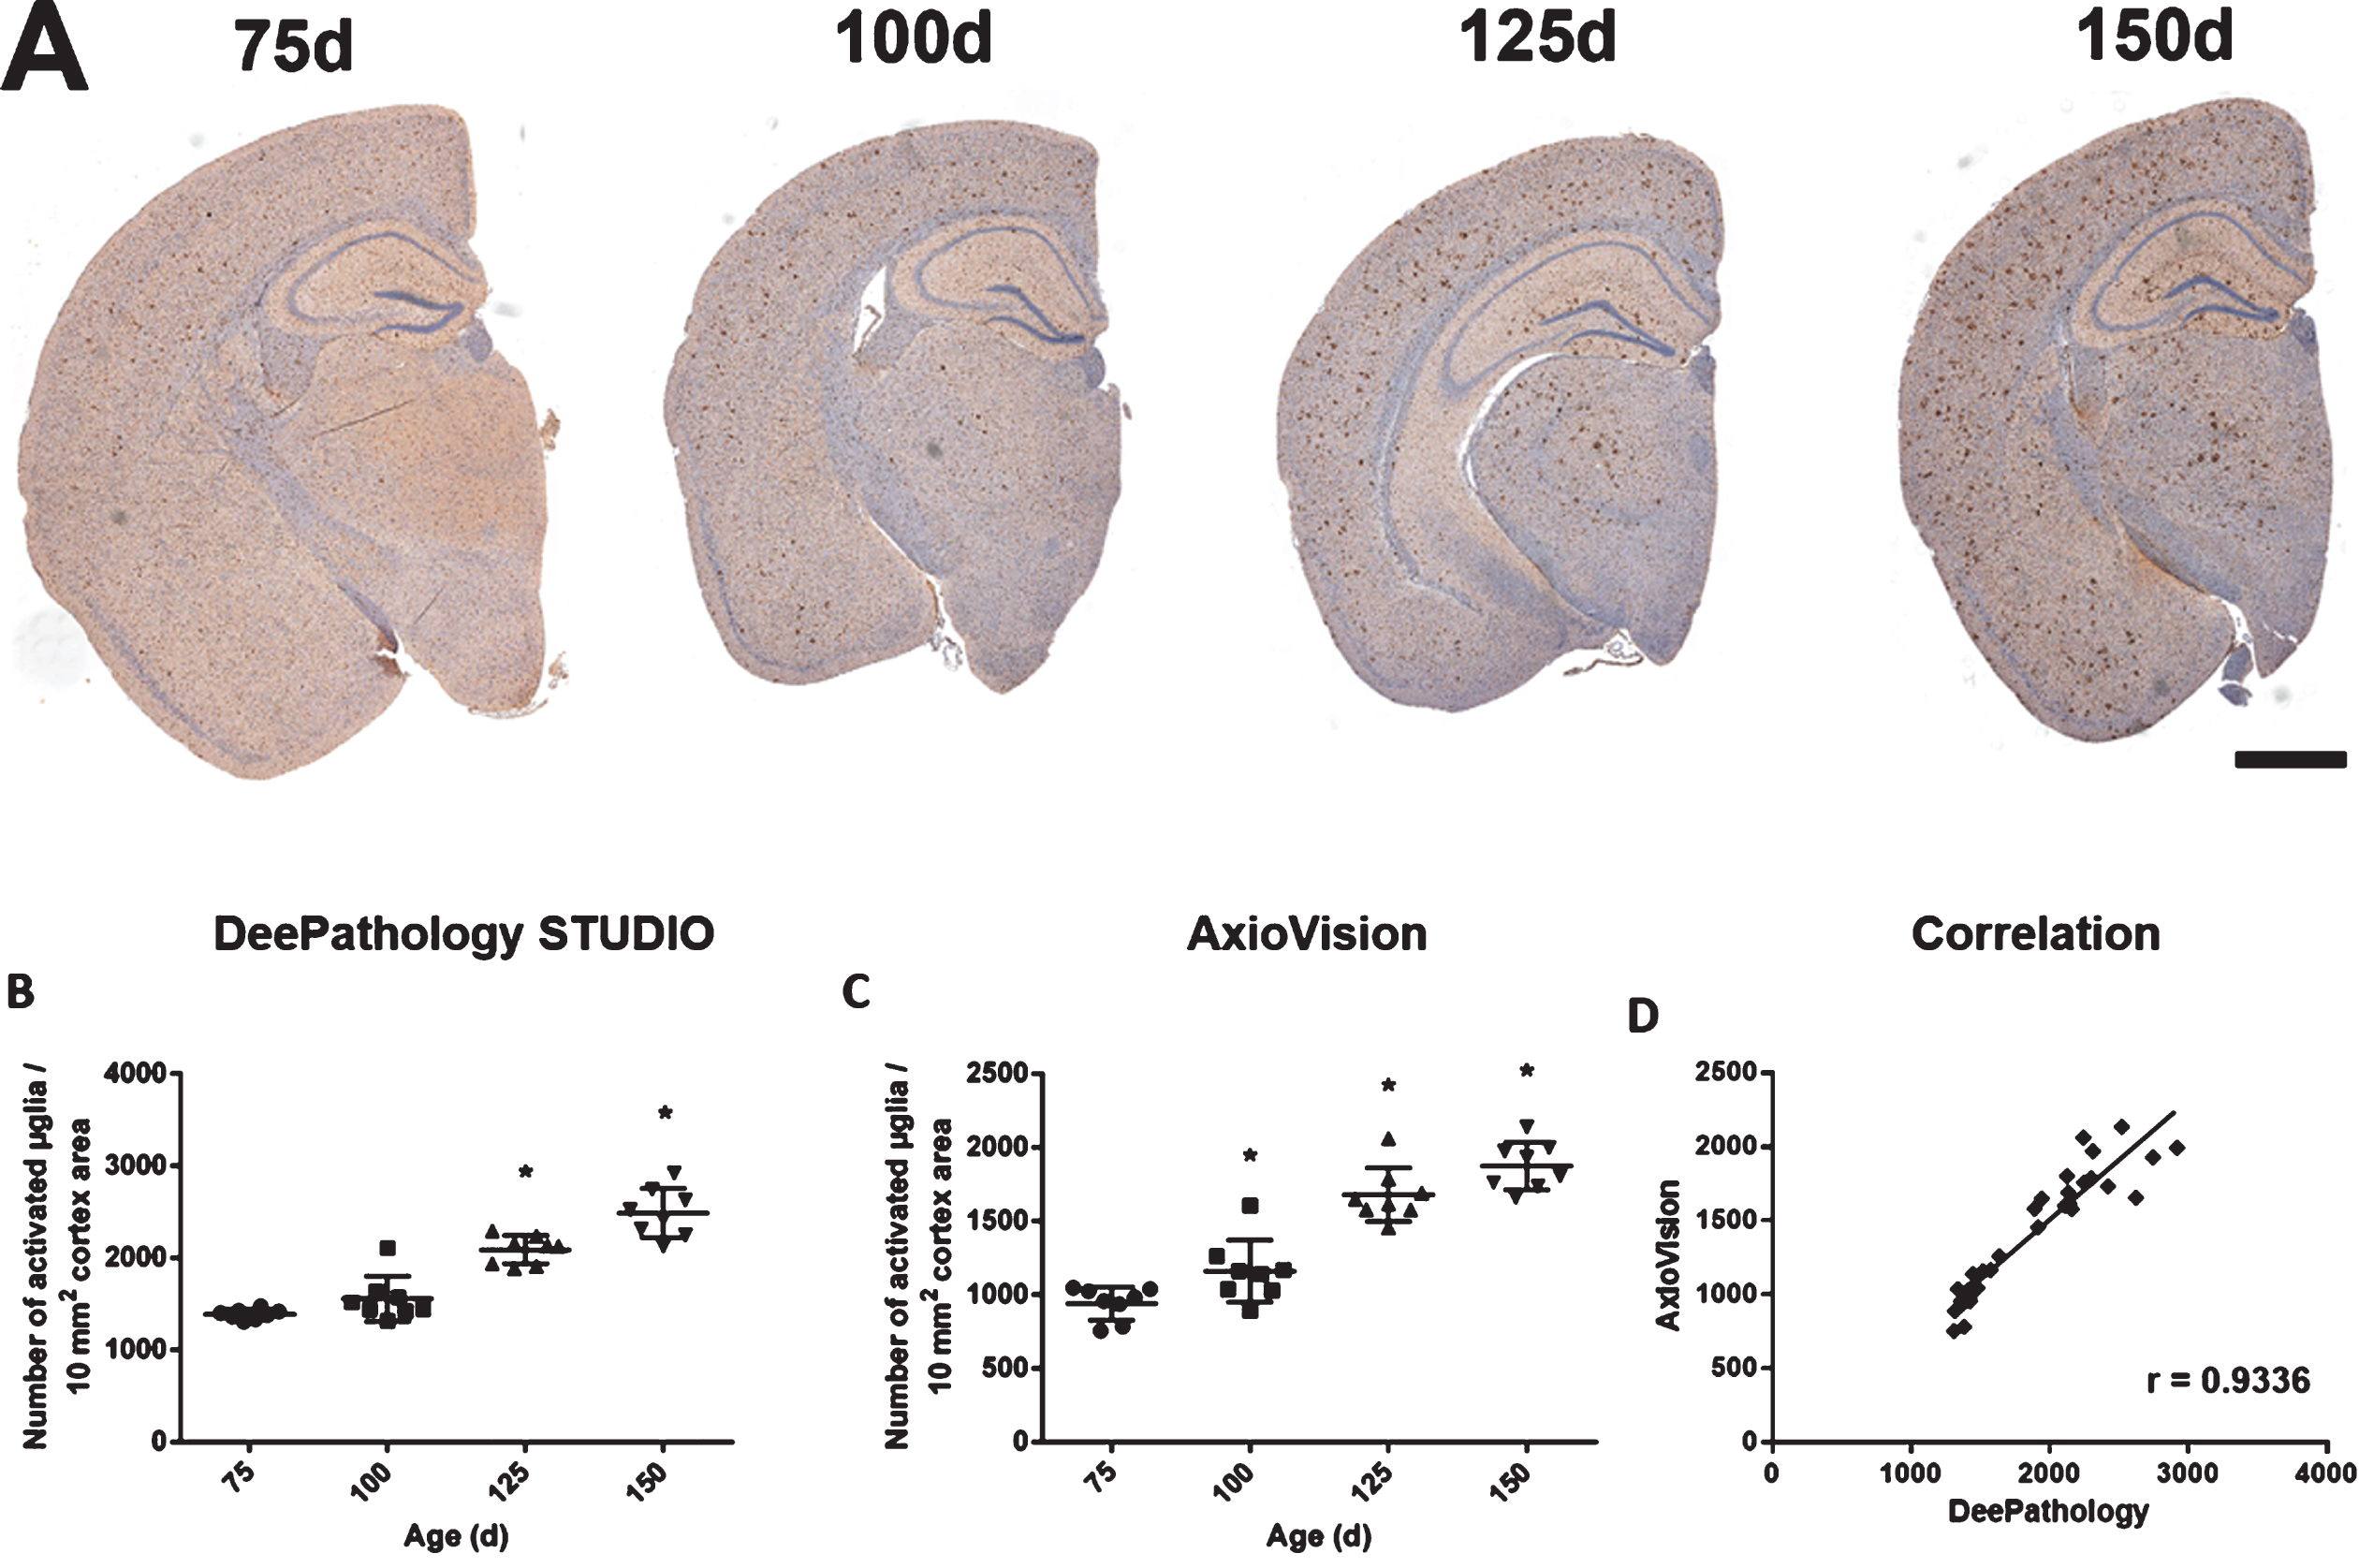
DeePathology STUDIO analysis of Iba1 immunostaining in APP mice showed an increase of activated microglia (100d: 1557±228 versus 150d: 2487±249 microglial cells/10 mm2) finding no significant differences between 75 and 100 days of age (Fig. 6). Similarly, macro semi-automatic analysis reported an increase of activated microglia (100d: 1165±217 versus 150d: 1877±194 microglial cells/10 mm2) in older APP animals. Both approaches showed high correlation in the detection of activated microglia at the different mouse ages analyzed (r = 0.93).
Fig. 6
Iba1 immunostaining analysis using DeePathology STUDIO and AxioVision. A) Representative images of Iba1 immunostaining at the different ages analyzed (75, 100, 125, and 150 days) with hematoxylin counterstaining. Dot plots show activated microglia density in cortex at different ages in APPtg mice analyzed with DeePathology STUDIO (B) and AxioVision (C). Both analyses show a high positive correlation (D). Data shown as mean±SD (*p < 0.05).
DISCUSSION
In this study, we have used two software tools—conventional macro programming and machine learning/artificial intelligence-assisted—for assessing and the quantification of morphological structures. To be able to compare the performance and accuracy, we used identical slides and two common analytical methods in Alzheimer’s disease research: immunohistochemical Aβ plaque and microglia labeling.
The analysis with AxioVision software is based on color detection to recognize the objects of interest (according to the staining used). Afterwards, it corrects the shape of the objects and needs user involvement for adjacent objects separation and false positives exclusion. After user confirmation, the software generates a file including size of the ROI, number of objects and their sizes. On the other hand, the analysis with DeePathology STUDIO uses deep learning to detect different objects in an image and distribute them according to the classification provided during the training. Our standard analysis needs user input to discard false positive detections and to divide fused objects, introducing a potential bias in the analysis. Contrarily, DeePathology STUDIO is trained before the analysis and does not need to be changed afterwards. Thus, DeePathology STUDIO analysis may be more objective as compared to macro analysis with user intervention.
ML-supported analysis demonstrated some important advantages as compared to our standard analysis with AxioVision. First, initial settings needed lower time investment in DeePathology STUDIO to train the ML algorithm recognize objects of interest compared to the preparation of macros to run in Axio-Vision. In addition, teaching interface is intuitive and user-friendly and does not require basic programming knowledge. Importantly, DeePathology STUDIO showed a significant reduction of time invested in analysis of both amyloid plaques and activated microglia, respectively, without reducing the sensitivity, as shown by the high correlation between both methods in all the variables studied. Thus, this software platform may increase the potential of analysis of a laboratory without an increase of resources employed.
Furthermore, DeePathology STUDIO offers additional analysis resources as it permits to discriminate between different types of cells/objects. We could classify amyloid plaques in dense and diffuse as packing may change during progression of AD. In fact, we found different evolution of diffuse and dense-core plaques with age in the APPtg mice. This kind of classification was so far not possible with our in-house macro analysis. Thus, the AI approach offers the possibility of a more precise analysis and additional information, enabling evaluation of more than one variable in the same image and simultaneously.
However, ML-based approaches also have some limitations. One limitation of deep learning assisted analysis is the need of a computational platform equipped with modern GPUs to facilitate the training and deployment of the ML-based solutions. In addition, the resulting analytical algorithm will be as good as the images and objects presented to the learning algorithm during the training phase. Changes in intensity or artifacts that have not been provided during the training phase will reduce the accuracy of the latter analysis. Thus, the user has to ensure that the images used for training, and the selection of structures, represent the variability expected in the experimental sample.
In conclusion, our study shows the utility of Dee-Pathology STUDIO to analyze histology images in preclinical studies to characterize disease models or evaluate treatments. Mainly, DeePathology STUDIO reduced the time needed for analysis by 90%, increasing substantially the work force of the group. It also allowed including different objects or cell types in one analysis, which is not possible with conventional methods. Using ML-assisted approaches one can generate automatic detection algorithms for tissue, objects and cells that can also be used for supporting digital pathology in routine pathological diagnostics. However, ML-assisted diagnostics needs always to be approved by a specialist in pathology if used for patient-related work and therapeutic decisions to guarantee its correctness. ML-guided slide analysis delivers diagnostic suggestions based on morphology whereas pathological reports always include a combination of multiple morphological and molecular markers (see for example the current WHO classification for brain tumors).
ACKNOWLEDGMENTS
We thank Thomas Brüning for technical support (histology) and Iván Eiriz for support with mouse housing.
The work of J.P. was supported by the following grants: Deutsche Forschungsgemeinschaft/ Germany (DFG 252102222 PA930/9, 263024513 PA930/12); Ministerium für Wirtschaft und Wissenschaft Sachsen-Anhalt/ Germany (ZS/2016/05/78617); Latvian Council of Science/ Latvia (lzp-2018/1-0275); Nasjonalforeningen (16154); HelseSØ/ Norway (2016062, 2019054, 2019055); Barnekreftforeningen (19008); EEA grant/Norges grants (TAČR TARIMAD TO100078); Norges forskningsrådet/ Norway (251290, 260786 PROP-AD, 295910 NAPI, 3xxxxx PETABC); European Commission (643417).
PROP-AD and PETABC are EU Joint Programme - Neurodegenerative Disease Research (JPND) projects. PROP-AD is supported through the following funding organizations under the aegis of JPND - www.jpnd.eu (AKA #301228 –Finland, BMBF #01ED1605 –Germany, CSO-MOH #30000-12631 –Israel, NFR #260786 –Norway, SRC #2015-06795 –Sweden).
PETABC is supported through the following funding organizations under the aegis of JPND - www.jpnd.eu (NFR –Norway, FFR –Austria, BMBF –Germany, MSMR –Czech Republic, VIAA –Latvia, ANF –France, SRC –Sweden). The projects receive funding from the European Union’s Horizon 2020 research and innovation program under grant agreement #643417 (JPco-fuND).
DeePathology STUDIO is registered trademark of DeePathology Ltd., Ra’anana, Israel. J.P. is scientific advisor for DeePathology Ltd.
Authors’ disclosures available online (https://www.j-alz.com/manuscript-disclosures/20-1120r1).
REFERENCES
[1] | Falk T , Mai D , Bensch R , Cicek O , Abdulkadir A , Marrakchi Y , Bohm A , Deubner J , Jackel Z , Seiwald K , Dovzhenko A , Tietz O , Dal Bosco C , Walsh S , Saltukoglu D , Tay TL , Prinz M , Palme K , Simons M , Diester I , Brox T , Ronneberger O ((2019) ) U-Net: Deep learning for cell counting, detection, and morphometry. Nat Methods 16: , 67–70. |
[2] | Radde R , Bolmont T , Kaeser SA , Coomaraswamy J , Lindau D , Stoltze L , Calhoun ME , Jaggi F , Wolburg H , Gengler S , Haass C , Ghetti B , Czech C , Holscher C , Mathews PM , Jucker M ((2006) ) Abeta42-driven cerebral amyloidosis in transgenic mice reveals early and robust pathology. EMBO Rep 7: , 940–946. |
[3] | Paarmann K , Prakash SR , Krohn M , Mohle L , Brackhan M , Bruning T , Eiriz I , Pahnke J ((2019) ) French maritime pine bark treatment decelerates plaque development and improves spatial memory in Alzheimer’s disease mice. Phytomedicine 57: , 39–48. |
[4] | Steffen J , Krohn M , Schwitlick C , Bruning T , Paarmann K , Pietrzik CU , Biverstal H , Jansone B , Langer O , Pahnke J ((2017) ) Expression of endogenous mouse APP modulates beta-amyloid deposition in hAPP-transgenic mice. Acta Neuropathol Commun 5: , 49. |
[5] | Hofrichter J , Krohn M , Schumacher T , Lange C , Feistel B , Walbroel B , Pahnke J ((2016) ) Sideritis spp. extracts enhance memory and learning in Alzheimer’s beta-amyloidosis mouse models and aged C57Bl/6 mice. J Alzheimers Dis 53: , 967–980. |
[6] | Frohlich C , Paarmann K , Steffen J , Stenzel J , Krohn M , Heinze HJ , Pahnke J ((2013) ) Genomic background-related activation of microglia and reduced beta-amyloidosis in a mouse model of Alzheimer’s disease. Eur J Microbiol Immunol (Bp) 3: , 21–27. |
[7] | Hofrichter J , Krohn M , Schumacher T , Lange C , Feistel B , Walbroel B , Heinze HJ , Crockett S , Sharbel TF , Pahnke J ((2013) ) Reduced Alzheimer’s disease pathology by St. John’s Wort treatment is independent of hyperforin and facilitated by ABCC1 and microglia activation in mice. Curr Alzheimer Res 10: , 1057–1069. |
[8] | Scheffler K , Krohn M , Dunkelmann T , Stenzel J , Miroux B , Ibrahim S , von Bohlen Und Halbach O , Heinze HJ , Walker LC , Gsponer JA , Pahnke J ((2012) ) Mitochondrial DNA polymorphisms specifically modify cerebral beta-amyloid proteostasis. Acta Neuropathol 124: , 199–208. |
[9] | Scheffler K , Stenzel J , Krohn M , Lange C , Hofrichter J , Schumacher T , Bruning T , Plath AS , Walker L , Pahnke J ((2011) ) Determination of spatial and temporal distribution of microglia by 230nm-high-resolution, high-throughput automated analysis reveals different amyloid plaque populations in an APP/PS1 mouse model of Alzheimer’s disease. Curr Alzheimer Res 8: , 781–788. |
[10] | Krohn M , Lange C , Hofrichter J , Scheffler K , Stenzel J , Steffen J , Schumacher T , Bruning T , Plath AS , Alfen F , Schmidt A , Winter F , Rateitschak K , Wree A , Gsponer J , Walker LC , Pahnke J ((2011) ) Cerebral amyloid-beta proteostasis is regulated by the membrane transport protein ABCC1 in mice. J Clin Invest 121: , 3924–3931. |
[11] | Steffen J , Krohn M , Paarmann K , Schwitlick C , Bruning T , Marreiros R , Muller-Schiffmann A , Korth C , Braun K , Pahnke J ((2016) ) Revisiting rodent models: Octodon degus as Alzheimer’s disease model? Acta Neuropathol Commun 4: , 91. |
[12] | Krohn M , Bracke A , Avchalumov Y , Schumacher T , Hofrichter J , Paarmann K , Frohlich C , Lange C , Bruning T , von Bohlen Und Halbach O , Pahnke J ((2015) ) Accumulation of murine amyloid-beta mimics early Alzheimer’s disease. Brain 138: , 2370–2382. |

