
Stages of Objective Memory Impairment Predict Alzheimer’s Disease Neuropathology: Comparison with the Clinical Dementia Rating Scale–Sum of Boxes
Abstract
Background:
The ultimate validation of a clinical marker for Alzheimer’s disease (AD) is its association with AD neuropathology.
Objective:
To examine how well the Stages of Objective Memory Impairment (SOMI) system predicts intermediate/high AD neuropathologic change and extent of neurofibrillary tangle (NFT) pathology defined by Braak stage, in comparison to the Clinical Dementia Rating (CDR) Scale sum of boxes (CDR-SB).
Methods:
251 well-characterized participants from the Knight ADRC clinicopathologic series were classified into SOMI stage at their last assessment prior to death using the free recall and total recall scores from the picture version of the Free and Cued Selective Reminding Test with Immediate Recall (pFCSRT + IR). Logistic regression models assessed the predictive validity of SOMI and CDR-SB for intermediate/high AD neuropathologic change. Receiver operating characteristics (ROC) analysis evaluated the discriminative validity of SOMI and CDR-SB for AD pathology. Ordinal logistic regression was used to predict Braak stage using SOMI and CDR-SB in separate and joint models.
Results:
The diagnostic accuracy of SOMI for AD diagnosis was similar to that of the CDR-SB (AUC: 85%versus 83%). In separate models, both SOMI and CDR-SB predicted Braak stage. In a joint model SOMI remained a significant predictor of Braak stage but CDR-SB did not.
Conclusion:
SOMI provides a neuropathologically validated staging system for episodic memory impairment in the AD continuum and should be useful in predicting tau positivity based on its association with Braak stage.
INTRODUCTION
Biomarker or pathological “staging” methods have been widely used in Alzheimer’s disease (AD) [1, 2]. The current research framework in the staging of AD requires the presence of in vivo evidence of amyloid and tau demonstrated by positron emission tomography (PET) imaging or by assay of cerebrospinal fluid (CSF) [1–3]. Impairment in cognitive functioning and daily activities, usually measured by the Clinical Dementia Rating (CDR) scale [4, 5], a widely used clinical staging model in the AD continuum, is not required based on the belief that biomarker changes precede clinical changes in the predementia phase of AD. The earliest of these cognitive changes in most people is an impairment of episodic memory, a hallmark cognitive deficit of AD [6].
To identify episodic memory impairment, the International Working Group recommends using the Free and Cued Selective Reminding Test (FCSRT) [7]. Unlike most other episodic memory tests, the FCSRT begins with an encoding phase in which participants identify items (e.g., grapes) in response to category cues (fruit) [8, 9]. Controlling cognition in this way assures that participants engage in the type of semantic processing that improves learning [10]. These same category cues are then used in the test phase to prompt recall of items not retrieved by free recall. Control of cognitive processing permits measurement of retrieval impairment, defined by free recall (FR), separately from storage impairment, defined by cued recall. The earliest signs of memory impairment during the onset of AD are found in FR, indicating impaired retrieval of stored memories, progressively worsening in the early prodromal stage of the AD continuum [11]. Storage remains unimpaired until the late prodromal stage when retrieval fails despite effective cued recall shown by impaired total recall (TR), the sum of FR and cued recall [12].
This ability to measure storage and retrieval impairment separately was critical to defining the five sequential stages we proposed in the breakdown of episodic memory in the predementia phase of AD [13]. The stages of objective memory impairment (SOMI) system, the focus of the current analyses, was based on extensive literature mapping of FCSRT performance to clinical outcomes and to biological markers in longitudinal aging cohorts [11, 14–21]. Change point analyses of FR and TR informed the temporal demarcation between stages and the scores that define each stage [22, 23]. Table 1 shows the SOMI system defined by FR and TR score ranges and the estimated time to clinical dementia at each of the five stages. There are multiple versions of the FCSRT. The SOMI was based on the picture version of the FCSRT that includes immediate recall in the encoding phase (pFCSRT + IR) [9]. This abbreviation avoids confusion with the word version or the version without immediate recall whose scores are not equivalent to pFCSRT + IR scores [24].
Table 1
Stages of Objective Memory Impairment (SOMI) defined by Free Recall and Total Recall score ranges and years to diagnosis
| SOMI | Free Recall Scores | Total Recall Scores | Years to diagnosis: Mean (SD) | Class of Memory Impairment |
| 0 No Memory Impairment | > 30 | > 46 | 7.05 (2.80) | None detected by pFCSRT + IR |
| 1 Subtle Retrieval Impairment | 25–30 | > 46 | 4.89 (2.48) | Free recall declines at a constant rate. Storage is preserved. |
| 2 Moderate Retrieval Impairment | 20–24 | > 46 | 4.03 (2.62) | Rate of free recall decline doubles. Executive dysfunction accelerates. Storage is preserved |
| 3 Subtle Storage Impairment | any | 45–46 | 2.09 (1.91) | Cuing fails to normalize total recall. |
| 4 Significant Storage Impairment compatible with dementia | any | 33–44 | 0.86 (1.30) | Intellectual decline accelerates heralding ADL impairment. |
SOMI was not intended to measure episodic memory impairment of moderate severity. SOMI 5 (TR≤32) was added to accommodate participants with moderate episodic memory impairment.
Confirmation of the estimates for time to diagnosis at each stage was accomplished by analyzing the SOMI scores of 142 incident AD cases from the Einstein Aging Study (EAS), tested annually for up to 10 years [13]. The dependent measure was elapsed time, defined as the difference in years between the assessment date and the date of first AD diagnosis. We used generalized estimating equations to evaluate the association of SOMI stage and predicted time to diagnosis. The first three SOMI stages (SOMI 0–2) typically precede clinical dementia by 4 to 7 years and reflect increasing retrieval difficulty, shown by declining FR in the context of intact TR. The next two SOMI stages (SOMI 3, 4) precede clinical dementia by about 2 to 3 years; in these stages cuing fails to recover the missed items despite effective cuing. These stages define the core memory phenotype of AD [7], which in SOMI begins at stage 3 when TR ≤46 (max = 48) indicating a subtle impairment in memory storage. Using this stage as the cut-point for distinguishing persons with incipient AD (n = 118) from dementia-free persons (n = 1,263), both sensitivity (93%) and specificity (93%) were excellent [13].
We acknowledge that the clinical course of AD is highly variable, influenced by concomitant neuropathologies such as vascular disease among others [6], as well as by factors such as cognitive and brain reserve [25–28]. We also acknowledge other cognitive domains are affected by AD and that memory is not always the first domain to decline [29]. Despite this heterogeneity, this simple system accounts for a substantial part of episodic memory decline in the AD continuum.
The current objective was to validate the SOMI system against AD neuropathology. This was accomplished by determining how well SOMI at the evaluation closest to death predicted the likelihood of AD neuropathology on brain autopsy as defined by current guidelines [30, 31] and by how well SOMI stages align with the stages of AD neurofibrillary tangle (NFT) pathology defined by Braak and Braak [1]. These questions were addressed through the prospective clinicopathological series from the Charles F. and Joanne Knight Alzheimer Disease Research Center (Knight ADRC) at Washington University in St. Louis [32]. Since the severity of cognitive impairment correlates with the burden of neurofibrillary tangles in AD [33], we predicted that participants classified into SOMI 3 and 4 would have a higher likelihood of AD pathology than participants classified into early SOMI 1 and 2 and would be at a more advanced Braak stage than participants in SOMI 0 who have intact storage and retrieval mechanisms.
The association of the SOMI system to AD neuropathology was compared to that of the Clinical Dementia Rating (CDR) Scale sum of boxes (CDR-SB) developed at Washington University more than 35 years ago to assess cognitive and functional decline in the AD continuum [4, 5]. The CDR-SB was selected as the comparator because it was available in the entire autopsy sample, assesses a broad range of cognitive and functional domains and is highly associated with AD neuropathology [30]. In addition, the CDR-SB is widely used in clinical trials and observational studies of dementia populations and many clinicians and researchers are intimately familiar with the scale, so it provides a comparative reference for the SOMI stages. At the Knight ADRC, CDR-SB are the basis for assigning clinical diagnoses and are disclosed to the neuropathologists. The lack of independence between CDR-SB and neuropathology could inflate their association. Thus, we hypothesized that an outcome in which the SOMI system predicted the presence of AD neuropathology as accurately as CDR-SB would be considered a successful demonstration of SOMI’s validity.
METHODS
Study sample
We used clinical, cognitive, and neuropathological data from autopsied participants who had been evaluated annually at the Knight ADRC at Washington University in St. Louis. In 2004, the pFCSRT + IR was added to the neuropsychological assessment battery. Since then, 251 autopsies have been performed in persons with pFCSRT + IR data that could be classified into SOMI stages and whose available neuropathology measures could be classified according to current guidelines [24, 25]. Written informed consent was obtained from all participants.
CDR-SB [4, 5]
The CDR-SB is a summary score of the severity of impairment from 0 (none) to 3 (severe) in each of six clinical domains: memory, orientation, judgement and problem solving, community affairs, home and hobby, and personal care. For these analyses, the CDR-SB scores were divided into four stages of severity using the following score ranges: SB 0 = 0.0; SB 1 = 0.5–3.0; SB 2 = 3.5–6.0; SB 3 = 6.5–12.0 [30].
pFCSRT + IR [9]
The test begins with an encoding phase in which participants search a card containing four line drawings (e.g., grapes) for an item that goes with a unique category cue (e.g., fruit). After all-four items are identified, immediate cued recall of just those four items is tested. The encoding phase is repeated for all 16 drawings. The test phase consists of three trials of FR each followed by cued recall for items not retrieved by FR. The sum of FR and cued recall is TR. When cued recall fails, the participant is reminded of the item by saying, “The fruit was the grapes, what was the fruit?”
FR and TR scores from the pFCSRT + IR closest to death were used to classify the cases into the appropriate SOMI stage. SOMI 5 (TR≤32) was added to the model for these analyses. As designed, SOMI was not intended to measure severe episodic memory impairment. Since 28%of participants scored below SOMI’s lowest bound (TR≥32) at their last assessment, SOMI 5 classification was added (TR < 32).
Neuropathology
Details of brain autopsy and pathological processing have been described in detail previously [34]. All cases were assigned a Braak NFT stage with revised methods that adapted tissue selection and processing and introduced robust immunohistochemistry for hyperphosphorylated tau protein using monoclonal antibody PHF-1.
One outcome was the presence of AD neuropathology defined by intermediate or high AD neuropathologic change defined by “ABC” score where A reflects Thal phase for amyloid-β plaques, B reflects Braak stage, and C indicates CERAD neuritic plaque score. A positive outcome was defined by Braak stage ≥III coupled with either Thal phase ≥3 or CERAD ≥2 [30, 31]. It should be noted that a negative outcome does not necessarily indicate a lack of pathology. The second outcome was level of NFT pathology defined by Braak stage 0-VI.
Statistical methods
We performed t-tests for continuous variables to test equivalence of means for positive and negative groups and Chi-squared tests to examine the independence of categorical variables.
Prediction of AD neuropathology
Logistic regression was used for predicting AD neuropathology using SOMI and CDR-SB stage in separate models controlling for covariates including age, sex, education, time from last test to death and APOE ɛ4 genotype [35]. Both SOMI and CDR-SB stage were implemented as ordered class variables. Receiver operating characteristic (ROC) analysis was used to evaluate the discriminative ability of SOMI and CDR-SB stage in predicting AD neuropathology and area under the curve (AUC) was used as a measure of diagnostic accuracy. The ROC curves for SOMI and CDR-SB stage were constructed using the cross-validation method with two thirds of individuals in the training data set and remaining in the testing data set. The 95%confidence intervals (CI) of each AUC were produced by the bootstrap method with 2000 replicates [36].
Prediction of Braak stage
Ordinal logistic regression (proportional odds) was used to predict the Braak stage using SOMI and CDR-SB stage in separate models and then combined in a single model [37]. Each analysis modeled the logit transformations of the ordered Braak probabilities using simultaneous linear equations sharing the same slope coefficients. The method makes the parallel regression assumption for all variables across the levels of Braak stage which was validated by the Brant test [38] before running the regression models. Details of ordinal logistic regression and the Brant test are provided in the Supplementary Material.
We first ran models including each predictor and covariates and then ran a final full model, including SOMI, CDR-SB stage and the covariates which were significant in earlier models and satisfied the Brant test. We used delta pseudo R2 to measure the incremental explanatory power of SOMI and CDR-SB stage in predicting Braak stage which is the difference of pseudo R2 between the full model and the model excluding each predictor [31]. We also conducted a Likelihood Ratio Test to examine the incremental explanatory power of each predictor [39].
RESULTS
Group comparisons
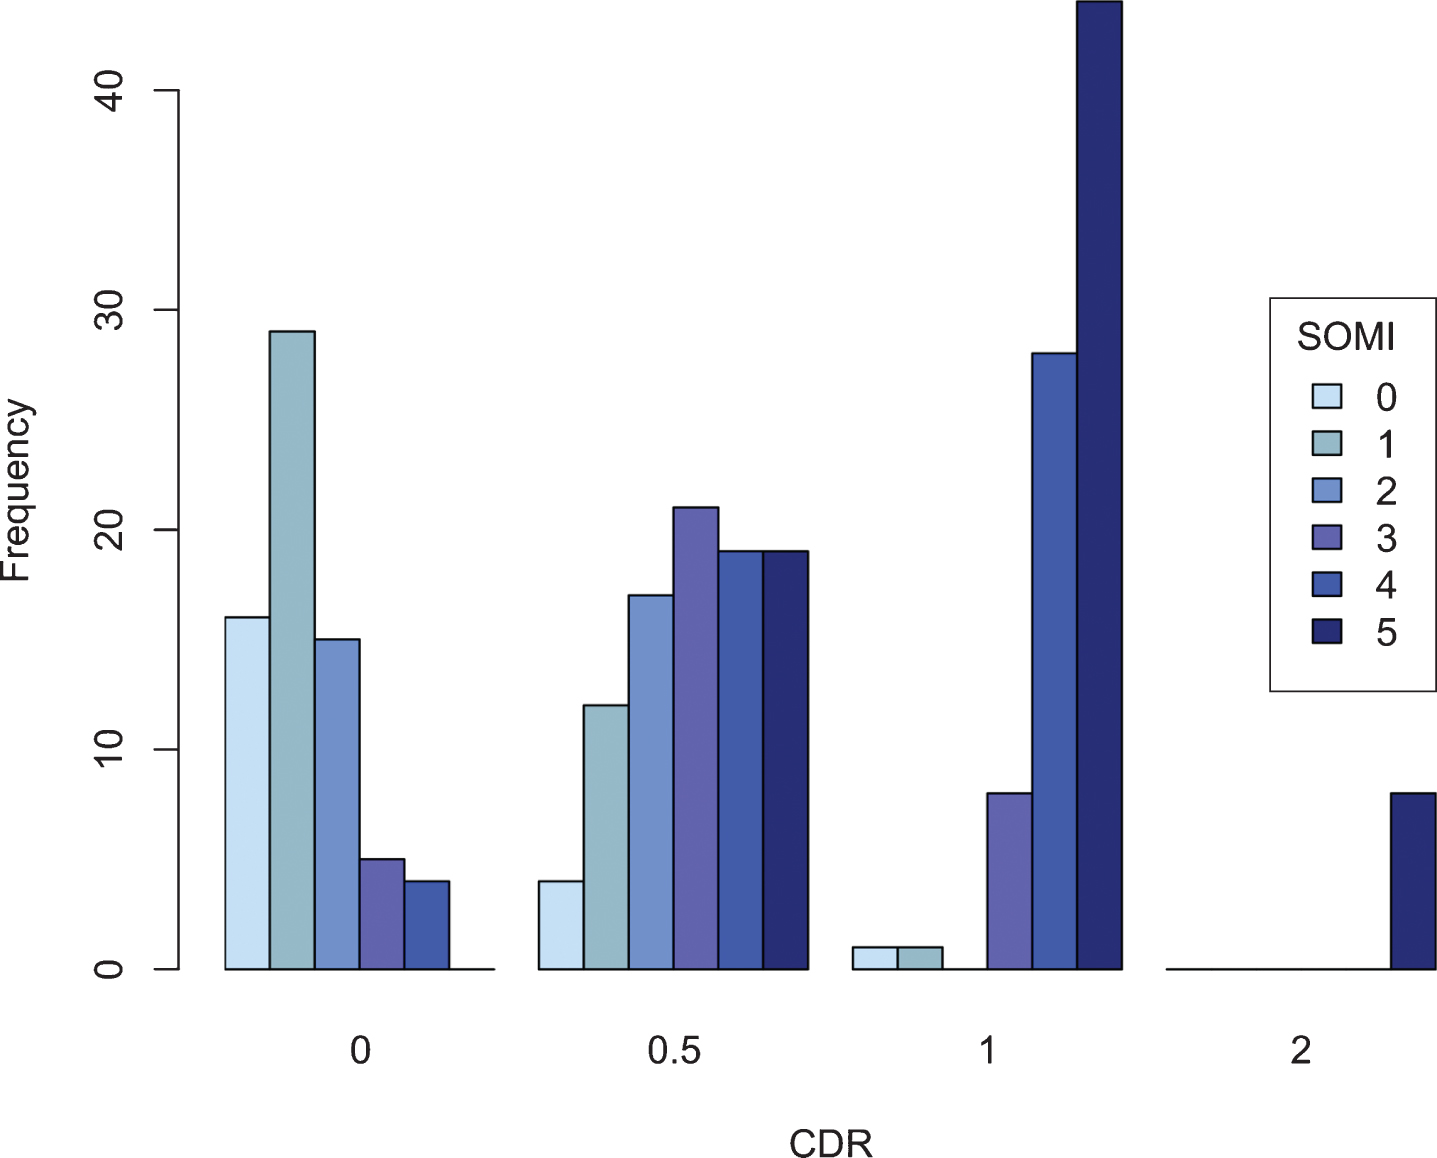
Figure 1 shows the classification of the 251 participants by CDR and SOMI stage. Of the 69 participants with a CDR score of 0, 53 (77%) had some form of storage or retrieval impairment. 88 (93%) of CDR 0.5 participants had both storage or retrieval impairments as did 81 (99%) of participants with CDR scores of 1.0. While 23%of CDR 0 participants had no memory impairment, 8%of the entire cohort had no memory impairment.
Fig. 1
Cross tabulations of SOMI by CDR.
The demographic and clinical characteristics of the sample classified by neuropathology status are summarized in Table 2. Two thirds of the cases were positive for AD neuropathology. On average, the positive and negative groups did not differ in age, percent female, or education. The time between last assessment and death was longer in the AD positive than negative group; this is due in part, to the termination of testing once the participant’s CDR score was 2, as at that point reliable collection of neuropsychological data is difficult. The proportion of cases with one or two APOE ɛ4 alleles was two times higher in the group positive for AD neuropathology; the MMSE scores were lower in the positive group, reflecting greater cognitive impairment.
Table 2
Descriptive Statistics for Individuals in the Knight ADRC Autopsy Cohort with pFCSRT + IR before Death. Mean (SD) in each group are reported for all continuous variables
| Characteristics | Negative AD neuropathology | Positive AD neuropathology | p |
| N(%) | 92 (37) | 159 (63) | |
| Age at death (y) | 87.9 (10.1) | 89.4 (9.0) | 0.2467 |
| Sex (%Female) | 47.3 | 51.9 | 0.5633 |
| Education | 15.2 (2.9) | 14.4 (2.9) | 0.0530 |
| APOE ɛ4 (%) | 20.9 | 63.6 | < 0.000 |
| Time from last test to death (y) | 2.4 (2.2) | 4.5 (2.7) | < 0.000 |
| MMSE | 27.5 (2.8) | 23.7 (4.2) | < 0.000 |
| Clinical dx (%) | |||
| Normal | 52 (57.8) | 16 (10.4) | < 0.000 |
| AD | 19 (21.1) | 116 (75.3) | |
| NonAD | 9 (10.0) | 9 (5.8) | |
| CogImp | 10 (11.1) | 13 (8.4) |
The distribution of clinical diagnoses between the two neuropathological groups differed as expected with a greater percentage of clinical AD among the positive group and a greater proportion of normal cognition in the negative group. The percentage of other clinical outcomes did not differ by group.
Do cognitive assessments at the time closest to death predict AD neuropathology?
Table 3 (Model 1) shows the results of the analysis of SOMI stage predicting positive AD neuropathology. Participants with subtle (SOMI 3) or moderate (SOMI 4) storage impairment were four times as likely to have positive AD neuropathology than participants with intact storage and retrieval (SOMI 0). Participants with severely impaired storage (SOMI 5) were 36 times as likely to have positive AD neuropathology. For each yearly increase in time between last assessment and death, the odds of AD pathology increased 1.28-fold. Participants with at least one APOE ɛ4 allele were nearly four times as likely to have positive pathology than cases without an APOE ɛ4 allele. Covariates for age, education, or sex were not significant risk factors when included in these models.
Table 3
Stage of Objective Memory Impairment (Model 1) and CDR-SB (Model 2) Predicts AD Neuropathology: Logistic Regression Models with Adjustment for Covariates
| Model 1 | Model 2 | |||||
| Estimate (SE) | OR | p | Estimate (SE) | OR | p | |
| Age 80–85a | 0.459 (0.576) | 1.582 | 0.426 | 0.370 (0.534) | 1.448 | 0.488 |
| Age 86–90 | –0.197 (0.546) | 0.821 | 0.718 | –0.117 (0.520) | 0.890 | 0.822 |
| Age > 90 | –0.166 (0.540) | 0.847 | 0.759 | 0.122 (0.507) | 1.130 | 0.810 |
| Time from last cognitive assessment to death | 0.247 (0.076) | 1.280 | 0.001 | 0.234 (0.074) | 1.264 | 0.001 |
| EDUCclass 13–15b | 0.222 (0.500) | 1.249 | 0.656 | 0.160 (0.488) | 1.174 | 0.743 |
| EDUCclass≥16 | –0.123 (0.423) | 0.884 | 0.771 | 0.029 (0.407) | 1.029 | 0.943 |
| APOE ɛ4 | 1.369 (0.389) | 3.931 | < 0.001 | 1.418 (0.376) | 4.129 | < 0.001 |
| Sexc | 0.199 (0.397) | 1.220 | 0.615 | 0.313 (0.370) | 1.368 | 0.399 |
| SOMI1 | –0.423 (0.687) | 0.655 | 0.537 | |||
| SOMI2 | 0.295 (0.686) | 1.343 | 0.667 | |||
| SOMI3 | 1.400 (0.696) | 4.055 | 0.044 | |||
| SOMI4 | 1.475 (0.656) | 4.371 | 0.025 | |||
| SOMI5 | 3.584 (0.915) | 36.017 | < 0.001 | |||
| CDR-SB1 | 1.119 (0.443) | 3.062 | 0.011 | |||
| CDR-SB2 | 2.412 (0.513) | 11.156 | < 0.001 | |||
| CDR-SB3 | 2.319 (0.625) | 10.166 | < 0.001 | |||
aAge < 80 is the reference group, bEDUCclass < 13 is the reference group, cMale is the reference group.
A similar relationship between the severity of cognitive impairment and AD neuropathology was obtained for CDR-SB stage (Table 3, Model 2). Participants classified as CDR-SB 1 were three times as likely to have positive AD pathology than participants classified as CDR-SB 0. Odds increased dramatically as cognitive severity increased. Both time to death and any APOE ɛ4 allele were significant predictors of pathology with odds ratios similar to those in the SOMI model. Once again, neither age, education nor sex were significant predictors.
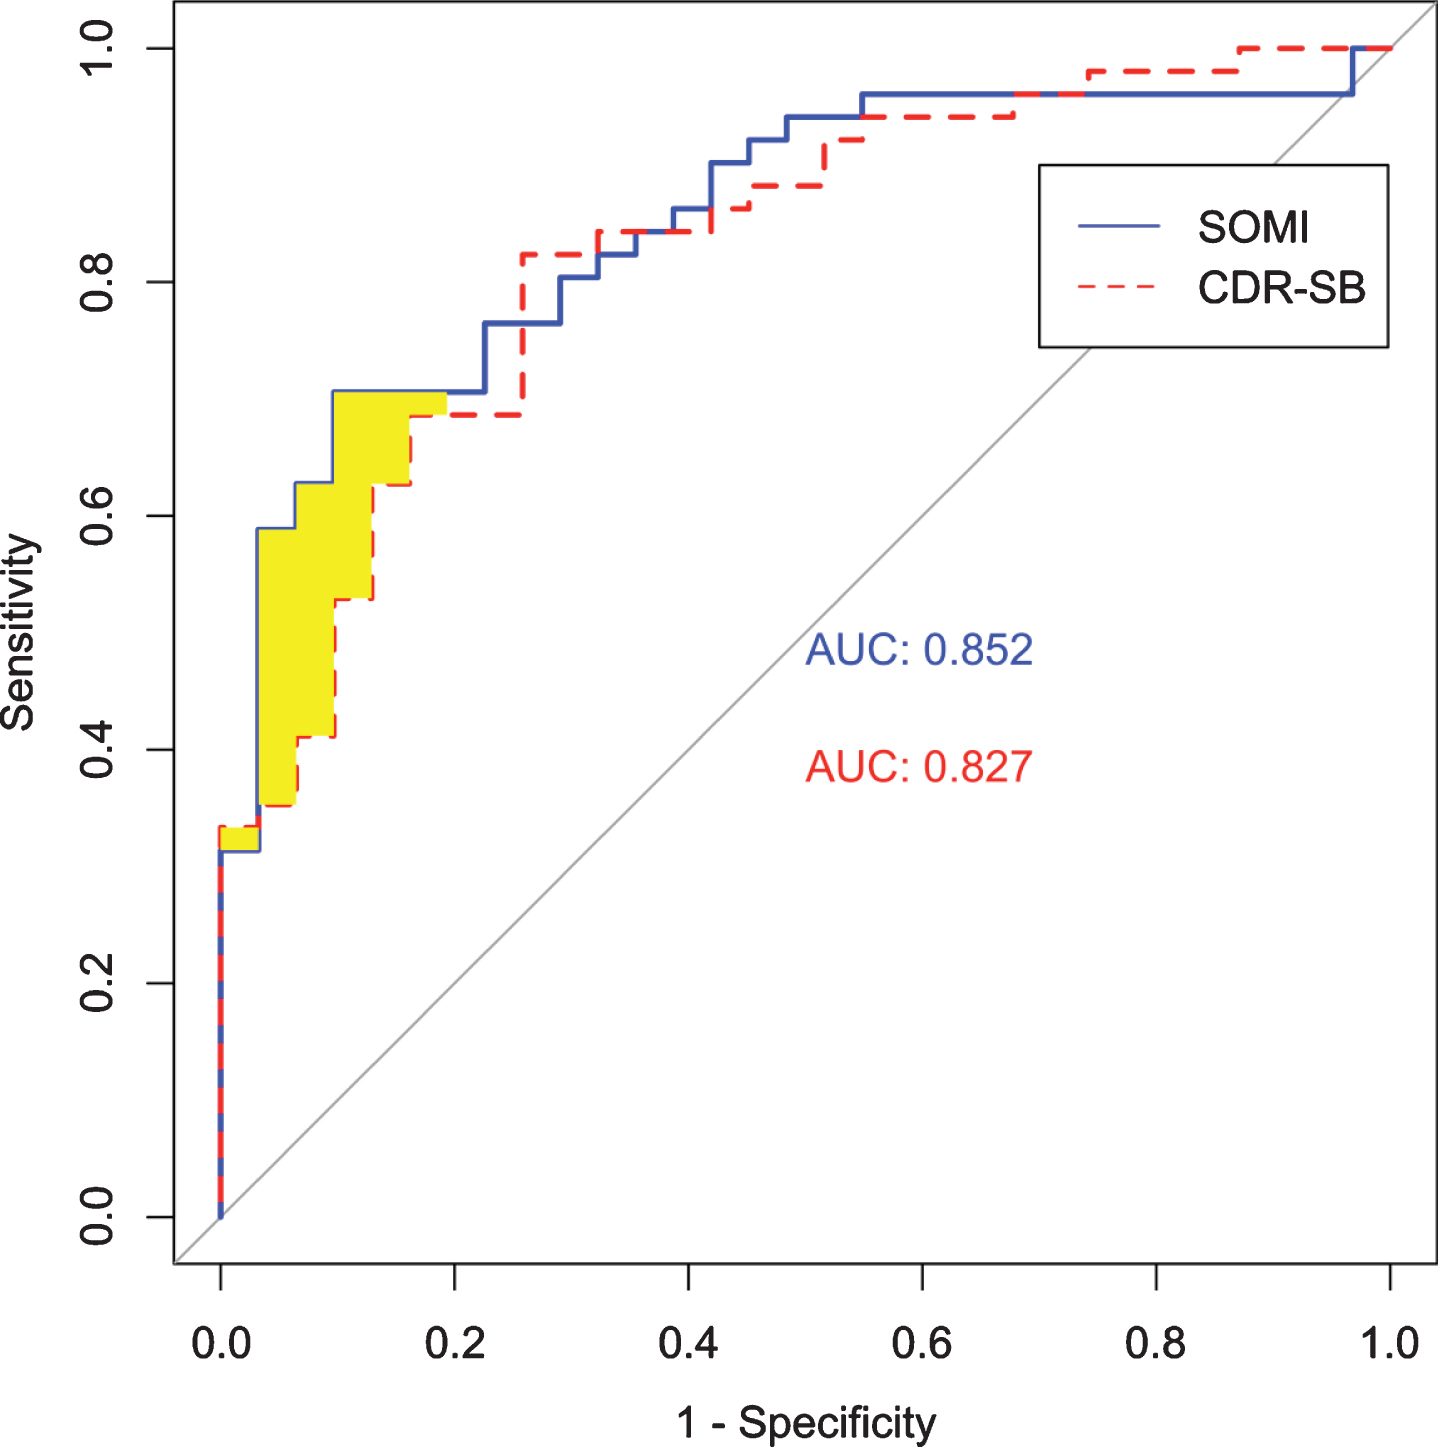
Figure 2 shows the AUC for SOMI and CDR-SB stage for discriminating between positive and negative AD neuropathology. The AUC was 85%for SOMI (95%CI: 0.769, 0.935) and 83%for CDR-SB stage (95%CI: 0.737, 0.918).
Fig. 2
ROC curves for SOMI and CDR-SB stage.
Do cognitive assessments at the time closest to death predict Braak stage?
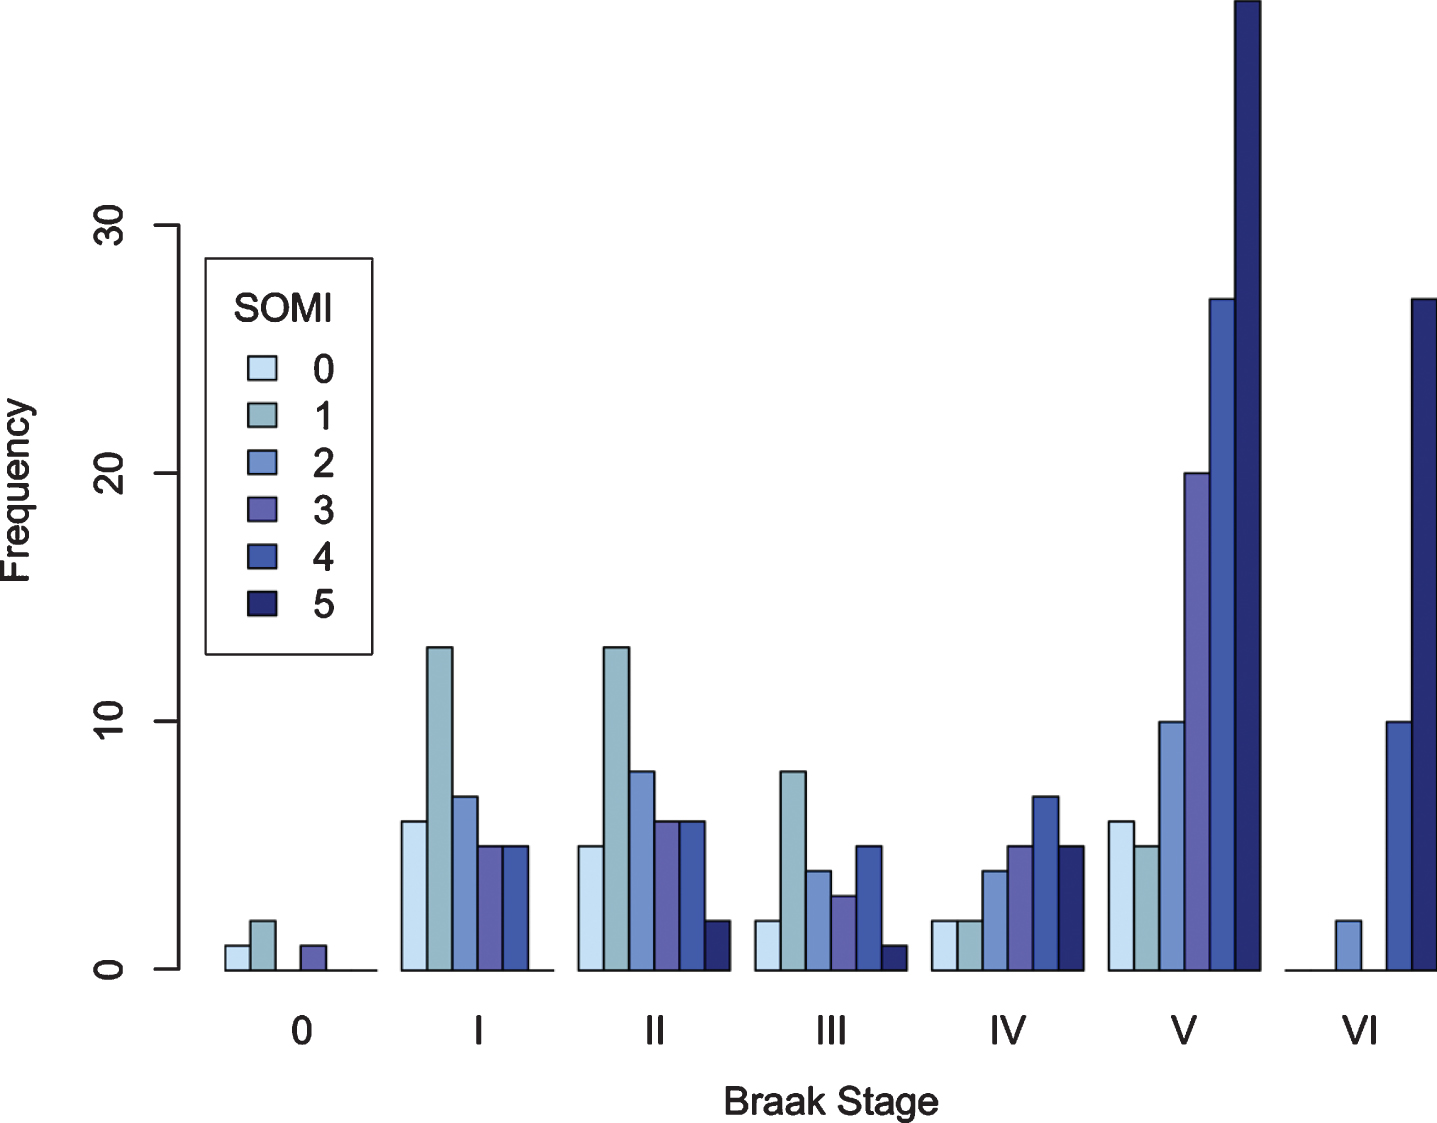
Figure 3 is a bar graph showing the number of cases at each SOMI stage by Braak NFT stage. As expected, the prevalence of storage and retrieval impairment (defined by SOMI 3 and higher stages) increased as Braak stage increased: 30%of Braak stage 0, I, II, 24%of Braak stage III, 69%of Braak stage IV, 80%of Braak stage V, and 95%of Braak stage VI cases had storage and retrieval impairment.
Fig. 3
SOMI stage as a function of Braak stage.
The ordinal logistic model using SOMI to predict Braak stage met the proportional odds assumption (Supplementary Table 1) and showed that as SOMI stage increased so did Braak stage (Table 4, Model 1). Cases with moderate storage impairment (SOMI 4) were nearly six times more likely to have higher Braak stage than cases with no memory impairment (SOMI 0). Cases with marked memory impairments (SOMI 5) were 17 times as likely to have higher Braak stage. For each yearly increase in time between last assessment and death, the odds of AD pathology increased 1.22-fold. Cases with any APOE ɛ4 allele were three times as likely to have a higher Braak stage. Covariates for age, education, and sex were not significant predictors of Braak stage.
Table 4
Ordinal Logistic Regression Results for predicting Braak stage using SOMI (Model 1) CDR-SB (Model 2) and both (Model 3) as predictors, adjusting for demographic covariates including age, time to death, education, APOE, and sex
| Model 1 | Model 2 | Model 3 | ||||||||
| Estimate (SE) | OR | p | Estimate (SE) | OR | p | Estimate (SE) | OR | p | Delta pseudo R 2 | |
| Age 80–85a | 0.135 (0.352) | 1.145 | 0.702 | |||||||
| Age 86–90 | –0.627 (0.353) | 0.534 | 0.076 | |||||||
| Age > 90 | –0.040 (0.350) | 0.961 | 0.908 | |||||||
| Time from last cognitive assessment to death | 0.198 (0.051) | 1.219 | < 0.001 | |||||||
| EDUCclass 13–15b | 0.208 (0.324) | 1.231 | 0.520 | 0.031 (0.317) | 1.031 | 0.923 | ||||
| EDUCclass≥16 | 0.219 (0.274) | 1.245 | 0.424 | 0.135 (0.267) | 1.145 | 0.614 | ||||
| APOE ɛ4 | 1.112 (0.270) | 3.040 | < 0.001 | 1.261 (0.256) | 3.529 | < 0.001 | 1.153 (0.261) | 3.168 | < 0.001 | 0.023d |
| Sexc | –0.132 (0.253) | 0.876 | 0.602 | 0.269 (0.238) | 1.309 | 0.258 | ||||
| SOMI1 | –0.229 (0.504) | 0.795 | 0.650 | –0.263 (0.486) | 0.769 | 0.588 | ||||
| SOMI2 | 0.592 (0.537) | 1.808 | 0.270 | 0.524 (0.523) | 1.689 | 0.316 | ||||
| SOMI3 | 0.980 (0.535) | 2.664 | 0.067 | 0.806 (0.539) | 2.239 | 0.135 | 0.044d | |||
| SOMI4 | 1.780 (0.515) | 5.930 | 0.001 | 1.463 (0.531) | 4.319 | 0.006 | ||||
| SOMI5 | 2.863 (0.535) | 17.514 | < 0.001 | 2.655 (0.573) | 14.225 | < 0.001 | ||||
| CDR-SB1 | 0.951 (0.316) | 2.588 | 0.003 | 0.289 (0.345) | 1.335 | 0.402 | ||||
| CDR-SB2 | 2.190 (0.341) | 8.935 | < 0.001 | 0.780 (0.406) | 2.181 | 0.055 | 0.004d | |||
| CDR-SB3 | 2.323 (0.423) | 10.206 | < 0.001 | 0.542 (0.503) | 1.719 | 0.282 | ||||
aAge < 80 is the reference group, bEDUCclass < 13 is the reference group, cMale is the reference group. dBased on the pseudo R2 value = 0.163.
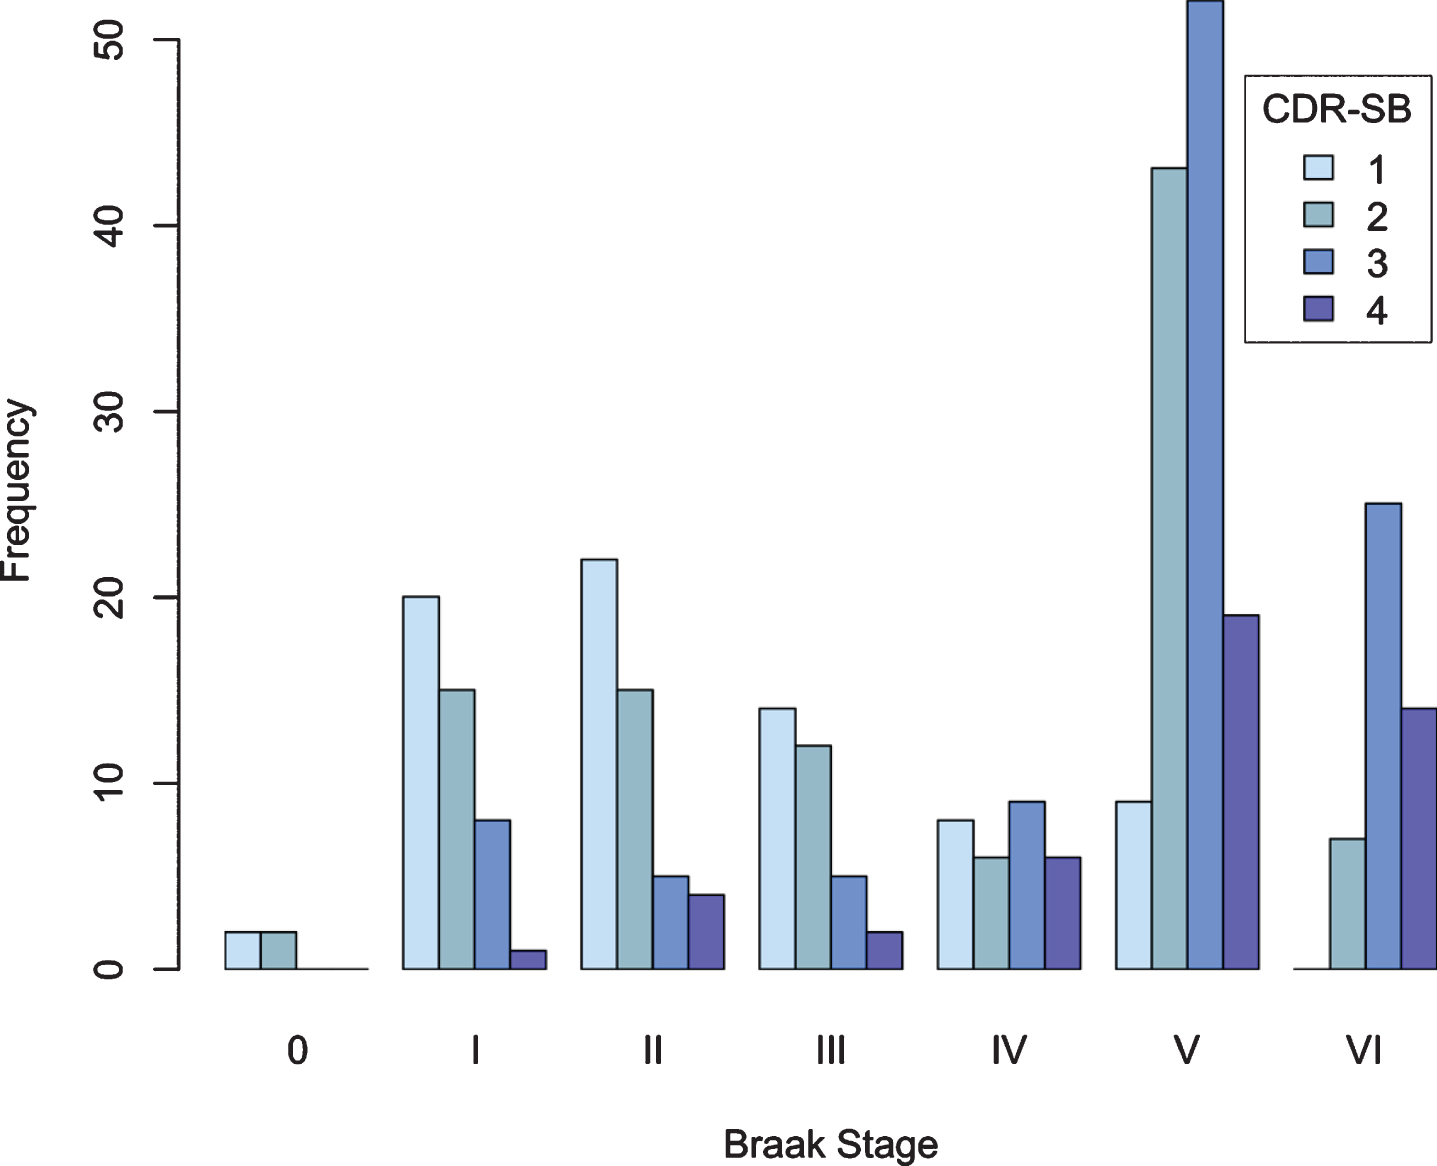
Figure 4 shows the number of cases in each CDR-SB stage at each Braak stage. Most cases with no or mild cognitive impairment (CDR-SB 0 and 1) were associated with Braak stage 0-III. At Braak stage IV, there were equal numbers of participants in each cognitive severity category. At Braak stage V and VI the majority had moderate or severe impairment (CDR-SB 2 or 3).
Fig. 4
CDR-SB stage as a function of Braak stage.
The ordinal logistic model using CDR-SB stage to predict Braak stage did not include the covariates of age and time to death because when the model included them, results violated the proportional odds assumption (Supplementary Table 1). The model without these covariates (Table 4, Model 2) demonstrated that as CDR-SB stage increased so did Braak stage. Cases with mildly impaired cognition (CDR-SB 1) were 2.6 times as likely to have higher Braak stage than cases with normal cognition (CDR-SB 0). Moderately impaired cases (CDR-SB 2) were nine times as likely to have higher Braak stage and severely impaired cases (CDR-SB 3) were ten times as likely to have higher Braak stage than cases with normal cognition. Cases with any APOE ɛ4 allele were four times as likely to have a higher Braak stage. Education and sex did not predict Braak stage.
When comparing the incremental explanatory power of CDR-SB stage and SOMI, we considered the full model with SOMI and CDR-SB stage as predictors and APOE ɛ4 allele which was a significant covariate in both models. In the full model (Table 4, Model 3) which satisfied the proportional odds assumption, the odds ratios for SOMI 4 and SOMI 5 remained significant when CDR-SB stage was included in the model whereas CDR-SB stage was not statistically significant when SOMI was included in the model. Cases with any APOE ɛ4 allele were four times as likely to have a higher Braak stage, similar to Models 1 and 2. The improvement in model fit (delta pseudo R2) was higher for SOMI (0.044) than for CDR-SB stage (0.004). According to the Likelihood Ratio Test, SOMI enhanced the explanatory power when CDR-SB stage was used (p < 0.001) but adding CDR-SB stage to SOMI did not help (p = 0.271).
DISCUSSION
Our primary objective was to validate the SOMI system against AD neuropathology using a cohort of 251 well-characterized participants from the Knight ADRC clinicopathologic series and the assessment closest to death. Validation was assessed by how well SOMI predicted intermediate/high AD neuropathologic change according to current guidelines [30, 31] and how well SOMI stages aligned with stage of NFT pathology defined by Braak and Braak [1]. The performance of SOMI in accomplishing these objectives was compared to the CDR-SB because of its association with AD neuropathology [30] and its familiarity to clinicians and researchers. For these comparisons, the CDR-SB scores were divided into four stages of increasing clinical severity [30].
As SOMI stage increased across individuals, re-flecting greater memory impairment, AD neuropathology became more likely. Participants with subtle (SOMI 3) and moderately impaired storage mechanisms (SOMI 4) were 4 times as likely, and participants with severe impairment (SOMI 5) were 36 times as likely to have positive AD neuropathology than those with intact memory (SOMI 0). The diagnostic accuracy of SOMI for distinguishing between ‘positive’ and ‘negative’ AD neuropathology was similar to that of the CDR-SB stage (85%versus 83%). As SOMI stage increased, NFT pathology increased. Compared to participants with intact memory, those with moderate storage impairment (SOMI 4) were nearly six times as likely, and those with marked memory impairment (SOMI 5) were 17 times as likely to have more advanced Braak NFT pathology. Adding CDR+SB as a predictor of Braak stage did not improve prediction.
We found that 77%of cognitively normal participants, defined by CDR = 0, had some form of memory impairment. This is not surprising given the growing number of studies documenting the presence of memory and cognitive impairment in preclinical AD [40] up to 20 years before incident MCI is diagnosed [41]. CDR ratings are based on direct participant and informant interviews and reflect a global assessment of many functional domains. The CDR-SB, in contrast, assesses the severity of impairment in each domain and therefore is more likely to be sensitive to early impairment than the global CDR.
Recent findings suggest that SOMI 2 (moderate retrieval impairment but intact storage) has very high accuracy in identifying incident AD (personal communication). In participants from the Baltimore Longitudinal Aging Study cohort free of dementia at baseline, 85 of the 1,508 participants developed clinical AD over an average of more than 8 years of follow-up. A Bayesian joint model was used to evaluate the predictive accuracy of SOMI and estimate its sensitivity and specificity at 3, 5, and 7 years from baseline using all observed assessments and the covariates of age, education, gender, race, and APOE genotype. The area under receiver operating characteristic curves demonstrated that SOMI (83%) was superior to FR (74%) and FR + TR (71%) in predicting incident AD at all prediction windows. Identifying participants at SOMI 2 at baseline had good sensitivity and specificity for predicting AD at all prediction windows. According to these results, conceptualizing the memory impairment of AD as a series of stages in the breakdown of storage and retrieval mechanisms provides a diagnostic advantage over the simple sum of FR and TR.
There is general agreement that the pre-dementia phase of AD can be broken down into the preMCI, early MCI, late MCI, and early dementia stages [11, 42]. Likewise, the breakdown of episodic memory in the pre-dementia phase can be viewed as stages in the impairment of storage and retrieval mechanisms. The breakdown begins in SOMI 1 with subtle decline in retrieval processes which worsens in SOMI 2 in the context of intact storage. In SOMI 3 impairment of storage mechanisms emerge and worsens in SOMI 4. This stage-sequential system can inform the design of secondary prevention trials. SOMI could be used as an eligibility criterion and potentially as an outcome measure. Table 1 shows the mean time to dementia diagnosis by SOMI stage ranging from seven years for SOMI 0 to two years for SOMI 3. This can help investigators align eligibility criteria with follow-up time on treatment in a clinical trial. Individuals in a particular SOMI stage at baseline could be targeted for biomarker evaluations, enriching the sample that receives costly or invasive biomarker testing for AD. In addition, since SOMI 3 is highly associated with AD neuropathology, progression to SOMI 3 could be used as a clinical outcome measure; such a study would enroll SOMI 0–2 participants meeting specified biomarker criteria. SOMI could provide an objective, fully operationalized endpoint, potentially reducing the duration of active treatment in clinical trials.
The current results are consistent with recent demonstrations of the clinicopathological association of NFT burden and the severity of cognitive impairment in AD. In one large study, 874 participants diagnosed with MCI during life were classified into four outcomes defined by clinical diagnosis proximate to death: no impairment, MCI Reverters, Stable MCI, and Dementia after MCI [43]. The progression of cognitive impairment in the groups from no impairment/MCI Reverters to Stable MCI to Dementia after MCI was associated with the spread of NFT pathology defined by Braak stage. Another recent study of 420 clinicopathological cases further delineated the association between NFT burden and trajectory of decline in global cognition defined by a composite [44]. As the NFT burden increased, the trajectory of change in global cognition further diverged from healthy cognitive aging. A lower level of global cognition at the last assessment during life was associated with higher counts of tangles (r = 0.40) at death. Global cognition was relatively stable in the absence of pathology, declining moderately 3 to 4 years before death. Episodic memory was a more sensitive indicator of AD neuropathology than global cognition in 920 cases from the same cohort [6]. Declines in episodic memory became evident approximately 16 years before death, doubling at 14 years and tripling about 12 years before death. Absent pathology, no decline in episodic memory was evident.
A limitation of the current study was the inclusion of all autopsy cases with pFCSRT + IR data without regard to the presence of additional non-AD neuropathologies. Most cases had some degree of vascular neuropathology and at least 30%of the cohort had one or more non-AD pathologies (e.g., forms of frontotemporal lobar degeneration, Lewy body pathology, hippocampal sclerosis of aging). For a given level of AD pathology, the addition of Lewy bodies or hippocampal sclerosis amplified episodic memory declines [6]. Presumably some of the cases with low FR and TR scores had other pathologies.
CONCLUSIONS
SOMI predicted intermediate/high likelihood of AD neuropathology as well as the CDR-SB stage and outperformed the CDR-SB stage in predicting Braak stages. Since the rendering of neuropathological diagnoses may have been influenced by knowledge of CDR-SB scores, the results are particularly noteworthy. They validate the International Workgroup use of FCSRT + IR to define the core clinical phenotype of AD [7, 45]. This phenotype is observed at SOMI 3, when cued recall begins to fail. It is important to remember that the SOMI system is based on the pFCSRT + IR. Thus. the FR and TR score ranges that define the SOMI stages do not apply to the other three versions of the test.
Clinical validation of the SOMI system requires that people can be classified into the prescribed stages and that these stages predict an external referent including cognitive decline, biomarkers, incident dementia, etc. Our ultimate goal is to identify at-risk individuals in clinical settings for early intervention and to ensure a consistently and accurately characterized population for secondary AD clinical trials. The use of the pFCSRT + IR in ongoing clinical trials will permit future analyses mapping of SOMI stages onto biomarker models like the AT(N) system [46]. Based on the current results, SOMI should be useful in predicting tau positivity in clinical trials.
ACKNOWLEDGMENTS
Funding provided by Healthy Aging and Senile Dementia [P01 AG03991], Alzheimer’s Disease Research Center [P30 AG066444], Adult Children Study [P01 AG026276), and Einstein Aging Study (2PO1 AG003949).
We would like to acknowledge Dr. Peter Davies’ generous gift of monoclonal antibody PHF-1 which permitted robust immunohistochemistry for hyperphosphorylated tau protein.
Authors’ disclosures available online (https://www.j-alz.com/manuscript-disclosures/20-0946r2).
SUPPLEMENTARY MATERIAL
[1] The supplementary material is available in the electronic version of this article: https://dx.doi.org/10.3233/JAD-200946
REFERENCES
[1] | Braak H , Braak E ((1991) ) Neuropathological stageing of Alzheimer-related changes. Acta Neuropathol 82: , 239–259. |
[2] | Sperling RA , Aisen PS , Beckett LA , Bennett DA , Craft S , Fagan AM , Iwatsubo T , Jack CR Jr. , Kaye J , Montine TJ , Park DC , Reiman EM , Rowe CC , Siemers E , Stern Y , Yaffe K , Carrillo MC , Thies B , Morrison-Bogorad M , Wagster MV , Phelps CH ((2011) ) Toward defining the preclinical stages of Alzheimer’s disease: Recommendations from the National Institute on Aging-Alzheimer’s Association workgroups on diagnostic guidelines for Alzheimer’s disease. Alzheimers Dement 7: , 280–292. |
[3] | Jack CR Jr. , Bennett DA , Blennow K , Carrillo MC , Dunn B , Haeberlein SB , Holtzman DM , Jagust W , Jessen F , Karlawish J , Liu E , Molinuevo JL , Montine T , Phelps C , Rankin KP , Rowe CC , Scheltens P , Siemers E , Snyder HM , Sperling R ((2018) ) NIA-AA Research Framework: Toward a biological definition of Alzheimer’s disease. Alzheimers Dement 14: , 535–562. |
[4] | Hughes CP , Berg L , Danziger WL , Coben LA , Martin RL ((1982) ) A new clinical scale for the staging of dementia. Br J Psychiatry 140: , 566–572. |
[5] | Morris JC ((1993) ) Clinical Dementia Rating: Current version and scoring rules. Neurology 43: , 2412–2414. |
[6] | Wilson RS , Yang J , Yu L , Leurgans SE , Capuano AW , Schneider JA , Bennett DA , Boyle PA ((2019) ) Postmortem neurodegenerative markers and trajectories of decline in cognitive systems. Neurology 92: , e831–e840. |
[7] | Dubois B , Feldman HH , Jacova C , DeKosky ST , Barberger-Gateau P , Cummings J , Delacourte A , Galasko D , Gauthier S , Jicha G , Meguro K , O’Brien J , Pasquier F , Robert P , Rossor M , Salloway S , Stern Y , Visser PJ , Scheltens P ((2007) ) Research criteria for the diagnosis of Alzheimer’s disease: Revising the NINCDS-ADRDA criteria. Lancet Neurol 6: , 734–746. |
[8] | Buschke H ((1984) ) Cued recall in Amnesia. J Clin Neuropsychol 6: , 433–440. |
[9] | Grober E , Buschke H ((1987) ) Genuine memory deficits in dementia. Dev Neuropsychol 3: , 13–36. |
[10] | Tulving E ((1983) ) Elements of episodic memory, Oxford University Press, New York. |
[11] | Mormino EC , Papp KV , Rentz DM , Donohue MC , Amariglio R , Quiroz YT , Chhatwal J , Marshall GA , Donovan N , Jackson J , Gatchel JR , Hanseeuw BJ , Schultz AP , Aisen PS , Johnson KA , Sperling RA ((2017) ) Early and late change on the preclinical Alzheimer’s cognitive composite in clinically normal older individuals with elevated beta-amyloid. Alzheimers Dement 13: , 1004–1012. |
[12] | Papp KV , Rentz DM , Mormino EC , Schultz AP , Amariglio RE , Quiroz Y , Johnson KA , Sperling RA ((2017) ) Cued memory decline in biomarker-defined preclinical Alzheimer disease. Neurology 88: , 1431–1438. |
[13] | Grober E , Veroff AE , Lipton RB ((2018) ) Temporal unfolding of declining episodic memory on the Free and Cued Selective Reminding Test in the predementia phase of Alzheimer’s disease: Implications for clinical trials. Alzheimers Dement (Amst) 10: , 161–171. |
[14] | Schindler SE , Jasielec MS , Weng H , Hassenstab JJ , Grober E , McCue LM , Morris JC , Holtzman DM , Xiong C , Fagan AM ((2017) ) Neuropsychological measures that detect early impairment and decline in preclinical Alzheimer disease. Neurobiol Aging 56: , 25–32. |
[15] | Di Stefano FF ((2015) ) Prediction of Alzheimer’s disease dementia: Data from the GuidAge Prevention Trial. J Alzheimers Dis 48: , 793–804. |
[16] | Auriacombe SM , Helmer CMDP , Amieva HP , Berr CP , Dubois BM , Dartigues JFMDP ((2010) ) Validity of the Free and Cued Selective Reminding Test in predicting dementia: The 3C Study. Neurology 74: , 1760–1767. |
[17] | Sarazin M , Chauvire V , Gerardin E , Colliot O , Kinkingnehun S , De Souza L , Hugonot-Diener L , Garnero L , Lehericy S , Chupin M , Dubois B ((2010) ) The amnestic syndrome of hippocampal type in Alzheimer’s Disease: An MRI study. J Alzheimers Dis 22: , 285–294. |
[18] | Quenon L , Dricot L , Woodard JL , Hanseeuw B , Gilis N , Lhommel R , Ivanoiu A ((2016) ) Prediction of Free and Cued Selective Reminding Test performance using volumetric and amyloid-based biomarkers of Alzheimer’s disease. J Int Neuropsychol Soc 22: , 991–1004. |
[19] | Philippi N , Noblet V , Duron E , Cretin B , Boully C , Wisniewski I , Seux ML , Martin-Hunyadi C , Chaussade E , Demuynck C , Kremer S , Lehericy S , Gounot D , Armspach JP , Hanon O , Blanc F ((2016) ) Exploring anterograde memory: A volumetric MRI study in patients with mild cognitive impairment. Alzheimers Res Ther 8: , 26. |
[20] | Xie J , Gabelle A , Dorey A , Garnier-Crussard A , Perret-Liaudet A , Delphin-Combe F , Bathsavanis A , Dauphinot V , Lehmann S , Mercier B , Desestret V , Roullet-Solignac I , Vighetto A , Krolak-Salmon P ((2014) ) Initial memory deficit profiles in patients with a cerebrospinal fluid Alzheimer’s disease signature. J Alzheimers Dis 41: , 1109–1116. |
[21] | Slachevsky A , Barraza P , Hornberger M , Muñoz-Neira C , Flanagan E , Henríquez F , Bravo E , Farías M , Delgado C ((2018) ) Neuroanatomical comparison of the “word” and “picture” versions of the Free and Cued Selective Reminding test in Alzheimer’s disease. J Alzheimers Dis 61: , 589–600. |
[22] | Hall CB , Ying J , Kuo L , Sliwinski M , Buschke H , Katz M , Lipton RB ((2001) ) Estimation of bivariate measurements having different change points, with application to cognitive aging. Stat Med 20: , 3695–3714. |
[23] | Grober E , Hall CB , Lipton RB , Zonderman AB , Resnick SM , Kawas C ((2008) ) Memory impairment, executive dysfunction, and intellectual decline in preclinical Alzheimer’s disease. J Int Neuropsychol Soc 14: , 266–278. |
[24] | Zimmerman ME , Katz MJ , Wang C , Burns LC , Berman RM , Derby CA , L’Italien G , Budd D , Lipton RB ((2015) ) Comparison of “word” vs. “picture” version of the Free and Cued Selective Reminding Test (FCSRT) in older adults. Alzheimers Dement (Amst) 1: , 94–100. |
[25] | Hall CB , Derby C , LeValley A , Katz MJ , Verghese J , Lipton RB ((2007) ) Education delays accelerated decline on a memory test in persons who develop dementia. Neurology 69: , 1657–1664. |
[26] | Mura T , Proust-Lima C , Jacqmin-Gadda H , Akbaraly TN , Touchon J , Dubois B , Berr C ((2014) ) Measuring cognitive change in subjects with prodromal Alzheimer’s disease. J Neurol Neurosurg Psychiatry 85: , 363–370. |
[27] | Stern Y ((2002) ) What is cognitive reserve? Theory and research application of the reserve concept. J Int Neuropsychol Soc 8: , 448–460. |
[28] | Stern Y , Arenaza-Urquijo EM , Bartrés-Faz D , Belleville S , Cantilon M , Chetelat G , Ewers M , Franzmeier N , Kempermann G , Kremen WS , Okonkwo O , Scarmeas N , Soldan A , Udeh-Momoh C , Valenzuela M , Vemuri P , Vuoksimaa E ((2020) ) Whitepaper: Defining and investigating cognitive reserve, brain reserve, and brain maintenance. Alzheimers Dement 16: , 1305–1311. |
[29] | Amieva H , Le Goff M , Millet X , Orgogozo JM , Peres K , Barberger-Gateau P , Jacqmin-Gadda H , Dartigues JF ((2008) ) Prodromal Alzheimer’s disease: Successive emergence of the clinical symptoms. Ann Neurol 64: , 492–498. |
[30] | Hyman BT , Phelps CH , Beach TG , Bigio EH , Cairns NJ , Carrillo MC , Dickson DW , Duyckaerts C , Frosch MP , Masliah E , Mirra SS , Nelson PT , Schneider JA , Thal DR , Thies B , Trojanowski JQ , Vinters HV , Montine TJ ((2012) ) National Institute on Aging–Alzheimer’s Association guidelines for the neuropathologic assessment of Alzheimer’s disease. Alzheimers Dement 8: , 1–13. |
[31] | Montine TJ , Phelps CH , Beach TG , Bigio EH , Cairns NJ , Dickson DW , Duyckaerts C , Frosch MP , Masliah E , Mirra SS , Nelson PT , Schneider JA , Thal DR , Trojanowski JQ , Vinters HV , Hyman BT ((2012) ) National Institute on Aging-Alzheimer’s Association guidelines for the neuropathologic assessment of Alzheimer’s disease: A practical approach. Acta Neuropathol 123: , 1–11. |
[32] | Hassenstab J , Monsell SE , Mock C , Roe CM , Cairns NJ , Morris JC , Kukull W ((2015) ) Neuropsychological markers of cognitive decline in persons with Alzheimer disease neuropathology. J Neuropathol Exp Neurol 74: , 1086–1092. |
[33] | Nelson PT , Alafuzoff I , Bigio EH , Bouras C , Braak H , Cairns NJ , Castellani RJ , Crain BJ , Davies P , Del Tredici K , Duyckaerts C , Frosch MP , Haroutunian V , Hof PR , Hulette CM , Hyman BT , Iwatsubo T , Jellinger KA , Jicha GA , Kovari E , Kukull WA , Leverenz JB , Love S , Mackenzie IR , Mann DM , Masliah E , McKee AC , Montine TJ , Morris JC , Schneider JA , Sonnen JA , Thal DR , Trojanowski JQ , Troncoso JC , Wisniewski T , Woltjer RL , Beach TG ((2012) ) Correlation of Alzheimer disease neuropathologic changes with cognitive status: A review of the literature. J Neuropathol Exp Neurol 71: , 362–381. |
[34] | Cairns NJ , Perrin RJ , Franklin EE , Carter D , Vincent B , Xie M , Bateman RJ , Benzinger T , Friedrichsen K , Brooks WS , Halliday GM , McLean C , Ghetti B , Morris JC ((2015) ) Neuropathologic assessment of participants in two multi-center longitudinal observational studies: The Alzheimer Disease Neuroimaging Initiative (ADNI) and the Dominantly Inherited Alzheimer Network (DIAN). Neuropathology 35: , 390–400. |
[35] | HosmerDW Jr , S L , XSR (2013) John Wiley & Sons. Applied logistic regression. |
[36] | Robin X , Turck N , Hainard A , Tiberti N , Lisacek F , Sanchez J , Muller M ((2011) ) pROC: An open source package for R and S+to analyze and compare ROC curves. BIMC Bioinformatics 12: , 1–8. |
[37] | McFadden D ((1973) ) Conditional logit analysis of qualitative choice behavior. In Frontiers in Econometrics Zarembke P, ed. Academic Press, New York, pp. 105–142. |
[38] | Brant R ((1990) ) Assessing proportionality in the proportional odds model for ordinal logistic regression. Biometrics 46: , 1171–1178. |
[39] | Christensen RHB (2015) Analysis of ordinal data with cumulative link models—estimation with the R-package ordinal. In R-pacckage version, pp. 1-31. |
[40] | Duke Han S , Nguyen CP , Stricker NH , Nation DA ((2017) ) Detectable neuropsychological differences in early preclinical Alzheimer’s disease: A meta-analysis. Neuropsychol Rev 27: , 305–325. |
[41] | Caselli RJ , Langlais BT , Dueck AC , Chen Y , Su Y , Locke DEC , Woodruff BK , Reiman EM ((2020) ) Neuropsychological decline up to 20 years before incident mild cognitive impairment. Alzheimers Dement 16: , 512–523. |
[42] | Edmonds EC , McDonald CR , Marshall A , Thomas KR , Eppig J , Weigand AJ , Delano-Wood L , Galasko DR , Salmon DP , Bondi MW ((2019) ) Early versus late MCI: Improved MCI staging using a neuropsychological approach. Alzheimers Dement 15: , 699–708. |
[43] | Abner EL , Kryscio RJ , Schmitt FA , Fardo DW , Moga DC , Ighodaro ET , Jicha GA , Yu L , Dodge HH , Xiong C , Woltjer RL , Schneider JA , Cairns NJ , Bennett DA , Nelson PT ((2017) ) Outcomes after diagnosis of mild cognitive impairment in a large autopsy series. Ann Neurol 81: , 549–559. |
[44] | Wilson RS , Capuano AW , Bennett DA , Schneider JA , Boyle PA ((2016) ) Temporal course of neurodegenerative effects on cognition in old age. Neuropsychology 30: , 591–599. |
[45] | Dubois B ((2018) ) The emergence of a new conceptual framework for Alzheimer’s disease. J Alzheimers Dis 62: , 1059–1066. |
[46] | Jack CR Jr. , Bennett DA , Blennow K , Carrillo MC , Feldman HH , Frisoni GB , Hampel H , Jagust WJ , Johnson KA , Knopman DS , Petersen RC , Scheltens P , Sperling RA , Dubois B ((2016) ) A/T/N: An unbiased descriptive classification scheme for Alzheimer disease biomarkers. Neurology 87: , 539–547. |


