
Utility of Plasma Neurofilament Light in the 1Florida Alzheimer’s Disease Research Center (ADRC)
Abstract
Background:
Plasma NfL (pNfL) levels are elevated in many neurological disorders. However, the utility of pNfL in a clinical setting has not been established.
Objective:
In a cohort of diverse older participants, we examined: 1) the association of pNfL to age, sex, Hispanic ethnicity, diagnosis, and structural and amyloid imaging biomarkers; and 2) its association to baseline and longitudinal cognitive and functional performance.
Methods:
309 subjects were classified at baseline as cognitively normal (CN) or with cognitive impairment. Most subjects had structural MRI and amyloid PET scans. The most frequent etiological diagnosis was Alzheimer’s disease (AD), but other neurological and neuropsychiatric disorders were also represented. We assessed the relationship of pNfL to cognitive and functional status, primary etiology, imaging biomarkers, and to cognitive and functional decline.
Results:
pNfL increased with age, degree of hippocampal atrophy, and amyloid load, and was higher in females among CN subjects, but was not associated with Hispanic ethnicity. Compared to CN subjects, pNfL was elevated among those with AD or FTLD, but not those with neuropsychiatric or other disorders. Hippocampal atrophy, amyloid positivity and higher pNfL levels each added unique variance in predicting greater functional impairment on the CDR-SB at baseline. Higher baseline pNfL levels also predicted greater cognitive and functional decline after accounting for hippocampal atrophy and memory scores at baseline.
Conclusion:
pNfL may have a complementary and supportive role to brain imaging and cognitive testing in a memory disorder evaluation, although its diagnostic sensitivity and specificity as a stand-alone measure is modest. In the absence of expensive neuroimaging tests, pNfL could be used for differentiating neurodegenerative disease from neuropsychiatric disorders.
INTRODUCTION
Mixed pathologies are the most common cause of cognitive impairment, although AD is the most frequent pathology occurring in 65% of cases. On neuropathological examination, AD occurs in isolation only 9% of cases [1]. The NIA-AA Research Framework classification, summarized as ATN (Amyloid, Tau, Neurodegeneration), is independent of the clinical syndrome, and provides a template for research studies to link the clinical syndrome to biomarkers of AD pathology and neurodegeneration. To that end, molecular biomarkers in both cerebrospinal fluid (CSF) and blood have been developed to measure the pathological and neurodegenerative changes in the brain associated with AD. These biomarkers in CSF and plasma include Aβ42 and Aβ40 associated with the deposition of amyloid-β plaques, and total tau (T-tau) and phosphorylated tau (P-tau), associated with neurofibrillary tangles.
Neurofilament light (NfL) is a protein that can be measured in the CSF (cNfL) and blood (pNfL). It is a marker for subcortical large-caliber axonal degeneration [2]. CSF NfL and pNfL concentrations correlate with each other and are associated with cognitive decline and increased brain atrophy, including in the hippocampus [3–6]. Plasma NfL and cNfL concentrations are elevated in many neurological disorders, including AD, frontotemporal lobe degeneration (FTLD), vascular dementia, and dementia with Lewy bodies, as compared to cognitively normal (CN) older subjects [7]. Among CN subjects and in most neurological conditions, cNfL has been shown to increase with age [7]. Compared to women, men have been shown to have elevated cNfL among CN older subjects and those with AD [7].
While pNfL has been shown to have potential use as a clinical tool, several gaps in current knowledge exist. For example, it is unknown if elevated pNfL levels distinguish between those with evidence of neurodegeneration and those with cognitive impairment resulting from depression, anxiety and other psychiatric conditions. It is also not clear whether factors such as age and Hispanic ethnicity have a bearing on the diagnostic utility of pNfL levels. The diagnostic utility of pNfL levels, relative to cognitive test performance and other biomarkers such as hippocampal atrophy and amyloid load in the brain is not known. Finally, there is insufficient research to determine whether pNfL levels provide complementary information, in the prediction of disease progression, to established predictors such as imaging measures and memory scores.
In the current study, we evaluated the utility of pNfL levels in the 1Florida Alzheimer’s Disease Research Center (1Florida ADRC), a longitudinal study of aging sponsored by NIA as one of the 32 Alzheimer’s Disease Research Centers. This cohort is bi-ethnic, with nearly equivalent numbers of Hispanic and non-Hispanic participants, including those who are cognitively normal or have various stages of mild cognitive impairment (MCI). In contrast to the Alzheimer’s Disease Neuroimaging Initiative (ADNI), there were no inclusion criteria based on functional or memory scores, and few exclusion criteria. This resulted in a cohort having a continuous spectrum of cognitive levels, including those who are CN, the entire spectrum of amnestic and non-amnestic MCI and those in an intermediate stage of impairment between CN and MCI. This intermediate stage of impairment is categorized as pre-MCI by some [8, 9] and “cognitively impaired/not MCI” by others [10]. In addition, this cohort is diverse with respect to etiology, and includes many non-AD diagnoses such as FTLD, Lewy body disease, vascular cognitive impairment, and neuropsychiatric disorders. About half of the participants in this study were recruited from a memory disorder clinic, making the results more generalizable to a clinic setting. The primary goal of the current study was to determine the utility of pNfL as a clinical tool in the evaluation of AD and related disorders, as well as in predicting the rate of cognitive and functional decline among subjects with AD.
METHODS
Participants
Participants were enrolled in the 1Florida ADRC. The focus of the 1FloridaADRC is the study of older subjects with normal cognition, MCI, and mild dementia, and those in the gap between CN and MCI. This cohort is unique due to its ethnic and cultural diversity, as over 50% identify as Hispanic and report Spanish as their primary language. In addition, subjects were assessed using novel neuropsychological test measures, and most had structural brain MRI, amyloid PET, and apolipoprotein E (APOE) genotyping. About half of this cohort has been recruited from a large outpatient memory disorder clinic and the remainder from a free memory screening program and from outreach efforts in the community.
Participants in this study completed an extensive medical, neurological, psychiatric, and neuropsychological evaluation, including all elements required by the National Alzheimer’s Coordinating Center (NACC) Uniform Data Set, version 3.0 [10]. The Clinical Dementia Rating Scale (CDR) [11] was administered by an experienced geriatric psychiatrist (MTG), who was blinded to the neuropsychological test results. The CDR Sum of Boxes (CDR-SB) score was used as a global cognitive/functional measure, since it has been shown to accurately stage the severity of AD in the spectrum from MCI to severe dementia [12]. Ethnicity of the participants was determined using self-report [13]. For the 309 participants included in this study, blood was drawn at baseline for DNA extraction for genetic studies, including APOE genotyping, and plasma biomarker studies. Two hundred and forty-four (244) participants had a 1st follow-up visit, and 164 a 2nd follow-up visit. All participants had a study partner who served as a collateral informant for the CDR. This study was approved by the Mount Sinai Medical Center IRB and was conducted in accordance with the declaration of Helsinki. All participants and their study partners provided informed consent
A neuropsychological battery was administered in the participant’s preferred language (English or Spanish) by a psychometrician who was blinded to the clinical evaluation and the CDR score. The neuropsychological protocol included items from either Version 2 or Version 3 of the Alzheimer Disease Centers’ Neuropsychological Test Battery in the Uniform Data Set (UDS), utilizing the Spanish version [10] as applicable. Additional tests were administered including the Hopkins Verbal Learning Test-Revised (HVLT-R) [14] and the Mini-Mental State Examination (MMSE) [15]. The total recall score for HVLT-R was used in this study.
Diagnostic procedures
Cognitive diagnoses followed the NACC D1 classification protocol, which specifies the diagnosis of: Cognitively Normal (CN), cognitively impaired, not MCI (CInMCI); amnestic and non-amnestic Mild Cognitive Impairment (MCI), and Dementia (DEM) [10]. Etiological diagnoses for subjects with cognitive impairment were operationalized according to NACC D1 guidelines and consolidated into categories as shown in Table 1): cognitively normal (CN); Alzheimer [16]; neuropsychiatric (primarily anxiety and depression); vascular brain injury (VBI); FTLD; and Lewy body dementia (LBD). The remaining diagnoses were consolidated into “Dx-Other”, which included less common causes of cognitive deficits, such as sleep disorder, amyloid angiopathy, chemobrain, and ruptured aneurysm.
Table 1
Demographics and Clinical Characteristics
| CN | Alzheimer | Neuro-psychiatric* | VBI | FTLD | LBD | Dx-Other** | F or Chi-Square (p) | |
| n (total = 309) | 51 | 156 | 47 | 12 | 6 | 5 | 32 | |
| Age (y) | 70.8a±5.9 | 74.8b±8.2 | 70.5a±6.7 | 74.9a±4.8 | 71.6a±4.5 | 70.7a±12.9 | 69.9a±6.9 | 4.6 (<0.0001) |
| Education (y) | 16.0±2.8 | 14.8±3.3 | 14.4±3.8 | 15.6±2.5 | 14.5±4.0 | 16.6±2.2 | 14.6±3.8 | 1.43 (0.20) |
| Sex (Female/Male) | 40 / 11 | 88 / 68 | 36 / 11 | 4 / 8 | 2 / 4 | 0 / 5 | 21 /11 | 24.8 (0.0004) |
| Race (white/black/other) | 41/2/8 | 147/5/4 | 46/0/1 | 12/0/0 | 6/0/0 | 5/0/0 | 29/3/0 | 5.9 (0.44) |
| Hispanic Ethnicity (%) | 52.9% | 60.3% | 66.0% | 83.3% | 50.0% | 20% | 56.2% | 7.2 (0.20) |
| Follow-up Visits (number) | ||||||||
| Year 2 (total = 244) | 46 | 118 | 37 | 11 | 5 | 1 | 26 | |
| Year 3 (total = 164) | 37 | 81 | 20 | 8 | 2 | 1 | 15 | - |
| CDR-SB at Baseline | 0.1a±0.3 | 2.9b±2.6 | 0.8a±0.8 | 1.9a±1.8 | 3.3b±2.6 | 3.2b±1.0 | 1.5b±2.6 | 12.5 (<0.0001) |
| CDR-SB (change) | ||||||||
| Year 1 - Year 2 | –0.04a±0.3 | –1.1b±2.1 | –0.1a±0.6 | 0.1a±0.4 | –3.2b±2.3 | –0.4a±0.9 | 6.46 (<0.0001) | |
| Year 2 - Year 3 (only shown for n≥5) | 0.0a±0.2 | –1.2b±2.2 | 0.2a±0.7 | - | 0.0a±0.6 | 5.75 (<0.0001) | ||
| MMSE Score | 29.4a±0.8 | 25.3b±4.3 | 28.1a±2.1 | 28.5a±1.7 | 26.2a±3.9 | 27.8a±2.2 | 27.5a±3.2 | 5.8 (0.02) |
| HVLT-R Total | 26.0a±4.6 | 17.03b±6.0 | 21.8b±5.0 | 21.3a±5.8 | 11.2b±9.4 | 18.2b±4.6 | 20.6b±6.2 | 17.5 (<0.0001) |
*Anxiety (n = 16), Apathy (n = 1), Bipolar (n = 1), Depression (n = 27), Lack of Motivation (n = 1), PseudoDementia (n = 1); **Other includes: Amyloid Angiopathy (n = 2), Attention Deficit Disorder (n = 1), Chemobrain (n = 1), Cognitive Impairment NOS (n = 1), Essential tremor (n = 1), Herpes Simplex Encephalitis (n = 1), Hydrocephalus (n = 1), mild behavioral impairment (n = 1), Medication (n = 1), Multifactor Etiology (n = 1), Neurodegenerative Disease (n = 5), Personality Disorder (n = 1), Ruptured MCA Aneurysm (n = 1), Schizophrenia (n = 1), Sleep Disorder (n = 5), Space Occupying Lesion (n = 2), Subjective Memory Disorder (n = 1), Unknown 5. CN, cognitively normal; VBI, vascular brain injury; FTLD, Frontotemporal lobar degeneration; LBD, Lewy Body Disease; MMSE, Mini-mental State Examination score; CDR-SB, Clinical Dementia Rating Scale Sum of Boxes; HVLT-R, Hopkins Verbal Learning Test-Revised. F values are adjusted for age, where appropriate. Means with different alphabetic superscripts are statistically significant at p = 0.05 from CN at p = 0.05 by Dunnett’s post-hoc procedure.
MR imaging
MRI scans were performed using a Siemens Skyra 3T MRI scanner at Mount Sinai Medical Center, Miami Beach. MRI scans were evaluated by visual inspection for assessment of medial temporal atrophy and classified as positive or negative for hippocampal atrophy (Hp+, Hp-) [17]. In addition, FreeSurfer Version 6.0 software was used to obtain parcellation of regional brain volumes and cortical thickness at 1.0 mm isotropic resolution (http://surfer.nmr.mgh.harvard.edu) and for co-registration with amyloid PET scans [18]. The ratio of hippocampal volume to intracranial volume was used as a continuous measure. Cerebrovascular disease on imaging was assessed using the NACC D1 binary categories for presence or absence of large vessel infarcts, lacunar infarcts, moderate white matter hyperintensities, and extensive white matter hyperintensities.
Amyloid PET imaging
Amyloid PET scans were performed using the tracer [18F] florbetaben for approximately 85% of the scans and [18F] Florbetapir for the remainder. The methodology for PET scanning has been previously described [19]. All amyloid PET scans were read initially by an independent, trained radiologist, who was not otherwise involved in the study, and a trained and experienced reader (RD), both of whom were blinded to the cognitive and clinical diagnosis, using a methodology similar to that described by Sabri et al. [20]. Images were displayed using a reader-adjustable gray scale to provide optimal discrimination of the cerebellar gray matter from white matter. A final dichotomous classification of elevated amyloid (A + versus A-) was rendered. Duara et al. [19] found high agreement between raters in reading these scans.
Quantitative assessment of PET scans was performed using a composite standard uptake value ratio (SUVR) calculated by the ratio of the mean tracer uptake from 6 cortical regions (frontal, temporal, parietal, precuneus, anterior and posterior cingulate cortex regions, each region summed from left and right hemispheres) to the whole cerebellum. A centiloid score for each participant was calculated for Florbetaben [21] and Florbetapir [22] PET scans.
APOE genotyping
All samples for APOE genotyping were performed in Dr. Nilüfer Ertekin-Taner’s laboratory (Mayo Cli-nic, Jacksonville, FL, USA); the APOE ɛ2, ɛ3, and ɛ4 alleles used predesigned TaqMan SNP Genotyping Assays for SNPs rs7412 and rs429358 (Thermo Fisher Scientific, MA, USA) on the QuantStudio 7 Flex Real-Time PCR system (Applied Biosystems, CA, USA) following the manufacturer’s protocol.
Plasma biomarker analysis (using Quanterix single molecule array –SIMOA technology)
Blood samples were drawn at the baseline visit and centrifuged to obtain plasma. Aliquots were stored at –80°C until the samples were shipped to Quanterix Corporation (113 Hartwell Avenue, Lexington, MA, USA, ) for analysis of pNfL utilizing the Simoa NF-light kit on the Quanterix Simoa HD-1 Analyzer. Concentrations of pNfL were measured, in units of pg/ml, in duplicate from each sample, that were blinded to demographic and clinical data. All samples tested were within the assay dynamic range with an average coefficient of variation of 3.9% (range from 0 to 15% for measurement.
Data analysis
All analyses were conducted using SAS version 9.4 (SAS Institute Inc., Cary, NC, USA). Plasma NfL had a skewed distribution (based on visual inspection of histograms and Kolmogorov-Smirnov statistic in the entire cohort and in the two largest subgroups, CN and AD), so a natural log transformation was applied for analyses that required normal distribution or normal residuals. Comparisons of means between diagnostic groups, for demographic and clinical variables, were performed using general linear models (GLM). Post-hoc tests were conducted using Dunnett procedure, with the CN subjects as the post-hoc control group. Differences between groups for categorical variables were evaluated using chi-square tests; post-hoc comparisons were conducted with chi-square tests (or Fisher’s exact for cell sizes less than 5) using the CN subjects as the control group and Bonferroni correction.
The relationship between demographic factors (age, sex, and Hispanic ethnicity) and pNfL was as-sessed with Pearson correlations or GLM. These relationships were assessed separately in larger etiological subgroups (i.e., CN and AD). The relationship of pNfL to binary and continuous measures of hippocampal atrophy and amyloid load was assessed using Pearson correlations.
To determine differences in pNfL between CN subjects and those in the 6 diagnostic groups, we performed a GLM, using age as a covariate, and etiological diagnosis as independent variable. The Dunnett post-hoc procedure was used to compare the CN group to all other groups. Similar analyses were done with binary and continuous variables for hippocampal atrophy and elevated brain amyloid, using GLM or Chi-Square analyses, as a way to compare their utility with pNfL for making an etiological diagnosis.
The association of pNfL to cognitive-functional status was assessed with a GLM using CDR-SB as a dependent measure, and pNfl, presence of amyloid, hippocampal atrophy, and APOE genotype as independent predictor variables. A second GLM was performed using binary and continuous measures for hippocampal atrophy and amyloid.
Diagnostic accuracy of pNfL for distinguishing CN from AD (and other etiologies with elevated pNfL) was assessed using logistic regression after controlling for age and sex. Area under the recei-ver operating characteristic (AUROC) curve was obtained and Youden’s criteria was used to determine the optimal sensitivity and specificity and cut-point.
The utility of pNfL in predicting cognitive-fun-ctional decline among subjects with cognitive impairment at baseline was assessed using CDR-SB as a repeated measure in a GLM. CDR-SB has been shown to be a good outcome measure for cognitive decline in longitudinal studies [12]. Plasma NfL, presence of amyloid, hippocampal atrophy, score on the HVLT-R, Immediate, and the number of APOE4 alleles (0, 1, 2) served as independent predictor variables, with age as a covariate. To assess the ability of pNfL to predict clinical progression, logistic regression analyses were performed to determine how pNfL and other biomarkers would predict a decline of two or more points on the CDR-SB over 2 years among subjects with cognitive impairment at baseline. A decline of 2 points was based on the typical decline in AD subjects with MCI or mild dementia [23]. All tests were 2-sided. Statistical significance was set at p < 0.05.
RESULTS
Demographics and clinical characteristics by disease etiology
Age
Compared with the CN group, only subjects in the AD group were older (Table 1). There was a difference in the distribution of sex between the 7 diagnostic groups. The percentage of females in the CN subjects (78.4%) was greater than in those with AD (57%), VBI (33%), or LBD (0%). There were no differences between the groups in education, race, or the percentage of subjects reporting Hispanic ethnicity. The CDR-SB score was higher in the AD, FTLD, Dx-Other, and LBD groups than in the CN group. Subjects in the AD group had a lower MMSE score than those in the CN group. On the HVLT-R test, the CN subjects scored significantly better than subjects in the other groups, except for the VBI group.
Association of pNfL and imaging biomarkers with age, sex, and Hispanic ethnicity
There was a positive association between pNfL and age among the CN and AD subjects (Table 2). Age and pNfL were also significantly correlated among the 29 CN subjects who were negative for elevated amyloid and hippocampal atrophy (r = 0.58; p =0.0009). Among AD subjects, pNfL and age were significantly correlated; this remained significant after controlling for CDR-SB (r = 0.42, p < 0.0001). Normalized hippocampal volume was correlated with age in both the CN and AD groups, but the dichotomous measure for hippocampal atrophy was associated with age only in the AD subjects. Amyloid measures were not correlated with age in either group of subjects (Table 2).
Table 2
Relationship between age and biomarkers in Cognitively Normal and AD Subject
| Measure | Pearson Correlation Coefficient | p |
| Cognitively Normal Subjects | ||
| pNfL*(pg/ml) (all CN, n = 51) | 0.44 | <0.0001 |
| Amyloid (n = 41) | –0.02 | NS |
| Elevated (N/Y) | ||
| Centiloids | 0.22 | NS |
| Hippocampal Atrophy (n = 45) | 0.24 | NS |
| Present (N/Y) | ||
| HV/ICV | –0.39 | 0.007 |
| Alzheimer’s Disease Subjects | ||
| pNfL*(pg/ml) (all AD, n = 156) | 0.40 | <0.0001 |
| Amyloid Positivity (n = 132) | ||
| Elevated (N/Y) | –0.08 | NS |
| Centiloids | –0.03 | NS |
| Hippocampal Atrophy (n = 151) | ||
| Present(N/Y) | 0.18 | 0.02 |
| HV/ICV | –0.35 | <0.0001 |
CN, cognitively normal; HV, hippocampal volume; ICV, intracranial volume *pNfL was log transformed for analyses in this table.
CN women had a higher pNfL level than men after adjusting for age (pNfL: 15.0±13.0 versus 11.1±4.2; F(2,48)=4.7; p = 0.03), but there were no sex differences for pNfL in any of the three largest diagnostic subgroups: AD, MD, or Dx-Other groups. There was no difference in pNfL between Hispanic and non-Hispanic subjects in either the CN, AD, neuropsychiatric, or Dx-Other diagnostic groups, adjusting for age.
Association of pNfL with imaging biomarkers (Table 3)
Table 3
Relationship between pNfL and biomarkers for Atrophy and Amyloid Load
| Measure | Pearson Correlation Coefficient | p |
| All Subjects with Cognitive Impairment | ||
| Amyloid (n = 197) | ||
| Elevated (N/Y) | 0.27 | <0.0001 |
| Centiloids | 0.18 | 0.01 |
| Hippocampal Atrophy (n = 245) | 0.32 | <0.0001 |
| Present (N/Y) | ||
| HV/ICV | –0.35 | <0.0001 |
| Cognitively Normal Subjects | ||
| Amyloid (n = 41) | ||
| Elevated (N/Y) | –0.19 | NS |
| Centiloids | 0.11 | NS |
| Hippocampal Atrophy (n = 45) | ||
| Present (N/Y) | –0.10 | NS |
| HV/ICV | 0.02 | NS |
| Alzheimer’s Disease Subjects | ||
| Amyloid Positivity (n = 132) | ||
| Elevated (N/Y) | 0.20 | NS |
| Centiloids | 0.14 | NS |
| Hippocampal Atrophy (n = 151) | ||
| Present(N/Y) | 0.04 | NS |
| HV/ICV | –0.36 | <0.0001 |
CN, cognitively normal; HV, hippocampal volume; ICV, intracranial volume *pNfL was log transformed for analyses in this table.
In the entire cohort of subjects with cognitive impairment, pNfL was associated with binary and continuous measures of amyloid and hippocampal atrophy. In the subgroup with AD, only normalized hippocampal volume was associated with pNfL, while in the CN subjects, pNfL was not associated with any of the imaging measures.
Biomarkers by etiological diagnosis (Table 4)
Table 4
Plasma NfL and other Biomarker Values by Diagnosis
| CN | Alzheimer | Neuro-psychiatric | VBI | FTLD | LBD | Dx-Other | F or Chi-Square (p) | |
| n (total = 309) | 51 | 156 | 47 | 12 | 6 | 5 | 32 | |
| Plasma NfL | ||||||||
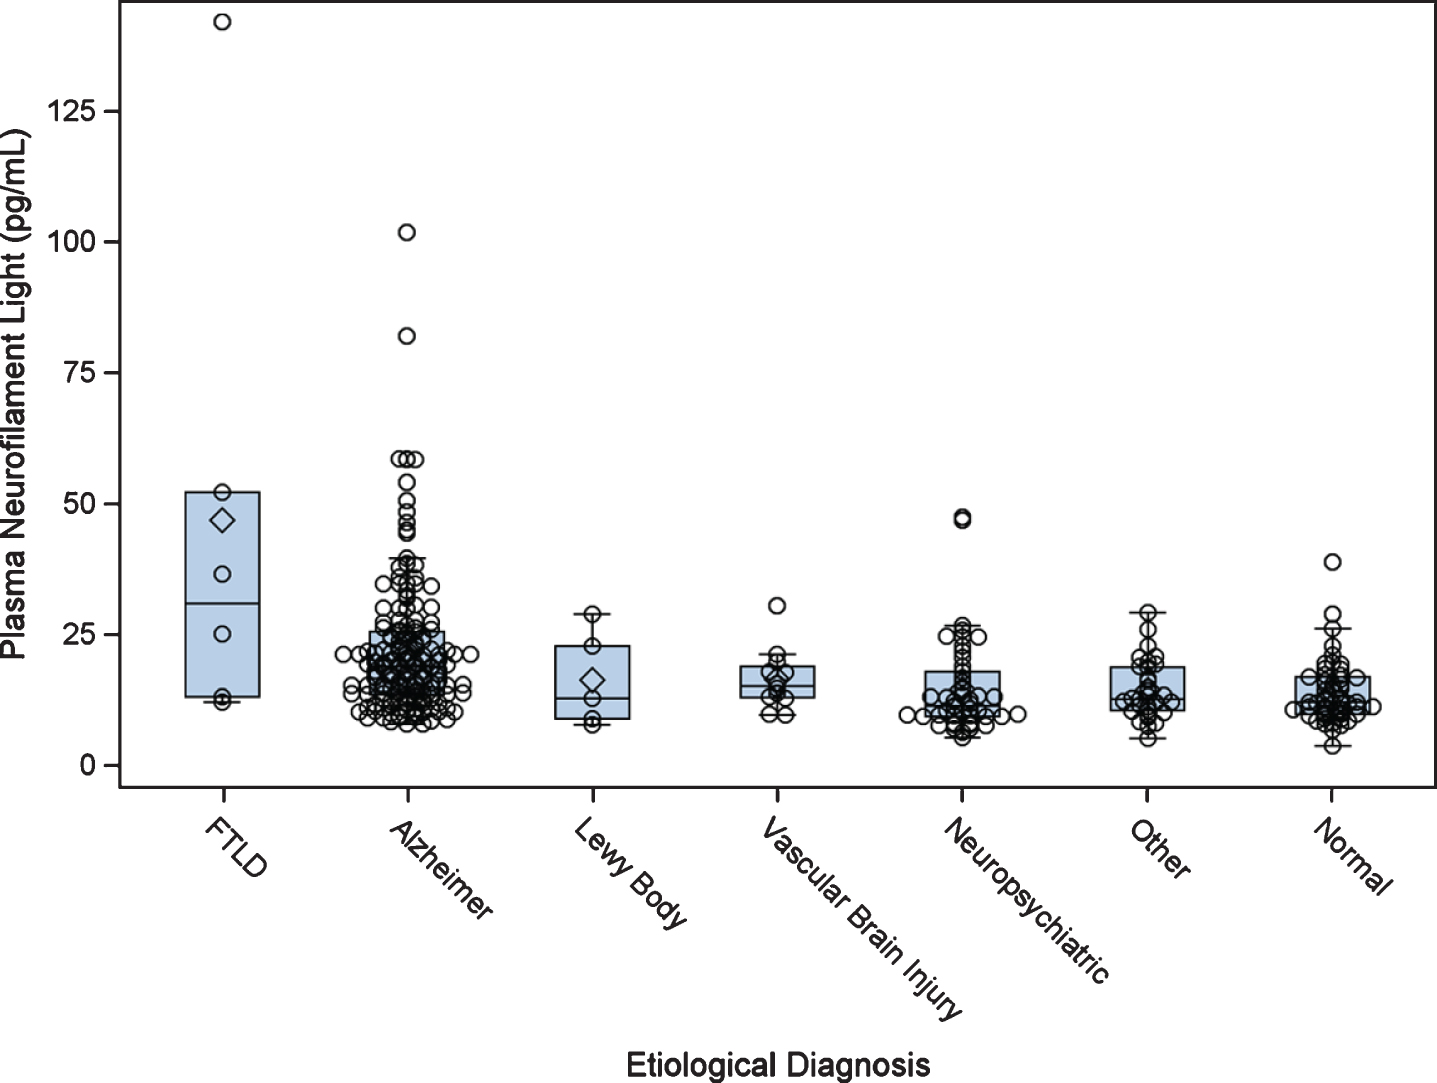
| Plasma NfL concentration (pg/ml) | 14.2a±6.1 | 21.9b±13.1 | 14.8a±9.0 | 16.1a±5.7 | 46.9b±48.8 | 16.4a±9.2 | 14.6a±5.5 | 18.6 (<0.0001) |
| Amyloid Measures | ||||||||
| Binary Read (% with visually rated Amyloid positivity/# scans) | 14.6% a / 41 | 60.9% b / 132 | 3.1% a / 32 | 22.2% a/ 9 | 0% a/ 6 | 20% a/ 5 | 0% a/ 13 | 68.9 (<0.0001) |
| Centiloid Values | 42.9a±32.5 | 82.6b±53.1 | 33.9a±20.3 | 70.3a±51.7 | 16.1a±29.1 | 29.4a±9.8 | 53.4a±43.1 | 8.09 (<0.0009) |
| Hippocampal Atrophy | ||||||||
| Binary Rating (% with Visually rated atrophy/ # scans) | 13.3% a/ 45 | 90.1% b/ 151 | 13.9% a/ 43 | 33.3% a/ 12 | 83.3% b / 6 | 40% a/ 5 | 25.0% a/ 28 | 150.6 (<0.0001) |
| Hippocampal Volume / ICV (x 10-3) | 5.2a±0.5 | 4.4b±0.7 | 5.1a±0.5 | 4.6a±0.6 | 4.4b±0.3 | 4.4b±0.5 | 4.7b±0.6 | 10.3 (<0.0001) |
| APOE Genotype | ||||||||
| APOE4 positive % / # genotyped) | 13.3% a/ 49 | 25.0% b/ 150 | 8.9% a/ 45 | 12.5% a/ 12 | 16.7% a/ 6 | 10.0% a/ 5 | 8.3% a/ 30 | 15.5 (0.02) |
CN, cognitively normal; VBI, vascular brain injury; FTLD, frontotemporal lobar degeneration; LBD, Lewy body disease F values are adjusted for age. Means with different alphabetic superscripts are statistically different from CN at p = 0.05 by Dunnett’s post-hoc procedure. Percentages with different superscripts are statistically different from CN at p = 0.05 using Bonferroni correction. pNfL was log transformed for the above analyses due to non-normal residuals. F values and post-hoc tests were adjusted for age, but means shown are un-adjusted.
pNfL
Among all subjects, after adjusting for age, pNfL was higher in the AD and FTLD groups compared to the CN group, using a post-hoc Dunnett Hsu comparison with CN as the control group (Table 4 and Fig. 1). An exploratory analysis revealed that subjects in the FTLD group had higher pNfL than those in the AD group after controlling for age (F = 9.4, df = 1; p = 0.003).
Fig. 1
Plasma neurofilament light by etiological diagnosis. Boxplots show the distribution of plasma neurofilament light by diagnostic category. FTLD, frontotemporal lobar degeneration.
Using logistic regression, pNfL was a predictive marker for differentiating CN from AD subjects (χ2 = 24.8, df = 1; p > 0.0001) with an AUROC curve of 0.798 (95% CI: 0.737–0.860). Using Youden’s procedure and high pNfL levels as test positive for AD, the optimal sensitivity/specificity was 76% /73%, demonstrating fair levels of discrimination. For the differentiation of CN from FTLD subjects, pNfL was predictive by logistic regression (χ2 = 6.7, df = 1; p = 0.01) with an AUROC curve of 0.955 (95% CI: 0.899–1.000). The optimal sensitivity/specificity was 100% /84%.
Amyloid
The frequency of positive amyloid PET was different between the groups (χ2 = 67.5, df = 6; p < 0.0001). Post-hoc comparisons with CN subjects (14.6% A+) showed that there was a higher frequency of elevated amyloid only in the AD group (60.9%). Using a continuous measure for amyloid load, i.e., centiloid units, a difference between groups was found to be present, after controlling for age, and a measure of functional severity, i.e., the CDR-SB (F(8,216)=8.76, p < 0.0001), with post-hoc Dunnett Hsu procedure showing that the AD group had higher centiloid values than the CN groups (p = 0.03) (Table 3).
Hippocampal atrophy
The presence of hippocampal atrophy (χ2 = 152.6, df = 6; p < 0.0001) was also different between the groups, with the post-hoc comparisons showing that the CN group had less atrophy than the AD group (90.1% versus 13.3%, χ2 = 102.2, df = 1; p < 0.0001) and the FTLD group (83.3% versus 13.3%, χ2 = 12.4, df = 1; p < 0.0001). Using continuous measures for hippocampal volume, there was a difference between groups after controlling for age (F(6,271)=10.3, p < 0.0001). The AD (p0 < .0001), FTLD (p = 0.03), LBD (p = 0.01), and Dx-Other (p = 0.002) groups had lower hippocampal volume compared to the CN group using a Dunnett Hsu procedure with the CN as the control group (Table 4).
APOE
The frequency of APOE4 positive subjects was different across diagnostic groups (χ2 = 15.6, df = 6; p = 0.02). Post-hoc comparisons showing that subjects in the CN group had a lower frequency of APOE4 positivity (13.3%) than those in the AD group (90.1%).
Table 5 shows the results of a GLM, with CDR-SB score at baseline as the dependent variable, age as a covariate, and pNfL concentration, binary status for both elevated amyloid and hippocampal atrophy, and the number of APOE ɛ4 alleles as independent predictor variables. In that model, all biomarker variables were significant predictors of severity of impairment, after controlling for the other variables. The total variance explained was 29.9% with pNfL in the model. When pNfL was removed from the model, the variance explained was 24.1%. When these analyses were conducted with continuous measures for amyloid load (centloid) and hippocampal atrophy (volume normalized to ICV), the model with imaging biomarkers had a R2 of 27.0%; when pNfL was added to the model, R2 increased to 33.9 and pNfL was a significant predictor of CDR-SB after controlling for other variables (F = 22.2; p < 0.0001).
Table 5
Prediction of CDR sum of boxes at baseline, using pNfL, Imaging Biomarkers, and APOE genotype
| Variable | Models with one biomarker | Model with Imaging Biomarkers | Model with all Biomarkers | ||||||
| df | Type III | F | df | Type III | F | df | Type III | F | |
| Mean | Mean | Mean | |||||||
| Square | Square | Square | |||||||
| Amyloid Status (A + versus A-) | 1,225 | 152.8 | 32.0*** | 1,224 | 97.2 | 22.5*** | 1,223 | 74.8 | 18.7*** |
| Hippocampal Atrophy (HP+versus Hp-) | 1,225 | 164.0 | 34.7*** | 1,224 | 108.4 | 25.2*** | 1,223 | 84.5 | 21.1*** |
| Plasma NfL | 1,224 | 138.2 | 28.5*** | 1,223 | 42.9 | 18.5*** | |||
| Age | 1,224 | 0.0 | 0.0 | 1,223 | 11.6 | 2.9 | |||
| APOE (# of ɛ4 alleles) | 1,224 | 7.1 | 1.6 | 1,223 | 9.1 | 2.3 | |||
| Model R2 | 14.5 (pNfL) | 24.1 | 29.9 | ||||||
| 16.5 (Hippocampal atrophy) | |||||||||
| 15.6 (Amyloid status) | |||||||||
All models include age and APOE as covariates. Only subjects will all imaging biomarkers are included in these models. *p < 0.05; **p < 0.01; **p < 0.001; A + versus A-: elevated versus not elevated amyloid; Hp + versus Hp-: positive versus negative for hippocampal atrophy.
Prediction of cognitive/functional decline: Added value of pNfL
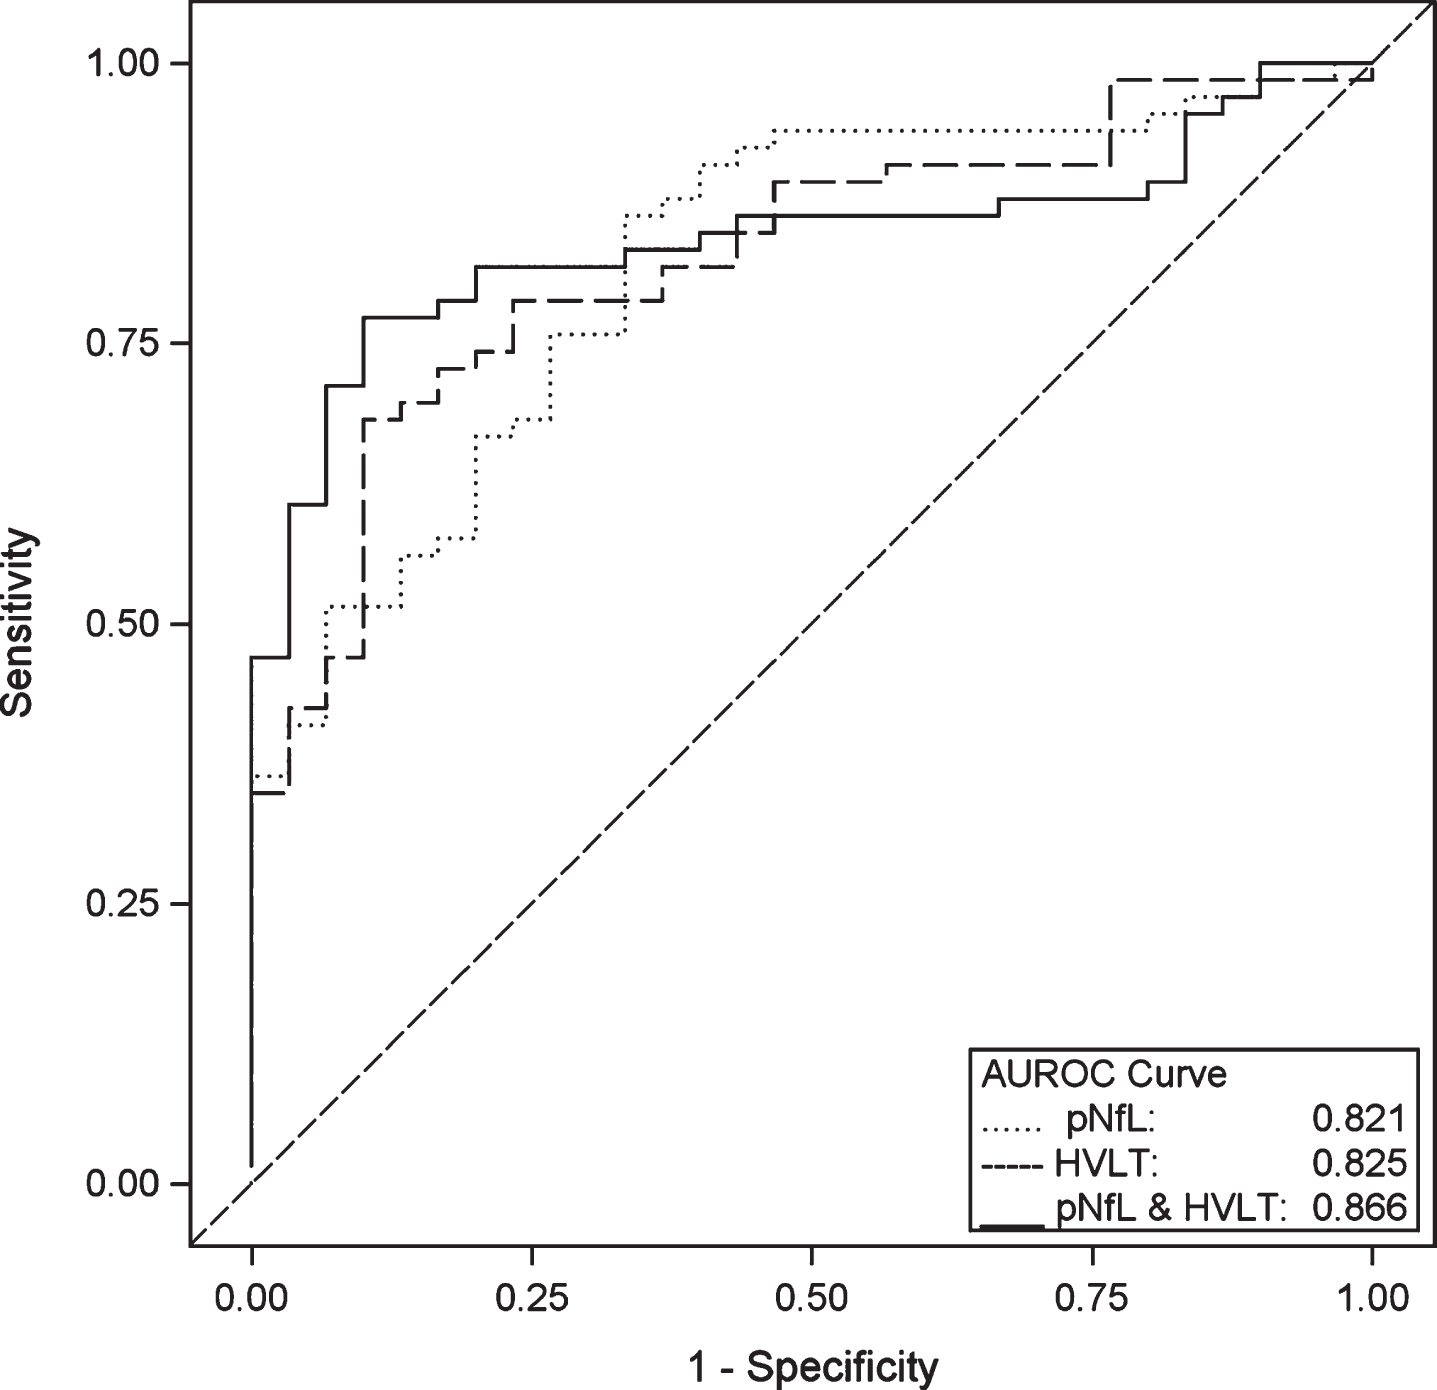
Change in the CDR-SB scores over a mean follow-up period of 2.3±0.3 years was correlated with the baseline value of all three biomarkers: amyloid status (r = –0.53, p < 0.0001), hippocampal atrophy status (r = –0.43, p < 0.0001) and log transformed pNfL (r = –0.44, p < 0.0001), as well as with the score on the HVLT-R (r = 0.58, p < 0.0001). In a repeated measures GLM among 96 cognitively impaired subjects who had at least 2 follow-up visits, score on HVLT-R and amyloid status, but not pNfL or hippocampal atrophy status, were predictors of decline on the CDR-SB from baseline to visit 2, independent of the other variables in the model, including age and APOE (Table 6). In the same group of subjects, when amyloid status was dropped from the model, HVLT-immediate and pNfL were predictive of decline, independent of the other variables. Figure 2 shows three ROC curves for the prediction of a decline of two or more points on the CDR-SB over 2 follow-up visits. In three separate models, using baseline measures of 1) pNfL, 2) HVLT-R, and 3) both pNfL and HVLT-R as predictors, the AUROC curves were 0.821 (95% CI: 0.734–0.909), 0.825 (95% CI: 0.741–0.910), and 0.866 (95% CI: 0.792–0.940). The corresponding optimal sensitivities/specificities at a minimum 80% sensitivity were 80.3% /66.6%, 80.3% /63.3%, and 80.3% /80.0%.
Table 6
Prediction of change in CDR sum of boxes from baseline value to year 2, using pNfL and imaging biomarkers in cognitively impaired subjects
| Variable | Model with pNfL, imaging biomarkers, memory score, age and APOE genotype | Model with pNfL, MRI imaging biomarker, memory score, age and APOE genotype | ||||
| df | Type III | F for interaction with time | df | Type III | F for interaction with time | |
| Mean Square | Mean Square | |||||
| Amyloid Status (A + versus A-) | 2,178 | 16.4 | 7.6** | |||
| Hippocampal Atrophy (HP+versus Hp-) | 2,178 | 3.8 | 1.8 | 2,178 | 5.4 | 2.3 |
| Plasma NfL | 2,178 | 4.4 | 2.0 | 2,178 | 8.7 | 3.8* |
| Age | 2,178 | 2.4 | 1.1 | 2,178 | 2.7 | 1.2 |
| APOE (# of ɛ4 alleles) | 2,178 | 4.2 | 1.9 | 2,178 | 2.7 | 1.2 |
| HVLT-R | 2,178 | 19.9 | 9.2*** | 2,178 | 32.4 | 14.0*** |
*p < 0.05; **p < 0.01; ***p < 0.001. Only subjects with all imaging biomarkers are included in these models. A + versus A-: elevated versus not elevated amyloid; Hp + versus Hp-: positive versus negative for hippocampal atrophy; HVLT-R, Hopkins Verbal Learning Test-Revised.
Fig. 2
ROC Curves for Prediction of Decline on the CDR. Area under the receiver operating characteristic (AUROC) curve for prediction of a decline of 2 or more points on the CDR sum of boxes in cognitively impaired subjects over 2 follow-up visits (an average of 2.3 years), using baseline measures of Hopkins Verbal Learning Test-Revised (HVLT-R) total recall, plasma neurofilament Light (pNfL) and the combination of both HVLT-R and pNfL. The logistic regression models were adjusted for age and APOE ɛ4 genotype.
DISCUSSION
Within the ethnically diverse 1Florida ADRC co-hort, we investigated the relationship between pNfL and both demographic and clinical characteristics. Consistent with prior research, we found that pNfL increases with age, amyloid load, and hippocampal atrophy, and is elevated in those with neurodegenerative diseases including AD and FTLD (Tables 2–4). In our cohort, pNfL was not related to Hispanic ethnicity and was related to sex only in CN subjects, where women had higher levels. We also showed that pNfL may have a complementary and supportive role to brain imaging and cognitive testing in a memory disorder evaluation, although its diagnostic sensitivity and specificity appears to be modest as a stand-alone measure.
The association of pNfL with Hispanic ethnicity was explored because we have found differences between older Hispanic and non-Hispanic adults in the Miami area on other biological measures. For example, it was found that the association of APOE ɛ4 allele to amyloid load was weaker in Hispanics as compared to non-Hispanic whites [19]. We also showed that the APOE dose effect on risk for AD may be greater in non-Hispanics compared to Hispanics [24]. In the current study, we found no effect of Hispanic ethnicity on pNfL in the entire 1Florida ADRC cohort or any diagnostic subgroup.
Increased age was associated with greater pNfL in cognitively normal subjects, a finding that remained even among those normal subjects without AD pathology on brain imaging. Among AD subjects, there was also an age-related increase in pNfL (Table 2). A recent meta-analysis showed that CSF NfL increased with age in CN subjects and in many neurological conditions, including AD [7]. The findings in this study also suggest that the association between age and biomarkers may be greater for NfL than for MRI and amyloid PET biomarkers. As a result of age-related increases in pNfL and cNfL across CN and AD subjects, reference ranges for NfL may have to be age-specific for clinical use. In addition, CN subjects with elevated NfL may score lower on cognitive tests, which could have an effect on the calculation of cutoffs for normative data for neuropsychological tests [6]. It has also been suggested that better normative data could be obtained by excluding “cognitively normal” subjects with elevated amyloid [25]. We found that CN women had higher pNfL than men, contrary to a recent meta-analysis which found higher CSF NfL for men than women in both CN and AD subjects [7]. The role of sex in NfL should be further studied.
Consistent with other studies, pNfL was associated with level of cognitive and functional impairment as measured with CDR-SB [5]. Additionally, in this study we showed that impairment was associated with pNfL after controlling for imaging biomarkers, which themselves are predictive measures of severity of impairment (Table 5). This implies that the pathology associated with pNfL is additive to that associated with neurodegeneration measured on MRI and amyloid measured on PET, in regards to its effect on global cognition and function. The combination of reduced Aβ42 and elevated pNfL in plasma was shown to be a strong risk factor for subsequent AD and all-cause dementia [26] in a large epidemiological study of non-demented subjects. Using the ATN framework, subjects with combined biomarkers have been shown to be more cognitively impaired and at greater risk for cognitive decline, using imaging and blood-based biomarkers [27, 28]. However, there are no studies directly showing that subjects with elevated pNfL have additional risk for cognitive/functional impairment in the presence of both hippocampal atrophy and elevated amyloid. A neuropathology study showed that NfL may influence cognition through a non-AD pathway, namely, cerebral atherosclerosis [28]. An initial estimate of the utility of pNfL as a stand-alone measure was obtained by computing its ability to discriminate CN subjects from those subjects with a diagnosis of AD. The AUROC was 0.80 with a modest sensitivity/specificity of 75% /73%. This is consistent with an AUROC for ADNI of 0.79 for pNfL differentiating between CN and AD dementia [5].
Compared to cognitively normal control subjects, in this study, pNfL was elevated to the greatest degree in those with FTLD and to a lesser extent in those diagnosed with AD (Table 4), but not among those with cognitive impairment attributed to neuropsychiatric disorders, such as anxiety and depression, VBI, LBD, or a miscellaneous category, Dx-Other. Elevated NfL among subjects with FTLD and AD has been shown previously, as has increased NfL among subjects with many other neurological conditions, including vascular brain injury and LBD [7]. It should be noted however, that the sample sizes in this cohort may have been too small to find an effect for those subjects in this study.
Among subjects with cognitive impairment, baseline pNfL, elevated amyloid, hippocampal atrophy, and score on a memory test (HVLT-R) were correlated with cognitive and functional decline as measured by the CDR-SB over a 2.3-year period. However, in a model with all biomarkers and memory score as predictors, only amyloid status and memory score independently added to the prediction of decline. Since amyloid PET is rarely available outside of a research setting, another model without amyloid status was performed; in that model, both pNfL and memory score were independent predictors of decline, but hippocampal atrophy was not (Table 6). This underscores the well-known role of memory testing in clinical evaluation and the potential role of pNfL as an adjunct to imaging and to the ATN framework. In the ATN framework for a biological definition of AD, the “N” stands for neurodegeneration or neuronal injury [29]. The “N” is usually measured with structural MRI, FDG PET, or total tau levels in CSF. These measures, like NfL, are not specific for AD, but are used to stage disease severity and prediction of cognitive decline. Using those standards, the current study and prior investigations [3, 5] support a role for NfL in the ATN classification. Other pathways outside the ATN framework which influence cognitive decline include cerebrovascular disease [30], limbic-predominant age-related TDP-43 encephalopathy (LATE) [31], and primary age-related tauopathy (PART) [32]. In addition, factors, such as cognitive reserve [33], genetic influences, immune dysfunction, and individual lifestyles may either enhance or suppress the association of cognitive status to the underlying neuropathology [34].
In addition to demonstrating that pNfL may have a complementary role to neuroimaging, another strength of the current study was a relatively large group of subjects (n = 47) who were diagnosed with cognitive disorder with a primary neuropsychiatric etiology. Their mean pNfL level was not different from CN subjects, after controlling for age (Table 4). Further, their CDR-SB score at baseline and their change in CDR-SB at follow-up visits was not different from CN subjects, although they had lower scores on a list-learning test. In this group, the frequency of abnormal biomarkers is equivalent to that for CN subjects. In the absence of expensive neuroimaging tests, pNfL could be a valuable biomarker for differentiating those patients presenting with cognitive complaints who have neuropsychiatric symptoms versus those with neurodegenerative disease [35]. Similarly, pNfL may have diagnostic utility for subjects presenting with miscellaneous conditions such as sleep disorders and other non-neurodegenerative disorders, included in the Dx-Other group.
Limitations of the study include a small number of African American participants, the lack of serial pNfL measurements, the small number of participants with non-AD neurodegenerative disorders, and the relatively short longitudinal assessment interval. In addition, the Hispanics in this study were mostly from Cuba and South America and most self-reported as being white. Therefore, the results may not be generalizable to other Hispanic groups composed of people from Central America and other countries in the Caribbean.
Our findings suggest that pNfL provides a convenient marker of the severity of neurodegeneration and is associated with global cognitive and functional impairment, independent of hippocampal atrophy and abnormal amyloid load. An elevated pNfL concentration, similar to an elevated cholesterol, fasting glucose, or blood pressure measurement, could indicate the need for more detailed diagnostic evaluation and the institution of therapeutic and behavioral interventions. Plasma NFL was also shown to have utility in the prediction of cognitive and functional decline, beyond that provided by current standard of care assessments, such as brain imaging and cognitive testing. The clinical utility of pNfL as a marker of neurodegeneration is limited by its lack of specificity for AD since disorders such as FTLD also evidence elevated levels.
ACKNOWLEDGMENTS
This research was supported by the National Institute of Aging Grant numbers 5P50AG0477266021 Florida Alzheimer’s Disease Research Center (Todd Golde, PI) and 1P30AG066506-01 Florida Alz-heimer’s Disease Research Center (Todd Golde, PI).
Authors’ disclosures available online (https://www.j-alz.com/manuscript-disclosures/20-0901r1).
REFERENCES
[1] | Boyle PA , Yu L , Wilson RS , Leurgans E , Schneider JA , Bennett DA ((2018) ) Person-specific contribution of neuropathologies to cognitive loss in old age. Ann Neurol 83: , 74–83. |
[2] | Sjogren M , Blomberg M , Jonsson M , Wahlund LO , Edman A , Lind K , Rosengren L , Blennow K , Wallin A ((2001) ) Neurofilament protein in cerebrospinal fluid: A marker of white matter changes. J Neurosci Res 66: , 510–516. |
[3] | Zetterberg H , Skillbäck T , Mattsson N , Trojanowski JQ , Portelius E , Shaw LM , Weiner MW , Blennow K ; Alzheimer’s Disease Neuroimaging Initiative ((2016) ) Association of cerebrospinal fluid neurofilament light concentration with Alzheimer disease progression. JAMA Neurol 73: , 60–67. |
[4] | Idland AV , Sala-Llonch R , Borza T , Watne LO , Wyller TB , Brækhus A , Zetterberg H , Blennow K , Walhovd KB , Fjell AM ((2017) ) CSF neurofilament light levels predict hippocampal atrophy in cognitively healthy older adults. Neurobiol Aging 49: , 138–144. |
[5] | Mattsson N , Andreasson U , Zetterberg H , Blennow K ; Alzheimer’s Disease Neuroimaging Initiative ((2017) ) Association of plasma neurofilament light with neurodegeneration in patients with Alzheimer disease. JAMA Neurol 74: , 557–566. |
[6] | Osborn KE , Khan OA , Kresge HA , Bown CW , Liu D , Moore EE , Gifford KA , Acosta LMY , Bell SP , Hohman TJ , Blennow K , Zetterberg H , Jefferson AL ((2019) ) Cerebrospinal fluid and plasma neurofilament light relate to abnormal cognition.. Alzheimers Dement (Amst), 11: , 700–709. |
[7] | Bridel C , van Wieringen WN , Zetterberg H , Tijms BM , Teunissen CE , and the NFL Group ((2019) ) Diagnostic value of cerebrospinal fluid neurofilament light protein in neurology: A systematic review and meta-analysis. JAMA Neurol 76: , 1035–1048. |
[8] | Duara R , Loewenstein DA , Greig MT , Potter E , Barker W , Raj A , Schinka J , Borenstein A , Schoenberg M , Wu Y , Banko J , Potter H ((2011) ) Pre-MCI and MCI: Neuropsychological, clinical, and imaging features and progression rates. Am J Geriatr Psychiatry 19: , 951–960. |
[9] | Loewenstein DA , Greig MT , Schinka JA , Barker W , Shen Q , Potter E , Raj A , Brooks L , Varon D , Schoenberg M , Banko J , Potter H , Duara R ((2012) ) An investigation of PreMCI: Subtypes and longitudinal outcomes. Alzheimers Dement 8: , 172–179. |
[10] | Besser L , Kukull W , Knopman DS , Besser L , Kukull W , Knopman DS , Chui H , Galasko D , Weintraub S , Jicha G , Carlsson C , Burns J , Quinn J , Sweet RA , Rascovsky K , Teylan M , Beekly D , Thomas G , Bollenbeck M , Monsell S , Mock C , Zhou XH , Thomas N , Robichaud E , Dean M , Hubbard J , Jacka M , Schwabe-Fry K , Wu J , Phelps C , Morris JC ((2018) ) Version 3 of the National Alzheimer’s Coordinating Center’s Uniform Data Set. Alzheimer Dis Assoc Disord 32: , 351–358. |
[11] | Morris JC ((1993) ) The Clinical Dementia Rating (CDR): Current version and scoring rules. Neurology 43: , 2412–2412. |
[12] | O’Bryant SE , Lacritz LH , Hall J , Waring SC , Chan W , Khodr ZG , Massman PJ , Hobson V , Cullum CM ((2010) ) Validation of the new interpretive guidelines for the clinical dementia rating scale sum of boxes score in the national Alzheimer’s coordinating center database. Arch Neurol 67: , 746–749. |
[13] | National Research Council ((2004) ) Measuring Racial Discrimination. The National Academies Press, Washington, DC. |
[14] | Benedict RH , Schretlen D , Groninger L , Brandt J ((1998) ) Hopkins verbal learning test–revised: Normative data and analysis of inter-form and test-retest reliability. Clin Neuropsychol 12: , 43–55. |
[15] | Folstein MF , Folstein SE , McHugh PR ((1975) ) Mini-mental state: A practical method for grading the cognitive state of patients for the clinician. J Psychiatr Res 12: , 189–198. |
[16] | McKhann GM , Knopman DS , Chertkow H , McKhann GM , Knopman DS , Chertkow H , Hyman BT , Jack CR Jr , Kawas CH , Klunk WE , Koroshetz WJ , Manly JJ , Mayeux R , Mohs RC , Morris JC , Rossor MN , Scheltens P , Carrillo MC , Thies B , Weintraub S , Phelps CH ((2011) ) The diagnosis of dementia due to Alzheimer’s disease: Recommendations from the National Institute on Aging-Alzheimer’s Association workgroups on diagnostic guidelines for Alzheimer’s disease. Alzheimers Dement 7: , 263–269. |
[17] | Duara R , Loewenstein DA , Potter E , Appel J , Greig MT , Urs R , Shen Q , Raj A , Small B , Barker W , Schofield E , Wu Y , Potter H ((2008) ) Medial temporal lobe atrophy on MRI scans and the diagnosis of Alzheimer disease. Neurology 71: , 1986–1992. |
[18] | Desikan RS , Cabral HJ , Hess CP , Dillon WP , Glastonbury CM , Weiner MW , Schmansky NJ , Greve DN , Salat DH , Buckner RL , Fischl B ; Alzheimer’s Disease Neuroimaging Initiative ((2009) ) Automated MRI measures identify individuals with mild cognitive impairment and Alzheimer’s disease. Brain 132: , 2048–2057. |
[19] | Duara R , Loewenstein DA , Lizarraga G , Adjouadi M , Barker WW , Greig-Custo MT , Rosselli M , Penate A , Shea YF , Behar R , Ollarves A , Robayo C , Hanson K , Marsiske M , Burke S , Ertekin-Taner N , Vaillancourt D , De Santi S , Golde T , DeKosky S ((2019) ) Effect of age, ethnicity, sex, cognitive status and APOE genotype on amyloid load and the threshold for amyloid positivity. Neuroimage Clin 22: , 101800. |
[20] | Sabri O , Seibyl J , Rowe C , Barthel H ((2015) ) Beta-amyloid imaging with florbetaben. Clin Transl Imaging 3: , 13–26. |
[21] | Rowe CC , Doré V , Jones G , Baxendale D , Mulligan RS , Bullich S , Stephens AW , De Santi S , Masters CL , Dinkelborg L , Villemagne VL ((2017) ) 18F-Florbetaben PET beta-amyloid binding expressed in Centiloids. Eur J Nucl Med Mol Imaging 44: , 2053–2059. |
[22] | Navitsky M , Joshi AD , Kennedy I , Klunk WE , Rowe CC , Wong DF , Pontecorvo MJ , Mintun MA , Devous MD Sr ((2018) ) Standardization of amyloid quantitation with florbetapir standardized uptake value ratios to the Centiloid scale. Alzheimers Dement 14: , 1565–1571. |
[23] | Samtani MN , Raghavan N , Novak G , Nandy P , Narayan VA ((2014) ) Disease progression model for Clinical Dementia Rating-Sum of Boxes in mild cognitive impairment and Alzheimer’s subjects from the Alzheimer’s Disease Neuroimaging Initiative. Neuropsychiatr Dis Treat 10: , 929–52. |
[24] | Harwood DG , Barker WW , Ownby RL , St. George-Hyslop P , Duara R ((2004) ) Apolipoprotein E polymorphism and age of onset for Alzheimer’s disease in a bi-ethnic sample. Int Psychogeriatr 16: , 317–326. |
[25] | Bos I , Vos SJB , Jansen WJ , Vandenberghe R , Gabel S , Estanga A , Ecay-Torres M , Tomassen J , den Braber A , Lleó A , Sala I , Wallin A , Kettunen P , Molinuevo JL , Rami L , Chetelat G , de la Sayette V , Tsolaki M , Freund-Levi Y , Johannsen P ; Alzheimer’s Disease Neuroimaging Initiative, Novak GP , Ramakers I , Verhey FR , Visser PJ ((2018) ) Amyloid-β, tau, and cognition in cognitively normal older individuals: Examining the necessity to adjust for biomarker status in normative data. Front Aging Neurosci 10: , 193. |
[26] | de Wolf F , Ghanbari M , Licher S , McRae-McKee K , Gras L , Weverling GJ , Wermeling P , Sedaghat S , Ikram MK , Waziry R , Koudstaal W , Klap J , Kostense S , Hofman A , Anderson R , Goudsmit J , Ikram MA ((2020) ) Plasma tau, neurofilament light chain and amyloid-β levels and risk of dementia; a population-based cohort study. Brain 143: , 1220–1232. |
[27] | Altomare D , de Wilde A , Ossenkoppele R , Pelkmans W , Bouwman F , Groot C , van Maurik I , Zwan M , Yaqub M , Barkhof F , van Berckel BN , Teunissen CE , Frisoni GB , Scheltens P , van der Flier WM ((2019) ) Applying the ATN scheme in a memory clinic population: The ABIDE project.e1635-e1646. Neurology 93: . |
[28] | Jack CR Jr , Wiste HJ , Therneau TM , Weigand SD , Knopman DS , Mielke MM , Lowe VJ , Vemuri P , Machulda MM , Schwarz CG , Gunter JL , Senjem ML , Graff-Radford J , Jones DT , Roberts RO , Rocca WA , Petersen RC ((2019) ) Associations of amyloid, tau, and neurodegeneration biomarker profiles with rates of memory decline among individuals without dementia. JAMA 321: , 2316–2325. |
[29] | Jack CR Jr , Bennett DA , Blennow K , Carrillo MC , Dunn B , Haeberlein SB , Holtzman DM , Jagust W , Jessen F , Karlawish J , Liu E , Molinuevo JL , Montine T , Phelps C , Rankin KP , Rowe CC , Scheltens P , Siemers E , Snyder HM , Sperling R ; Contributors ((2018) ) NIA-AA Research Framework: Toward a biological definition of Alzheimer’s disease. Alzheimers Dement 14: , 535–562. |
[30] | Luchsinger JA , Reitz C , Honig LS , Tang MX , Shea S , Mayeux R ((2005) ) Aggregation of vascular risk factors and risk of incident Alzheimer disease. Neurology 65: , 545–551. |
[31] | Nelson PT , Dickson DW , Trojanowski JQ , Jack CR , Boyle PA , Arfanakis K , Rademakers R , Alafuzoff I , Attems J , Brayne C , Coyle-Gilchrist IT , Chui HC , Fardo DW , Flanagan ME , Halliday G , Hokkanen SR , Hunter S , Jicha GA , Katsumata Y , Kawas CH , Keene CD , Kovacs GG , Kukull WA , Levey AI , Makkinejad N , Montine TJ , Murayama S , Murray ME , Nag S , Rissman RA , Seeley WW , Sperling RA , White Iii CL , Yu L , Schneider JA ((2019) ) Limbic-predominant age-related TDP-43 encephalopathy (LATE): Consensus working group report. Brain 142: , 1503–1527. |
[32] | Crary JF , Trojanowski JQ , Schneider JA , Abisambra JF , Abner EL , Alafuzoff I , Arnold SE , Attems J , Beach TG , Bigio EH , Cairns NJ , Dickson DW , Gearing M , Grinberg LT , Hof PR , Hyman BT , Jellinger K , Jicha GA , Kovacs GG , Knopman DS , Kofler J , Kukull WA , Mackenzie IR , Masliah E , McKee A , Montine TJ , Murray ME , Neltner JH , Santa-Maria I , Seeley WW , Serrano-Pozo A , Shelanski ML , Stein T , Takao M , Thal DR , Toledo JB , Troncoso JC , Vonsattel JP , White CL 3rd , Wisniewski T , Woltjer RL , Yamada M , Nelson PT ((2014) ) Primary age-related tauopathy (PART): A common pathology associated with human aging. Acta Neuropathol 128: , 755–766. |
[33] | Stern Y ((2012) ) Cognitive reserve in ageing and Alzheimer’s disease. Lancet Neurol 11: , 1006–1012. |
[34] | Newcombe EA , Camats-Perna J , Silva ML , Valmas N , Huat TJ , Medeiros R ((2018) ) Inflammation: The link between comorbidities, genetics, and Alzheimer’s disease. J Neuroinflammation 15: , 276. |
[35] | Katisko K , Cajanus A , Jääskeläinen O , Kontkanen A , Hartikainen P , Korhonen VE , Helisalmi S , Haapasalo A , Koivumaa-Honkanen H , Herukka SK , Remes AM , Solje E ((2020) ) Serum neurofilament light chain is a discriminative biomarker between frontotemporal lobar degeneration and primary psychiatric disorders. J Neurol 267: , 162–167. |


