
Racial Differences in Alzheimer’s Disease Specialist Encounters Are Associated with Usage of Molecular Imaging and Dementia Medications: An Enterprise-Wide Analysis Using i2b2
Abstract
Background:
African Americans are at increased risk for Alzheimer’s disease (AD) but barriers to optimal clinical care are unclear.
Objective:
To comprehensively evaluate potential racial differences in the diagnosis and treatment of AD in an academic medical center.
Methods:
We used the clinical informatics tool, i2b2, to analyze all patient encounters for AD or mild cognitive impairment (MCI) in the University of Alabama at Birmingham Health System over a three-year period, examining neuroimaging rates and dementia-related medication use by race and clinic site using ratio tests on contingency tables of stratified patient counts.
Results:
Enterprise-wide, African Americans were not underrepresented among outpatients seen for AD/MCI. However, there were differences in the clinic setting where visits occurred, with African Americans overrepresented in Geriatrics and primary care clinics and underrepresented in Memory Disorders specialty clinics. There were no racial differences in the rates at which any clinic ordered PET neuroimaging tests or dementia-related medications. However, unsurprisingly, specialty clinics ordered both PET neuroimaging and dementia-related medications at a higher rate than primary care clinics, and overall across the medical enterprise, African Americans were statistically less likely to have PET neuroimaging or dementia-related medications ordered.
Conclusion:
African Americans with AD/MCI were not underrepresented at this academic medical center but were somewhat less likely to have PET neuroimaging or to be on dementia-related medications, potentially in part from underrepresentation in the specialty clinics where these orders are more likely. The reasons for this underrepresentation in specialty clinics are likely multifactorial and important to better understand.
INTRODUCTION
Research in neurodegeneration and dementia has identified several factors influencing risk of Alzheimer’s disease (AD) that can inhibit successful diagnosis and treatment, one of the most notable being racial disparities [1, 2]. Notably, those with an African American racial background or a Hispanic ethnic background have a greater risk to develop AD or mild cognitive impairment (MCI) [3–5]. The root causes of these racial and ethnic discrepancies have numerous potential sources, including differences in socioeconomic status, educational opportunity, healthcare access, medical comorbidities, genetic risk variants, and many other factors [5–12]. These racial disparities are further influenced by differences endemic to the regions where these specific groups are concentrated. This is especially true when the regional differences are intrinsically related to the biological and health-based factors that are associated with AD in their own right, for example the increased incidence of poor cardiovascular health and obesity in the Deep South [8, 13–17].
Beyond simply impacting the prevalence of AD and MCI, racial differences also exist with respect to access to appropriate medical care, adequate education, and other necessary resources for treating AD/MCI [4, 8, 11, 14, 18]. The racial differences in incidence of AD/MCI have been routinely found nationwide without strict dependence on location and are believed to be due to a combination of biological, genetic, and psychosocial factors [4], although evaluations within the Deep South in particular are less well characterized. Regardless, many of the challenges related to studying dementia in African Americans and the reasons for this discrepancy in prevalence have been framed solely in terms of biological determination while giving socioeconomic and cultural factors such as medical mistrust less consideration [8]. However, these features have impacted the historical underrepresentation of African Americans in biomedical research on AD/MCI and in turn influenced access of African Americans to care. For example, education is routinely cited as a protective factor in AD prevalence and a study of one biracial community in North Carolina observed how education may encourage patients to seek medical care and in turn lead to improved access of care for patients with AD regardless of race [14] even though educational attainment may have its own racial differences. Interactions and experiences with providers and care institutions can also differ based on racial and ethnic background as seen in a set of structured interviews of 39 ethnically diverse family dementia caregivers which specifically considered pathways to diagnosis and experiences within the medical system [11]. All of these disparate facets can lead to a delay in timely diagnosis of AD in African Americans, driven by issues such as recognition of symptoms by caregivers and physician contact as hurdles which further emphasizes the need to increase connecting patients with providers to improve diagnosis times [18]. Taken together, identification of these complex racial differences is recognized as a crucial first step to improve treatment for diverse and underserved populations and warrants additional research.
These racial disparities in risk and access may influence other, more specific aspects of AD diagnosis and treatment. For example, recent emphasis on early detection of AD and significant advances in neuroimaging have enabled identifying the unique pathologies of AD that previously could only be diagnosed postmortem [19–21]. Positron emission tomography (PET) imaging using ligands specific to aggregated amyloid-β [22, 23] and tau [24] can non-invasively detect amyloid plaques and neurofibrillary tangles, the pathologic hallmarks of the disease. In addition, 2-deoxy-2-[18F]fluoro-D-glucose (FDG) PET can also detect patterns of neuronal injury and hypometabolism in certain brain regions to indirectly identify phenotypes of AD and other dementias [25]. These PET-based techniques have the potential to more precisely identify and characterize diseases beyond the structural data obtained with magnetic resonance imaging (MRI) [26–28]. Although these imaging techniques are very promising, there has been very little research on the potential impact of racial differences with respect to their accessibility.
Fortunately, new clinical informatics tools have been developed that utilize information gathered through the electronic medical record to extensively investigate patterns of clinical care. Leveraging these tools can aid inquiries into patient care using queries based on demographics, diagnoses, procedures, provider clinic, and other clinical variables. To comprehensively investigate racial differences in AD care, we used the local implementation of Informatics for Integrating Biology and the Bedside (i2b2) at the University of Alabama at Birmingham (UAB) to explore the association between race and patient characteristics to identify potential racial disparities in the evaluation of AD/MCI in the Birmingham, Alabama metropolitan area.
METHODS
i2b2 platform
i2b2 is an NIH-funded, open-source framework that integrates patient clinical data and additional health information to support research endeavors [29]. The system has been adopted at over 140 academic medical systems nationwide, including many with Clinical and Translational Science Awards from the National Center for Advancing Translation Sciences [30]. i2b2 allows for institutional review board–approved, HIPAA-compliant searches of a de-identified data warehouse of patient health information. The current study used the i2b2 implementation at UAB to return summary data of unique patient counts meeting prespecified criteria such as demographics and visit details while restricted to a “Limited Data Set” view lacking all protected health information (PHI). Database searches within i2b2 used a fixed three-year window from October 10, 2015 to October 10, 2018 to identify unique individual patients meeting previously determined specific criteria.
Patient population
The study population was established using a combination of demographic and diagnostic criteria to identify unique, individual patients. Encounters were limited to billable, in-person visits within the UAB Medicine system and excluded other encounters such as telephone or email correspondence with providers. Patients were required to have at least one encounter where the primary ICD-10 diagnosis used for billing was either Alzheimer’s disease (G30) or mild cognitive impairment (G31.84), depending on the query. Comparisons based on self-identified race were specifically made between African Americans and non-Hispanic whites. Focus on this comparison facilitated interpretation of the results while granting the largest coverage of known patient races across the medical system (53.8% non-Hispanic white, 27.4% African American, 13.9% unknown/undeclared, 4.9% all others).
Specialty clinics
In addition to enterprise-wide searches, unique encounters were also restricted to focus on specific clinics within the UAB Medicine system that commonly treat patients with either AD or MCI as outpatients. The Memory Disorders subspecialty clinic within the Department of Neurology is staffed by fellowship-trained behavioral neurologists and focuses on treatment of neurodegenerative dementia syndromes. This specialty clinic was evaluated independently of other clinics within the Department of Neurology, which were also included in the analysis as an additional specialty setting. Preliminary investigation using i2b2 identified other outpatient settings that also commonly provide care for patients with these diagnoses. These included Geriatric Medicine as well as a “Primary Medicine” group which combined the General/Internal Medicine, Family Medicine, and Primary Care clinics. Each of these four clinical groups were found to have at least 75 patients meeting the diagnostic criteria with in-person visits during the study window. Queries for Memory Disorders allowed for provider referrals within UAB; however, these patients with visits to multiple settings were excluded from queries for clinical settings outside Memory Disorders. This was to emphasize how patients who were seen in these non-specialist settings would receive orders or treatments specifically from non-specialty providers. Although this did exclude patients initially seen for AD/MCI from these non-specialty locations if they were seen at both clinical settings. In addition, insurance payments were considered for AD/MCI encounters within each clinic to compare covered visits paid by federally subsidized programs (Medicare, Medicaid, CHAMPUS) or private insurers (Blue Cross or other commercial providers) to encounters with self-payment by patients.
Neuroimaging criteria
Queries in i2b2 allow for restricting procedures to specific indications, and this capacity was leveraged to identify rates of use for various imaging techniques specifically for AD/MCI. Assessment of AD-related PET neuroimaging specifically queried records of AD or MCI patients who received either [18F]florbetapir for amyloid-PET or FDG-PET. Additionally, AD or MCI patients who received brain MRI were also queried for comparison to PET. Other neuroimaging modalities were queried enterprise-wide as control evaluations including any instances of computed tomography (CT) or brain MRI for any indication as a general reference due to their ubiquitous use. As a control evaluation of molecular neuroimaging, instances of PET specifically used for evaluation of epilepsy were assessed. Finally, as a control for molecular imaging outside of neurology, usage rates of PET for oncological malignancies were queried including PET for breast, cervical, colorectal, esophageal, lung, lymphoma, melanoma, ovarian, and thyroid cancer assessment at both the initial stage and restaging. All non-amyloid PET, MRI, and CT records were restricted to imaging performed as regular clinical care, with evaluations ordered as part of research studies excluded in this analysis, while most amyloid PET records were obtained as part of the Imaging Dementia-Evidence for Amyloid Scanning (IDEAS) study in 2016–17 [31].
FDA-approved AD medications
Medication queries identified any patients with the drug of interest on their medication list, regardless of whether it was prescribed by a UAB provider. The primary analysis focused on the most commonly prescribed AD drug, the acetylcholinesterase inhibitor donepezil, at all oral doses with queries on other commonly prescribed FDA-approved AD medications including the acetylcholinesterase inhibitors galantamine and rivastigmine and the glutamate blocker memantine.
Statistical analysis
Descriptive statistics were computed for all study variables. Statistical analysis evaluated the odds ratios arising from 2×2 contingency tables with exact tests using conditional maximum likelihood tests or median-unbiased estimation when individual cell counts of less than 5 were observed. Contingency table methods were utilized instead of linear model designs as only count data for the groups of interest were available in i2b2 and individual patient data were not part of the access level granted to this study. In all cases an adjusted significance threshold of p < 0.01 was used due to the number of models being considered. Statistics and data visualization were carried out using R 3.4 [32].
RESULTS
Differences in AD-related PET imaging
When we examined clinical utilization of AD-related PET neuroimaging, there was a notable underrepresentation of African Americans. Whereas over 24% of all patients seen for AD/MCI were African American, only 7.0% of patients receiving amyloid PET and 11.4% of patients receiving FDG-PET were African American (Table 1, Fig. 1). To determine if this underrepresentation was true of neuroimaging in general, we compared data from several other neuroimaging modalities to see if their utilization also differed significantly from the proportion of African Americans served by the medical system, with an emphasis on outpatients as this is where most such neuroimaging is ordered. African Americans were not underrepresented among those having a brain MRI (either among those ordered to evaluate specifically for AD/MCI or among those ordered enterprise-wide for any indication) and were overrepresented among those having head CT scans for any indication (Table 1, Fig. 1).
Table 1
Enterprise-wide representation of African Americans for various encounters and imaging tests
| Encounter type | Total | African American | Non-Hispanic white | p |
| Metro population, age≥65 | 166,162 | 35,484 (21.4%) | 130,678 (78.6%) | – |
| AD/MCI diagnoses | ||||
| All patients | ||||
| AD diagnosis | 2,224 | 533 (24.0%) | 1,691 (76.0%) | 0.0033† |
| MCI diagnosis | 3,433 | 816 (23.8%) | 2,617 (76.2%) | 0.0008† |
| AD or MCI diagnosis | 5,287 | 1,291 (24.4%) | 3,996 (75.6%) | <0.0001† |
| Outpatients only | ||||
| AD diagnosis | 1,386 | 287 (20.7%) | 1,099 (79.3%) | 0.58† |
| MCI diagnosis | 2,748 | 553 (20.1%) | 2,195 (79.9%) | 0.12† |
| AD or MCI diagnosis | 3,840 | 805 (21.0%) | 3,035 (79.0%) | 0.58 † |
| AD/MCI neuroimaging | ||||
| Amyloid PET | 40 | 3 (7.5%) | 37 (92.5%) | 0.0074‡; 0.027§ |
| FDG-PET for AD/MCI | 112 | 14 (12.5%) | 98 (87.5%) | 0.0024‡; 0.032§ |
| Brain MRI for AD/MCI | 1,146 | 253 (22.1%) | 893 (77.9%) | 0.093‡; 0.43§ |
| All neuroimaging | ||||
| Outpatients, enterprise-wide | 378,333 | 115,115 (30.4%) | 263,218 (69.6%) | – |
| Brain MRI for any indication | 18,877 | 5,651 (29.9%) | 13,226 (70.1%) | 0.15* |
| Head CT for any indication | 30,977 | 12,263 (39.6%) | 18,714 (60.4%) | <0.0001* |
| Epilepsy outpatients | 4,933 | 1,512 (30.7%) | 3,421 (69.3%) | – |
| FDG-PET for Epilepsy | 96 | 27 (28.1%) | 69 (71.9%) | 0.66 # |
| Oncology outpatients | 22,222 | 4,567 (20.6%) | 17,655 (79.4%) | – |
| Oncology PET | 4,629 | 932 (20.1%) | 3,697 (79.9%) | 0.53** |
NOTE: Statistical tests compare African Americans to non-Hispanic whites with p values for listed comparisons calculated from conditional maximum likelihood, or median-unbiased estimation for contingency tables with cell counts less than 5. AD, Alzheimer’s disease; MCI, mild cognitive impairment; PET, positron emission tomography; MRI, magnetic resonance imaging; FDG, fluorodeoxyglucose; CT, computed tomography. †Compared to Metro population, age ≥65. ‡Compared to AD or MCI diagnosis for all patients. §Compared to AD or MCI diagnosis for outpatients only. *Compared to outpatients enterprise-wide. #Compared to Epilepsy outpatients. **Compared to Oncology outpatients.
Fig.1
Proportion of outpatients receiving various imaging tests who were African American. The African American proportions of patients receiving Amyloid-PET (p = 0.0074) or FDG-PET for AD/MCI (p = 0.0024) was lower than the proportions of African American AD/MCI patients (red line) and trended lower compared to the African American proportion of AD/MCI outpatients across the medical system (blue line) (Amyloid-PET p = 0.027; FDG-PET p = 0.032). In contrast, the African American proportion of AD/MCI outpatients receiving brain MRI for AD/MCI did not differ from these benchmarks (p = 0.43). In addition, when compared to the total African American proportion of outpatients seen across the enterprise, there was no difference in the African American proportion of outpatients receiving brain MRIs for any indication (p = 0.15) while there was a greater than expected proportion receiving head CTs (p < 0.0001). Considering other PET imaging modalities, there were no differences in the African American proportion of outpatients receiving brain PET for epilepsy indications (p = 0.66), nor in the African American proportion of outpatients receiving oncology PET (p = 0.53).
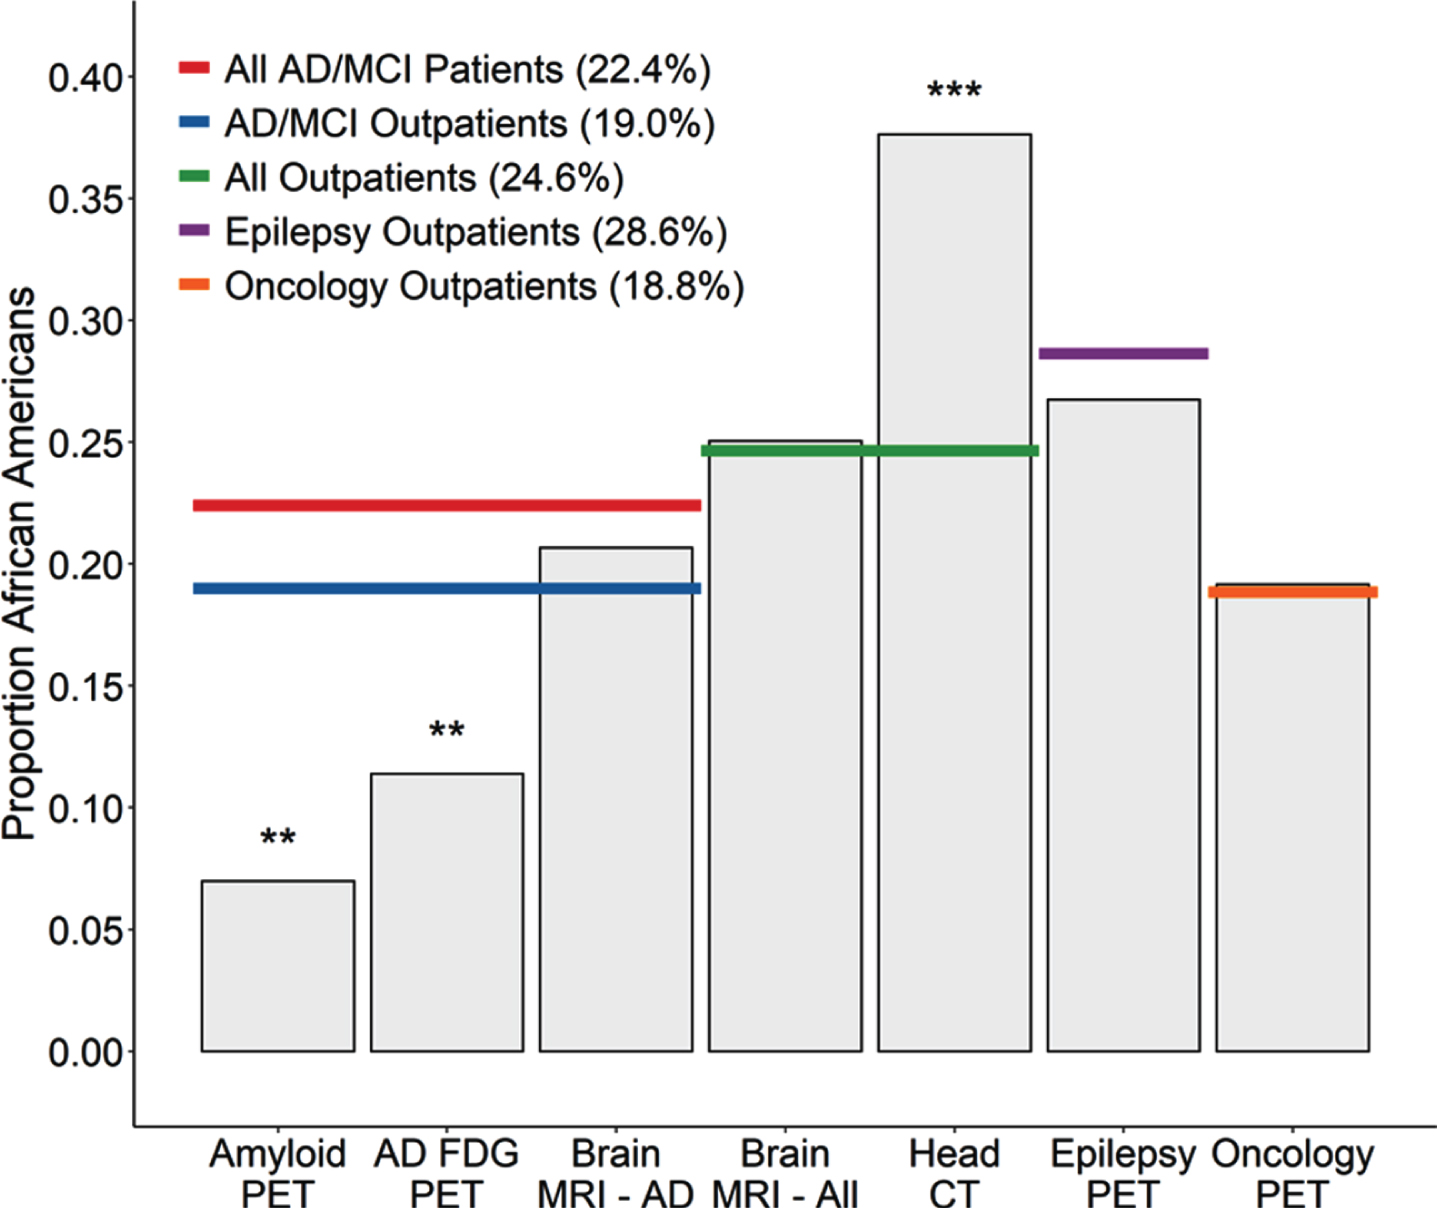
Next, we examined whether African Americans were underrepresented among those undergoing other types of PET imaging, to determine if the observed difference related generally to PET. However, African Americans were not underrepresented among those receiving FDG-PET for epilepsy (Table 1, Fig. 1). In addition, African Americans were not underrepresented among those receiving oncological PET imaging for a variety of malignancies (breast, cervical, colorectal, esophageal, lung, lymphoma, melanoma, ovarian, and thyroid cancer), whether for initial staging or restaging evaluations, and did not differ from the African American proportion of outpatients seen for those types of malignancies (Table 1, Fig. 1). Thus, the lower frequency of AD-related PET neuroimaging observed for African Americans does not seem to be reflective of any broader pattern with PET imaging in general.
Demographic differences between clinics
AD-related PET neuroimaging is more likely to be ordered by memory disorders providers, and in fact the appropriate use criteria for amyloid-PET requires a specialist’s order [33]. Therefore, we hypothesized that the lower rates of AD-related PET imaging for African Americans could arise at least in part from underrepresentation in the subspecialty Memory Disorders clinic. Of the 4,240 outpatients seen across the enterprise with a primary diagnosis of AD or MCI, 3,416 (80.6%) were seen in Neurology or Primary Care clinics, so we focused our analyses on these clinics, grouping them into four categories: Memory Disorders (a subspecialty clinic in neurology), Other Neurology clinics, Primary Medicine (primary care, family medicine, internal medicine), and Geriatrics (Table 2). Among the outpatients in these four groups, 19.1% were African American, which was not different from the proportion of African Americans age 65 or greater in the Metro area (21.4%) (p = 0.84). This subset of outpatients was used as the enterprise-wide metric for comparison when evaluating the individual outpatient clinics.
Table 2
Counts and proportions of outpatient visits by race, diagnosis, and clinic
| Clinical setting | Total patients | African American | Non-Hispanic white | p* |
| AD | ||||
| Enterprise-wide outpatients | 1,114 | 251 (22.5%) | 863 (77.5%) | |
| Memory Disorders | 438 | 59 (13.5%) | 379 (86.5%) | <0.0001 |
| Other Neurology | 126 | 16 (12.7%) | 110 (87.3%) | 0.0081 |
| Primary Medicine | 83 | 37 (44.6%) | 46 (55.4%) | <0.0001 |
| Geriatrics | 338 | 127 (37.6%) | 211 (62.4%) | <0.0001 |
| MCI | ||||
| Enterprise-wide outpatients | 2,205 | 426 (19.3%) | 1,779 (80.7%) | |
| Memory Disorders | 701 | 96 (13.7%) | 605 (86.3%) | 0.0007 |
| Other Neurology | 675 | 97 (14.4%) | 578 (85.6%) | 0.0036 |
| Primary Medicine | 230 | 112 (48.7%) | 118 (51.3%) | <0.0001 |
| Geriatrics | 317 | 78 (24.6%) | 239 (75.4%) | 0.029 |
| AD or MCI | ||||
| Enterprise-wide outpatients | 3,072 | 651 (21.2%) | 2,421 (78.8%) | |
| Memory Disorders | 1,047 | 151 (14.4%) | 896 (85.6%) | <0.0001 |
| Other Neurology | 783 | 112 (14.3%) | 671 (85.7%) | <0.0001 |
| Primary Medicine | 311 | 149 (47.9%) | 162 (52.1%) | <0.0001 |
| Geriatrics | 616 | 196 (31.8%) | 420 (68.2%) | <0.0001 |
*p values are from conditional maximum likelihood exact tests, comparing the relative proportion of African American patients to non-Hispanic white patients with a given diagnosis in each of the various clinic settings to the enterprise-wide relative proportion. In other words, the proportion in each row is compared to the enterprise-wide proportion for that diagnosis.
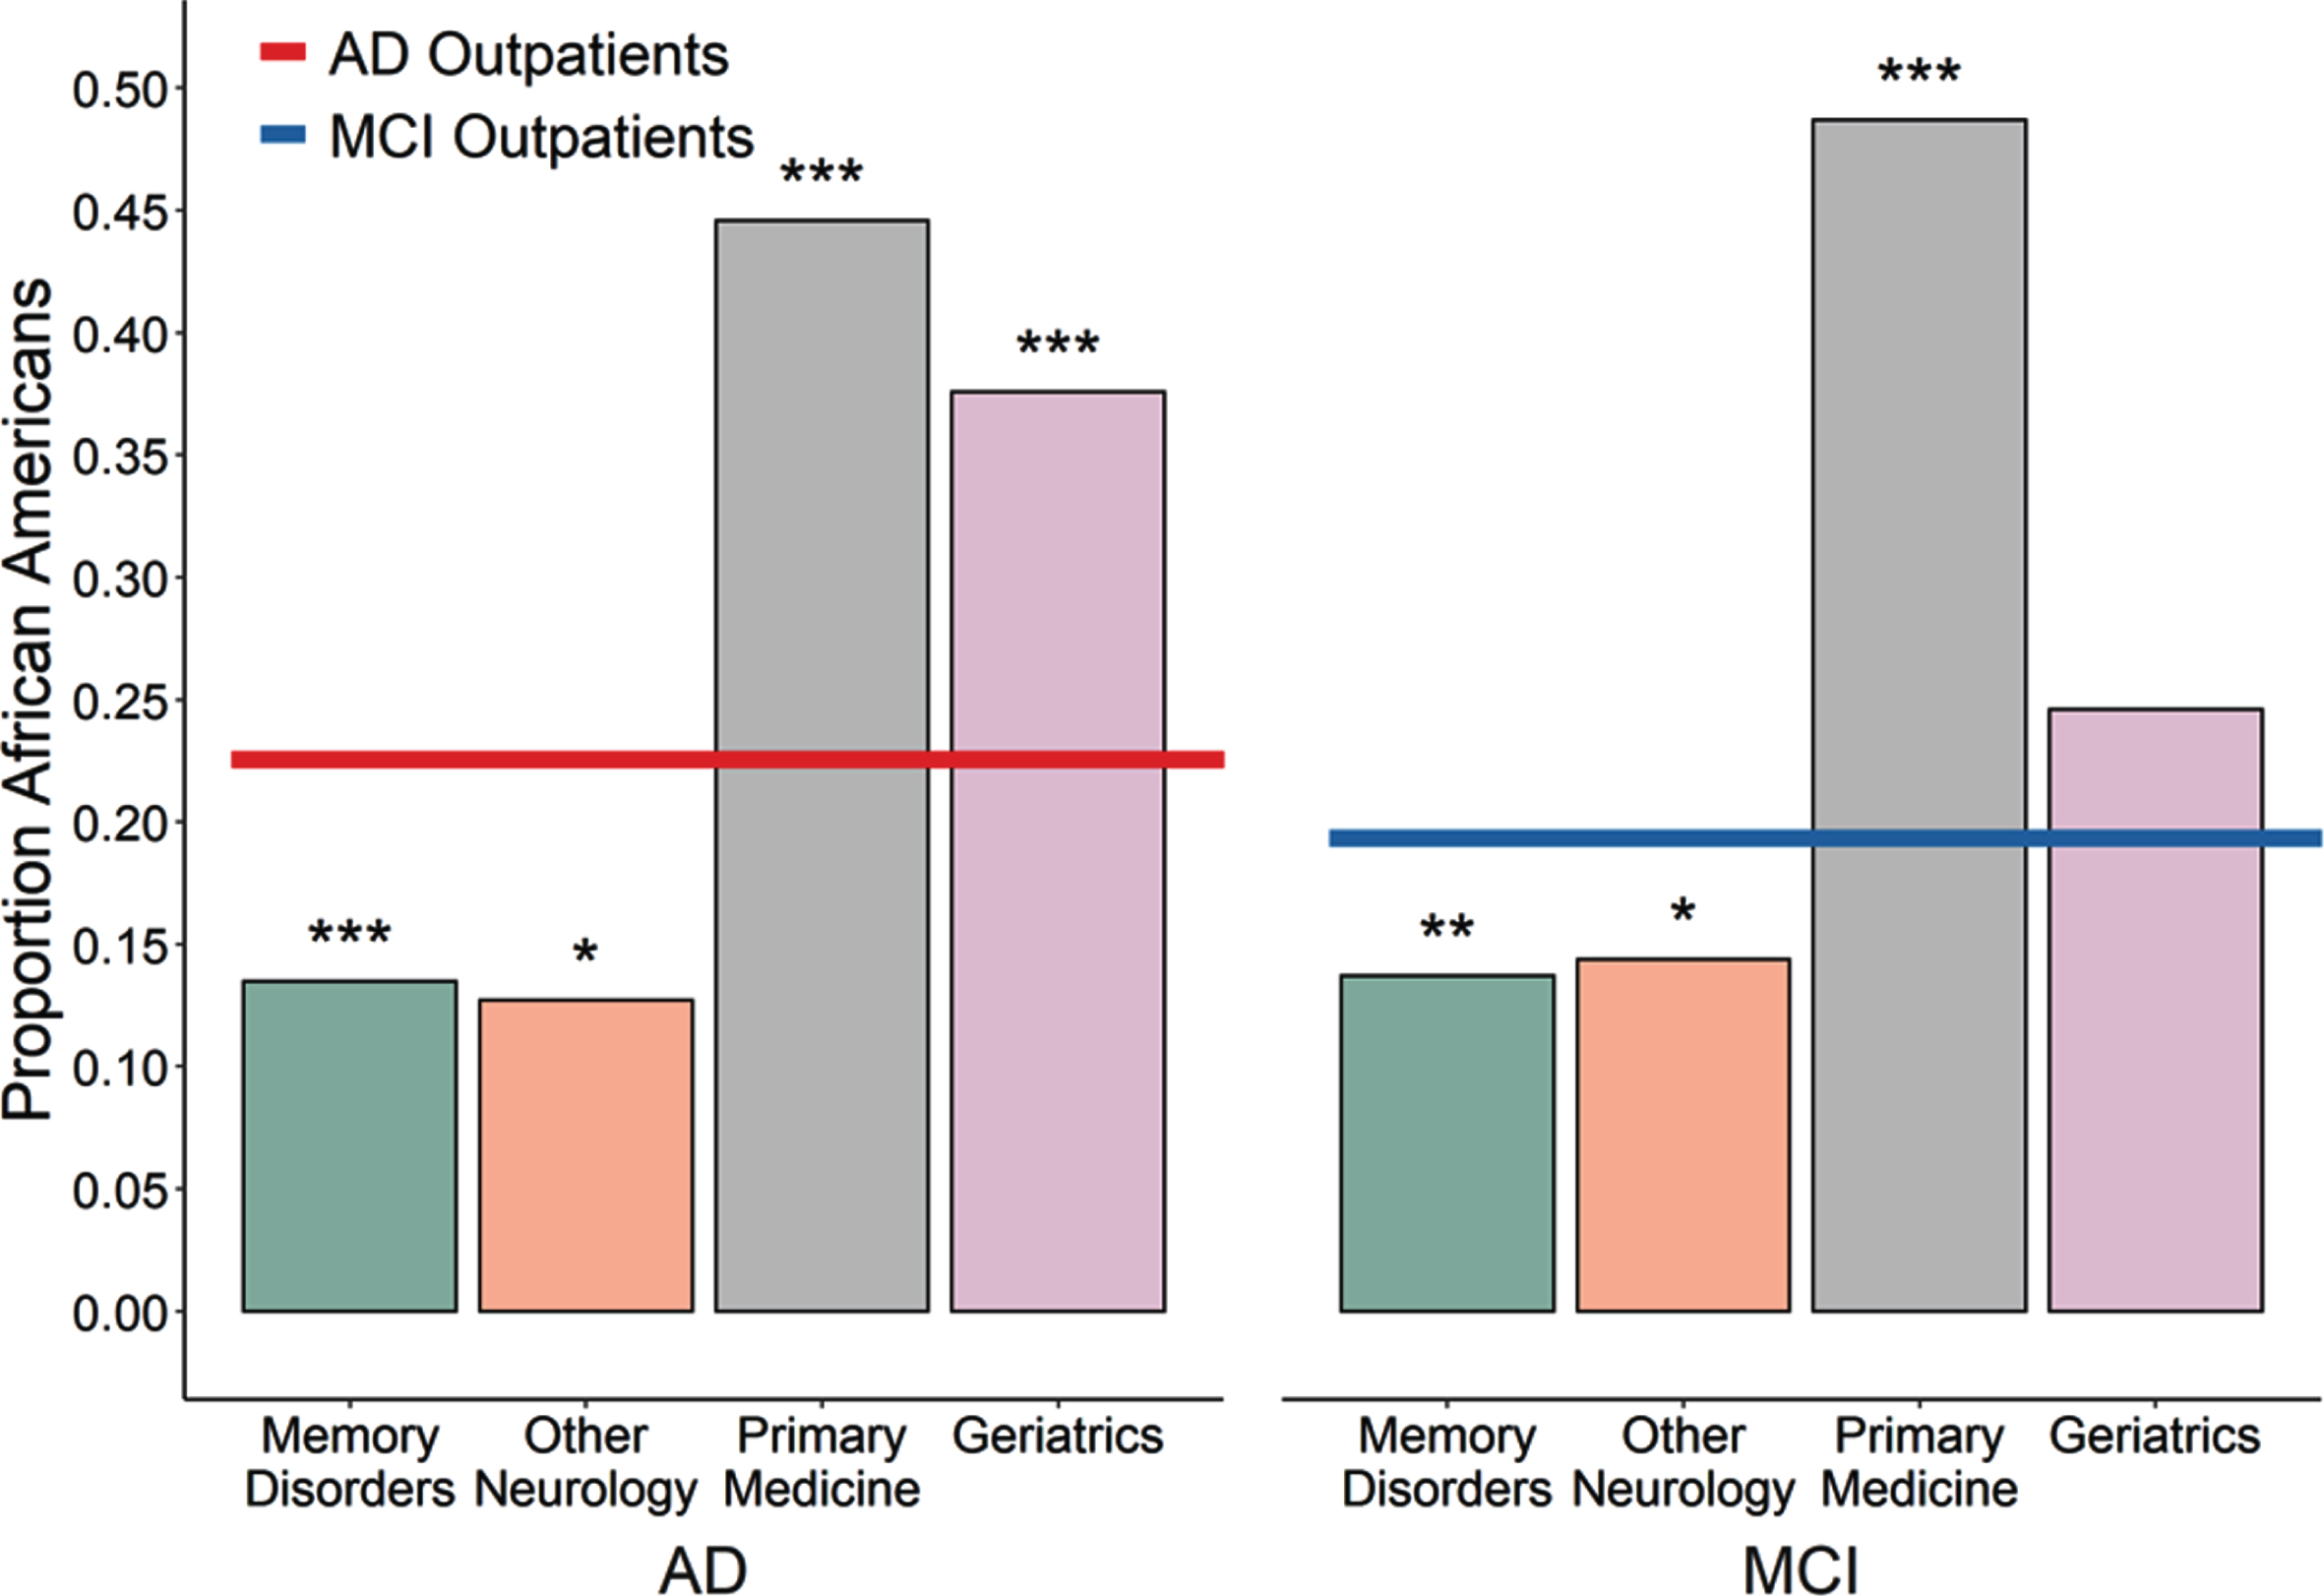
Among patients seen for a primary diagnosis of AD, African Americans were underrepresented in the Memory Disorders and Other Neurology clinics but overrepresented in the Primary Medicine and Geriatrics clinics relative to the African American proportion of outpatients with AD (Table 2, Fig. 2). The same pattern was observed when examining outpatients seen for MCI or when grouping both AD and MCI (Table 2). Thus, African Americans with AD or MCI are more likely to see providers in Geriatrics or other primary care settings than in the Memory Disorders or Other Neurology specialty settings.
Fig.2
Proportion of unique outpatients seen in various settings with a primary diagnosis of AD or MCI who were African American. Left, The African American proportion of outpatients seen for AD within the Memory Disorders specialty clinic or in other Neurology clinics was less than the proportion seen for AD outpatients across the entire medical system (red line, 22.5%; p < 0.0001 and p = 0.0081 respectively) while the proportion seen within the Primary Medicine and Geriatrics clinics was greater than expected (both p < 0.0001). Right, A similar pattern held for outpatients seen for MCI, with African Americans also underrepresented in the Memory Disorders and other Neurology clinics (p = 0.0007 and p = 0.0036 respectively) and overrepresented in the Primary Medicine clinic (p < 0.0001) with a trend towards overrepresentation in the Geriatrics clinic (p = 0.029), relative to enterprise-wide average (blue line, 19.3%).
Differences in imaging orders between clinics
To determine if racial differences in the clinics where patients are evaluated could contribute to the observed underutilization of AD-related PET imaging in African Americans, we compared orders for these imaging studies across the various outpatient settings to the enterprise-wide rates (Table 3). As expected, AD-related PET imaging was much more likely to be ordered by Memory Disorders providers than by providers in any other outpatient setting. Amyloid-PET was ordered exclusively in the Memory Disorders clinic (Table 3) and FDG-PET was also ordered more commonly in the Memory Disorders clinic compared to the Other Neurology, Primary Medicine, and Geriatrics clinics (Table 3). Since Memory Disorders clinic providers were more likely to order AD-related PET imaging, the fact that African Americans were less frequently seen in this clinic is a potential reason that they were less likely, at an enterprise-wide level, to have these tests.
Table 3
Neuroimaging for Alzheimer’s disease and mild cognitive impairment outpatients by race and clinic
| Neuroimaging | Total patients | African American | Non-Hispanic white | p* |
| Enterprise-wide outpatients | ||||
| AD/MCI patients | 3,072 | 651 | 2,421 | |
| Amyloid PET | 40 (1.2%) | 3 (0.5%) | 37 (1.5%) | 0.023 |
| FDG-PET | 94 (2.8%) | 14 (2.2%) | 80 (3.3%) | 0.15 |
| Brain MRI | 979 (28.7%) | 211 (32.4%) | 768 (31.7%) | 0.74 |
| Memory Disorders | ||||
| AD/MCI patients | 1,047 | 151 | 896 | |
| Amyloid PET | 40 (3.3%) | 3 (2.0%) | 37 (4.1%) | 0.26 |
| FDG-PET | 71 (5.8%) | 7 (4.6%) | 64 (7.1%) | 0.30 |
| Brain MRI | 376 (30.8%) | 69 (45.7%) | 307 (34.2%) | 0.0078 |
| Other Neurology | ||||
| AD/MCI patients | 783 | 112 | 671 | |
| Amyloid PET | 0 (0%) | 0 (0%) | 0 (0%) | - |
| FDG-PET | 19 (2.2%) | 2 (1.8%) | 17 (2.5%) | 0.69 |
| Brain MRI | 338 (38.8%) | 62 (55.4%) | 276 (41.1%) | 0.0054 |
| Primary Medicine | ||||
| AD/MCI patients | 311 | 149 | 162 | |
| Amyloid PET | 0 (0%) | 0 (0%) | 0 (0%) | - |
| FDG-PET | 4 (1.2%) | 1 (0.7%) | 3 (1.9%) | 0.41 |
| Brain MRI | 71 (22.0%) | 42 (28.2%) | 29 (17.9%) | 0.042 |
| Geriatrics | ||||
| AD/MCI patients | 616 | 196 | 420 | |
| Amyloid PET | 0 (0%) | 0 (0%) | 0 (0%) | - |
| FDG-PET | 1 (0.2%) | 0 (0%) | 1 (0.2%) | - |
| Brain MRI | 58 (9.1%) | 21 (10.7%) | 37 (8.8%) | 0.46 |
*p values are from conditional maximum likelihood or median unbiased exact tests comparing the proportions of African American AD/MCI patients receiving each type of neuroimaging to the proportion of non-Hispanic white patients receiving the same imaging, within each clinical setting. Data presented as counts (percentages of the AD/MCI patients). AD, Alzheimer’s disease; MCI, mild cognitive impairment; PET, positron emission tomography; FDG, fluorodeoxyglucose; MRI, magnetic resonance imaging.
We next asked whether there were racial differences in neuroimaging utilization within each clinic. When comparing the PET imaging rates between African Americans and other groups within clinics, no racial discrepancies were observed. Within the Memory Disorders clinic, African Americans were not less likely to receive amyloid-PET or FDG-PET when compared to non-Hispanic whites (Table 3, Fig. 3). Although FDG-PET for AD was less frequent in the other outpatient settings, those clinics also did not show a difference in the imaging rates between African Americans and non-Hispanic whites. Although African American outpatients were less like to receive FDG-PET when considered across the entire medical system (Table 1, Fig. 1), no statistical difference was observed when focusing on these four specialist and primary care clinical settings (Table 3, Fig. 3). Therefore, although Memory Disorders specialists were more likely to order AD-related PET images compared to other outpatient settings, there were no differences in PET orders within any of the clinics according to race.
Fig.3
Proportion of AD/MCI outpatients who received AD FDG-PET (left) and brain MRI (right) in each clinical setting subset by race. Regardless of race, outpatients with AD/MCI seen by Memory Disorders or other Neurology clinics were more likely to receive a brain MRI for AD than in the Primary Medicine or Geriatrics clinics or when compared to the entire medical system (all p < 0.0001, p-values not shown on plot). Outpatients seen in Memory Disorders were also more likely to receive AD FDG-PET when compared to any other clinical setting. Within each clinic, there was no difference in the African American proportion of AD/MCI patients who received FDG-PET and non-Hispanic white patients. This was also no difference when evaluating racial differences in brain MRI for the Primary Medicine or Geriatrics or when considering all AD/MCI outpatients across the entire medical system. However, African American outpatients with AD/MCI were much more likely to receive a brain MRI for AD within the Memory Disorders clinic or other Neurology clinics compared to non-Hispanic white AD/MCI outpatients (p = 0.0078 and p = 0.0054 respectively). This is hypothesized to reflect that fewer African Americans had outside imaging prior to their visits with the specialty providers.
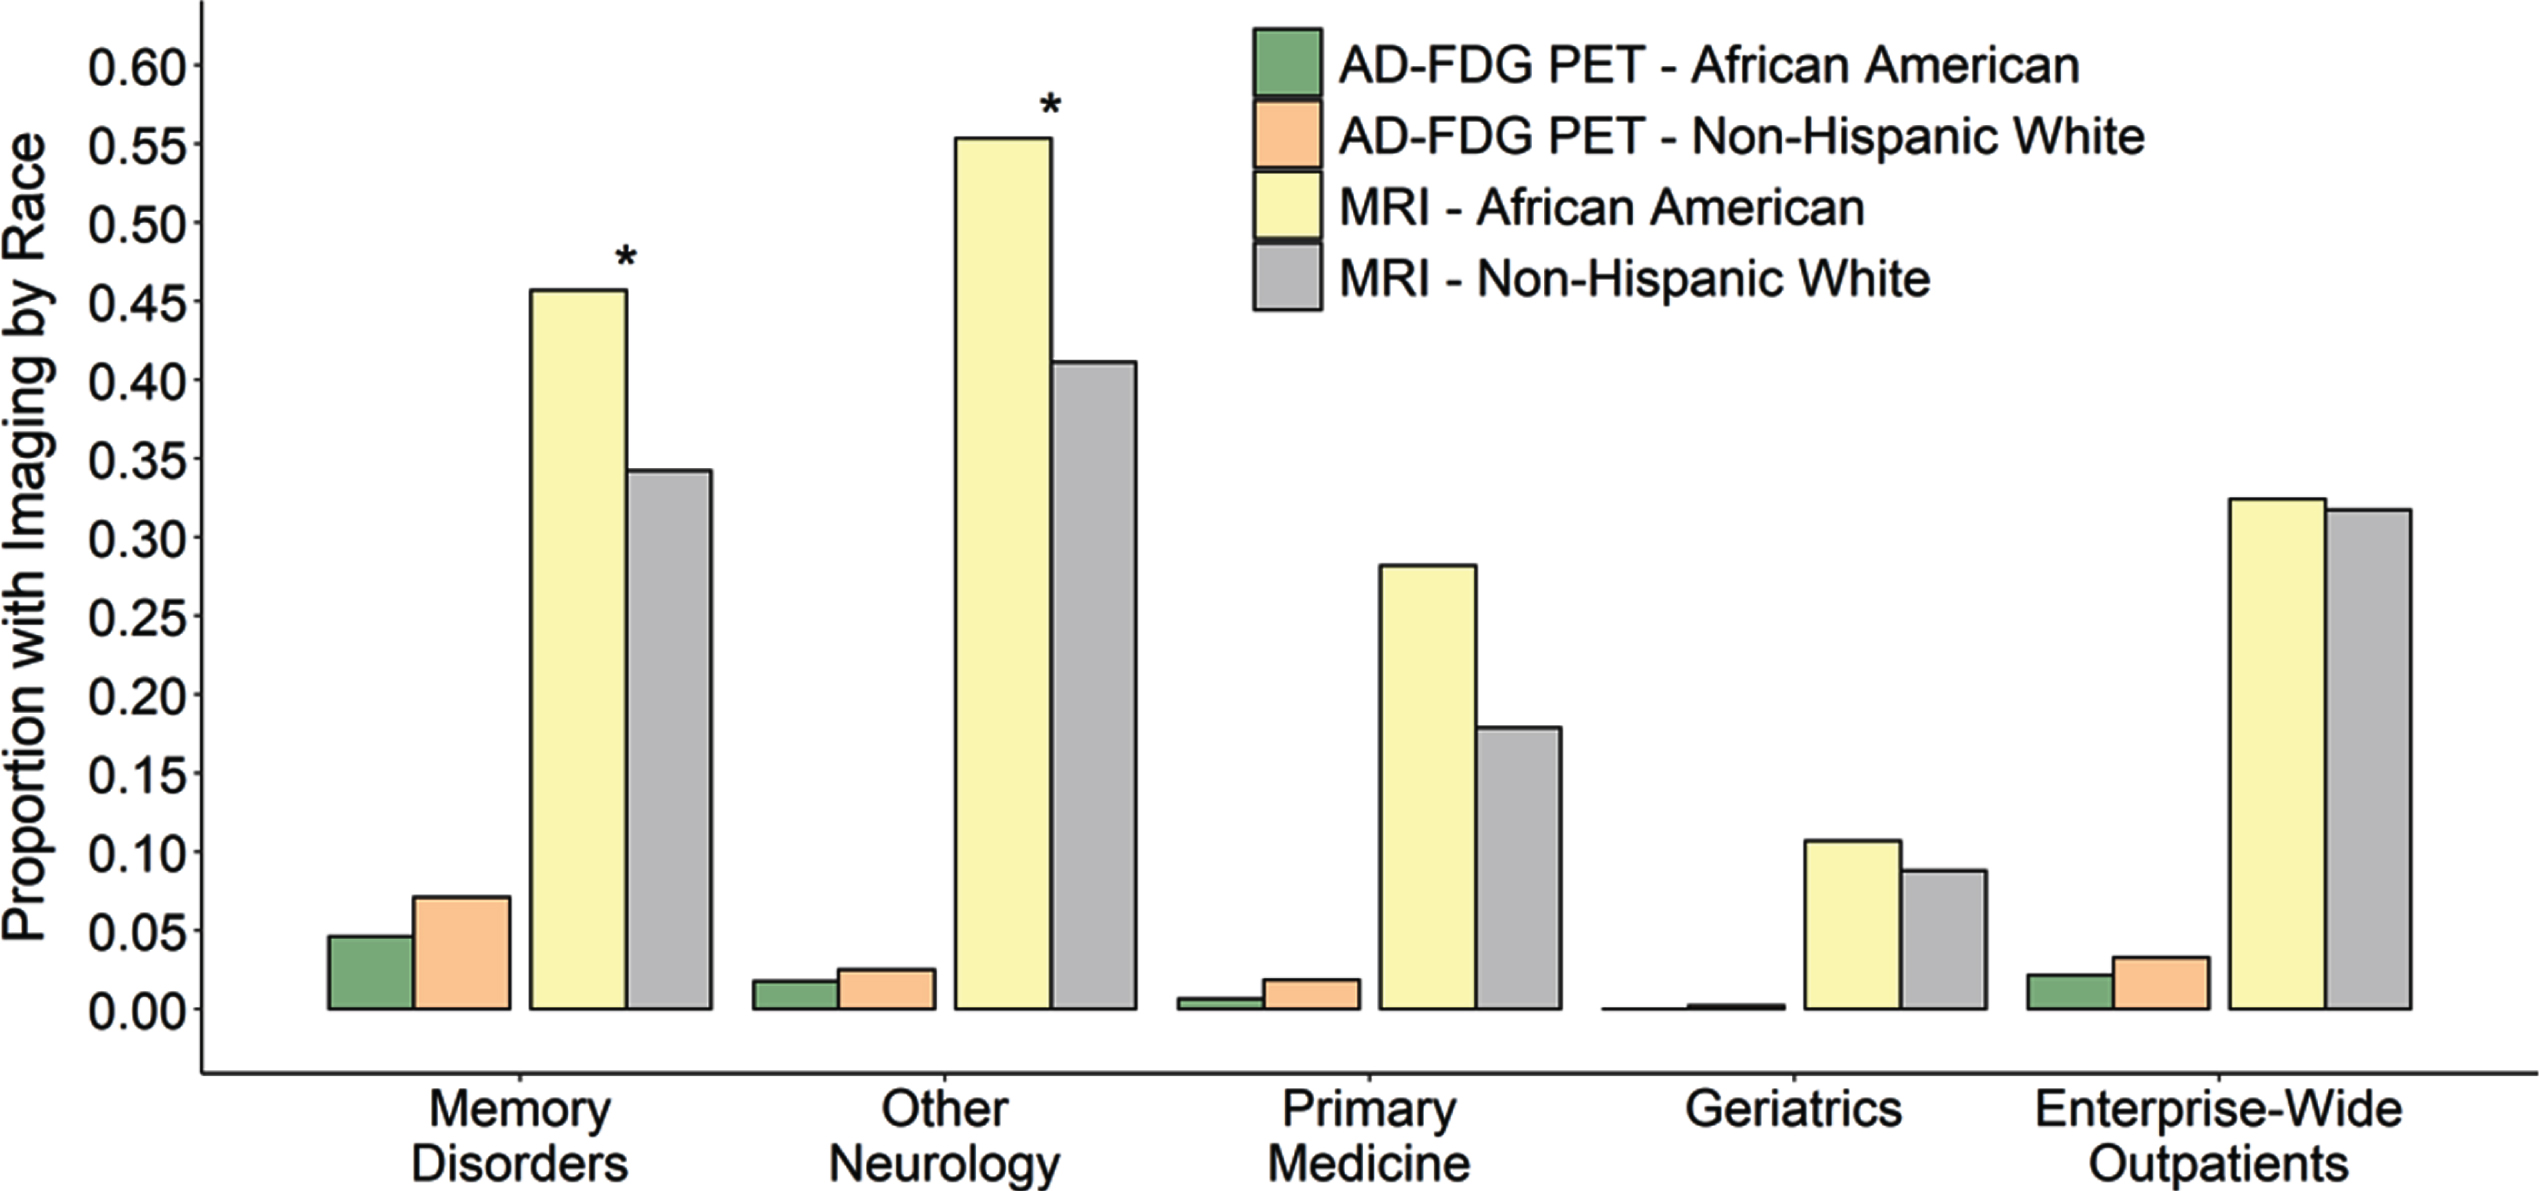
Given the lower rate of encounters of African Americans in the Memory Disorders and Other Neurology clinics, we also asked whether there were other differences besides PET imaging utilization in the evaluation or treatment of AD/MCI between the subspecialty and primary clinics. Much like with PET imaging, providers in the Memory Disorders and Other Neurology clinics were more likely to order brain MRI than those in primary care settings (Table 3, Fig. 3). We also examined MRI ordering patterns within clinics to check for racially based distinctions. African Americans were actually more likely to have a brain MRI when evaluated in either Memory Disorders or the Other Neurology clinics, with a similar but non-significant trend in Primary Medicine (Table 3, Fig. 3). This could reflect the fact that fewer African Americans had outside imaging prior to their visits with UAB providers. Therefore, African American AD/MCI patients are no less likely to receive brain MRI imaging for AD/MCI regardless of which clinic setting they are evaluated in.
Differences in AD medication use
Given the differences in neuroimaging utilization between the clinics, we next evaluated the use of FDA-approved AD medications (donepezil, rivastigmine, galantamine, or memantine). Notably, when examined enterprise-wide across all specialty and primary care settings, African American outpatients with AD/MCI were less likely to be using at least one of these AD medications than non-Hispanic white outpatients with AD/MCI (Table 4, Fig. 4). This was also true when examining donepezil or memantine use individually. As this was similar to the enterprise-wide pattern we had observed with AD-related PET neuroimaging, we hypothesized that this may also be associated with the previously noted demographic differences between clinics and examined AD medication use within the four outpatient clinic settings. As expected, Memory Disorders clinic patients were more likely to be on donepezil, memantine, or any of the four AD medications than outpatients seen exclusively by the Other Neurology, Primary Medicine, or Geriatrics clinics (Table 4, Fig. 4). Given that African Americans were less likely to be evaluated in Memory Disorders clinic, this could contribute to their enterprise-wide lower rate of AD medication use.
Table 4
FDA-approved AD Medication use by clinic setting
| Medication | Total patients | African American | Non-Hispanic white | p |
| Enterprise-wide outpatients | ||||
| AD/MCI patients | 3,072 | 651 | 2,421 | |
| Donepezil | 1,243 (40.5%) | 231 (35.5%) | 1,012 (41.8%) | 0.0035 |
| Memantine | 592 (19.3%) | 81 (12.4%) | 511 (21.1%) | <0.0001 |
| Any AD medication | 1,607 (52.3%) | 277 (42.5%) | 1,330 (54.9%) | <0.0001 |
| Memory Disorders | ||||
| AD/MCI patients | 1,047 | 151 | 896 | |
| Donepezil | 565 (54.0%) | 83 (55.0%) | 482 (53.7%) | 0.85 |
| Memantine | 291 (27.8%) | 25 (16.6%) | 266 (29.7%) | 0.0008 |
| Any AD medication | 724 (69.1%) | 96 (63.6%) | 628 (70.1%) | 0.12 |
| Other Neurology | ||||
| AD/MCI patients | 783 | 112 | 671 | |
| Donepezil | 175 (22.3%) | 28 (25.0%) | 147 (21.9%) | 0.46 |
| Memantine | 68 (8.7%) | 5 (4.5%) | 63 (9.4%) | 0.10 |
| Any AD medication | 249 (31.8%) | 32 (28.6%) | 217 (32.3%) | 0.44 |
| Primary Medicine | ||||
| AD/MCI patients | 311 | 149 | 162 | |
| Donepezil | 106 (34.1%) | 46 (30.9%) | 60 (37.0%) | 0.28 |
| Memantine | 41 (13.2%) | 14 (9.4%) | 27 (16.7%) | 0.066 |
| Any AD medication | 122 (39.2%) | 52 (34.9%) | 70 (43.2%) | 0.16 |
| Geriatrics | ||||
| AD/MCI patients | 616 | 196 | 420 | |
| Donepezil | 225 (36.5%) | 64 (32.7%) | 161 (38.3%) | 0.18 |
| Memantine | 124 (20.1%) | 27 (13.8%) | 97 (23.1%) | 0.0070 |
| Any AD medication | 302 (49.0%) | 83 (42.3%) | 219 (52.1%) | 0.024 |
Data presented as counts (percentages) with patient percentages taken out of racial subset total for each clinic setting; p values taken from conditional maximum likelihood exact tests comparing African American proportions to non-Hispanic white proportions within each clinical setting. Any AD medication includes donepezil, rivastigmine, galantamine, or memantine. AD, Alzheimer’s disease; MCI, mild cognitive impairment.
Fig.4
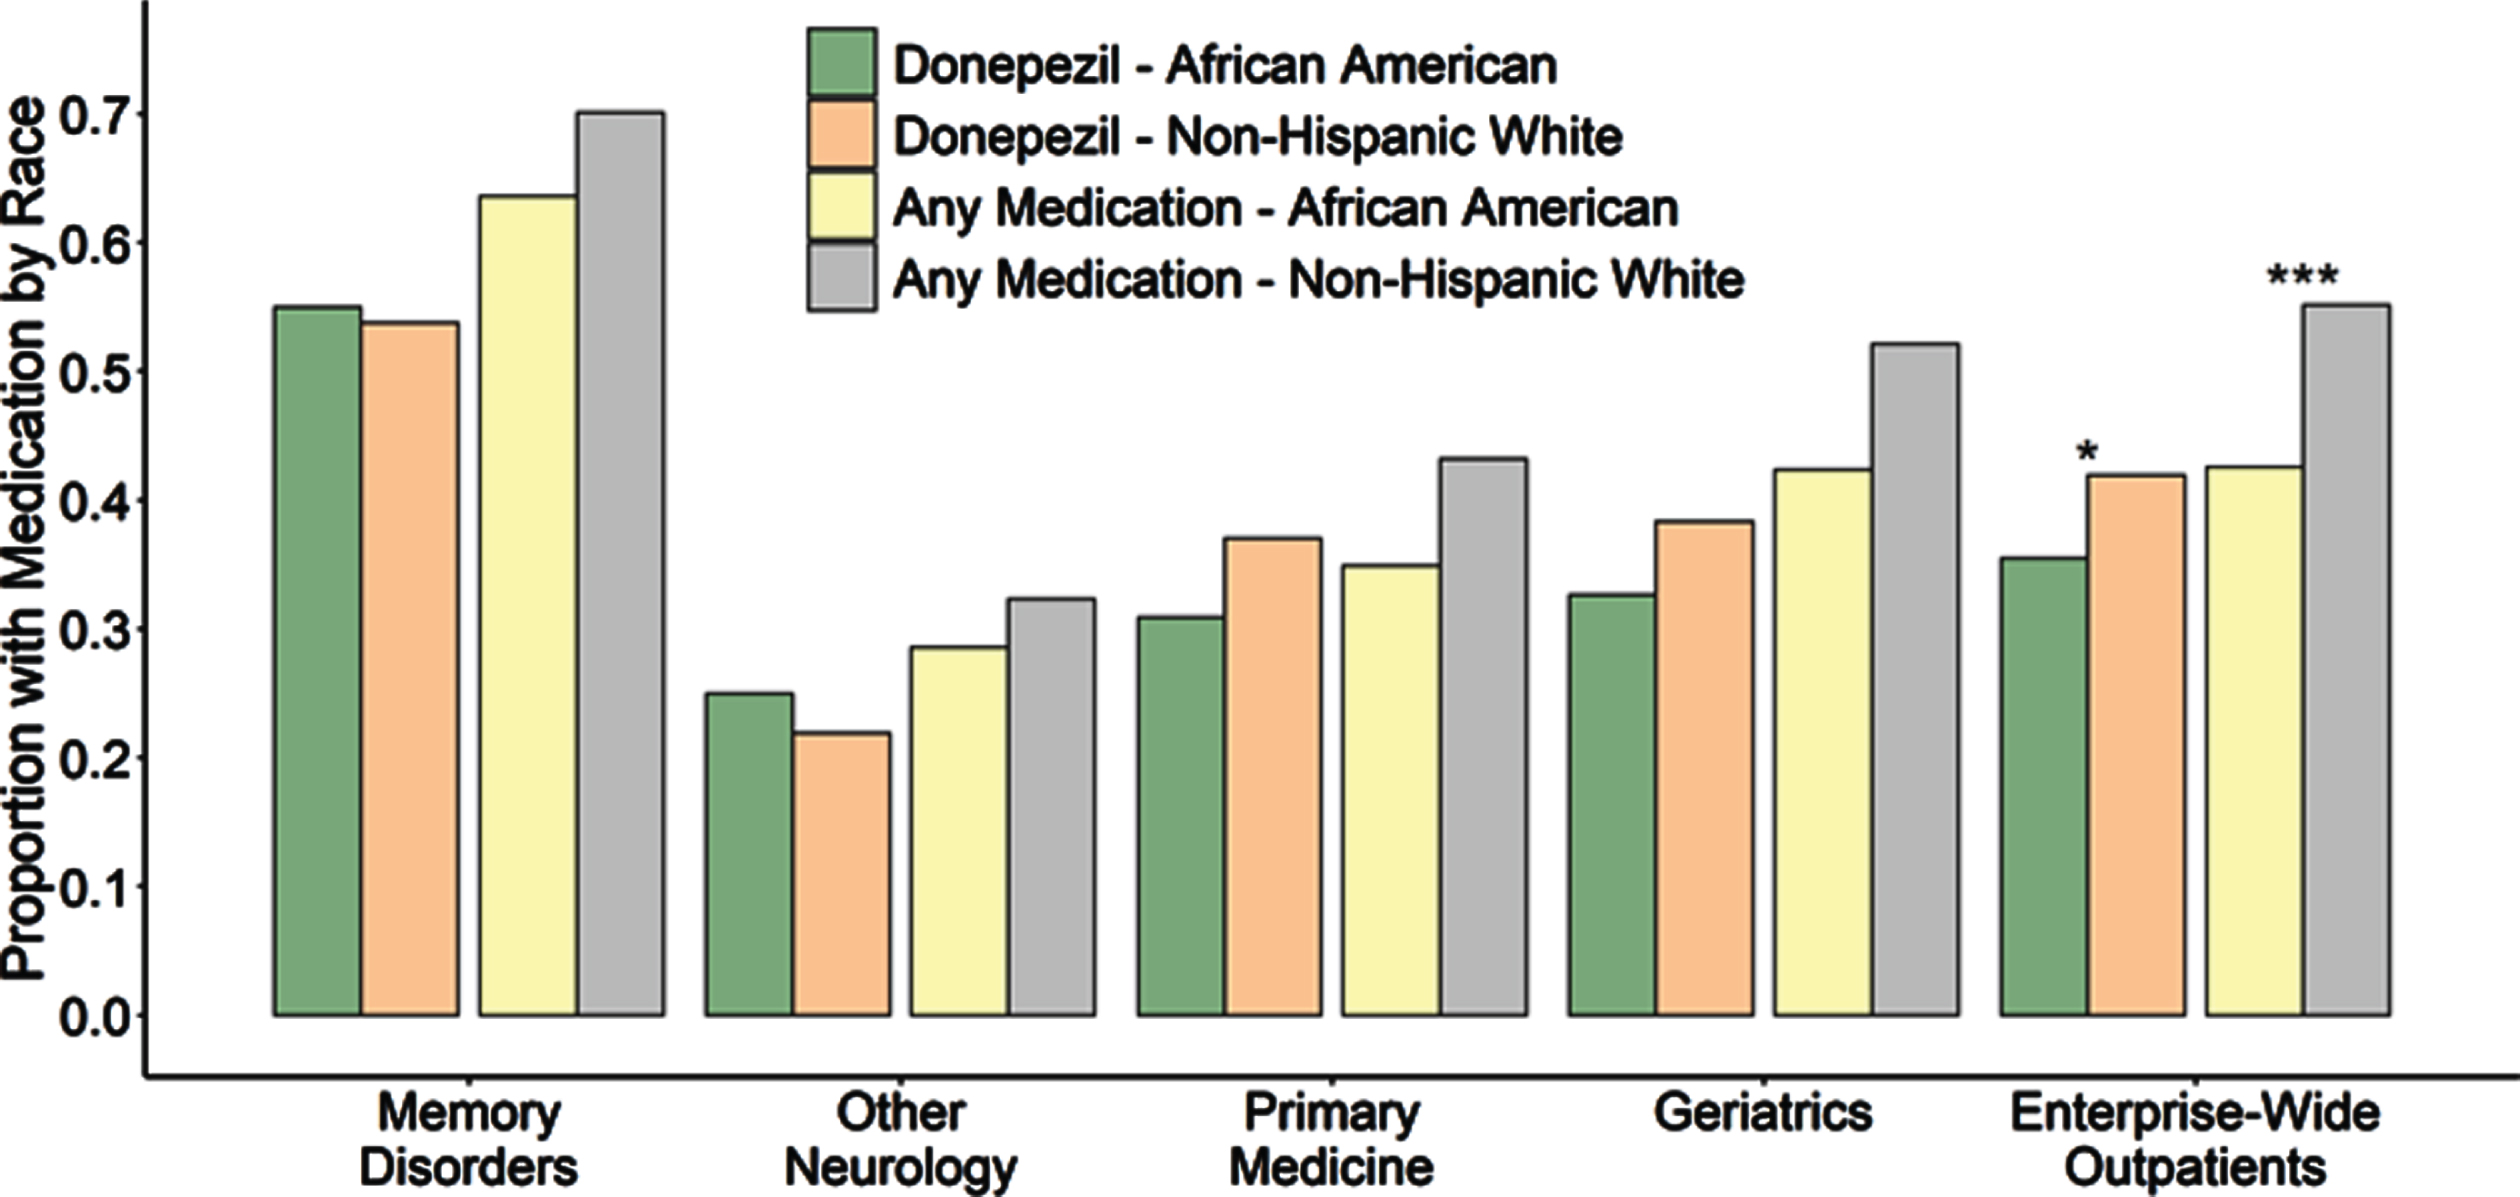
Proportion of AD/MCI outpatients with prescriptions for donepezil individually (left) as well as combined with other FDA-approved AD treatments including galantamine, rivastigmine and memantine (right), subset by race and clinic. Outpatients seen by Memory Disorders specialists were significantly more likely to be using an antidementia medication compared to any other outpatient clinical setting individually or the entire medical system (p < 0.0001 for donepezil or all four FDA-approved medications for all settings, p-values not shown on plot). Within individual clinics, the African American proportion of AD/MCI patients using donepezil did not differ from the non-Hispanic white proportion of AD/MCI patients using donepezil or for any FDA-approved antidementia medication at any of the centers. However, due to the racial underrepresentation of African American AD/MCI outpatients in specialty settings and higher overall medication usage in Memory Disorders, both donepezil and overall medication use by African American AD/MCI patients was observed to be significantly lower than use by non-Hispanic whites when examined across the entire medical enterprise (p = 0.0035 and p < 0.0001 respectively). Although not indicated on this plot, memantine use for moderate to severe AD was lower for African Americans compared to non-Hispanic whites in Memory Disorders (p = 0.0008) and the Geriatrics clinics (p = 0.0070) as well as across the entire medical enterprise (p < 0.0001) when considered for all AD/MCI outpatients. However, within Memory Disorders, when specifically considering outpatients with Alabama Brief Cognitive Screener (ABCs) scores less than 14, indicative of moderate AD, there was no difference in the proportion of African Americans using memantine (37.0%) compared to non-Hispanic whites using the drug (45.1%, p = 0.53).
Next, we examined prescribing patterns within each clinic for racial differences. As we saw with neuroimaging, when examined within clinics by race, none of the outpatient settings showed a difference in use of donepezil or of any FDA-approved AD medication (Table 4, Fig. 4). The only difference we observed was that in the Memory Disorders and Geriatrics clinics, African American AD/MCI outpatients were less likely to use memantine than non-Hispanic whites (Table 4, Fig. 4). Because memantine has not been shown to be effective in mild AD [34] and the original trials supporting its efficacy were in patients with MMSE scores of 13 or less [35], these clinics generally use memantine only when patients reach this range on the Alabama Brief Cognitive Screener (ABCs), a similar measure [36]. Therefore, we hypothesized a difference in memantine prescribing could be due to a proportional difference in the racial background of such patients in more severe stages of AD with lower ABCs scores. This idea was supported when specifically considering Memory Disorders outpatients with ABCs score less than 14, indicative of moderate to severe AD. Among these more disabled patients, the proportion of African Americans using memantine (37.0%) did not differ from the proportion of non-Hispanic whites (43.6%, p = 0.60).
No differences in insurance coverage
Finally, we examined whether there were differences in insurance coverage that could contribute to the observed differences in encounter patterns, neuroimaging, and medication usage. However, the African American proportion of AD/MCI outpatients with encounters covered by federally funded or commercial insurance programs was not statistically different from the non-Hispanic white proportion, both enterprise-wide and within each outpatient clinical setting (Table 5). Regardless of race, nearly all AD/MCI outpatients had at least some level of coverage, with over 90% having insurance pay for a given encounter (Table 5) which was not different between clinics. Procedurally, insurance coverage is not a motivating factor for any specialty clinic nor primary settings at this institution; none of the clinics screen patient referrals according to insurance type and all clinics have financial assistance programs. Taken together, these results suggest the reason these patients are being seen by primary providers instead of specialists is not because of a difference in coverage.
Table 5
Insurance coverage use by clinic setting
| Medication | Total patients | African American | Non-Hispanic white | p |
| Enterprise-wide outpatients | ||||
| AD/MCI patients | 3,072 | 651 | 2,421 | |
| Covered | 2,855 (92.9%) | 596 (91.6%) | 2,259 (93.3%) | 0.13 |
| Memory Disorders | ||||
| AD/MCI patients | 1,047 | 151 | 896 | |
| Covered | 987 (94.3%) | 140 (92.7%) | 847 (94.5%) | 0.34 |
| Other Neurology | ||||
| AD/MCI patients | 783 | 112 | 671 | |
| Covered | 737 (94.1%) | 105 (93.8%) | 632 (94.2%) | 0.83 |
| Primary Medicine | ||||
| AD/MCI patients | 311 | 149 | 162 | |
| Covered | 283 (91.0%) | 135 (90.6%) | 148 (91.4%) | 0.85 |
| Geriatrics | ||||
| AD/MCI patients | 616 | 196 | 420 | |
| Covered | 566 (91.9%) | 177 (90.3%) | 389 (92.6%) | 0.34 |
Data presented as counts (percentages) with patient percentages taken out of racial subset total for each clinic setting; p values taken from conditional maximum likelihood exact test comparing African American proportions to non-Hispanic white proportions within each clinical setting. Covered patients had insurance coverage under either federally funded (Medicare A/B, Medicaid, Champus) or commercial programs. AD, Alzheimer’s disease; MCI, mild cognitive impairment.
DISCUSSION
Utilizing the enterprise-scale clinical informatics tool i2b2, this study is the first of its kind to directly assess racial differences in the evaluation and treatment of patients with AD/MCI across an entire medical system. Although African Americans with AD/MCI were not underrepresented overall across the medical system, there were differences in the outpatient setting where they were treated. Specifically, African Americans were more likely to be seen in primary care settings such as Primary Medicine or Geriatrics and less likely to be seen in the Memory Disorders specialty or Other Neurology clinics, where providers ordered more AD-related PET imaging and medications. While there were no racial differences within any of the clinics in terms of imaging or medication orders, when looking across the entire medical enterprise, African Americans were less likely to have AD-related PET imaging or to be on FDA-approved AD medications.
An initial question was whether African Americans were underrepresented at this academic medical center in general relative to the surrounding Birmingham Metropolitan area. The proportion of unique patients with in-person visits to the UAB Medicine system who identified as African American (27.5%) was not different from the proportion of African Americans in the Birmingham metropolitan area (27.7%) [37]. We next looked specifically at those seen for AD or MCI, comparing to the proportion of African Americans in the metropolitan area age 65 and older (21.4%) since these are age-associated diagnoses. For both AD and MCI, the proportion of patients who were African American (24.0% and 23.8%, respectively) was actually somewhat higher than that of the metro population (Table 1) while there was no difference for AD or MCI outpatients (20.7% and 20.1%, respectively). This indicates that African Americans with AD and MCI are not underrepresented in this academic medical system and this was not an apparent element in the observed racial differences.
It is also important to note that the driving factor for the differences in PET neuroimaging and AD medication usage was not any discrepancy in provider treatment between African Americans and non-Hispanic whites, as there were no racial differences within any of the clinic settings examined. Rather, the enterprise-wide differences in imaging and medication use may at least in part be a consequence of the underrepresentation of African Americans seen in the Memory Disorders specialty clinic where these orders were more common. As the largest medical provider in Alabama and one of the most expansive in the Deep South, UAB has numerous clinics serving AD patients [38]. However, not all clinics provide the same types of care. AD-related PET imaging often requires an order from a memory disorders specialist, unlike more widely utilized imaging evaluations such as brain MRI; in addition, there are limitations for reimbursement by CMS and private insurers, particularly for amyloid-PET [3]. Furthermore, prior research has shown that FDA-approved AD medication use is much more likely when patients are seen by memory care specialists instead of primary providers alone [39, 40]. These same clinic-based patterns were observed here as well regardless of racial background: the Memory Disorders clinic ordered all of the amyloid-PET and nearly all AD FDG-PET imaging, and had a higher likelihood of using an FDA-approved medication when compared to the other outpatient settings including Other Neurology clinics, Primary Medicine, and Geriatrics clinics. Underrepresentation within the specialty clinics where these orders are more common is likely a factor in the lower rate of PET imaging and AD medication use among African Americans.
Other observations further reinforced the role of underrepresentation as opposed to racial differences in orders within any of the four clinics. Neither the Geriatrics nor Primary Medicine clinics had a statistical difference between the proportion of African Americans patients being seen for AD/MCI and those patients who received a brain MRI and, in fact, African Americans were more likely to receive a brain MRI when seen exclusively by Other Neurology providers. In addition, although patients seen at the other outpatient settings were less apt to be using FDA-approved AD medications overall, within each clinic African American AD/MCI patients were equally likely to be using these treatments, with the unique exception of memantine which was likely related to differences in the prevalence of moderate to severe AD, the indication for memantine. Still, when all the evaluated clinics across the medical system were considered jointly, racial underrepresentation for medication use became statistically manifest. Thus, one possibility is that African American underrepresentation in the specialty clinics where these medications are more commonly ordered leads to an enterprise-wide difference. This difference in medical visits to specialists has been previously considered such as when ethnic differences in acetylcholinesterase inhibitor use for AD were observed in California AD Research Centers [41]. Another possibility noted in prior studies of racial differences in anti-dementia medication use is that African Americans initiated medication use at a similar rate to Non-Hispanic whites but were more likely to discontinue use within the first year, for reasons that require further study to determine [9].
An important question to arise from this study is why African American patients are more likely to receive treatment for AD and MCI from primary care providers than from memory disorders or other neurological specialists. Over the three-year window, over twice as many African Americans seen for AD/MCI had encounters in the Geriatrics and Primary Medicine clinics than in the Memory Disorders specialty clinic (345 primary care versus 151 specialty care). Although the current analysis using i2b2 cannot determine the cause of this underrepresentation, it can give some insight. Health insurance was not the driving force, as there were no racial differences in coverage rates for any of the clinical settings. Over 90% of all African American AD/MCI patients had some sort of insurance coverage pay for their encounters regardless of the department which was not statistically different from the proportion of non-Hispanic whites with coverage. Therefore, the motivation for this racial underrepresentation within the specialty settings did not appear to be coverage discrepancies. Furthermore, the fact that we found no racial differences in how individual clinics ordered imaging (Table 3) or medications (Table 4) for AD/MCI would seem to make it unlikely that there are systematic racial differences in patterns of specialist encounters or referrals.
Prior research has identified several factors that could lead to African American underrepresentation in specialist clinics. First, the stage of disease at which patients first present for care may be a factor. There is evidence that African Americans are more likely to present in later stages of AD [18, 42, 43]. Primary care clinics may be comfortable in diagnosing and treating AD at these later stages, when the diagnosis is clear, but more likely to refer to a specialist at earlier stages when the classic picture is not fully manifest and a thorough evaluation is desired [39, 44]. Second, patient preference could be a factor, as there are recognized social and cultural differences that affect perception of AD and the types of healthcare service sought to treat it [3, 45, 46]. Cultural competency, a historic desire for community-based support, and concerns of medical trust and familiarity may lead African American patients to seek services from well-known and established sources with whom they already have an recognized relationship, directly influencing health outcomes [12, 47–49]. Third, less awareness or information could prevent patients from being cognizant of available resources provided even within the same health system [6, 9, 50]. Finally, African American patients may seek dementia treatment for alternative reasons, for example, with an emphasis on support for caregivers, including both social support and formal services, rather than direct treatment provided to the patients [49, 51, 52]. Primary care settings such as Geriatrics are often well suited for these goals and can address the primary concerns and needs of the patients and their families.
There are limitations to the current analysis. Although i2b2 is a powerful tool for cohort detection, it is limited to the information contained within the medical record system of the host institution. This limits its ability to further refine searches for more detailed clinical information such as cognitive assessments or other measures if those are not searchable within the system. Such data could be a valuable resource to stratify patients to better identify differences in the disease evaluation and service care provided by the various clinics treating AD/MCI patients. Similarly, studies such as this are restricted by the amount of information i2b2 returns. This analysis was based on patient counts stratified by demographic and clinical data, but individual-level patient data was not available such that more refined and informative multivariate methods were infeasible. By extension, the intersection of treating department alongside imaging or medication use under the i2b2 implementation used in this study does not allow for identification of which providers gave the orders for treatment or evaluation. However, the fact that we limited the primary care group to patients who were not seen later by the Memory Disorders clinic strongly implies their dementia care orders came from primary providers. Finally, precise documentation of encounters with respect to diagnoses and treating clinic could also lead to some sensitivity issues when using i2b2. As mentioned, excluding patients who were referred to Memory Disorders but were given a more refined diagnosis other than AD or MCI would not be included in the patient counts for non-specialist settings. However, these patients would also be less apt to receive orders specific to AD/MCI. In addition, a setting issue which could arise may identify AD patients who are seen by the Memory Disorders clinic but are listed as being treated by the general Neurology department. However, this possibility was addressed by expanding the search across all Neurology divisions. These results indicated there was still a reduction in the expected proportion of African Americans with AD/MCI being seen and issues with the medical record system cannot solely explain this persistent underrepresentation at specialist clinics. However, it is also important to cite the benefits of using the i2b2 system for this kind of study. Most notably, i2b2 queries incorporate data from all patient encounters in the medical system instead of a small sampling. This allows for a comprehensive evaluation of patterns of evaluation, treatment and payment taken directly from encounter records making this a powerful investigational tool.
These limitations are also opportunities for several potential avenues for future studies. Increased levels of access to these enterprise-level tools would be especially valuable, allowing for more detailed models which could better inform the racial differences we have currently observed. In addition to the clear benefit of patient clinical and demographic data at the individual level, there would also be the prospect of evaluating specific patient-provider associations which may inform certain aspects of treatment-seeking behavior. Inclusion of neuroimaging obtained for research instead of clinical care may also further refine rate estimates although cursory examination within the Memory Disorders clinic indicated similar proportions of African American and non-Hispanic whites. Finally, there has been expansion of telemedicine during the COVID-19 pandemic, including the specialty clinics, which is tracked in i2b2. It will be intriguing to see if the rural populations more prevalent in the Deep South are more likely to use such services and how this intersects with the racial background of AD/MCI patients.
AD is a pressing health concern nationwide as indicated by the ever-increasing prevalence, medical and financial resources spent, and dedicated research funding. Eliminating racial disparities in AD is important and identifying different aspects of these disparities is a critical step toward achieving this goal.
ACKNOWLEDGMENTS
We thank members of the UAB Alzheimer’s Disease Research Center Executive Committee and Dr. Marianthe Grammas from the UAB Division of Gerontology, Geriatrics, and Palliative Care for helpful discussion and feedback on the manuscript. Research reported in this publication was supported by the National Institute on Aging and the Center for Advancing Translational Sciences of the National Institutes of Health under award numbers P20AG068024 and UL1TR001417.
Authors’ disclosures available online (https://www.j-alz.com/manuscript-disclosures/20-0796r1).
REFERENCES
[1] | Chen C , Zissimopoulos JM ((2018) ) Racial and ethnic differences in trends in dementia prevalence and risk factors in the United States. Alzheimers Dement (N Y) 4: , 510–520. |
[2] | Mayeda ER , Glymour MM , Quesenberry CP , Whitmer RA ((2016) ) Inequalities in dementia incidence between six racial and ethnic groups over 14 years. Alzheimers Dement 12: , 216–224. |
[3] | Barnes LL , Bennett DA ((2014) ) Alzheimer’s disease in African Americans: Risk factors and challenges for the future. Health Aff (Millwood) 33: , 580–586. |
[4] | Steenland K , Goldstein FC , Levey A , Wharton W ((2016) ) A meta-analysis of alzheimer’s disease incidence and prevalence comparing African-Americans and Caucasians. J Alzheimers Dis 50: , 71–76. |
[5] | Tang MX , Stern Y , Marder K , Bell K , Gurland B , Lantigua R , Andrews H , Feng L , Tycko B , Mayeux R ((1998) ) The APOE-epsilon4 allele and the risk of Alzheimer disease among African Americans, whites, and Hispanics. JAMA 279: , 751–755. |
[6] | Connell CM , Scott Roberts J , McLaughlin SJ , Akinleye D ((2009) ) Racial differences in knowledge and beliefs about Alzheimer disease. Alzheimer Dis Assoc Disord 23: , 110–116. |
[7] | Gupta VK , Winter M , Cabral H , Henault L , Waite K , Hanchate A , Bickmore TW , Wolf MS , Paasche-Orlow MK ((2016) ) Disparities in age-associated cognitive decline between African-American and Caucasian populations: The roles of health literacy and education. J Am Geriatr Soc 64: , 1716–1723. |
[8] | Ighodaro ET , Nelson PT , Kukull WA , Schmitt FA , Abner EL , Caban-Holt A , Bardach SH , Hord DC , Glover CM , Jicha GA , Van Eldik LJ , Byrd AX , Fernander A ((2017) ) Challenges and considerations related to studying dementia in Blacks/African Americans. J Alzheimers Dis 60: , 1–10. |
[9] | Thorpe CT , Fowler NR , Harrigan K , Zhao X , Kang Y , Hanlon JT , Gellad WF , Schleiden LJ , Thorpe JM ((2016) ) Racial and ethnic differences in initiation and discontinuation of antidementia drugs by Medicare beneficiaries. J Am Geriatr Soc 64: , 1806–1814. |
[10] | van de Vorst IE , Koek HL , Stein CE , Bots ML , Vaartjes I ((2016) ) Socioeconomic disparities and mortality after a diagnosis of dementia: Results from a nationwide registry linkage study. Am J Epidemiol 184: , 219–226. |
[11] | Hinton L , Franz C , Friend J ((2004) ) Pathways to dementia diagnosis: Evidence for cross-ethnic differences. Alzheimer Dis Assoc Disord 18: , 134–144. |
[12] | Hansen BR , Hodgson NA , Gitlin LN ((2016) ) It’s a matter of trust: Older African Americans speak about their health care encounters. J Appl Gerontol 35: , 1058–1076. |
[13] | Casper M , Kramer MR , Quick H , Schieb LJ , Vaughan AS , Greer S ((2016) ) Changes in the geographic patterns of heart disease mortality in the United States: 1973 to 2010. Circulation 133: , 1171–1180. |
[14] | Sachs-Ericsson N , Blazer DG ((2005) ) Racial differences in cognitive decline in a sample of community-dwelling older adults: The mediating role of education and literacy. Am J Geriatr Psychiatry 13: , 968–975. |
[15] | Shikany JM , Carson TL , Hardy CM , Li Y , Sterling S , Hardy S , Walker CM , Baskin ML ((2018) ) Assessment of the nutrition environment in rural counties in the Deep South. J Nutr Sci 7: , e27. |
[16] | Thacker EL , Gillett SR , Wadley VG , Unverzagt FW , Judd SE , McClure LA , Howard VJ , Cushman M ((2014) ) The American Heart Association Life’s Simple 7 and incident cognitive impairment: The REasons for Geographic And Racial Differences in Stroke (REGARDS) study. J Am Heart Assoc 3: , e000635. |
[17] | Walker JM , Harrison FE ((2015) ) Shared neuropathological characteristics of obesity, type 2 diabetes and Alzheimer’s disease: Impacts on cognitive decline. Nutrients 7: , 7332–7357. |
[18] | Clark PC , Kutner NG , Goldstein FC , Peterson-Hazen S , Garner V , Zhang R , Bowles T ((2005) ) Impediments to timely diagnosis of Alzheimer’s disease in African Americans. J Am Geriatr Soc 53: , 2012–2017. |
[19] | Bao W , Jia H , Finnema S , Cai Z , Carson RE , Huang YH ((2017) ) PET imaging for early detection of Alzheimer’s disease: From pathologic to physiologic biomarkers. PET Clin 12: , 329–350. |
[20] | Golde TE , Petrucelli L , Lewis J ((2010) ) Targeting Abeta and tau in Alzheimer’s disease, an early interim report. Exp Neurol 223: , 252–266. |
[21] | Zhang XY , Yang ZL , Lu GM , Yang GF , Zhang LJ ((2017) ) PET/MR imaging: New frontier in Alzheimer’s disease and other dementias. Front Mol Neurosci 10: , 343. |
[22] | Iaccarino L , Chiotis K , Alongi P , Almkvist O , Wall A , Cerami C , Bettinardi V , Gianolli L , Nordberg A , Perani D ((2017) ) A cross-validation of FDG- and Amyloid-PET biomarkers in mild cognitive impairment for the risk prediction to dementia due to Alzheimer’s disease in a clinical setting. J Alzheimers Dis 59: , 603–614. |
[23] | Rice L , Bisdas S ((2017) ) The diagnostic value of FDG and amyloid PET in Alzheimer’s disease-A systematic review. Eur J Radiol 94: , 16–24. |
[24] | Okamura N , Harada R , Furumoto S , Arai H , Yanai K , Kudo Y ((2014) ) Tau PET imaging in Alzheimer’s disease. Curr Neurol Neurosci Rep 14: , 500. |
[25] | Kato T , Inui Y , Nakamura A , Ito K ((2016) ) Brain fluorodeoxyglucose (FDG) PET in dementia. Ageing Res Rev 30: , 73–84. |
[26] | Marcus C , Mena E , Subramaniam RM ((2014) ) Brain PET in the diagnosis of Alzheimer’s disease. Clin Nucl Med 39: , e413–422; quiz e423-416. |
[27] | O’Brien JT , Firbank MJ , Davison C , Barnett N , Bamford C , Donaldson C , Olsen K , Herholz K , Williams D , Lloyd J ((2014) ) 18F-FDG PET and perfusion SPECT in the diagnosis of Alzheimer and Lewy body dementias. J Nucl Med 55: , 1959–1965. |
[28] | Scheltens P , Blennow K , Breteler MM , de Strooper B , Frisoni GB , Salloway S , Van der Flier WM ((2016) ) Alzheimer’s disease. Lancet 388: , 505–517. |
[29] | Murphy SN , Weber G , Mendis M , Gainer V , Chueh HC , Churchill S , Kohane I ((2010) ) Serving the enterprise and beyond with informatics for integrating biology and the bedside (i2b2). J Am Med Inform Assoc 17: , 124–130. |
[30] | Kohane IS , Churchill SE , Murphy SN ((2012) ) A translational engine at the national scale: Informatics for integrating biology and the bedside. J Am Med Inform Assoc 19: , 181–185. |
[31] | Rabinovici GD , Gatsonis C , Apgar C , Chaudhary K , Gareen I , Hanna L , Hendrix J , Hillner BE , Olson C , Lesman-Segev OH , Romanoff J , Siegel BA , Whitmer RA , Carrillo MC ((2019) ) Association of amyloid positron emission tomography with subsequent change in clinical management among Medicare beneficiaries with mild cognitive impairment or dementia. JAMA 321: , 1286–1294. |
[32] | Team RC ((2018) ) R Foundation for Statistical Computing, Vienna, Austria. |
[33] | Johnson KA , Minoshima S , Bohnen NI , Donohoe KJ , Foster NL , Herscovitch P , Karlawish JH , Rowe CC , Carrillo MC , Hartley DM , Hedrick S , Pappas V , Thies WH , Alzheimer’s Association; Society of Nuclear Medicine and Molecular Imaging; Amyloid Imaging Taskforce ((2013) ) Appropriate use criteria for amyloid PET: A report of the Amyloid Imaging Task Force, the Society of Nuclear Medicine and Molecular Imaging, and the Alzheimer’s Association. Alzheimers Dement 9: , e-1–16. |
[34] | Schneider LS , Dagerman KS , Higgins JP , McShane R ((2011) ) Lack of evidence for the efficacy of memantine in mild Alzheimer disease. Arch Neurol 68: , 991–998. |
[35] | Reisberg B , Doody R , Stoffler A , Schmitt F , Ferris S , Mobius HJ , Memantine Study Group ((2003) ) Memantine in moderate-to-severe Alzheimer’s disease. N Engl J Med 348: , 1333–1341. |
[36] | Love MCN , Pilonieta G , Geldmacher DS ((2019) ) Alabama Brief Cognitive Screener: Utility of a new cognitive screening instrument in a memory disorders clinic. Prim Care Companion CNS Disord 21: , 18m02336. |
[37] | The United States Census Bureau, ACS Demographic and Housing Estimates for the Birmingham-Hoover Metro Area, Alabama, https://data.census.gov/cedsci/ |
[38] | UaB Health System, Overview of UAB Health System: 2016 Facts & Figures, https://www.uabmedicine.org/documents/142028/207789/Facts-Figures-2016/48a8601c-ce6f-4f34-b0da-8052bf695234 |
[39] | Iliffe S , Robinson L , Brayne C , Goodman C , Rait G , Manthorpe J , Ashley P , DeNDRoN Primary Care Clinical Studies Group ((2009) ) Primary care and dementia: 1. diagnosis, screening and disclosure. Int J Geriatr Psychiatry 24: , 895–901. |
[40] | Koller D , Hua T , Bynum JP ((2016) ) Treatment patterns with antidementia drugs in the United States: Medicare cohort study. J Am Geriatr Soc 64: , 1540–1548. |
[41] | Mehta KM , Yin M , Resendez C , Yaffe K ((2005) ) Ethnic differences in acetylcholinesterase inhibitor use for Alzheimer disease. Neurology 65: , 159–162. |
[42] | Chui HC , Gatz M ((2005) ) Cultural diversity in Alzheimer disease: The interface between biology, belief, and behavior. Alzheimer Dis Assoc Disord 19: , 250–255. |
[43] | Manly JJ , Jacobs D , Mayeux R ((1999) ) Alzheimer’s disease among different ethnic and racial groups. In Alzheimer’s Disease, 2nd ed., TerryRD, KatzmanR, BickKL, SisodiaSS, eds. Lippincott, Williams and Wilkins, Philadelphia, pp. 117–131. |
[44] | Assaf G , Tanielian M ((2018) ) Mild cognitive impairment in primary care: A clinical review. Postgrad Med J 94: , 647–652. |
[45] | Rovner BW , Casten RJ , Harris LF ((2013) ) Cultural diversity and views on Alzheimer disease in older African Americans. Alzheimer Dis Assoc Disord 27: , 133–137. |
[46] | Chin AL , Negash S , Hamilton R ((2011) ) Diversity and disparity in dementia: The impact of ethnoracial differences in Alzheimer disease. Alzheimer Dis Assoc Disord 25: , 187–195. |
[47] | Clark JL , Phoenix S , Bilbrey AC , McManis T , Escal KA , Arulanantham R , Sisay T , Ghatak R ((2018) ) Cultural competency in dementia care: An African American case study. Clin Gerontol 41: , 255–260. |
[48] | Parrill R , Kennedy BR ((2011) ) Partnerships for health in the African American community: Moving toward community-based participatory research. J Cult Divers 18: , 150–154. |
[49] | Abramsohn EM , Jerome J , Paradise K , Kostas T , Spacht WA , Lindau ST ((2019) ) Community resource referral needs among African American dementia caregivers in an urban community: A qualitative study. BMC Geriatr 19: , 311. |
[50] | Samson ZB , Parker M , Dye C , Hepburn K ((2016) ) Experiences and learning needs of African American family dementia caregivers. Am J Alzheimers Dis Other Demen 31: , 492–501. |
[51] | Desin PJ , Caban-Holt AM , Abner EL , Van Eldik LJ , Schmitt FA ((2016) ) Factors associated with unmet needs among African-American dementia care providers. J Gerontol Geriatr Res 5: , 267. |
[52] | Rosenthal Gelman C , Sokoloff T , Graziani N , Arias E , Peralta A ((2014) ) Individually-tailored support for ethnically-diverse caregivers: Enhancing our understanding of what is needed and what works. J Gerontol Soc Work 57: , 662–680. |


