
Functional Integrity of Synapses in the Central Nervous System of Cognitively Intact Individuals with High Alzheimer’s Disease Neuropathology Is Associated with Absence of Synaptic Tau Oligomers
Abstract
Background:
Certain individuals, here referred to as Non-Demented with Alzheimer Neuropathology (NDAN), do not show overt neurodegeneration (N-) and remain cognitively intact despite the presence of plaques (A+) and tangles (T+) that would normally be consistent with fully symptomatic Alzheimer’s disease (AD).
Objective:
The existence of NDAN (A + T+N-) subjects suggests that the human brain utilizes intrinsic mechanisms that can naturally evade cognitive decline normally associated with the symptomatic stages of AD (A + T+N+). Deciphering the underlying mechanisms would prove relevant to develop complementing therapeutics to prevent progression of AD-related cognitive decline.
Methods:
Previously, we have reported that NDAN present with preserved neurogenesis and synaptic integrity paralleled by absence of amyloid oligomers at synapses. Using postmortem brain samples from age-matched control subjects, demented AD patients and NDAN individuals, we performed immunofluorescence, western blots, micro transplantation of synaptic membranes in Xenopus oocytes followed by twin electrode voltage clamp electrophysiology and fluorescence assisted single synaptosome-long term potentiation studies.
Results:
We report decreased tau oligomers at synapses in the brains of NDAN subjects. Furthermore, using novel approaches we report, for the first time, that such absence of tau oligomers at synapses is associated with synaptic functional integrity in NDAN subjects as compared to demented AD patients.
Conclusion:
Overall, these results give further credence to tau oligomers as primary actors of synaptic destruction underscoring cognitive demise in AD and support their targeting as a viable therapeutic strategy for AD and related tauopathies.
INTRODUCTION
Alzheimer’s disease (AD) is an age-associated neurodegenerative disorder characterized by the CNS presence of amyloid-β (Aβ) plaques and neurofibrillary tau tangles [1, 2] that neuropathologically mark the terminal decline in cognitive function [3]. AD is the sixth leading cause of mortality in the United States with a progressively rising incidence and it is estimated that, by 2050, nearly 16 million people would be affected by AD [4]. There is currently no resolving cure for AD, and with constantly improving healthcare, the life expectancy of individuals is likely to increase, further elevating the susceptibility to the development of AD [5]. It is, therefore, imperative to develop new therapeutic strategies that effectively prevent the progression of AD [6–11].
In recent years, several groups, including ours, have described the existence of individuals who, despite presenting with Aβ plaques and tau protein tangles in their brain, do not develop the symptoms of AD and remain cognitively intact [12–20]. This suggests that these subjects, hereafter referred to as Non-Demented with Alzheimer’s disease Neuropathology (NDAN), have an inherent mechanism which protects them from the degenerative effects of AD pathology that otherwise would lead to cognitive decline. Studying the mechanisms driving this resistance to cognitive decline would help in developing effective novel therapeutic strategies for AD [18]. Although the exact protective mechanism in NDAN individuals remains elusive, several studies have addressed their resistance to cognitive decline [14, 17, 20–22]. One such study reported that, along with preservation of cognitive function, NDAN individuals also have larger hippocampal and total brain volume in comparison to AD patients [14]. Our own studies revealed that Aβ oligomers were absent at the post synaptic density in NDAN hippocampi, which could support maintenance of normal synapse function underscoring preserved cognitive integrity [17]. More recently, we linked such preservation of cognitive function in NDAN to greater neurogenesis and decreased regulatory microRNA expression in the hippocampal dentate gyrus [20]. Lastly, postsynaptic density proteome studies identified a unique signature of 15 genes that significantly set NDAN apart from both AD patients and control subjects [22]. PANTHER analysis of proteomic data revealed significant effects on proteins involved in actin dynamics and cytoskeletal regulation, suggesting that the NDAN subjects may have mechanisms strengthening the synaptic integrity that promotes resilience against amyloidogenic oligomers. Notably, ingenuity pathway analysis (IPA) identified selected micro RNA as upstream regulators of such proteomic changes in NDAN synapses that were later reported to af-ford synaptic resilience to amyloid oligomers when administered in experimental mouse models [22].
In recent years, a shift in interest has been observed from the large insoluble forms of tau (neurofibrillary tangles, NFTs), to the smaller soluble aggregates, tau oligomers. Many studies in animal models have demonstrated that the large metastable NFTs are not causally linked to tauopathy phenotypes [23–30]. Moreover, studies in humans have demonstrated that neurodegeneration is independent of NFTs and that neurons containing NFTs can survive for decades [31–35]. Several groups have since established that the oligomers are the true toxic tau species which form prior to and independent of NFTs and are ultimately responsible for neurodegeneration in late stages of AD [21, 36–38].
Based on our previous report that NDAN synapses are resistant to Aβ oligomers [39], here we test the hypothesis that synaptic resilience mechanisms in NDAN were also effective in preventing the toxicity brought about by tau oligomers. In the present work, we addressed this question by using fluorescence staining and western blot analysis to establish and evaluate the interaction of tau oligomers at the frontal cortex and hippocampal synapses of NDAN subjects as compared to AD patients and age-matched controls. Additionally, we also provide evidence of preservation of synaptic integrity through functional studies of the NDAN synapses using micro transplantation of synaptic membranes in Xenopus oocytes [40, 41] and fluorescence assisted single synaptosome-long term potentiation (FASS-LTP) studies [42, 43]. Our results show that synaptic association of tau oligomers is significantly reduced in NDAN subjects as compared to demented AD patients, resulting in preserved synaptic integrity that underscores maintenance of cognitive competency in these resilient individuals.
MATERIALS AND METHODS
Human subjects and autopsy brain tissues
We obtained our deidentified frozen brain tissues from the Oregon Brain Bank at Oregon Health and Science University (OHSU) in Portland, OR, where donor subjects were clinically evaluated in studies at the NIH-sponsored Layton Aging and AD Center (ADC). As a result, these subjects that are a part of the brain aging studies had received annual neurological/neuropsychological evaluations, complete with a Clinical Dementia Rating (CDR) assigned by an experienced clinician, testing for cognitive and functional examinations. Subjects were diagnosed by the clinical team consensus conference as Alzheimer’s disease only when they met the National Institute for Neurological and Communicative Disorders and Stroke-Alzheimer’s Disease and Related Disorder Association diagnostic criteria for clinical AD, by showing a CDR of greater than 1.0 and neuropathologic confirmation at autopsy (after informed consent). In the neuropathologist assessment that conformed to National Institute on Aging-Reagan consensus criteria, all brain tissue was examined for NFTs and neuritic plaques using standardized CERAD criteria [44, 45]. An amyloid score based on the deposition of amyloid plaques in the brain (0 = no plaques, 1 = sparse plaques, 2 = moderate plaques, and 3 = dense plaques) and a Braak stage (0–6; with 6 being the most severe) were assigned to indicate the level and location of hyperphosphorylated tau tangles [46]. In addition to the pathological information detailed above, demographical data were received along with the frozen tissue. These included age, sex, and Mini-Mental State Examination (MMSE) score [44] for each case. Donor subject samples were de-identified by ADC prior to being provided to UTMB, so that no approval was required from the UTMB Institutional Review Board under CFR §46.101. Demographic details of cases used in this study are shown in Table 1.
Table 1
Clinical and demographic data for the subject tissues used in the present study. PMI, postmortem interval; MMSE, Mini-Mental State Exam
| Case no. | Diagnosis | Sex | Age | Braak score | Plaque | PMI (h) | MMSE |
| 767 | CTRL | F | 86 | 2 | 0 | 8 | 29 |
| 785 | CTRL | M | 83 | 1 | 0 | <14 | 29 |
| 986 | CTRL | M | 83 | 1 | 1 | 2 | NA |
| 1013 | CTRL | M | >89 | 1 | 0 | 6 | 29 |
| 1229 | CTRL | F | >89 | 2 | 1 | 12 | 30 |
| 1525 | CTRL | F | 88.7 | 1 | 0 | 3 | 29 |
| 1563 | CTRL | M | 80 | 1 | 1 | 2 | 30 |
| 1731 | CTRL | F | 74 | 2 | 1 | 7.5 | 29 |
| 1874 | CTRL | F | 43 | 0 | 0 | 10 | NA |
| 1965 | CTRL | F | >89 | 2 | 1 | 5.5 | NA |
| 2467 | CTRL | F | 99 | 3 | NA | 4.5 | 28 |
| 2682 | CTRL | F | 90 | 3 | NA | 9 | 28 |
| 2755 | CTRL | F | 95 | 2 | NA | 18 | 29 |
| 2953 | CTRL | F | 100 | 3 | NA | 2.5 | 27 |
| 995 | AD | F | 81 | 6 | 3 | 12 | 0 |
| 1538 | AD | M | 84 | 5 | 3 | 5.5 | 6 |
| 1678 | AD | F | 76 | 6 | 3 | 25 | 1 |
| 1688 | AD | M | 75 | 6 | 2 | 17 | 2.2 |
| 1774 | AD | M | >89 | 6 | 3 | 3.25 | 2 |
| 1776 | AD | F | >89 | 6 | 3 | 6.25 | 6 |
| 1777 | AD | F | 67 | 6 | 3 | 20.5 | 9 |
| 1756 | AD | M | 68 | 6 | 3 | 11.5 | 7 |
| 1746 | AD | M | 61 | 6 | 3 | 4 | 2 |
| 1811 | AD | M | >89 | 6 | 2 | 18 | 21 |
| 2272 | AD | F | 90 | 6 | NA | 5 | 20 |
| 2312 | AD | F | 87 | 6 | NA | 2.5 | 19 |
| 2316 | AD | M | 83 | 5 | 2 | 13 | NA |
| 2317 | AD | M | 88 | 6 | 2 | 4.5 | NA |
| 2374 | AD | M | 91 | 6 | 2 | 24 | NA |
| 2543 | AD | M | 95 | 6 | NA | 5 | 21 |
| 697 | NDAN | M | >89 | 5 | 2 | 7 | 29 |
| 1016 | NDAN | F | >89 | 6 | 3 | 8 | 26 |
| 1179 | NDAN | F | 89 | 5 | 3 | 2.5 | 27 |
| 1317 | NDAN | F | >89 | 6 | 2 | 4.5 | 27 |
| 1362 | NDAN | F | >89 | 4 | 3 | 48 | 27 |
| 1578 | NDAN | M | >89 | 5 | 3 | 15.5 | 27 |
| 1686 | NDAN | F | 87 | 2 | 3 | 2.5 | 29 |
| 2322 | NDAN | F | 89 | 4 | NA | 14 | 29 |
| 2376 | NDAN | M | 93 | 4 | NA | 4 | NA |
| 2474 | NDAN | F | 90 | 4 | NA | 8 | 28 |
| 2491 | NDAN | M | 82 | 4 | NA | 17 | 27 |
| 2980 | NDAN | F | 98 | 4 | NA | 4.75 | 27 |
| 3178 | NDAN | M | 93 | 3 | NA | 10 | 29 |
Western blot analysis
Hippocampal synaptosomal protein lysates were prepared following previously published protocol [47]. Tau5 (Mouse monoclonal Biolegend Tau5 purified azide free anti tau 210–230; 1:5000) or Tau TTC18 (Rabbit polyclonal 1:5000, Rakez Kayed’s laboratory) were used as primary antibodies and compared with loading control β-actin (Mouse monoclonal A2228, EMD Millipore Sigma, 1:100,000). Secondary antibodies used include Goat anti-mouse IgG (115-005-003, 1:5000) and Goat anti-rabbit IgG (115-005-062; 1:5000) from Jackson Immunoresearch Laboratories Inc. Pierce ECL Western Blotting Substrate (#32106, ThermoFisher Scientific, Waltham, MA) was used to visualize the bands using standard protocol on X-ray films. Quantification was done using ImageJ software. Results were graphed using Graphpad Prism 7 or 8 software. One-way ANOVA followed by Tukey’s comparison test was used to determine significance at p < 0.05, n = 6 subjects per group
Immunofluorescence
For Fig. 2, 10μm frontal cortex and hippocampal brain sections from NDAN, AD, and Ctrl samples were removed from –80°C and equilibrated to –20°C before embedding in Tissue-Tek O.C.T. compound (Sakura Finetek, Torrence, CA, USA) and affixed to Superfrost Plus slides (ThermoFisher Scientific) and stored for future use at –80°C. For immunostaining, the slides were taken from –80°C and equilibrated to room temperature (RT). The sections were thereafter fixed in ice-cold 4% paraformaldehyde for 30 min. Sections were then washed 3 times in 0.1 M PBS for 5 min each followed by blocking and permeabilization for 1 h at RT in 0.1 M PBS containing 5% goat serum, 0.5% Triton-X, and 0.05% tween. Incubation with the primary antibodies, Tau5 (Biolegend Tau5 purified azide free anti tau 210–230) used at 1:400 dilution and T22 (prepared by Rakez Kayed’s laboratory), used at 1:300 dilution in 0.1 M PBS containing 2% normal goat serum, was carried out overnight in a hydration chamber at 4°C. The following day, slides were again washed 3 times in 0.1 M PBS and then incubated with secondary antibody, goat anti-rabbit IgG Alexa Fluor 568 (1:400) for T22 and goat anti mouse IgG Alexa Flour 488 (1:400) for Tau5, for 1 h in 0.1 M PBS containing 2% normal goat serum and 0.2% triton. Slides were rinsed twice in PBS and once in distilled water before a 10 min incubation with 0.3% Sudan Black B (EMD Chemicals, Gibbstown, NJ, USA) in 70% ethanol to block lipofuscin auto fluorescence. After rinsing in distilled deionized water, a coverslip was mounted on the slides using DAPI fluoromont-G (Southern Biotech Lab) and sealed with nail polish. It is important to note here that the staining conditions used by us in these Tau5 immunofluorescence studies are sensitive enough to reveal large aggregates of tau rather than monomers. Therefore, positive staining with the Tau5 antibody observed here mostly reveals the presence of aggregated tau protein, as also confirmed by co-staining with the tau oligomer-specific antibody T22.
Fig. 1
Reduced levels of toxic tau oligomers in hippocampus and frontal cortex of NDAN subjects. A) Representative immunofluorescence images of Ctrl, AD, and NDAN frontal cortex showing Tau5 (green), T22 (red), and merge including DAPI (blue), bar scale: 100μm. B) Histogram summarizing quantitation of tau oligomer (T22) immunostaining in Ctrl, AD, and NDAN. T22 expression was significantly higher in the AD group (****p < 0.0001) compared to either Ctrl or NDAN and interestingly, T22 expression was also increased in the NDAN group (****p < 0.0001) compared to Ctrl (n = 4 subjects per group, one-way ANOVA, Tukey’s multiple comparison test). C) Histogram summarizing quantitation of total tau (Tau5) immunostaining in Ctrl, AD, and NDAN. Similar to T22, Tau5 expression was also significantly higher in the AD group (****p < 0.0001) compared to either Ctrl or NDAN and interestingly, T22 expression was also increased in the NDAN group (****p < 0.0001) compared to Ctrl (n = 4 subjects per group, one-way ANOVA, Tukey’s multiple comparison test). D) Representative immunofluorescent images of Ctrl, AD, and NDAN hippocampus showing Tau-5 (green), T22 (red), and merge including DAPI (blue), bar scale: 100μm. E) Histogram summarizing quantitation of tau oligomer (T22) immunostaining in Ctrl, AD, and NDAN. T22 expression was significantly higher in the AD group (****p < 0.0001) compared to either Ctrl or NDAN and interestingly, T22 expression was also increased in the NDAN group (****p < 0.0001) compared to Ctrl (n = 4 subjects per group, one-way ANOVA, Tukey’s multiple comparison test). F) Histogram summarizing quantitation of total tau (Tau5) immunostaining in Ctrl, AD, and NDAN. Similar to T22, Tau5 expression was also significantly higher in the AD group (****p < 0.0001) compared to either Ctrl or (****p = 0.0001) NDAN and interestingly, T22 expression was also increased in the NDAN group (****p < 0.0001) compared to Ctrl (n = 4 subjects per group, one-way ANOVA, Tukey’s multiple comparison test).
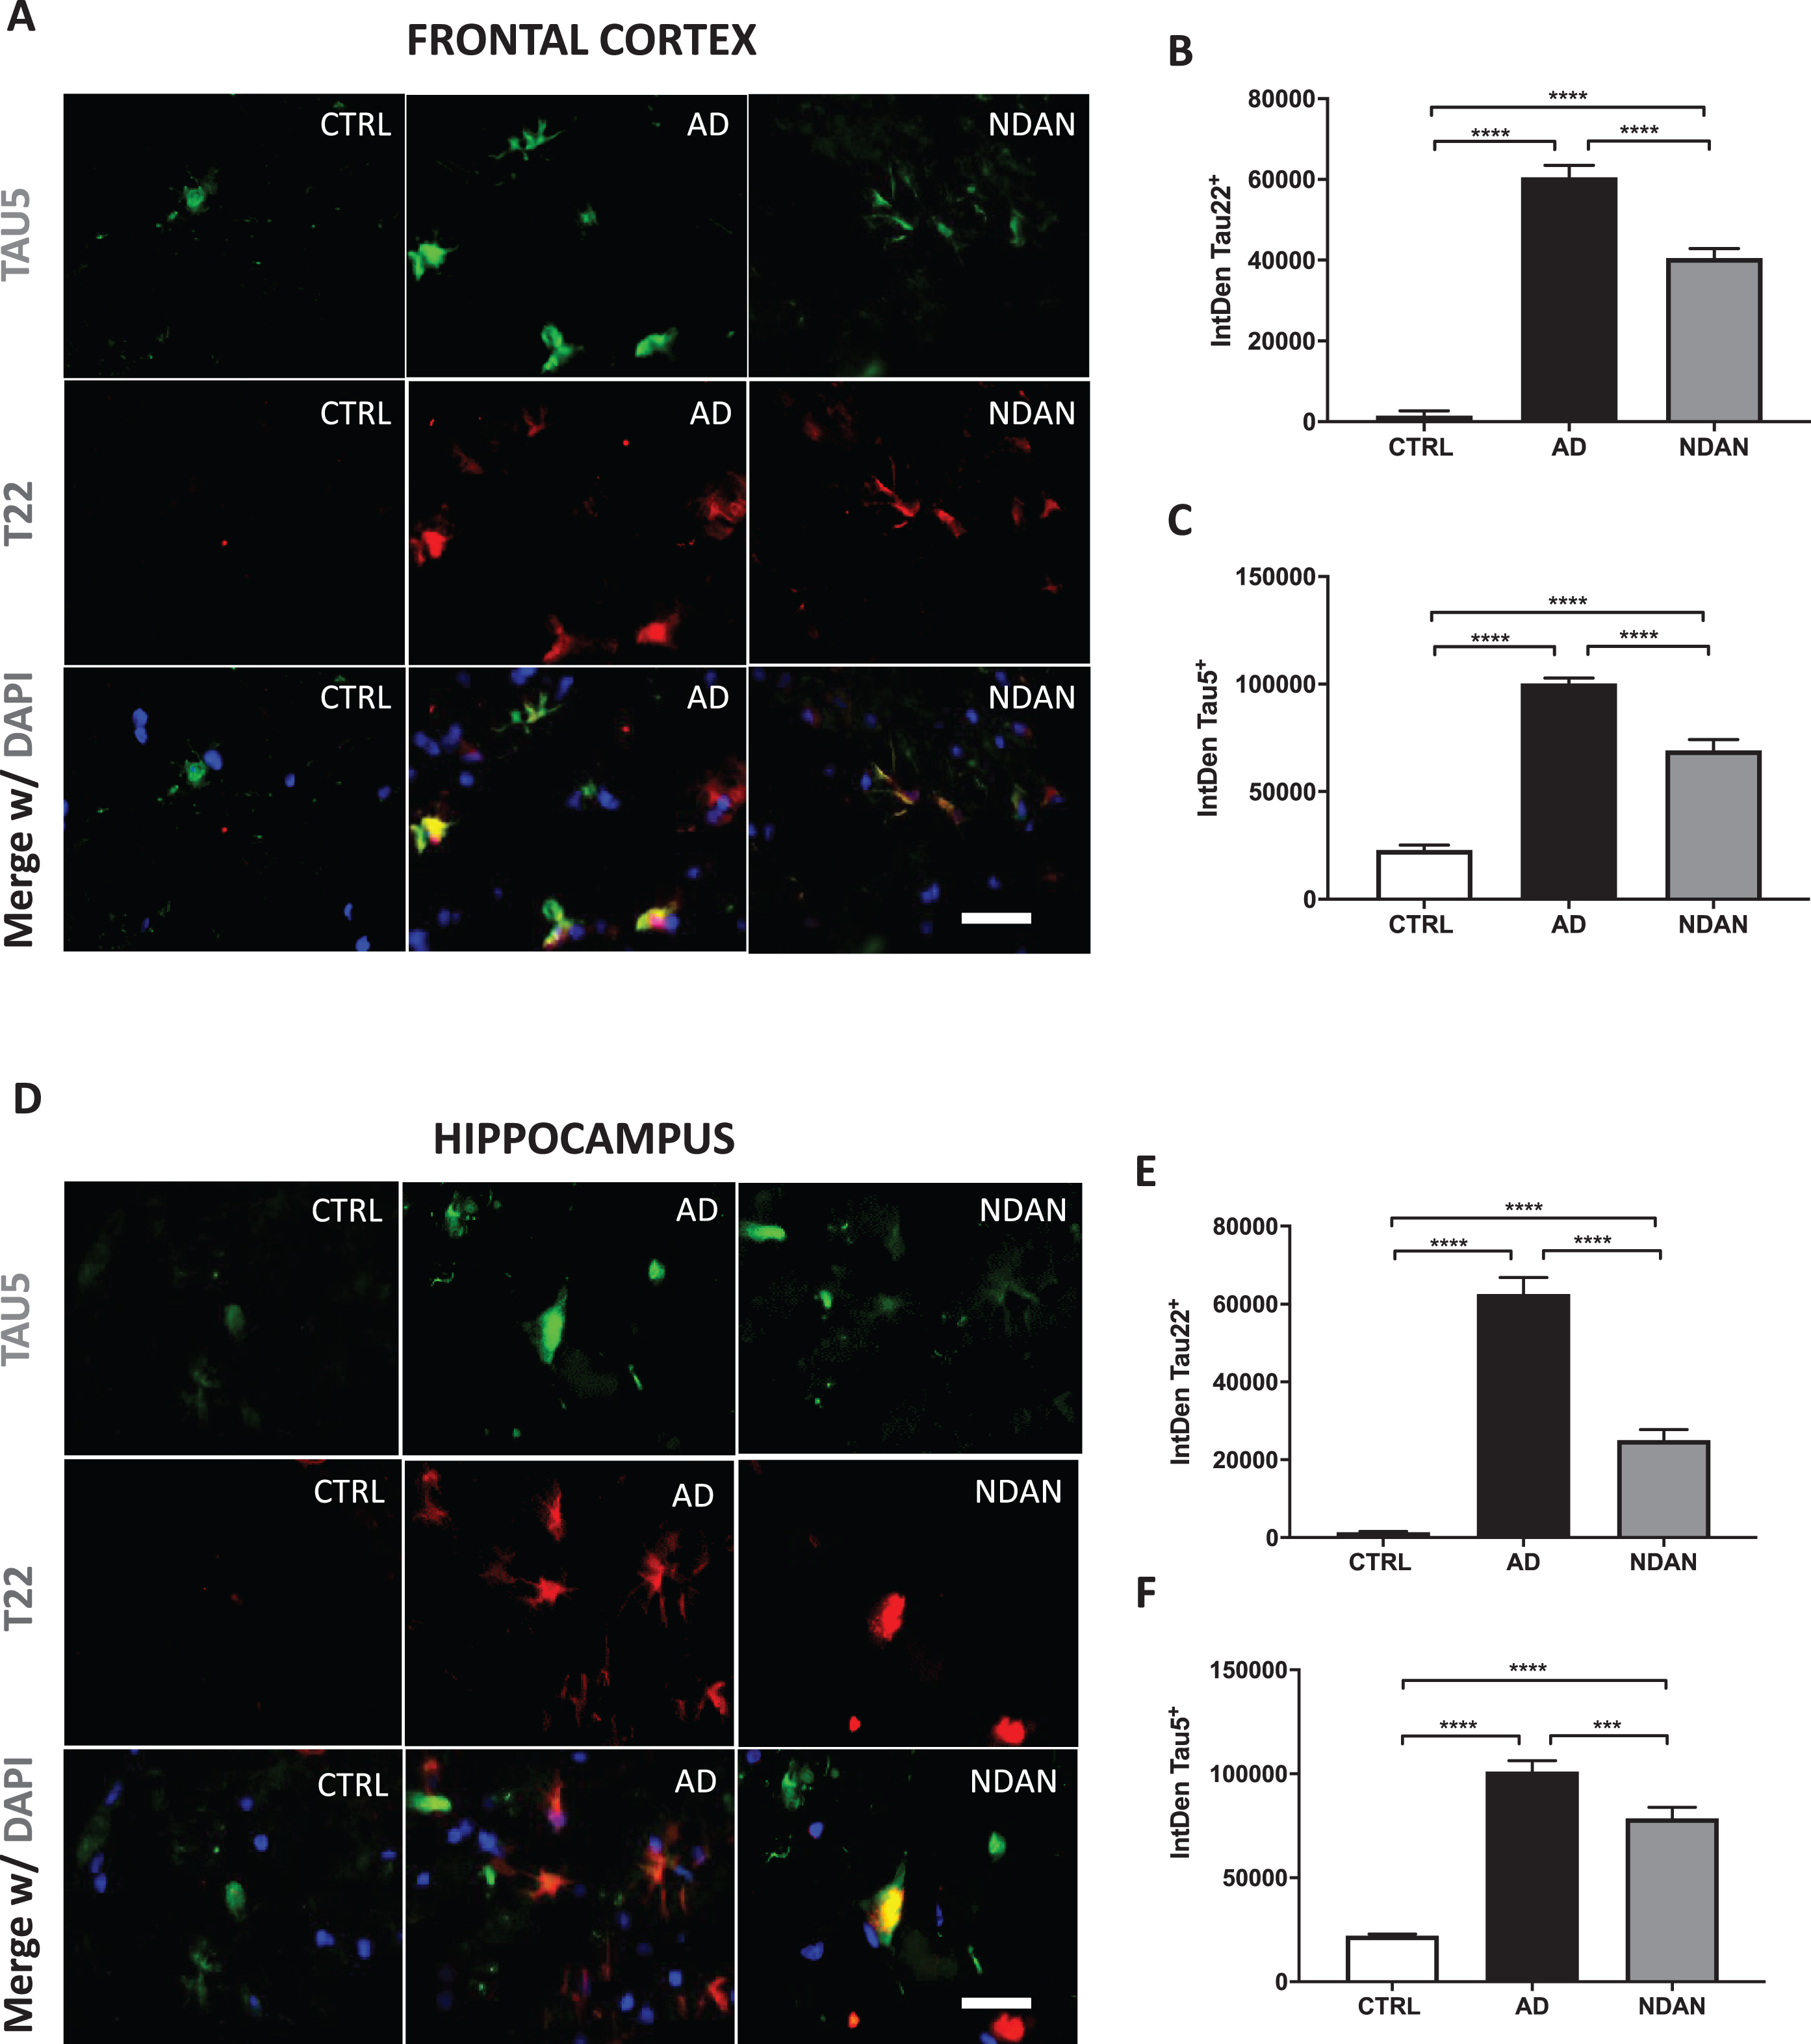
Fig. 2
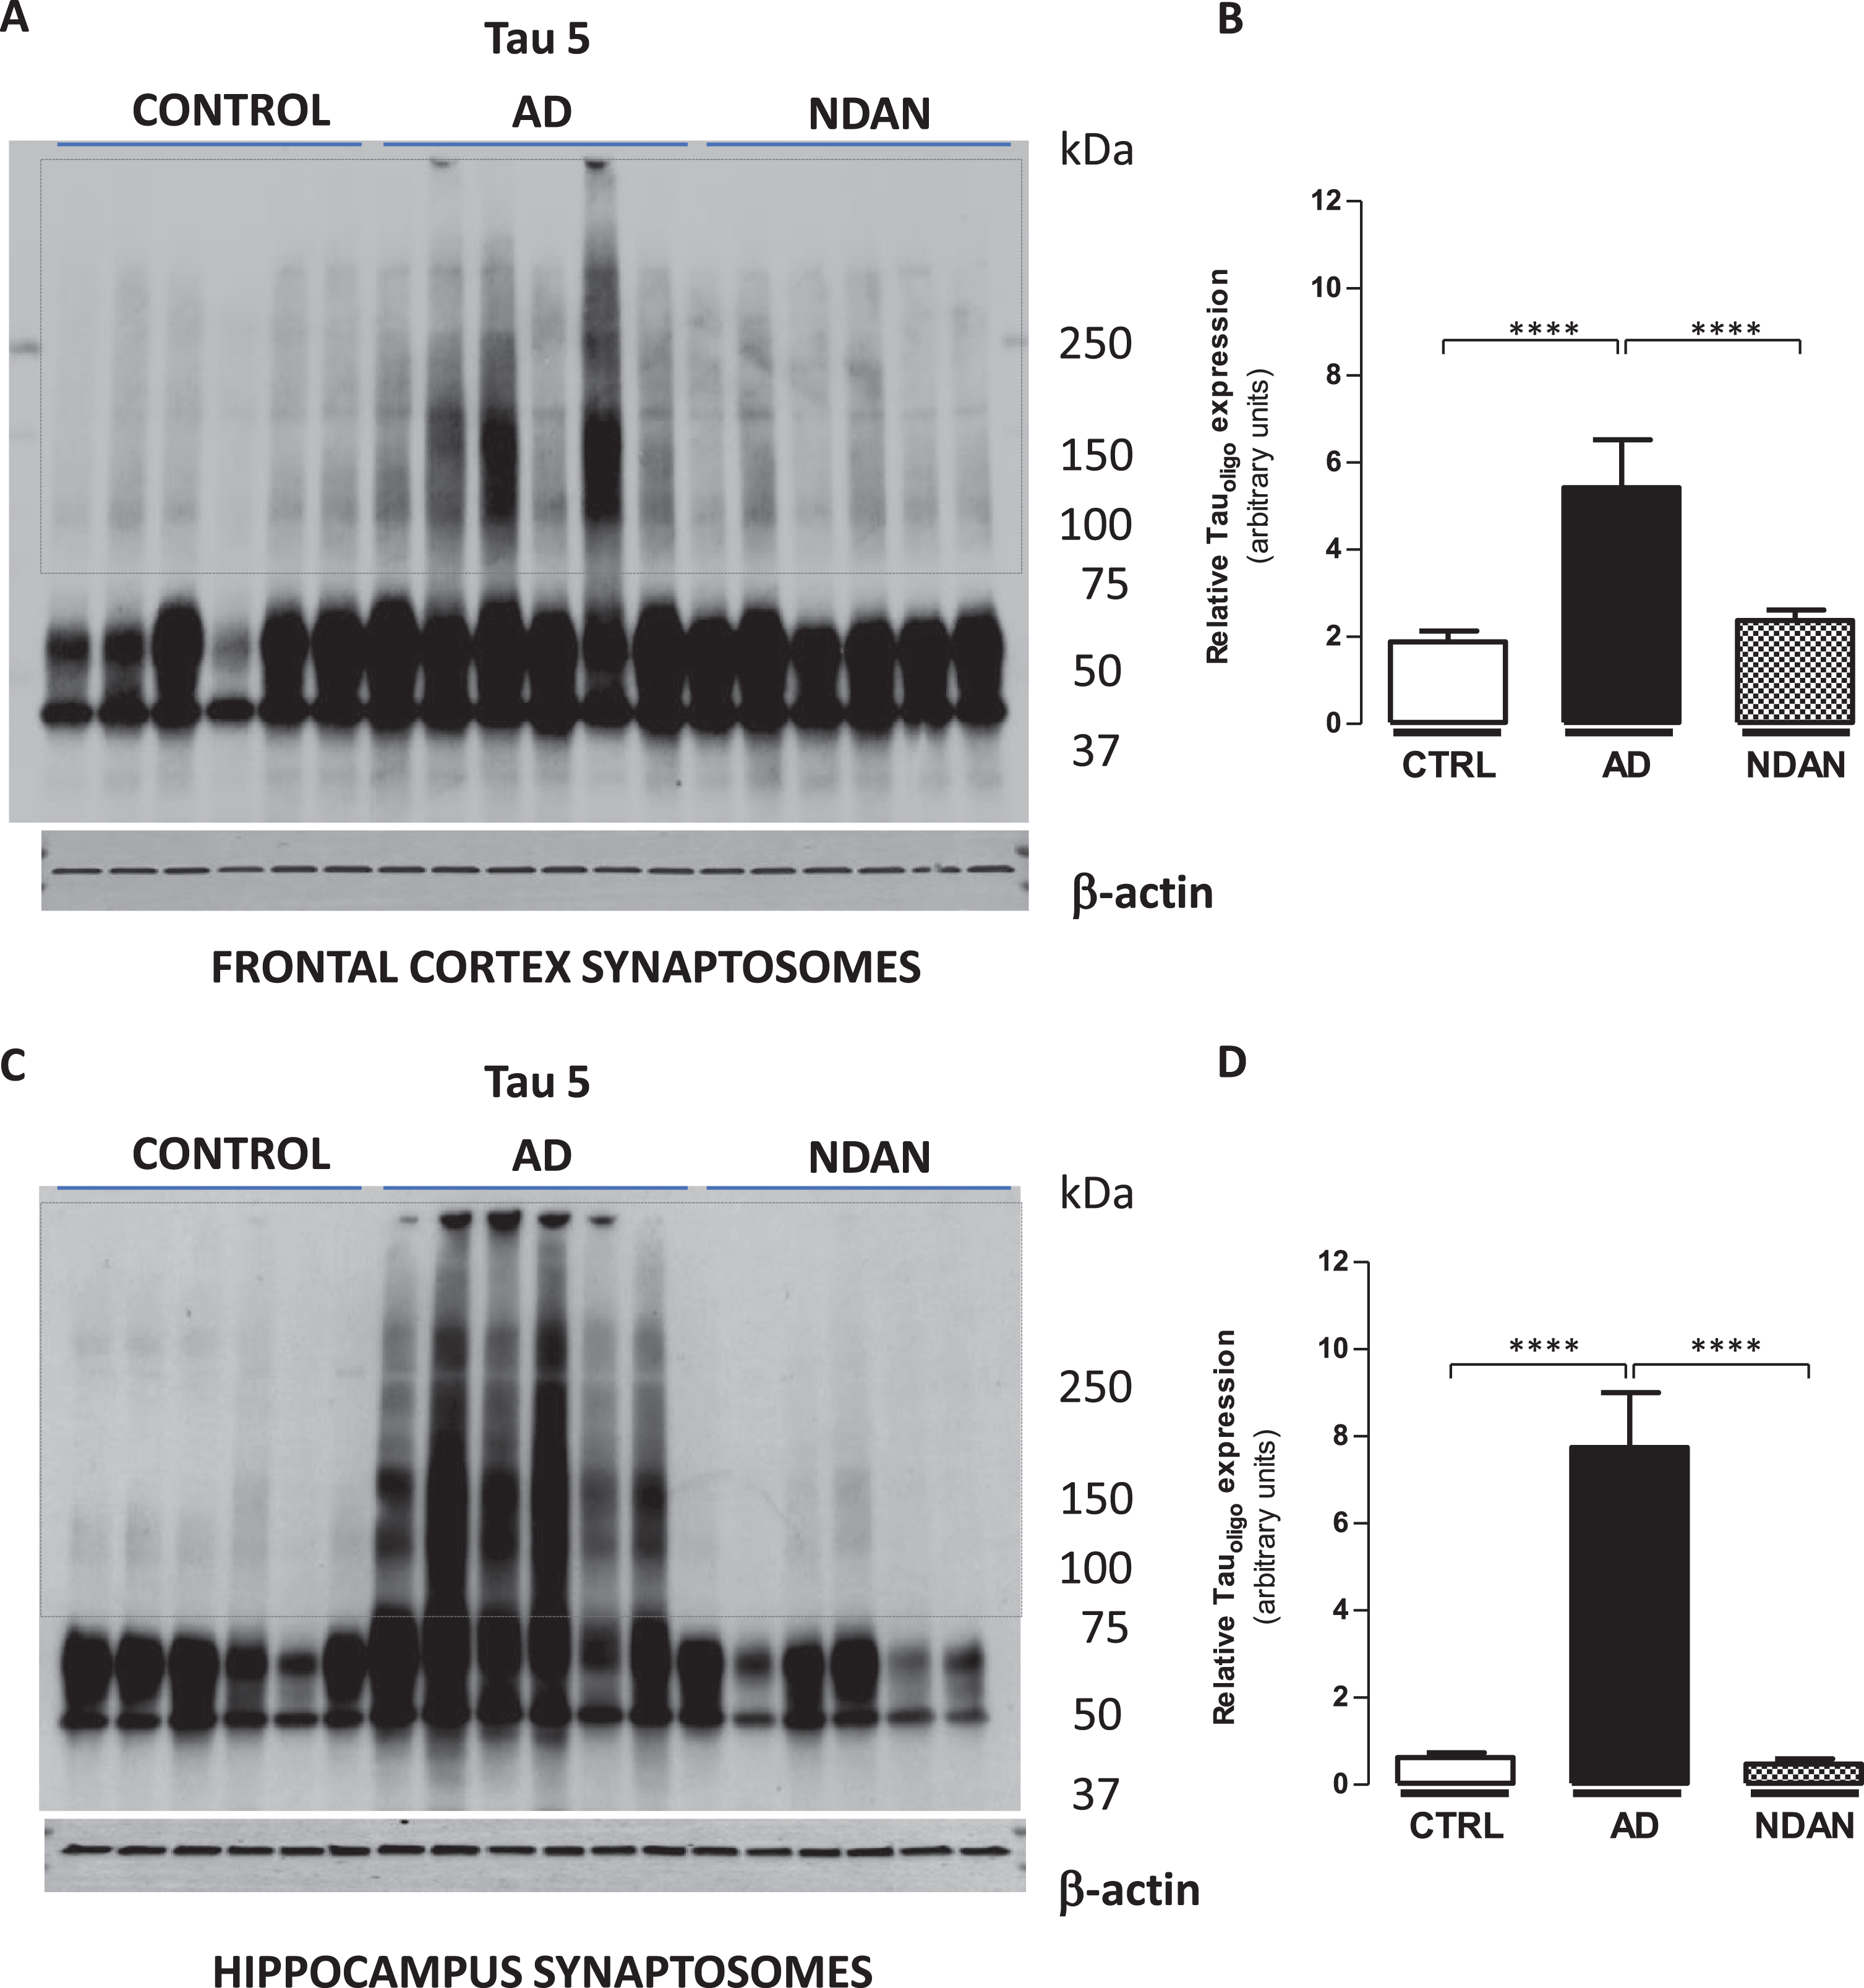
Decreased tau oligomer levels in synaptosomes from the hippocampus and frontal cortex of NDAN subjects. Western blots of crude synaptosomal fractions from six subjects each of control, AD, and NDAN groups obtained from either (A) the frontal cortex or (C) hippocampus were assessed using Tau 5 antibody. Tau oligomeric species identified in the dotted boxed regions (75 kDa to > 250 kDa) were used to quantify and compare between the three groups. Relative oligomeric tau levels detected by Tau 5 antibody (quantified using β-actin loading controls) show significantly lower levels in control and NDAN (B) frontal and (D) hippocampal synaptosomes compared to AD (****p < 0.0003, n = 6, Kruskal-Wallis one-way ANOVA, Dunn’s post-hoc).
For Fig. 3, fresh frozen cortical tissue blocks were removed from storage at –80°C, equilibrated at –20°C, embedded in O.C.T. compound (Tissue-Tek, Tokyo, Japan) and sectioned at 10μm onto Superfrost/Plus slides (Fisherbrand, ThermoFisher Scientific). Prepared slides were stored at –80°C until use. Slides were fixed in 4% paraformaldehyde in 0.1 M PBS, pH 7.4 for 30 min at RT. Nonspecific binding sites were blocked with 5% bovine serum albumin (BSA, Sigma-Aldrich Inc., Saint Louis, MO, USA)/10% normal goat serum (NGS, ThermoFisher Scientific) and sections were permeabilized with 0.5% Triton X-100/0.05% Tween-20 for 1 h at RT. Slides were incubated with either of the following primary antibodies, diluted in PBS containing 1.5% NGS/0.25% Triton X-100 overnight at 4°C: rabbit anti-PSD95 (1:100, Cell Signaling), mouse anti-PSD95 (1:100, Abcam), mouse anti-HT7 (1:500, ThermoFisher Scientific), rabbit anti-T22 (1:300).
Fig. 3
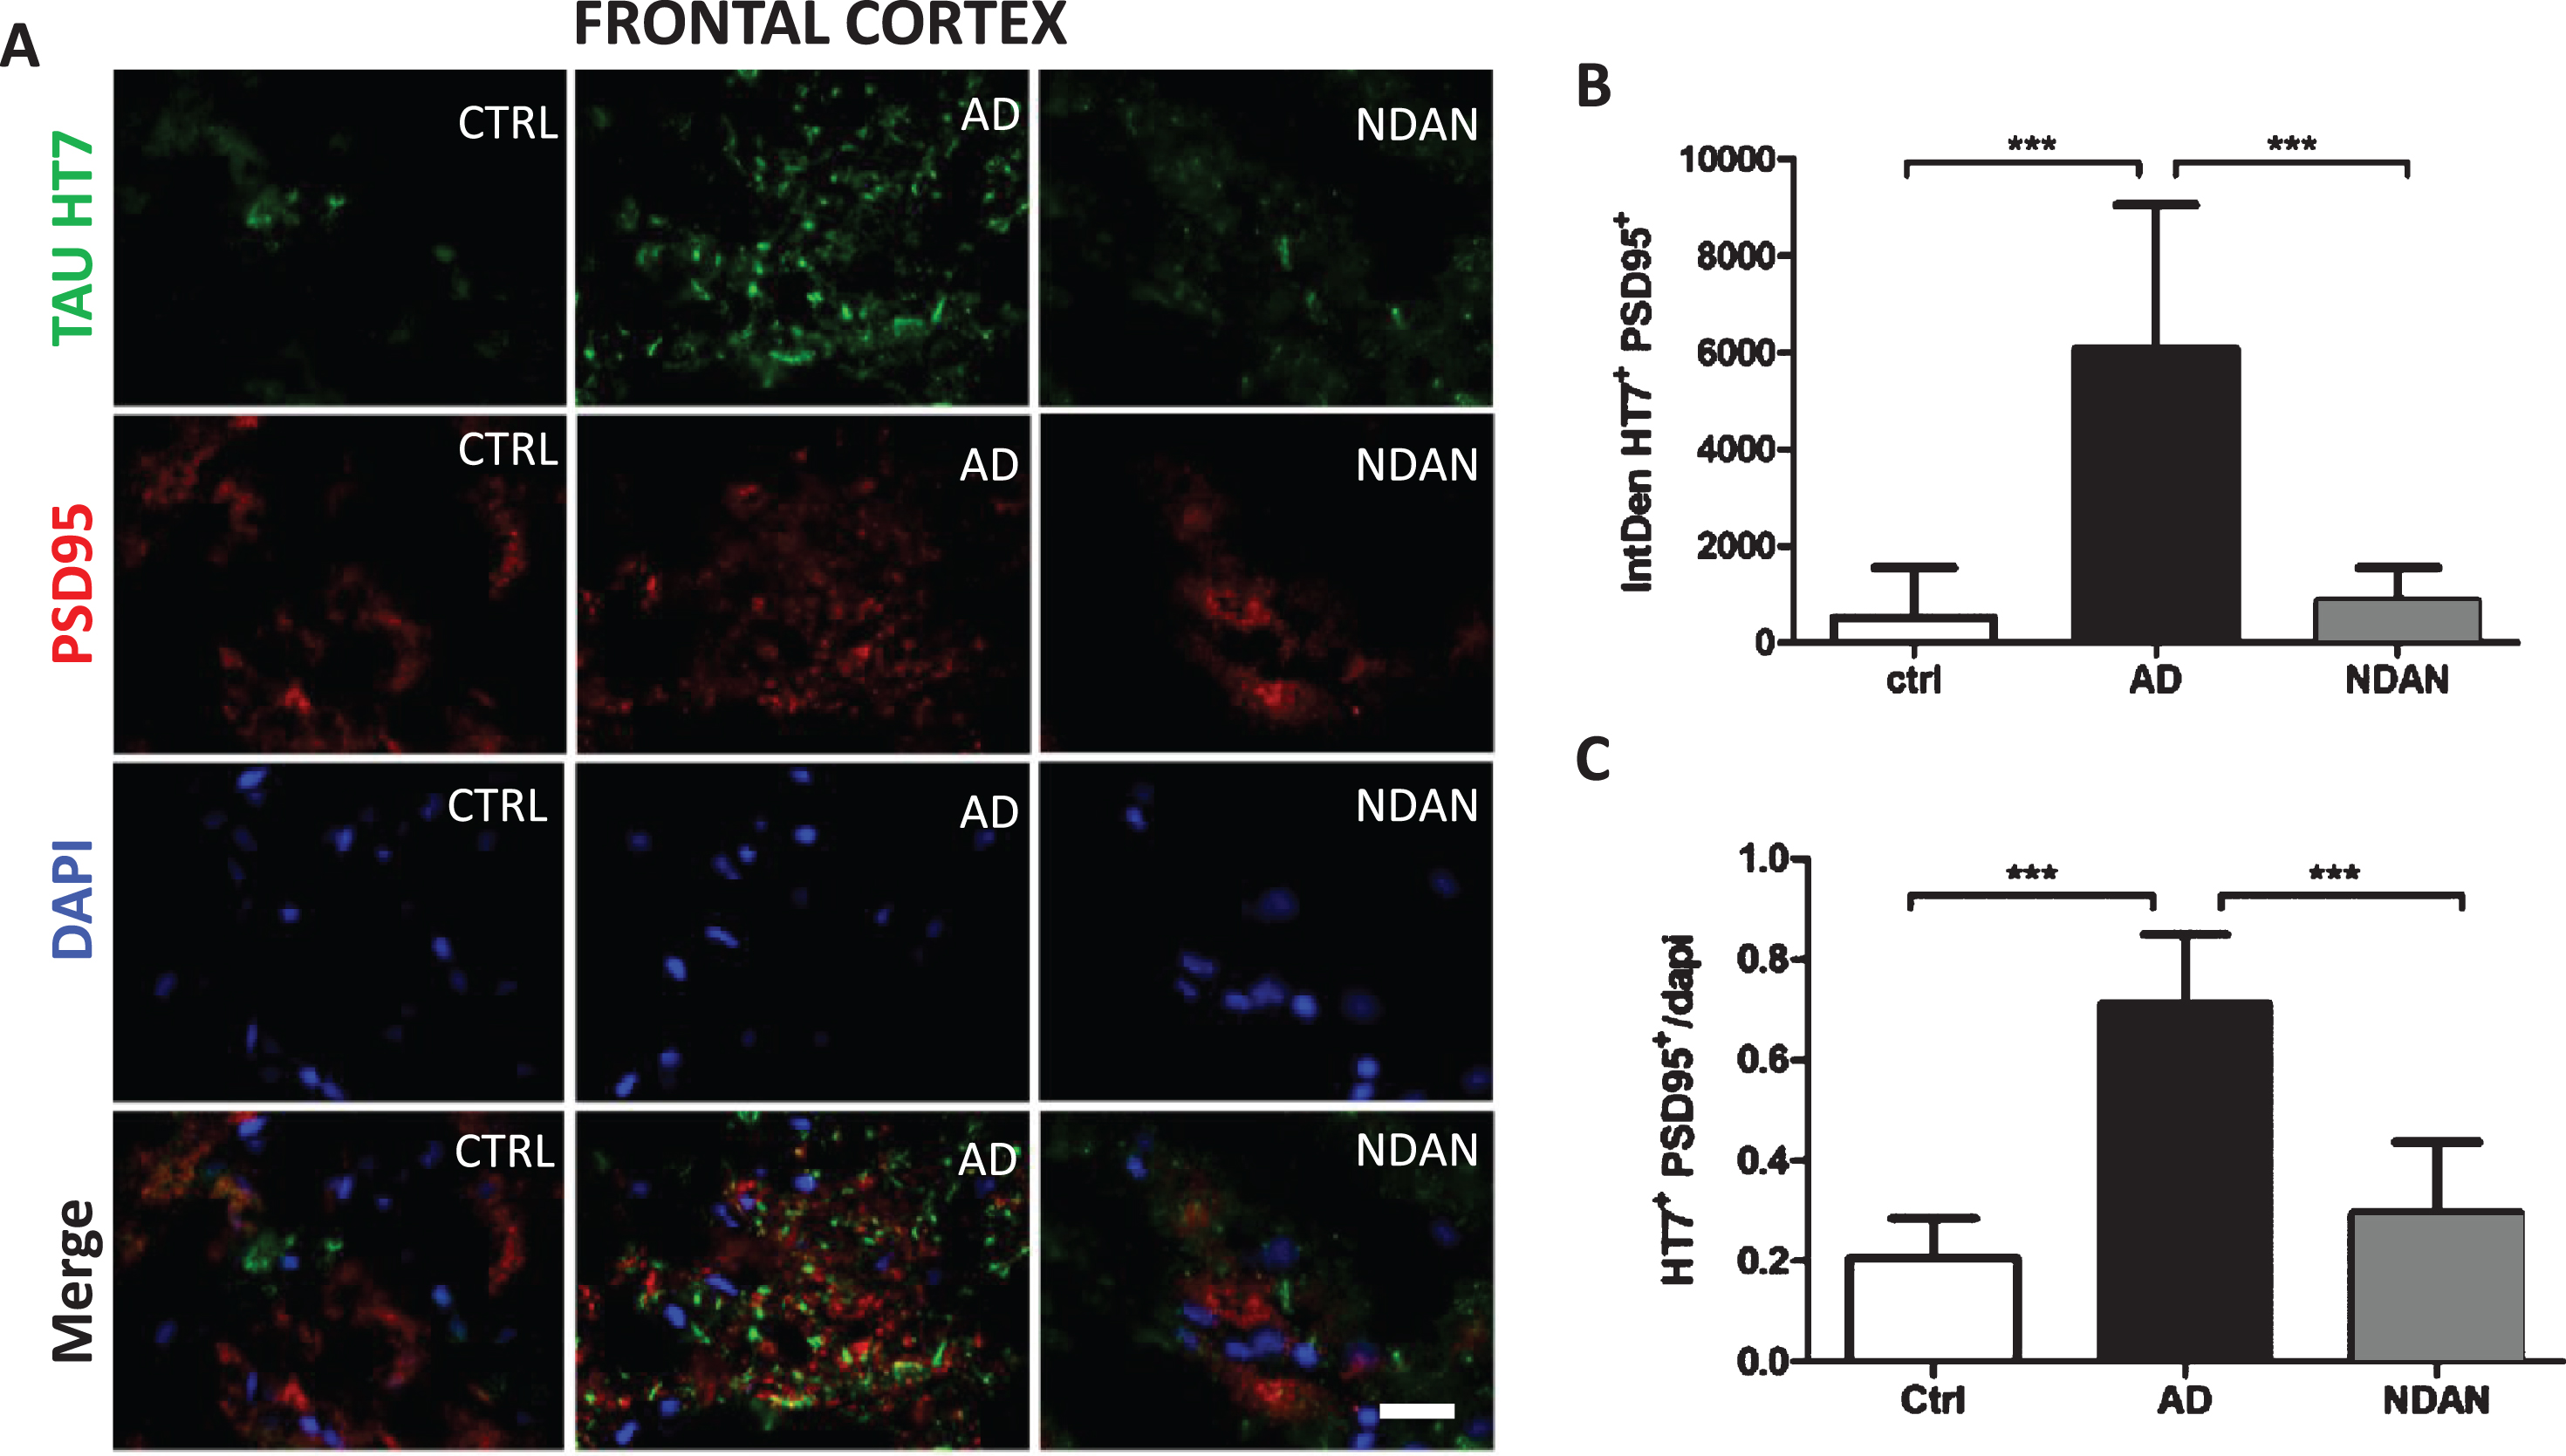
Decreased co-staining of tau and the post-synaptic marker PSD-95 in the frontal cortex of NDAN subjects. A) Representative immunofluorescence images of Ctrl, AD, and NDAN frontal cortex showing Tau HT7 (green), PSD95 (red), and DAPI (blue) with merged schema, bar scale: 100μm. B) Histogram summarizing intrinsic density of Tau HT7 and PSD95 positive immunostaining in Ctrl, AD, and NDAN. HT7+PSD95+ expression was significantly higher in the AD group (***p = 0.0001) compared to either Ctrl or (***p = 0.0001) NDAN, while no significant difference was observed between Ctrl and NDAN subjects (n = 6 subjects per group, one-way ANOVA, Tukey’s multiple comparison test). C) Histogram summarizing quantitation of DAPI containing Tau HT7 & PSD95 positive immunostaining in Ctrl, AD, and NDAN. Similar to the above result, HT7+PSD95+DAPI+ expression was also significantly higher in the AD group (***p = 0.0001) compared to either Ctrl or (***p = 0.0001) NDAN, while no significant difference was observed between Ctrl and NDAN subjects (n = 6 subjects per group, one-way ANOVA, Tukey’s multiple comparison test).
Slides were washed in PBS before incubation with the appropriate Alexa-conjugated secondary antibodies (goat anti-rabbit, goat anti-mouse, 1:400; Life Technologies; Carlsbad, CA, USA) in PBS containing 1.5% NGS/0.25% Triton X-100 for 1 h at RT. Finally, slides were washed in PBS, treated with 0.3% Sudan Black B (in 70% EtOH) for 10 min to block lipofuscin autofluorescence, washed again with deionized water, and coverslipped using Vectashield mounting medium containing 4′, 6-diamidino-2-phenylindole (DAPI) (Vector Laboratories, Burlingame, CA, USA) and sealed. All immunoreacted sections were analyzed by Nikon eclipse 80i (Nikon, Minato, Tokyo, Japan) using immersion oil 60X objectives. Quantitative analysis was performed using ImageJ software (NIH, Bethesda, MD, USA). Representative images were composed in an Adobe Photoshop CC 2020.
Fluorescence assisted single synaptosome long term potentiation (FASS-LTP)
In two recently published articles [42, 43], a chemically induced long-term potentiation technique (cLTP) utilizing synaptosomal induction by glycine and tracking insertion of glutamate AMPA receptors (GluR1) into the postsynaptic surface was proposed. These studies reported using freshly prepared synaptosomes immediately following euthanasia in mice or death in human patients. Since our brain samples are already frozen, we optimized the protocol to allow for assessment of synaptosomal FASS-LTP in any frozen brain tissue regardless of postmortem interval (PMI). Hippocampal synaptosome P2 fractions were obtained by Syn-PER extraction method as described previously [47]. Briefly, high potassium chloride concentration depolarizes synaptosomes releasing endogenous glutamate, which activates synaptic NMDA receptors in conjunction with the NMDAR co-agonist glycine. Both glutamate and glycine, then, open receptor channels, facilitating calcium influx into synaptosomes, which, in turn, initiates a cascade of events resulting in the translocation of AMPARs from internal pools into synaptic sites. The synaptosomes are then incubated with antibodies specific for extracellular epitopes on GluR1 and neurexin-1β (Nrx1β), a presynaptic adhesion molecule stabilized at the membrane surface by synaptic activity. GluR1+Nrx1β+double-labeling ensures intact synaptosomes that contain both presynaptic and post-synaptic elements. Solutions for FASS-LTP and procedures followed the protocol published previously [42, 43] with the following exception - P2 fractions containing 5,000,000 synaptosomes were suspended in 200μL extracellular solution, one each for extracellular (E), basal (B), and 200μL of cLTP (C) solution containing tubes. Extracellular solution contains (in mM): 120 NaCl, 3 KCl, 2 CaCl2, 2 MgCl2, 15 glucose, and 15 HEPES, pH 7.4; whereas cLTP solution is Mg2 +-free and contains (in mM): 150 NaCl, 2 CaCl2, 5 KCl, 10 HEPES, and 30 glucose, pH 7.4. A 30- min incubation at RT on a slowly oscillating shaker was done to recover the prep from the frozen state to respond to the biochemical steps. This critical step was essential before adding 0.001 mM strychnine and 0.02 mM bicuculline methiodide in tube C alone for activation of the receptors. Equivalent amounts of extracellular solution were added to control tubes E and B. For stimulation, 20μL of 5 mM glycine was added only to tube C whereas equal volume of extracellular solution was added to tubes E and B. Following stimulation, synaptosomes in tube C was depolarized with 100μL of solution containing (in mM) 50 NaCl, 100 KCl, 2 CaCl2, 30 glucose,10 HEPES, 0.5 glycine, 0.001 strychnine, 0.02 bicuculline and incubated at 37°C for 30 min. 100μL of extracellular solution was added to tubes E and B and incubated along with tube C for 30 min at 37°C. Following the incubation, contents in tubes E, B, and C were transferred to 15 mL centrifuge tubes. In a sequential step, ice-cold solutions of 0.5 mL of 0.1 mM EDTA-PBS and 4 mL of 5% blocking buffer (fetal bovine serum in PBS) were added to all the tubes E, B, and C to stop the reaction. Tubes were chilled on ice and centrifuged at 2500 g for 5 min at 4°C. Supernatant was discarded and 2.5μg/mL primary antibodies—GluR1 (Rabbit polyclonal ABN241, EMD Millipore) and Nrx1β (mouse monoclonal N170A/1, Antibodies Inc.)—in blocking buffer were added only to pellets of tubes B and C. To pellet E, 100μL of blocking buffer was added. After incubation on ice with agitation, tubes E, B, and C were washed twice with 1XPBS at 2500 g for 5 min. Pellets were resuspended in 2.5μ L/mL of secondary antibody (anti-rabbit Alexafluor 488 and anti-mouse Alexafluor 647, Invitrogen) in 400μL were added. After 30 min of incubation at 37°C for 45 min protected from light, synaptosomes were washed twice at 2500 g for 5 min on each wash. Supernatant was discarded and at the least 1 ml of solution of pellets were left undisturbed. 400μL of 2% paraformaldehyde in PBS was used to resuspend the pellets. Samples were subjected to flow cytometry using Guava easycyte™ 8 flow cytometer (GuavaSoft 2.7 Software). Relative size and granularity was determined by forward scatter (FSC) and side scatter (SSC) properties (see Supplementary Figure 4). FSC, SSC, and fluorescence [Red2 fluorescence (642 nm) and Green (488–532 nm)] signals were collected by using log amplification. Identical FSC settings were used for acquiring data on bead standards and samples. Synaptosome integrity were routinely assessed using standard electron microscopy [47]. Two-color parameter density plots showing Nrx1β and GluR1 surface detection in size-gated synaptosomes before and after cLTP. GluR1–Nrx1β double-positive events (upper right quadrant) increase after cLTP. For each experimental sample, the ratio of cLTP (C)/ basal (B) X 100 provided the percent association of Nrx1β -GluR1 providing a quantifiable measure of the cellular potentiation strength. The greater the ratio, the better the synaptic integrity of the system. Six subject per group (AD, NDAN, and Ctrl) were used in our assessments for frontal cortex and hippocampus. Depending upon the availability of each of these precious tissue types, one to three technical repeats were performed, and the values averaged to obtain mean and standard error of mean. To accommodate for the sample numbers, non-parametric one-way ANOVA (Kruskal-Wallis) followed by Dunn’s post-hoc was used for statistical significance at p < 0.05. 1) The use of AP5, an NMDA inhibitor, as the negative control to assess the potentiation state and in addition, 2) the use of the basal response without the cLTP buffer along with 3) primary antibody alone and 4) secondary antibody alone controls were included per experiment to exclude false positives and increase the reliability and quantification of the FASS-LTP experiments (see Supplementary Figure 4).
Microtransplantation of synaptic membranes
Membrane preparations were isolated from 30 mg of frozen frontal cortex from each brain donor using Syn-PER method (Thermo Fisher Scientific) following manufacturer instructions. The resuspended pellet enriched in synaptosomes (P2 fraction) was aliquoted and stored at –80°C until further use for electrophysiology experiments. The amount of protein was determined using the Qubit protein assay reagent kit (Thermo Fisher Scientific). Numbers of particles within the size of synaptosomes were counted as described previously [47–49], using appropriate size standards (Spherotech, Inc), in a Guava EasyCyte flow cytometer (EMD Millipore) and analyzed using Incyte software (EMD Millipore). Synaptosomes were sonicated in iced water 3 times for 5 s, at 1 min intervals between sonications, to create small proteoliposomes that can fuse to the oocytes’ extracellular membrane. One day before electrophysiological recordings the synaptic membranes were injected into stage V-VI Xenopus laevis oocytes using protocols previously published for cellular membranes [40, 41, 50]. Each oocyte was injected with 50 nL of synaptic proteoliposomes (2 mg/mL protein concentration) and characterized 18–36 h post-injection.
Electrophysiological recordings
Ion currents elicited by agonist perfusion were recorded by the two-electrode voltage clamp (TEVC) method between 18–36 h post injection [41]. Microelectrodes were filled with 3 M KCl and resistance of the microelectrodes ranged from 0.5–3.0 MΩ. Piercing and recording took place in a chamber (volume ∼0.1 ml) continuously perfused (6 ml/min) with Ringer’s solution [115 mM NaCl, 2 mM KCl, 1.8 mM CaCl2, 5 mM Hepes (pH 7.4)] at RT (19–21°C). Oocytes were voltage clamped to –80 mV. Ion currents were recorded and stored with WinEDR ver 2.3.8 Strathclyde Electrophysiology Software (John Dempster, Glasgow, UK). Kainic acid was purchased from Tocris (Minneapolis, MN). All other reagents were from Sigma (St. Louis, MO). Working solutions were made by diluting stock solutions in Ringer’s solution. Two different membrane preparations from the same subjects were tested in MSM experiments. Ion current responses were measured at least in triplicate (three oocytes) in batches of oocytes from three different frogs. All samples were injected and tested in each experiment.
Data collection and statistical analysis
Immunohistochemical studies
Quantitative analysis of captured images was performed with ImageJ (NIH) and Image J plugins. A total of 12 cases, 4 each of NDAN, AD, and Ctrl were studied. For each case, 4 slides included 2 slides each of frontal cortex and hippocampus. Twenty images were randomly chosen from each slide and the total area of structures labelled with Tau5 was calculated using ImageJ. To measure tau oligomers, only the structures that labelled with both T22 and Tau5 were considered for analysis. Area of tau oligomers was compared with the area of total tau structures in all the images taken of cases of NDAN, AD, and Ctrl. To accommodate potential non-parametric nature of the data, Kruskal-Wallis one-way ANOVA and Dunn’s post-hoc analysis was used to calculate statistical significance. p < 0.05 was considered significant. All the images were taken using Nikon eclipse 80i fluorescence microscope with 60X magnification oil immersion lens.
Electrophysiological studies
Statistical comparisons to identify the effect of diagnosis used the mean of each metric, for each subject, as experimental unit in a one-way ANOVA, followed by post-hoc Dunnett’s multiple comparisons versus control test (JMP, version 14). If variances across groups were not equal, then a nonparametric Kruskal-Wallis test was used followed by Dunn’s comparison vs control test. As a matter of confirmation, we also implemented a nested ANOVA mixed model, wherein the subjects were nested within diagnosis, and subject was tested as a random effect using the expected mean squares method. In all cases, p < 0.05 was considered significant using JMP version 14. We did not observe significant effects of postmortem interval or age on the amplitude of the responses.
RESULTS
Reduced tau oligomer levels in the CNS of NDAN subjects as compared to AD patients
We performed double fluorescence immunostaining on frontal cortex and hippocampus sections of NDAN, AD, and age-matched control samples using Tau5 and T22 antibodies. The Tau5 antibody detects total tau protein, including normal tau protein, oligomeric and late aggregates of misfolded tau protein. The T22 antibody stains for tau oligomers and does not cross-react with tau monomers or late aggregates of tau protein [51–54].
On analysis of NDAN frontal cortex sections (Fig. 1), tau oligomers labelled by T22 represented a small fraction of total tau, and T22 did not co-localize with Tau5 in all samples (Fig. 1A). Since we could not confirm whether the structures stained by T22 (but not Tau5) were tau oligomers, for quantification of oligomers, we included only those structures that were marked with both T22 and Tau5. Tau oligomers (T22/Tau5 co-localized immunostaining) were significantly less in NDAN cases in comparison to AD patients, although still elevated as compared to control subjects (Fig. 1B). We observed a similar relation of total tau (Tau5 immunostaining) where it was increased in AD and NDAN cases in comparison to control, but the expression of NDAN was significantly lower than AD (Fig. 1C). Importantly, about 11% of the tau structures across all samples showed immunoreactivity for T22 but were not stained with Tau5. A possible explanation could be the non-availability of the Tau5 specific epitope among T22 stained regions. Nevertheless, quantification of the oligomer levels using T22 alone also showed similar differences as above (T22/DAPI quantification shown in Supplementary Figure 5), thus validating our analytical approach.
Upon analysis of the hippocampal sections (representative images in Fig. 1D), we observed a similar pattern of elevated tau oligomers in both AD and NDAN, along with significantly lower levels in NDAN as compared to AD (Fig. 1E). Furthermore, similar to frontal cortex, there was a significant reduction of total tau in NDAN in comparison to AD, even though both of them expressed significantly higher levels of total tau (Fig. 1F). This was very interesting as the hippocampus, along with the locus coeruleus [55–57], is one of the earliest brain regions affected by tau pathology prior to its spread to other brain regions in AD [58, 59]. In the hippocampus, 23% of the stained structures across all samples (control, AD, or NDAN) were T22 positive but Tau5 negative and were therefore excluded from analysis.
When we compared the levels of tau oligomers or total tau to MMSE scores for each case (Supplementary Figure 1), we found a significant negative correlation in both the frontal cortex (Supplementary Figure 1A) and hippocampus (Supplementary Figure 1B) for levels of tau oligomers (T22). A similar trend was also observed for total tau (Tau5) in cortex (Supplementary Figure 1C) and hippocampus (Supplementary Figure 1D). Taken together, these results suggest diminished tau oligomers in the cortex and hippocampus of the NDAN subjects as compared to AD patients and that such reduction was consistent with maintenance of cognitive integrity.
Decreased tau oligomers at synapses in NDAN subjects
Since tau oligomers are strongly implicated in synaptic dysfunction underlying memory deficits [54], we quantified tau levels in synaptosomes isolated from the frontal cortex (Fig. 2A) or hippocampus (Fig. 2C) of AD, NDAN, and age-matched controls. Western blot analyses allow the detection of oligomeric species (see dotted box) using Tau 5 antibody when bands at the molecular weights higher than 75 kDa are quantified (Fig. 2). When we assessed the density of the bands at these molecular weights to determine the oligomeric species (normalized to β-actin loading controls), we noted a significant presence of Tau5-immunoreactive bands in AD cases as compared to control and NDAN groups, whereas there was no significant difference between the control and NDAN either in the frontal cortex (Fig. 2B) or hippocampal synapses (Fig. 2D). We also verified that the western blot profile of tau oligomers using the TTC18 antibody showed similar differences between Ctrl, AD and NDAN groups as reported above (see Supplementary Figure 6).
Similar results were obtained when frontal cortex co-localization of tau and synapses was evaluated by fluorescence immunohistochemistry using the HT7 and PSD-95 antibodies (Fig. 3A). Compared to age-matched controls, we observed a significant increase in the co-localization of PSD-95 with tau in AD cases but not in NDAN samples (Fig. 3B). Again, when we assessed the number of HT7/PSD-95 positive cells using DAPI staining (Fig. 3C), we observed again a similar trend of increasing co-localization in AD, but not in NDAN, suggesting that tau oligomer association at the synapses is remarkably lowered in NDAN subjects, despite showing higher levels of total tau (Fig. 1B) and tau oligomers (Fig. 1C) compared to controls. We validated our observation by confirming these results using the T22 tau oligomer specific antibody (Supplementary Figure 2). Furthermore, there was, again, a significant negative correlation between the levels of tau oligomers (T22, Supplementary Figure 1E) or total tau (HT7, Supplementary Figure 1F) associated with the synapses (PSD95) in the cortex and MMSE scores for each subject.
Lastly, to exclude that the changes we observed among the different cases and groups were due to variations in the handling of the human clinical samples prior to freezing, we determined whether the variations in the level of the detected antigens (tau, tau oligomers, PSD95) had any correlation with the variations in the PMI among all subjects studied here (see Table 1 for details of PMI). As shown in Supplementary Figure 3, we did not observe any significant correlation in all of our immunofluorescence studies, thus excluding this possibility.
Preserved functional integrity of NDAN synapses
Given the observed lack of tau oligomers associated with NDAN synapses, we asked whether such resilience to engage toxic oligomers would translate into preservation of synaptic functional integrity. In order to conduct such studies in postmortem human clinical samples, we assessed the integrity of the functional state of glutamate and GABA receptors in synaptosomes using two different approaches—microtransplantation of synaptic membranes [40, 41] and FASS-LTP [42, 43].
Assessing integrity of ionotropic glutamate receptors as a readout of synaptic integrity
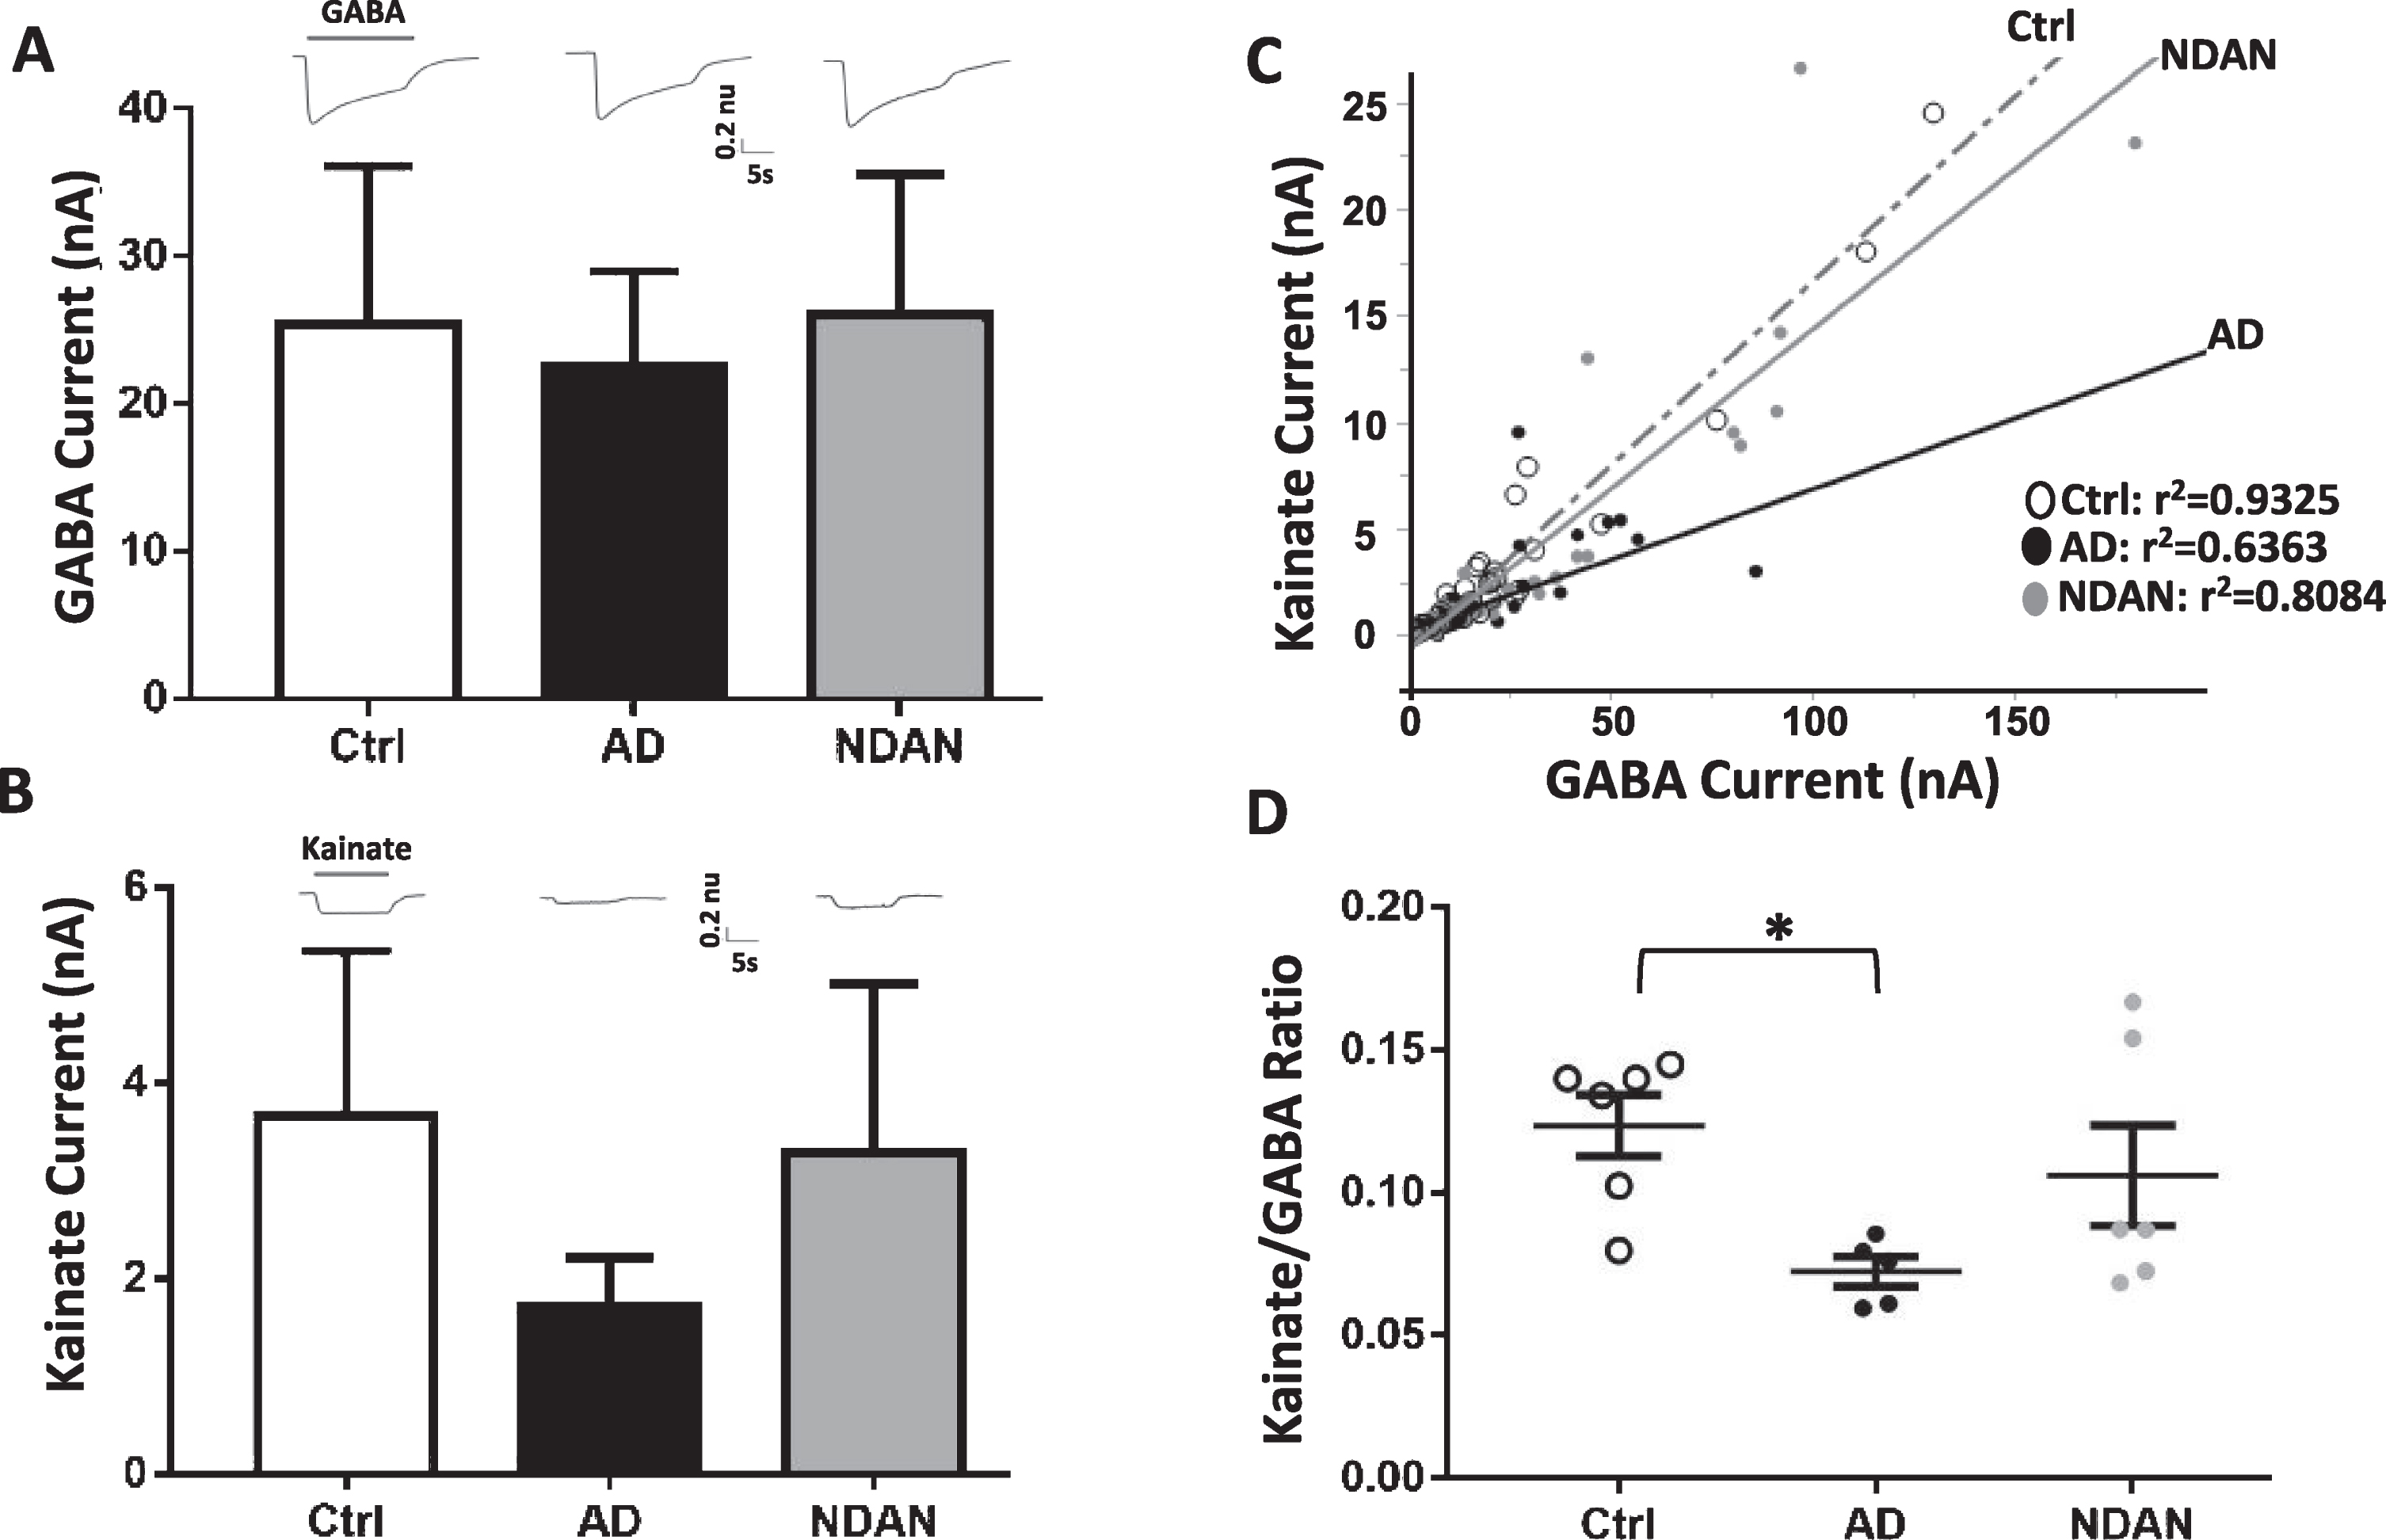
To determine whether NDAN, AD, and controls differed in their amplitude of ion currents elicited by synaptic AMPA receptors (AMPARs) and GABAA receptors (GABAARs), we microtransplanted synaptosomal membranes from the frontal cortex of each subject in Xenopus oocytes and measured the agonist-elicited responses of these excitatory and inhibitory receptors (Fig. 4). Oocytes microtransplanted with synaptosomes from each of the three groups, and clamped at a voltage of –80 mV, exhibited fast activated currents when perfused with 1 mM GABA (GABA currents, Fig. 4A) or 100μM kainate (kainate currents, Fig. 4B). Kainate is an agonist of AMPARs that keeps the channel in a non-desensitized state, allowing steady-state measurement of AMPARs currents [60]. GABA responses were larger in NDAN followed by controls and AD, but these differences did not reach statistical significance (Fig. 4A; Ctrl: 18±7.9 nA, AD: 13±7.7 nA, NDAN: 25±9.8 nA, n = 6; F(2,15) = 0.59, p < 0.57). Similarly, kainate responses were the smallest in AD, albeit not significantly, as compared to NDAN and control cases, with one subject not showing detectable levels (Fig. 4B; Ctrl: 3.6±1.7 nA, AD: 1.4±0.5 nA, NDAN: 3.3±1.7 nA; n = 6 (NDAN & control), n = 5 (AD); F(2,14) = 0.71, p < 0.5050). However, we found a robust correlation between kainate and GABA currents (Fig. 4C), likely due to the strong homeostatic excitation-to-inhibition balance in the brain. Therefore, as a within-subject normalization, we measured the kainate to GABA ratio (Kai/GABA; Fig. 4D) and found it to be significantly different across groups with the AD subjects having a significantly lower Kai/GABA ratio compared to controls (*p = 0.0388, Kruskal-Wallis one-way ANOVA Dunn’s post-hoc). Interestingly, the Kai/GABA ratio in NDAN subjects (Fig. 4D) was unaffected, being not statistically different from control (p > 0.99) or AD (p = 0.2268) cases, suggesting an intermediate phenotype. These results indicate that there is a reduced contribution of AMPARs, compared to GABAARs, in the frontal cortex of patients diagnosed with AD, which is in line with strong synapse loss previously reported in cortical brain regions affected by AD neuropathology [61]. Interestingly, the relationship of AMPARs versus GABAARs was more variable in NDAN with a similar range than control and some overlap with AD. A non-parametric Spearman’s analysis found that the Kai/GABA ratio in the frontal cortex was associated with Braak stage (ρ(17) = –0.579; *p = 0.015), indicating that part of the variability across groups was explained by the extent of tau pathology according to Braak staging.
Fig. 4
Differential activation of microtransplanted synaptic AMPA and GABA receptors from the frontal cortex of Ctrl, AD and NDAN subjects. A) GABA currents (elicited using 1 mM GABA), representing the inhibitory component, show no significant differences between Ctrl (clear bars), AD (black bar), or NDAN (grey bar). B) Similar to GABA, Kainate currents (elicited using 100 mM Kainate), representing the excitatory component, show no significant difference between the three groups. Representative ion currents for each group is provided above the bars and represented in normalized units (n.u.) to facilitate comparison of the amplitudes of GABA and kainate currents in the same scale. Kainate, instead of glutamate, was used to avoid AMPA receptors desensitization. C) Linear correlation between maximal kainate and GABA responses measured in single oocytes across groups. Each dot in this figure represents a single recorded oocyte. (r2 are shown next to each group; *p < 0.0001). D) Average of the Kainate/GABA ratio in each subject shows reduced values in AD compared to control but not to NDAN. The current ratio was different across groups (with significant reduction between Ctrl and AD (*p = 0.0388), but not between Ctrl and NDAN (p > 0.99) or AD and NDAN (p = 0.2268). Each dot represents a single subject. Color schematic for each group are provided in the legends for (C) and (D).
Assessment of synaptic function by cellular long-term potentiation between Ctrl, AD, and NDAN groups
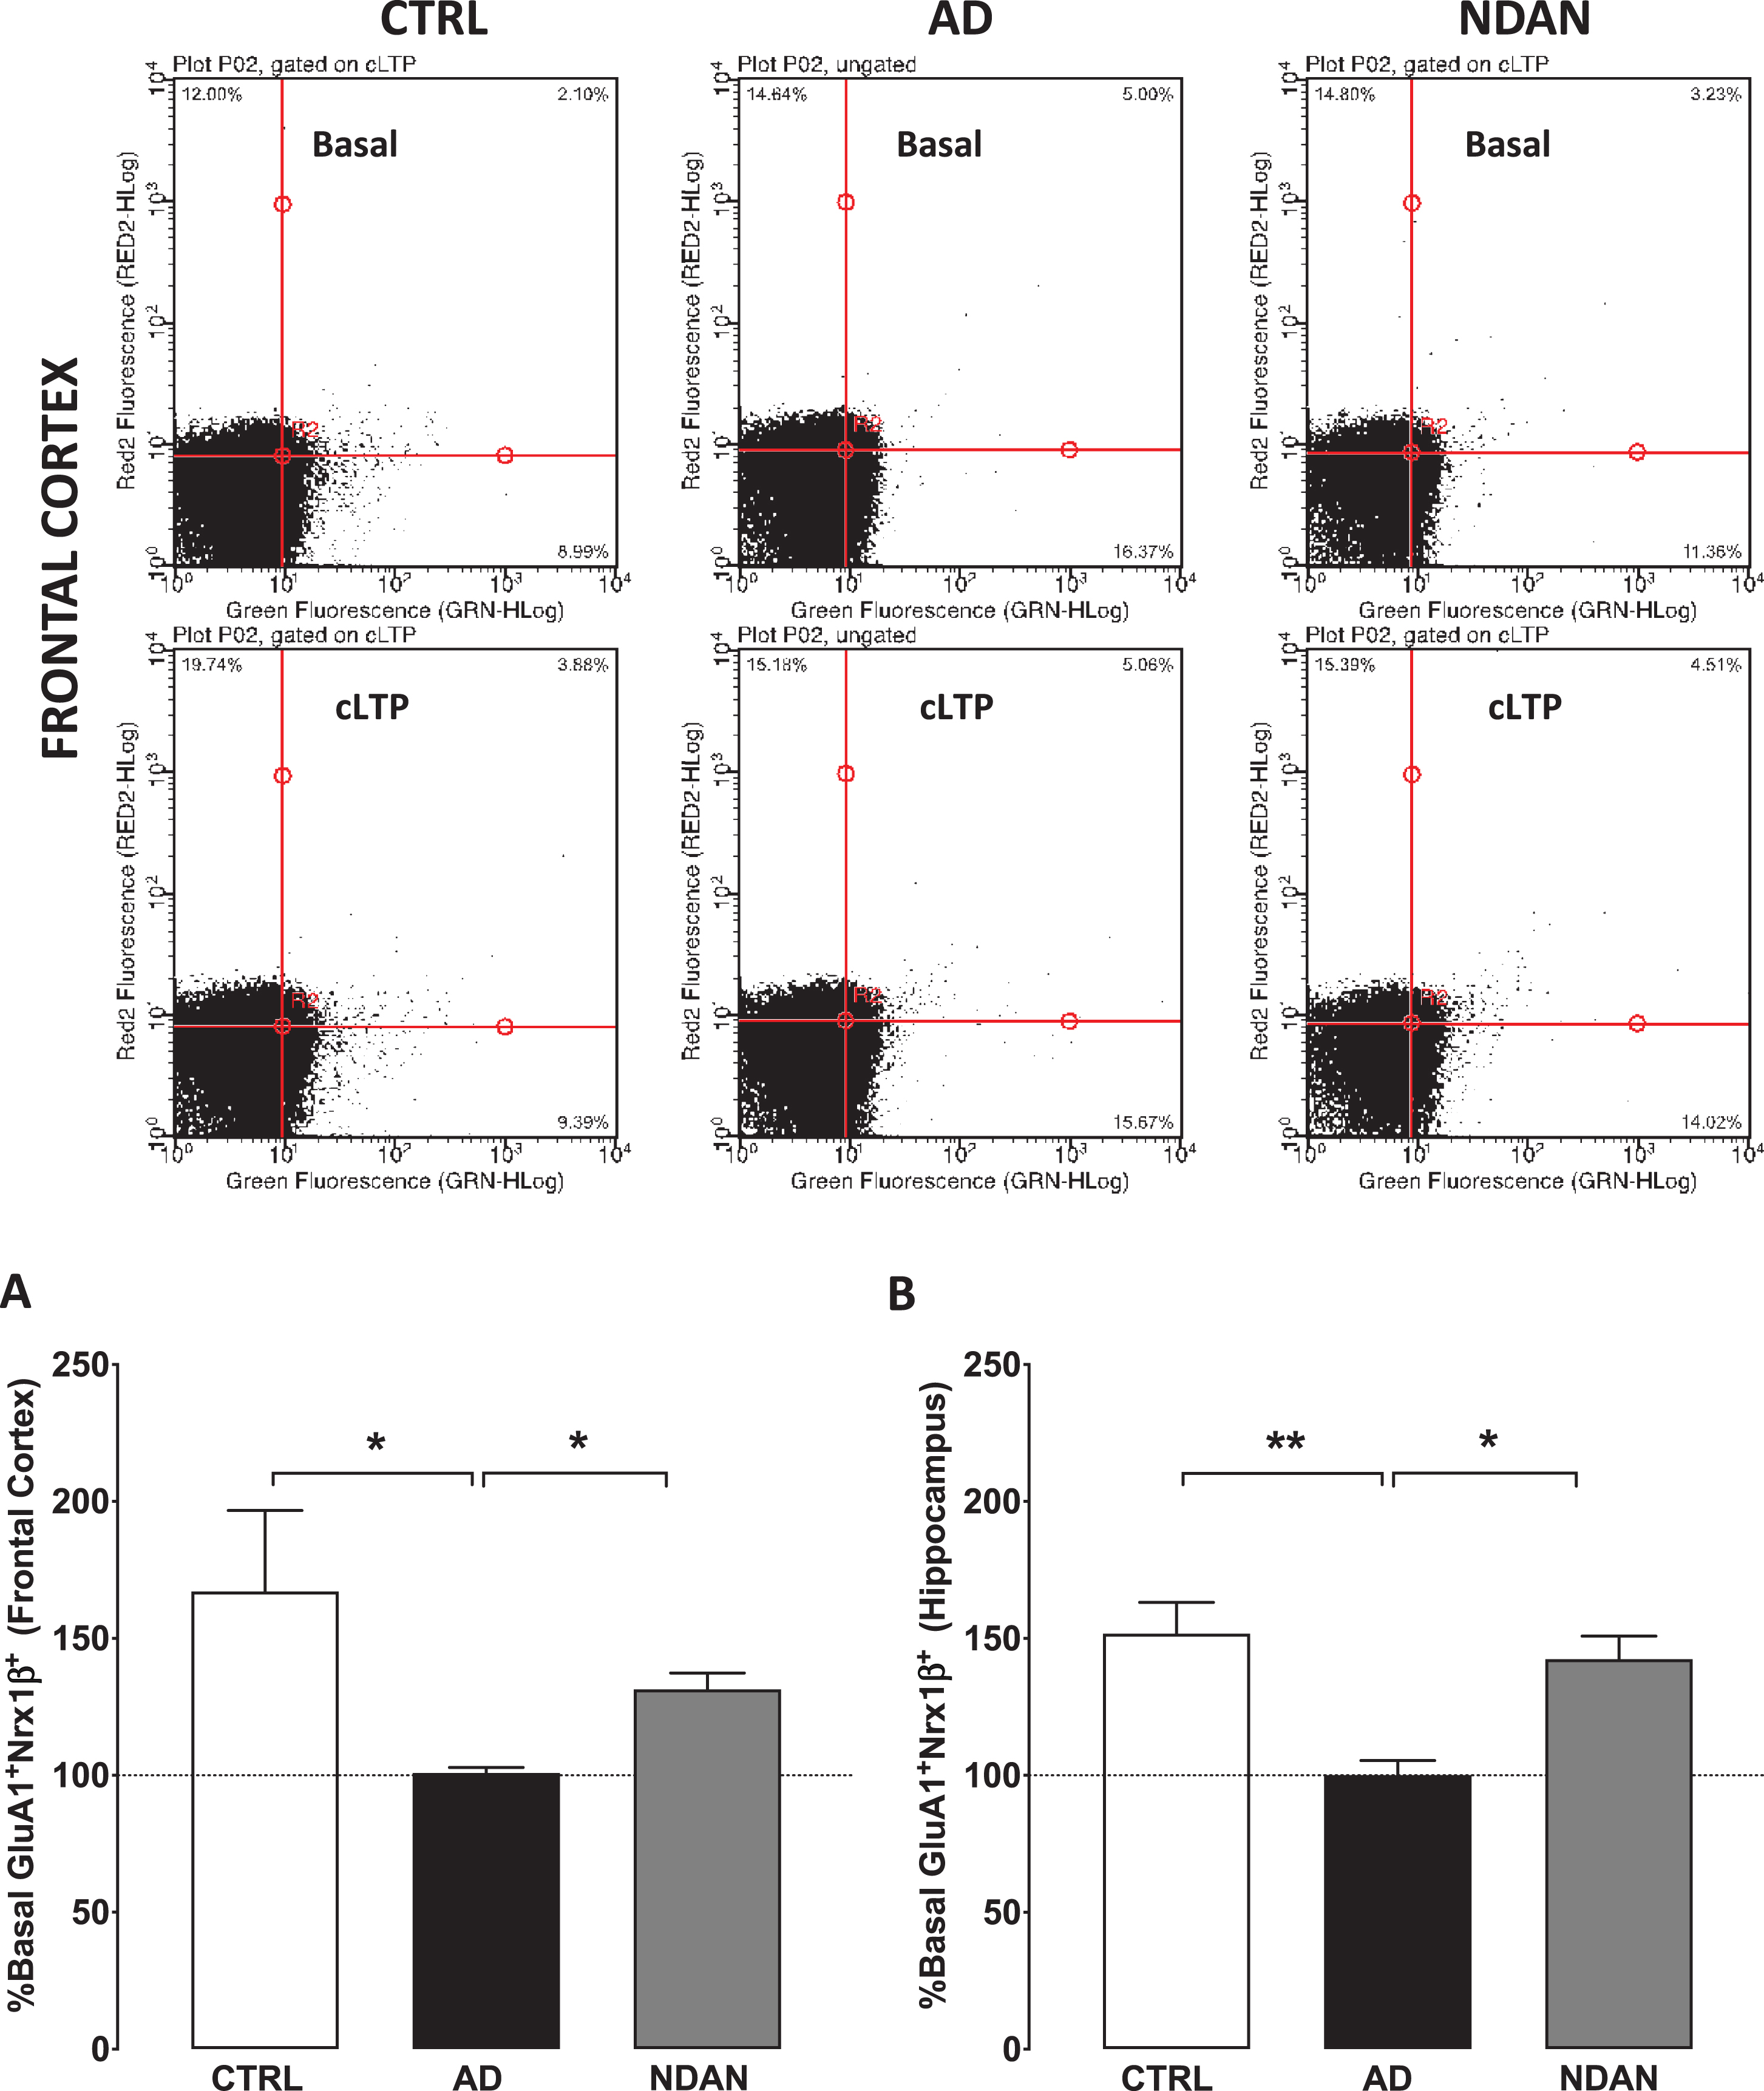
To conduct these studies, we used our validated functional FASS-LTP [42, 43] to quantify synaptic strength (Fig. 5). Assessment of synaptic function in live organisms or brain slices measures changes in the electrical properties. Such direct measurements are therefore impossible in post-mortem tissues since electrical properties are not preserved after death. As an established alternative approach, the status of synaptic functionality can be assessed by using flow-cytometry of isolated synaptosomes to study the integrity of the LTP signaling components such as GluR1 and Nrx1β, which are known to translocate at the synaptic membrane to facilitate the expression of LTP (see review by [62]). When we applied this method to determine FASS-LTP in frontal cortex synaptosomes isolated from the frozen human samples, the age-matched control and the NDAN groups showed a cLTP that was statistically different compared to AD, which failed to show any potentiation compared to the basal response (Fig. 5A; Ctrl: 167.1 ± 29.53; AD: 100.9 ± 1.950; NDAN: 131.4 ± 5.957; n = 6, *p < 0.05, Kruskal-Wallis one-way ANOVA followed by Dunn’s post-hoc). A similar profile was observed in hippocampal synaptosomes (Fig. 5B; Ctrl: 151.7 ± 11.44; AD: 100.1 ± 5.277; NDAN: 142.5 ± 8.42; n = 6, *p < 0.05, Kruskal-Wallis one-way ANOVA followed by Dunn’s post-hoc). These results clearly demonstrated that key components of the synaptic machinery involved with synaptic strengthening are dysfunctional in multiple brain areas affected in demented AD cases but preserved in cognitively intact NDAN subjects.
Fig. 5
Preserved synaptic potentiation in synaptosomes from hippocampus and frontal cortex of NDAN subjects compared to AD patients. Representative density plots showing GluA1-Nrx1β association and detection in different quadrants in size-gated synaptosomes following basal or cLTP treatment in frontal cortex synaptosomes from Ctrl, AD, or NDAN subjects. Fluorescence thresholds (non-specific) were set by staining with secondary antibodies only (lower left quadrant). Percentage GluA1/Nrx1β events increase in the upper right quadrant was used as a measure of cLTP, relative to basal conditions. Percent basal potentiation for Ctrl (clear bars), AD (black filled bars), and NDAN (grey filled bars) observed in synaptosomes from (A) fontal and (B) hippocampal regions are plotted. Synaptosomes from AD frontal cortex (*p = 0.0175 compared to Ctrl and *p = 0.0283 compared to NDAN, n = 6; one technical repeat, Kruskal-Wallis one-way ANOVA and Dunn’s post-hoc) or hippocampal region (**p = 0.0043 compared to Ctrl and *p = 0.0386 compared to NDAN, n = 6; three technical repeats) did not show potentiation above basal levels and was significantly reduced compared to either Ctrl or NDAN group.
DISCUSSION
Recent research endeavors convincingly highlight the presence of abnormal tau species in the human brain in over 20 neurodegenerative diseases, including AD, collectively known as tauopathies [63–67]. While mutations of the tau protein that promote abnormal aggregation of tau have been reported to lead to the clinical development of specific tauopathies, such as the P301L mutation in frontotemporal lobar degeneration [68], there is no evidence in the literature for such changes in AD [64]. Nevertheless, compelling evidence supports the notion that tau oligomers are elevated in the brain of AD patients [25, 34, 69]. Additional reports demonstrate that tau oligomers play a key role in onset and progression of AD dementia by targeting synapses in synergy with Aβ oligomers, thereby leading to the synaptic disruption and dysfunction that underscore the typical cognitive and memory deficits of this disorder [54]. In our earlier studies on NDAN subjects, we have reported preserved levels of synaptic functional proteins in the hippocampus [22, 70] and observed the absence of Aβ oligomers in post-synaptic densities isolated from the hippocampi of these subjects [17]. Following these initial studies, here we investigated whether tau oligomers are also absent from the synapses of NDAN subjects. We used immunohistochemistry and western blotting to quantitatively determine levels of tau oligomers, employing both frontal cortex and hippocampus to assess whether there are brain regional differences that we could measure. In using specific antibodies with different epitope recognition to target either tau oligomers or total tau, we increased our reliability in determining that, despite an equivalent load of total tau in NDAN subjects, tau oligomers were reduced in these cognitively intact individuals as compared to AD patients (Fig. 1). Most notably, immunofluorescence co-staining for tau and the synaptic marker PSD-95 revealed a strong association of tau with the synapses in AD patients but not in NDAN subjects (Fig. 3). Absence of tau oligomers at both cortical and hippocampal synapses in NDAN subjects was confirmed by western blot analysis of isolated synaptosomes showing a remarkable lack of oligomeric tau species at the synapses of NDAN subjects as compared to AD patients (Fig. 2). We were thus able to ultimately document that oligomeric tau is absent in the NDAN synapses. This confirms the existence of inherent synaptic resilience mechanisms in NDAN as proposed in our earlier studies [17, 20, 22] which are also effective in reducing or preventing tau oligomer association with the synapses, thereby likely contributing to the cognitive reserve as reflected by the higher MMSE scores of the NDAN subjects (Table 1).
There is compelling recent evidence submitting oligomeric tau as the toxic species that promotes synaptic dysfunction [25, 51, 54, 71, 72] as well as the continued onslaught resulting in neuronal degeneration. Cellular studies demonstrate that tau is required for Aβ-associated neurotoxicity [73]. The toxicity of tau oligomers and their role in cognitive deficits has been demonstrated previously in mice [23, 25]. Importantly, reducing mouse endogenous tau is sufficient to prevent Aβ-associated memory deficits in the J20 Tg mouse model, which expresses a human amyloid precursor protein (hAPP) minigene with the Swedish (K670M/N671L) and Indiana (V717F) familial AD mutations under control of the PDGF promoter [74]. In conjunction with Fyn, a kinase important for glutamatergic signaling at the synapses, and Aβ, tau drives the hyperexcitability leading to excitatory/inhibitory imbalance that results in epileptiform activity in the hAPP mouse model of AD [75]. Removing endogenous tau also prevented such epileptiform activity in mice [75] and neuronal network hyperexcitability in Drosophila.
Tau has been associated with early loss of GABA-ergic signaling and hyperexcitability followed by a strong loss of excitatory synapses at late stages [75, 77]. Our MMSE results indicate that the frontal cortex in severe AD is characterized by deficits in postsynaptic glutamatergic signaling that exceed the GABAergic deficits, an imbalance which could lead to network hypoexcitability. Since tau oligomers have been implicated in hyperexcitability, one could argue that the mechanisms that promote synaptic resili-ence in the NDAN subjects involve effective compensation of the excitatory/inhibitory balance, thereby allowing for the observed better cognitive performance (MMSE scores, Table 1). This asymmetric loss is in line with previous studies showing stronger reduction of synaptic glutamatergic transporters compared to GABAergic ones [78, 79], and with the hypometabolism of the frontal cortex in imaging studies at late stages of AD [80]. Therefore, we chose to evaluate possible functional outcomes of the absence of tau oligomers at the NDAN synapses by performing essential studies to test the functional integrity of the synapses that were spared in the NDAN subjects by the toxic tau oligomeric species. Specifically, we utilize innovative functional measures following microtransplantation of human synapses in Xenopus oocytes to assess their receptor levels (Fig. 4) and by subjecting the isolated synaptosomes to FASS-LTP (Fig. 5) that assessed the ability of the synapses to show cellular potentiation in NDAN subjects. These compelling substitutes for functional analysis in human clinical systems provided corroborating evidence showing that the excitatory/inhibitory ratio of NDAN subjects were maintained at levels comparable to synapses from healthy control subjects (Fig. 4). Indeed, the NDAN synapses in the hippocampus (Fig. 5B) or the frontal cortex (Fig. 5A) showed proper transmembrane movement of key molecular elements of potentiation, suggesting that the underlying synaptic resilience involves preserved AMPA receptor integrity to facilitate early LTP responses [81–83], an important aspect that was lost in the AD samples that we tested (Fig. 4A, B). Thus, our results reflect the synaptic imbalance at late stages of AD, where, in addition to the time-dependent tau effects on synaptic dysfunction, differential vulnerability across cortical brain regional suggests that different patterns of synaptic remodeling can be present in the AD brain regions that account for the distinct clinical presentation of AD [84].
In summary, here we report, for the first time in human clinical samples, that the absence of tau oligomers at synapses is associated with preserved functional synaptic integrity and cognitive competency in NDAN subjects, who retain cognitive ability despite the presence of amyloid plaques, neurofibrillary tangles and Braak staging consistent with symptomatic AD. Importantly, we support our conclusion through the use innovative functional studies in the postmortem human brain to measure the functional integrity of the synapses and their ability to modulate essential LTP components, thereby increasing the validity of our findings. Therefore, our results support the hypothesis that, in humans, the oligomers are the main toxic species of the misfolded tau protein and are responsible for the synaptic injury ultimately leading to the clinical development of dementia in AD. In addition, given our previous published observation that NDAN are devoid of synaptic Aβ oligomers [17], we propose that the NDAN synapses show overall intrinsic resilience to oligomer interaction, that prevents the insult by either Aβ or tau oligomers and thus substantially contributes to the observed maintenance of cognitive competency in this subjects. At the same time, we acknowledge the fact that there may be additional physiologic or molecular mechanisms concurring to render NDAN resilient to development of dementia. Many groups including ours are making considerable efforts to explore the reason behind such resistance, including hippocampal volume, preserved neurogenesis, unique synaptic proteome and modulated synaptic zinc metabolism, among others [14, 16, 17, 19, 21, 22]. Understanding of the collective contribution of these mechanisms to synaptic resistance to toxic tau and Aβ oligomers will be key for the development of future innovative therapeutic concepts centered on promoting cognitive resilience in the face of AD neuropathology.
In addition to fostering such future therapeutic developments, our study strongly supports the importance of targeting tau oligomers for the development of new therapeutic strategies against AD. Many studies have shown the efficacy of passive immunotherapy targeting tau oligomers [85, 86] and as we move toward the goal of developing treatment for AD, the present results encourage the notion that tau oligomers must be recognized as an important potential target to curb a primary cellular mechanism (i.e., synaptic disruption) underscoring AD dementia in humans [87–92].
ACKNOWLEDGMENTS
Supported by NIH/NIA grant R21AG059223 (B.K.), R01AG042890 (G.T.), R01AG054025 (G.T.), P30AG066518 (RW –Oregon Alzheimer’s Disease Center), The Amon Carter Foundation (G.T.) and the Roberts Foundation (G.T.).
Authors’ disclosures available online (https://www.j-alz.com/manuscript-disclosures/20-0716r1).
SUPPLEMENTARY MATERIAL
[1] The supplementary material is available in the electronic version of this article: https://dx.doi.org/10.3233/JAD200716.
REFERENCES
[1] | Hardy J , Allsop D ((1991) ) Amyloid deposition as the central event in the aetiology of Alzheimer’s disease. Trends Pharmacol Sci 12: , 383–388. |
[2] | Braak H , Braak E ((1991) ) Demonstration of amyloid deposits and neurofibrillary changes in whole brain sections. Brain Pathol 1: , 213–216. |
[3] | O’Brien RJ , Wong PC ((2011) ) Amyloid precursor protein processing and Alzheimer’s disease. Annu Rev Neurosci 34: , 185–204. |
[4] | ((2019) ) 2019 Alzheimer’s disease facts and figures. Alzheimers Dement 15: , 321–387. |
[5] | Raftery AE , Chunn JL , Gerland P , Sevčíková H ((2013) ) Bayesian probabilistic projections of life expectancy for all countries. Demography 50: , 777–801. |
[6] | van der Kant R , Goldstein LSB , Ossenkoppele R ((2020) ) Amyloid-β-independent regulators of tau pathology in Alzheimer disease. Nat Rev Neurosci 21: , 21–35. |
[7] | Bourdenx M , Koulakiotis NS , Sanoudou D , Bezard E , Dehay B , Tsarbopoulos A ((2017) ) Protein aggregation and neurodegeneration in prototypical neurodegenerative diseases: Examples of amyloidopathies, tauopathies and synucleinopathies. Prog Neurobiol 155: , 171–193. |
[8] | Pooler AM , Noble W , Hanger DP ((2014) ) A role for tau at the synapse in Alzheimer’s disease pathogenesis. Neuropharmacology 76 Pt A: , 1–8. |
[9] | Pozueta J , Lefort R , Shelanski ML ((2013) ) Synaptic changes in Alzheimer’s disease and its models. Neuroscience 251: , 51–65. |
[10] | Lai KO , Ip NY ((2013) ) Structural plasticity of dendritic spines: The underlying mechanisms and its dysregulation in brain disorders. Biochim Biophys Acta 1832: , 2257–2263. |
[11] | Kopeikina KJ , Hyman BT , Spires-Jones TL ((2012) ) Soluble forms of tau are toxic in Alzheimer’s disease. Transl Neurosci 3: , 223–233. |
[12] | Kramer PL , Xu H , Woltjer RL , Westaway SK , Clark D , Erten-Lyons D , Kaye JA , Welsh-Bohmer KA , Troncoso JC , Markesbery WR , Petersen RC , Turner RS , Kukull WA , Bennett DA , Galasko D , Morris JC , Ott J ((2011) ) Alzheimer disease pathology in cognitively healthy elderly: A genome-wide study. Neurobiol Aging 32: , 2113–2122. |
[13] | Lue LF , Kuo YM , Roher AE , Brachova L , Shen Y , Sue L , Beach T , Kurth JH , Rydel RE , Rogers J ((1999) ) Soluble amyloid beta peptide concentration as a predictor of synaptic change in Alzheimer’s disease. Am J Pathol 155: , 853–862. |
[14] | Erten-Lyons D , Woltjer RL , Dodge H , Nixon R , Vorobik R , Calvert JF , Leahy M , Montine T , Kaye J ((2009) ) Factors associated with resistance to dementia despite high Alzheimer disease pathology. Neurology 72: , 354–360. |
[15] | Riudavets MA , Iacono D , Resnick SM , O’Brien R , Zonderman AB , Martin LJ , Rudow G , Pletnikova O , Troncoso JC ((2007) ) Resistance to Alzheimer’s pathology is associated with nuclear hypertrophy in neurons. Neurobiol Aging 28: , 1484–1492. |
[16] | Iacono D , O’Brien R , Resnick SM , Zonderman AB , Pletnikova O , Rudow G , An Y , West MJ , Crain B , Troncoso JC ((2008) ) Neuronal hypertrophy in asymptomatic Alzheimer disease. J Neuropathol Exp Neurol 67: , 578–589. |
[17] | Bjorklund NL , Reese LC , Sadagoparamanujam VM , Ghirardi V , Woltjer RL , Taglialatela G ((2012) ) Absence of amyloid beta oligomers at the postsynapse and regulated synaptic Zn2+in cognitively intact aged individuals with Alzheimer’s disease neuropathology. Mol Neurodegener 7: , 23. |
[18] | Montine TJ , Phelps CH , Beach TG , Bigio EH , Cairns NJ , Dickson DW , Duyckaerts C , Frosch MP , Masliah E , Mirra SS , Nelson PT , Schneider JA , Thal DR , Trojanowski JQ , Vinters HV , Hyman BT , National Institute on Aging; Alzheimer’s Association ((2012) ) National Institute on Aging-Alzheimer’s Association guidelines for the neuropathologic assessment of Alzheimer’s disease: A practical approach. Acta Neuropathol 123: , 1–11. |
[19] | Zolochevska O , Taglialatela G ((2016) ) Non-demented individuals with Alzheimer’s disease neuropathology: Resistance to cognitive decline may reveal new treatment strategies. Curr Pharm Des 22: , 4063–4068. |
[20] | Briley D , Ghirardi V , Woltjer R , Renck A , Zolochevska O , Taglialatela G , Micci MA ((2016) ) Preserved neurogenesis in non-demented individuals with AD neuropathology. Sci Rep 6: , 27812. |
[21] | Crawford JR , Bjorklund NL , Taglialatela G , Gomer RH ((2012) ) Brain serum amyloid P levels are reduced in individuals that lack dementia while having Alzheimer’s disease neuropathology. Neurochem Res 37: , 795–801. |
[22] | Zolochevska O , Bjorklund N , Woltjer R , Wiktorowicz JE , Taglialatela G ((2018) ) Postsynaptic proteome of non-demented individuals with Alzheimer’s disease neuropathology. J Alzheimers Dis 65: , 659–682. |
[23] | Berger Z , Roder H , Hanna A , Carlson A , Rangachari V , Yue M , Wszolek Z , Ashe K , Knight J , Dickson D , Andorfer C , Rosenberry TL , Lewis J , Hutton M , Janus C ((2007) ) Accumulation of pathological tau species and memory loss in a conditional model of tauopathy. J Neurosci 27: , 3650–3662. |
[24] | Polydoro M , Acker CM , Duff K , Castillo PE , Davies P ((2009) ) Age-dependent impairment of cognitive and synaptic function in the htau mouse model of tau pathology. J Neurosci 29: , 10741–10749. |
[25] | Lasagna-Reeves CA , Castillo-Carranza DL , Sengupta U , Clos AL , Jackson GR , Kayed R ((2011) ) Tau oligomers impair memory and induce synaptic and mitochondrial dysfunction in wild-type mice. Mol Neurodegener 6: , 39. |
[26] | Spires-Jones TL , Kopeikina KJ , Koffie RM , de Calignon A , Hyman BT ((2011) ) Are tangles as toxic as they look?. J Mol Neurosci 45: , 438–444. |
[27] | Yoshiyama Y , Higuchi M , Zhang B , Huang SM , Iwata N , Saido TC , Maeda J , Suhara T , Trojanowski JQ , Lee VM ((2007) ) Synapse loss and microglial activation precede tangles in a P301S tauopathy mouse model. Neuron 53: , 337–351. |
[28] | Cowan Catherine M , Quraishe S , Mudher A ((2012) ) What is the pathological significance of tau oligomers?. Biochem Soc Trans 40: , 693–697. |
[29] | Wittmann CW , Wszolek MF , Shulman JM , Salvaterra PM , Lewis J , Hutton M , Feany MB ((2001) ) Tauopathy in Drosophila: Neuro degeneration without neurofibrillary tangles. Science 293: , 711–714. |
[30] | Santacruz K , Lewis J , Spires T , Paulson J , Kotilinek L , Ingelsson M , Guimaraes A , DeTure M , Ramsden M , McGowan E , Forster C , Yue M , Orne J , Janus C , Mariash A , Kuskowski M , Hyman B , Hutton M , Ashe KH ((2005) ) Tau suppression in a neurodegenerative mouse model improves memory function. Science 309: , 476–481. |
[31] | Morsch R , Simon W , Coleman PD ((1999) ) Neurons may live for decades with neurofibrillary tangles. J Neuropathol Exp Neurol 58: , 188–197. |
[32] | Gomez-Isla T , Hollister R , West H , Mui S , Growdon JH , Petersen RC , Parisi JE , Hyman BT ((1997) ) Neuronal loss correlates with but exceeds neurofibrillary tangles in Alzheimer’s disease. Ann Neurol 41: , 17–24. |
[33] | Terry RD ((2000) ) Do neuronal inclusions kill the cell?. J Neural Transm Suppl 59: , 91–93. |
[34] | Maeda S , Sahara N , Saito Y , Murayama S , Ikai A , Takashima A ((2006) ) Increased levels of granular tau oligomers: An early sign of brain aging and Alzheimer’s disease. Neurosci Res 54: , 197–201. |
[35] | van de Nes JA , Nafe R , Schlote W ((2008) ) Non-tau based neuronal degeneration in Alzheimer’s disease –an immunocytochemical and quantitative study in the supragranular layers of the middle temporal neocortex. Brain Res 1213: , 152–165. |
[36] | de Calignon A , Fox LM , Pitstick R , Carlson GA , Bacskai BJ , Spires-Jones TL , Hyman BT ((2010) ) Caspase activation precedes and leads to tangles. Nature 464: , 1201–1204. |
[37] | Margittai M , Langen R ((2004) ) Template-assisted filament growth by parallel stacking of tau. Proc Natl Acad Sci U S A 101: , 10278–10283. |
[38] | Lee VM , Balin BJ , Otvos L Jr. , Trojanowski JQ ((1991) ) A68: A major subunit of paired helical filaments and derivatized forms of normal Tau. Science 251: , 675–678. |
[39] | Bjorklund NL , Sadagoparamanujam VM , Taglialatela G ((2012) ) Selective, quantitative measurement of releasable synaptic zinc in human autopsy hippocampal brain tissue from Alzheimer’s disease patients. J Neurosci Methods 203: , 146–151. |
[40] | Limon A , Reyes-Ruiz JM , Miledi R ((2008) ) Microtransplantation of neurotransmitter receptors from postmortem autistic brains to Xenopus oocytes. Proc Natl Acad Sci U S A 105: , 10973–10977. |
[41] | Limon A , Reyes-Ruiz JM , Miledi R ((2012) ) Loss of functional GABA(A) receptors in the Alzheimer diseased brain. Proc Natl Acad Sci U S A 109: , 10071–10076. |
[42] | Prieto GA , Snigdha S , Baglietto-Vargas D , Smith ED , Berchtold NC , Tong L , Ajami D , LaFerla FM , Rebek J Jr. , Cotman CW ((2015) ) Synapse-specific IL-1 receptor subunit reconfiguration augments vulnerability to IL-1beta in the aged hippocampus. Proc Natl Acad Sci U S A 112: , E5078–5087. |
[43] | Prieto GA , Trieu BH , Dang CT , Bilousova T , Gylys KH , Berchtold NC , Lynch G , Cotman CW ((2017) ) Pharmacological rescue of long-term potentiation in Alzheimer diseased synapses. J Neurosci 37: , 1197–1212. |
[44] | Folstein MF , Folstein SE , McHugh PR ((1975) ) “Mini-mental state”. A practical method for grading the cognitive state of patients for the clinician. J Psychiatr Res 12: , 189–198. |
[45] | Folstein MF , Whitehouse PJ ((1983) ) Cognitive impairment of Alzheimer’s disease. Neurotoxicol Teratol 5: , 631–634. |
[46] | Braak H , Braak E ((1991) ) Neuropathological stageing of Alzheimer-related changes. Acta Neuropathol 82: , 239–259. |
[47] | Franklin W , Taglialatela G ((2016) ) A method to determine insulin responsiveness in synaptosomes isolated from frozen brain tissue. J Neurosci Methods 261: , 128–134. |
[48] | Gylys KH , Fein JA , Cole GM ((2000) ) Quantitative characterization of crude synaptosomal fraction (P-2) components by flow cytometry. J Neurosci Res 61: , 186–192. |
[49] | Gylys KH , Fein JA , Yang F , Cole GM ((2004) ) Enrichment of presynaptic and postsynaptic markers by size-based gating analysis of synaptosome preparations from rat and human cortex. Cytometry A 60: , 90–96. |
[50] | Marsal J , Tigyi G , Miledi R ((1995) ) Incorporation of acetylcholine receptors and Cl- channels in Xenopus oocytes injected with Torpedo electroplaque membranes. Proc Natl Acad Sci U S A 92: , 5224–5228. |
[51] | Montalbano M , McAllen S , Sengupta U , Puangmalai N , Bhatt N , Ellsworth A , Kayed R ((2019) ) Tau oligomers mediate aggregation of RNA-binding proteins Musashi1 and Musashi2 inducing Lamin alteration. Aging Cell 18: , e13035. |
[52] | Congdon EE , Lin Y , Rajamohamedsait HB , Shamir DB , Krishnaswamy S , Rajamohamedsait WJ , Rasool S , Gonzalez V , Levenga J , Gu J , Hoeffer C , Sigurdsson EM ((2016) ) Affinity of Tau antibodies for solubilized pathological Tau species but not their immunogen or insoluble Tau aggregates predicts in vivo and ex vivo efficacy. Mol Neurodegener 11: , 62. |
[53] | Lasagna-Reeves CA , Castillo-Carranza DL , Sengupta U , Sarmiento J , Troncoso J , Jackson GR , Kayed R ((2012) ) Identification of oligomers at early stages of tau aggregation in Alzheimer’s disease. FASEB J 26: , 1946–1959. |
[54] | Fa M , Puzzo D , Piacentini R , Staniszewski A , Zhang H , Baltrons MA , Li Puma DD , Chatterjee I , Li J , Saeed F , Berman HL , Ripoli C , Gulisano W , Gonzalez J , Tian H , Costa JA , Lopez P , Davidowitz E , Yu WH , Haroutunian V , Brown LM , Palmeri A , Sigurdsson EM , Duff KE , Teich AF , Honig LS , Sierks M , Moe JG , D’Adamio L , Grassi C , Kanaan NM , Fraser PE , Arancio O ((2016) ) Extracellular tau oligomers produce an immediate impairment of LTP and memory. Sci Rep 6: , 19393. |
[55] | Mather M , Harley CW ((2016) ) The locus coeruleus: Essential for maintaining cognitive function and the aging brain. Trends Cogn Sci 20: , 214–226. |
[56] | Phillips C , Fahimi A , Das D , Mojabi FS , Ponnusamy R , Salehi A ((2016) ) Noradrenergic system in Down syndrome and Alzheimer’s disease a target for therapy. Curr Alzheimer Res 13: , 68–83. |
[57] | Weinshenker D ((2018) ) Long road to ruin: Noradrenergic dysfunction in neurodegenerative disease. Trends Neurosci 41: , 211–223. |
[58] | Braak H , Del Tredici K ((2012) ) Where, when, and in what form does sporadic Alzheimer’s disease begin?. Curr Opin Neurol 25: , 708–714. |
[59] | Braak H , Thal DR , Ghebremedhin E , Del Tredici K ((2011) ) Stages of the pathologic process in Alzheimer disease: Age categories from 1 to 100 years. J Neuropathol Exp Neurol 70: , 960–969. |
[60] | Levchenko-Lambert Y , Turetsky DM , Patneau DK ((2011) ) Not all desensitizations are created equal: Physiological evidence that AMPA receptor desensitization differs for kainate and glutamate. J Neurosci 31: , 9359–9367. |
[61] | DeKosky ST , Scheff SW ((1990) ) Synapse loss in frontal cortex biopsies in Alzheimer’s disease: Correlation with cognitive severity. Ann Neurol 27: , 457–464. |
[62] | Sudhof TC ((2017) ) Synaptic neurexin complexes: A molecular code for the logic of neural circuits. Cell 171: , 745–769. |
[63] | Tracy TE , Gan L ((2018) ) Tau-mediated synaptic and neuronal dysfunction in neurodegenerative disease. Curr Opin Neurobiol 51: , 134–138. |
[64] | Kovacs GG ((2017) ) Chapter 25 – Tauopathies. In Handbook of Clinical Neurology, Kovacs GG, Alafuzoff I, eds. Elsevier, pp. 355-368. |
[65] | Wang Y , Mandelkow E ((2016) ) Tau in physiology and pathology. Nat Rev Neurosci 17: , 5–21. |
[66] | Iqbal K , Liu F , Gong CX ((2016) ) Tau and neurodegenerative disease: The story so far. Nat Rev Neurol 12: , 15–27. |
[67] | Lee VM , Goedert M , Trojanowski JQ ((2001) ) Neurodegenerative tauopathies. Annu Rev Neurosci 24: , 1121–1159. |
[68] | Finger EC ((2016) ) Frontotemporal dementias. Continuum (Minneap Minn) 22: , 464–489. |
[69] | Patterson KR , Remmers C , Fu Y , Brooker S , Kanaan NM , Vana L , Ward S , Reyes JF , Philibert K , Glucksman MJ , Binder LI ((2011) ) Characterization of prefibrillar Tau oligomers in vitro and in Alzheimer disease. J Biol Chem 286: , 23063–23076. |
[70] | Reese LC , Laezza F , Woltjer R , Taglialatela G ((2011) ) Dysregulated phosphorylation of Ca(2+) /calmodulin-dependent protein kinase II-alpha in the hippocampus of subjects with mild cognitive impairment and Alzheimer’s disease. J Neurochem 119: , 791–804. |
[71] | Comerota MM , Tumurbaatar B , Krishnan B , Kayed R , Taglialatela G ((2019) ) Near infrared light treatment reduces synaptic levels of toxic tau oligomers in two transgenic mouse models of human tauopathies. Mol Neurobiol 56: , 3341–3355. |
[72] | Krishnan B , Kayed R , Taglialatela G ((2018) ) Elevated phospholipase D isoform 1 in Alzheimer’s disease patients’ hippocampus: Relevance to synaptic dysfunction and memory deficits. Alzheimers Dement (N Y) 4: , 89–102. |
[73] | Liu T , Perry G , Chan HW , Verdile G , Martins RN , Smith MA , Atwood CS ((2004) ) Amyloid-β-induced toxicity of primary neurons is dependent upon differentiation-associated increases in tau and cyclin-dependent kinase 5 expression. J Neurochem 88: , 554–563. |
[74] | Roberson ED , Scearce-Levie K , Palop JJ , Yan F , Cheng IH , Wu T , Gerstein H , Yu GQ , Mucke L ((2007) ) Reducing endogenous tau ameliorates amyloid beta-induced deficits in an Alzheimer’s disease mouse model. Science 316: , 750–754. |
[75] | Roberson ED , Halabisky B , Yoo JW , Yao J , Chin J , Yan F , Wu T , Hamto P , Devidze N , Yu G-Q , Palop JJ , Noebels JL , Mucke L ((2011) ) Amyloid-β/Fyn–induced synaptic, network, and cognitive impairments depend on tau levels in multiple mouse models of Alzheimer’s disease. J Neurosci 31: , 700–711. |
[76] | Holth JK , Bomben VC , Reed JG , Inoue T , Younkin L , Younkin SG , Pautler RG , Botas J , Noebels JL ((2013) ) Tau loss attenuates neuronal network hyperexcitability in mouse and} genetic models of epilepsy. J Neurosci 33: , 1651–1659. |
[77] | Shimojo M , Takuwa H , Takado Y , Tokunaga M , Tsukamoto S , Minatohara K , Ono M , Seki C , Maeda J , Urushihata T , Minamihisamatsu T , Aoki I , Kawamura K , Zhang MR , Suhara T , Sahara N , Higuchi M ((2020) ) Selective disruption of inhibitory synapses leading to neuronal hyperexcitability at an early stage of tau pathogenesis in a mouse model. J Neurosci 40: , 3491–3501. |
[78] | Poirel O , Mella S , Videau C , Ramet L , Davoli MA , Herzog E , Katsel P , Mechawar N , Haroutunian V , Epelbaum J , Daumas S , El Mestikawy S ((2018) ) Moderate decline in select synaptic markers in the prefrontal cortex (BA9) of patients with Alzheimer’s disease at various cognitive stages. Sci Rep 8: , 938. |
[79] | Simpson MD , Cross AJ , Slater P , Deakin JF ((1988) ) Loss of cortical GABA uptake sites in Alzheimer’s disease. J Neural Transm 71: , 219–226. |
[80] | Cummings J ((2000) ) Cognitive and behavioral heterogeneity in Alzheimer’s disease: Seeking the neurobiological basis. Neurobiol Aging 21: , 845–861. |
[81] | Greger IH , Watson JF , Cull-Candy SG ((2017) ) Structural and functional architecture of AMPA-type glutamate receptors and their auxiliary proteins. Neuron 94: , 713–730. |
[82] | Shimshek DR , Bus T , Schupp B , Jensen V , Marx V , Layer LE , Kohr G , Sprengel R ((2017) ) Different forms of AMPA receptor mediated LTP and their correlation to the spatial working memory formation. Front Mol Neurosci 10: , 214. |
[83] | Diering GH , Huganir RL ((2018) ) The AMPA receptor code of synaptic plasticity. Neuron 100: , 314–329. |
[84] | Counts SE , Nadeem M , Lad SP , Wuu J , Mufson EJ ((2006) ) Differential expression of synaptic proteins in the frontal and temporal cortex of elderly subjects with mild cognitive impairment. J Neuropathol Exp Neurol 65: , 592–601. |
[85] | Boutajangout A , Ingadottir J , Davies P , Sigurdsson EM ((2011) ) Passive immunization targeting pathological phospho-tau protein in a mouse model reduces functional decline and clears tau aggregates from the brain. J Neurochem 118: , 658–667. |
[86] | Chai X , Wu S , Murray TK , Kinley R , Cella CV , Sims H , Buckner N , Hanmer J , Davies P , O’Neill MJ , Hutton ML , Citron M ((2011) ) Passive immunization with anti-tau antibodies in two transgenic models: Reduction of tau pathology and delay of disease progression. J Biol Chem 286,: , 34457–67. |
[87] | Castillo-Carranza DL , Guerrero-Muñoz MJ , Kayed R ((2014) ) Immunotherapy for the treatment of Alzheimer’s disease: Amyloid-β or tau, which is the right target?. Immunotargets Ther 3: , 19–28. |
[88] | Hoskin JL , Sabbagh MN , Al-Hasan Y , Decourt B ((2019) ) Tau immunotherapies for Alzheimer’s disease. Expert Opin Investig Drugs 28: , 545–554. |
[89] | Sandusky-Beltran LA , Sigurdsson EM ((2020) ) Tau immunotherapies: Lessons learned, current status and future considerations. Neuropharmacology 175: , 108104. |
[90] | Sigurdsson EM ((2019) ) Alzheimer’s therapy development: A few points to consider. Prog Mol Biol Transl Sci 168: , 205–217. |
[91] | Pedersen JT , Sigurdsson EM ((2015) ) Tau immunotherapy for Alzheimer’s disease. Trends Mol Med 21: , 394–402. |
[92] | Novak P , Kontsekova E , Zilka N , Novak M ((2018) ) Ten years of tau-targeted immunotherapy: The path walked and the roads ahead. Front Neurosci 12: , 798. |


