
White Matter Changes on Diffusion Tensor Imaging in the FINGER Randomized Controlled Trial
Abstract
Background:
Early pathological changes in white matter microstructure can be studied using the diffusion tensor imaging (DTI). It is not only important to study these subtle pathological changes leading to cognitive decline, but also to ascertain how an intervention would impact the white matter microstructure and cognition in persons at-risk of dementia.
Objectives:
To study the impact of a multidomain lifestyle intervention on white matter and cognitive changes during the 2-year Finnish Geriatric Intervention Study to prevent Cognitive Impairment and Disability (FINGER), a randomized controlled trial in at-risk older individuals (age 60–77 years) from the general population.
Methods:
This exploratory study consisted of a subsample of 60 FINGER participants. Participants were randomized to either a multidomain intervention (diet, exercise, cognitive training, and vascular risk management, n = 34) or control group (general health advice, n = 26). All underwent baseline and 2-year brain DTI. Changes in fractional anisotropy (FA), diffusivity along domain (F1) and non-domain (F2) diffusion orientations, mean diffusivity (MD), axial diffusivity (AxD), radial diffusivity (RD), and their correlations with cognitive changes during the 2-year multidomain intervention were analyzed.
Results:
FA decreased, and cognition improved more in the intervention group compared to the control group (p < 0.05), with no significant intergroup differences for changes in F1, F2, MD, AxD, or RD. The cognitive changes were significantly positively related to FA change, and negatively related to RD change in the control group, but not in the intervention group.
Conclusion:
The 2-year multidomain FINGER intervention may modulate white matter microstructural alterations.
INTRODUCTION
Dementia poses a major public health challenge [1]. While there is urgent need to develop disease modification strategies, prevention of cognitive decline, especially early in the disease continuum, has gained increasing attention [2]. An example of this is the Finnish Geriatric Intervention Study to prevent Cognitive Impairment and Disability (FINGER) [3], the first large-scale, longer-term randomized controlled trial which tested a multi-domain lifestyle intervention in at-risk elderly from the general population. FINGER has reported beneficial effects on cognition (primary outcome) and other secondary outcomes. To study intervention effects in detail, diffusion tensor imaging (DTI) was one of the exploratory outcomes of the FINGER trial in a sub-set of participants [4].
DTI, a noninvasive magnetic resonance (MR) technique, is used for studying the orientation and integrity of white matter (WM) [5]. It has been widely used in Alzheimer’s disease (AD) and mild cognitive impairment (MCI) studies [6] owing to its ability to detect subtle WM changes which occur before gray matter atrophy on the disease spectrum [7]. Commonly used DTI measures are fractional anisotropy (FA) and mean diffusivity (MD). FA is a measure of fiber tract integrity whereas MD represents an overall measure of cellular integrity [8]. Lower FA and higher MD values have been reported in advanced disease stages [9]. Also, in other diseases, axonal loss, demyelination, small vessel alterations, and degradation of microtubules have been associated with decreases in FA [10], while cellular swelling has been associated with FA increases [11]. Although FA is highly sensitive to microstructural changes, it is not specific to the type of changes. For interpretation of FA changes, axial diffusivity (AxD) and radial diffusivity (RD) often need to be checked. AxD and RD represent the water diffusivity parallel and perpendicular to axonal fibers, respectively. Studies [12, 13] suggest that AxD may be a more specific marker of axonal damage, and RD is highly associated with changes in the myelin integrity and axonal diameters or density [8].
The early AD pathological changes in WM include axonal edema, hypertrophied astrocytes surrounding axons, and demyelination [7, 14, 15], and DTI can detect these WM changes [16]. Considering that WM integrity is important for cognition [17–19], the present study aims to investigate differences in DTI measures between the FINGER intervention and control groups, and relations between changes in DTI measures and cognition.
Given FA decrease is commonly seen in aging and dementia-related neurodegeneration, we hypothesized that the FINGER intervention may slow down or reverse the FA decrease in the intervention group compared with the control group, and this may be related to the observed cognitive benefits. In order to interpret the potential difference in FA change between the control and intervention groups, the MD, AxD, and RD changes were also analyzed. Because the tensor-derived scalar measurements (FA, MD, AxD, and RD) are not only influenced by axonal integrity, but also by the change of crossing fibers, the crossing fiber model was used as well to analyze the changes in diffusivity along domain (F1) and non-domain (F2) diffusion orientation [20].
MATERIALS AND METHODS
The FINGER study was approved by the Coordinating Ethics Committee of the Hospital District of Helsinki and Uusimaa. Participants gave written informed consents at screening and baseline visits, and separate consent for imaging. This trial was registered with ClinicalTrials.gov NCT01041989.
Study population
Brain MRI was included in the FINGER protocol among exploratory outcomes in a sub-sample of participants at selected study sites [4]. Formation of the DTI study population for the present study is shown in Fig. 1. Sixty participants were included: 26 control and 34 intervention, with DTI scans at both baseline and 2-year visit. There was no significant difference in the time interval from baseline to follow-up scans between the control and intervention groups (2.01±0.03 years versus 1.97±0.17 years, p = 0.315).
Fig. 1
CONSORT Diagram for exploratory DTI analyses in the FINGER trial.
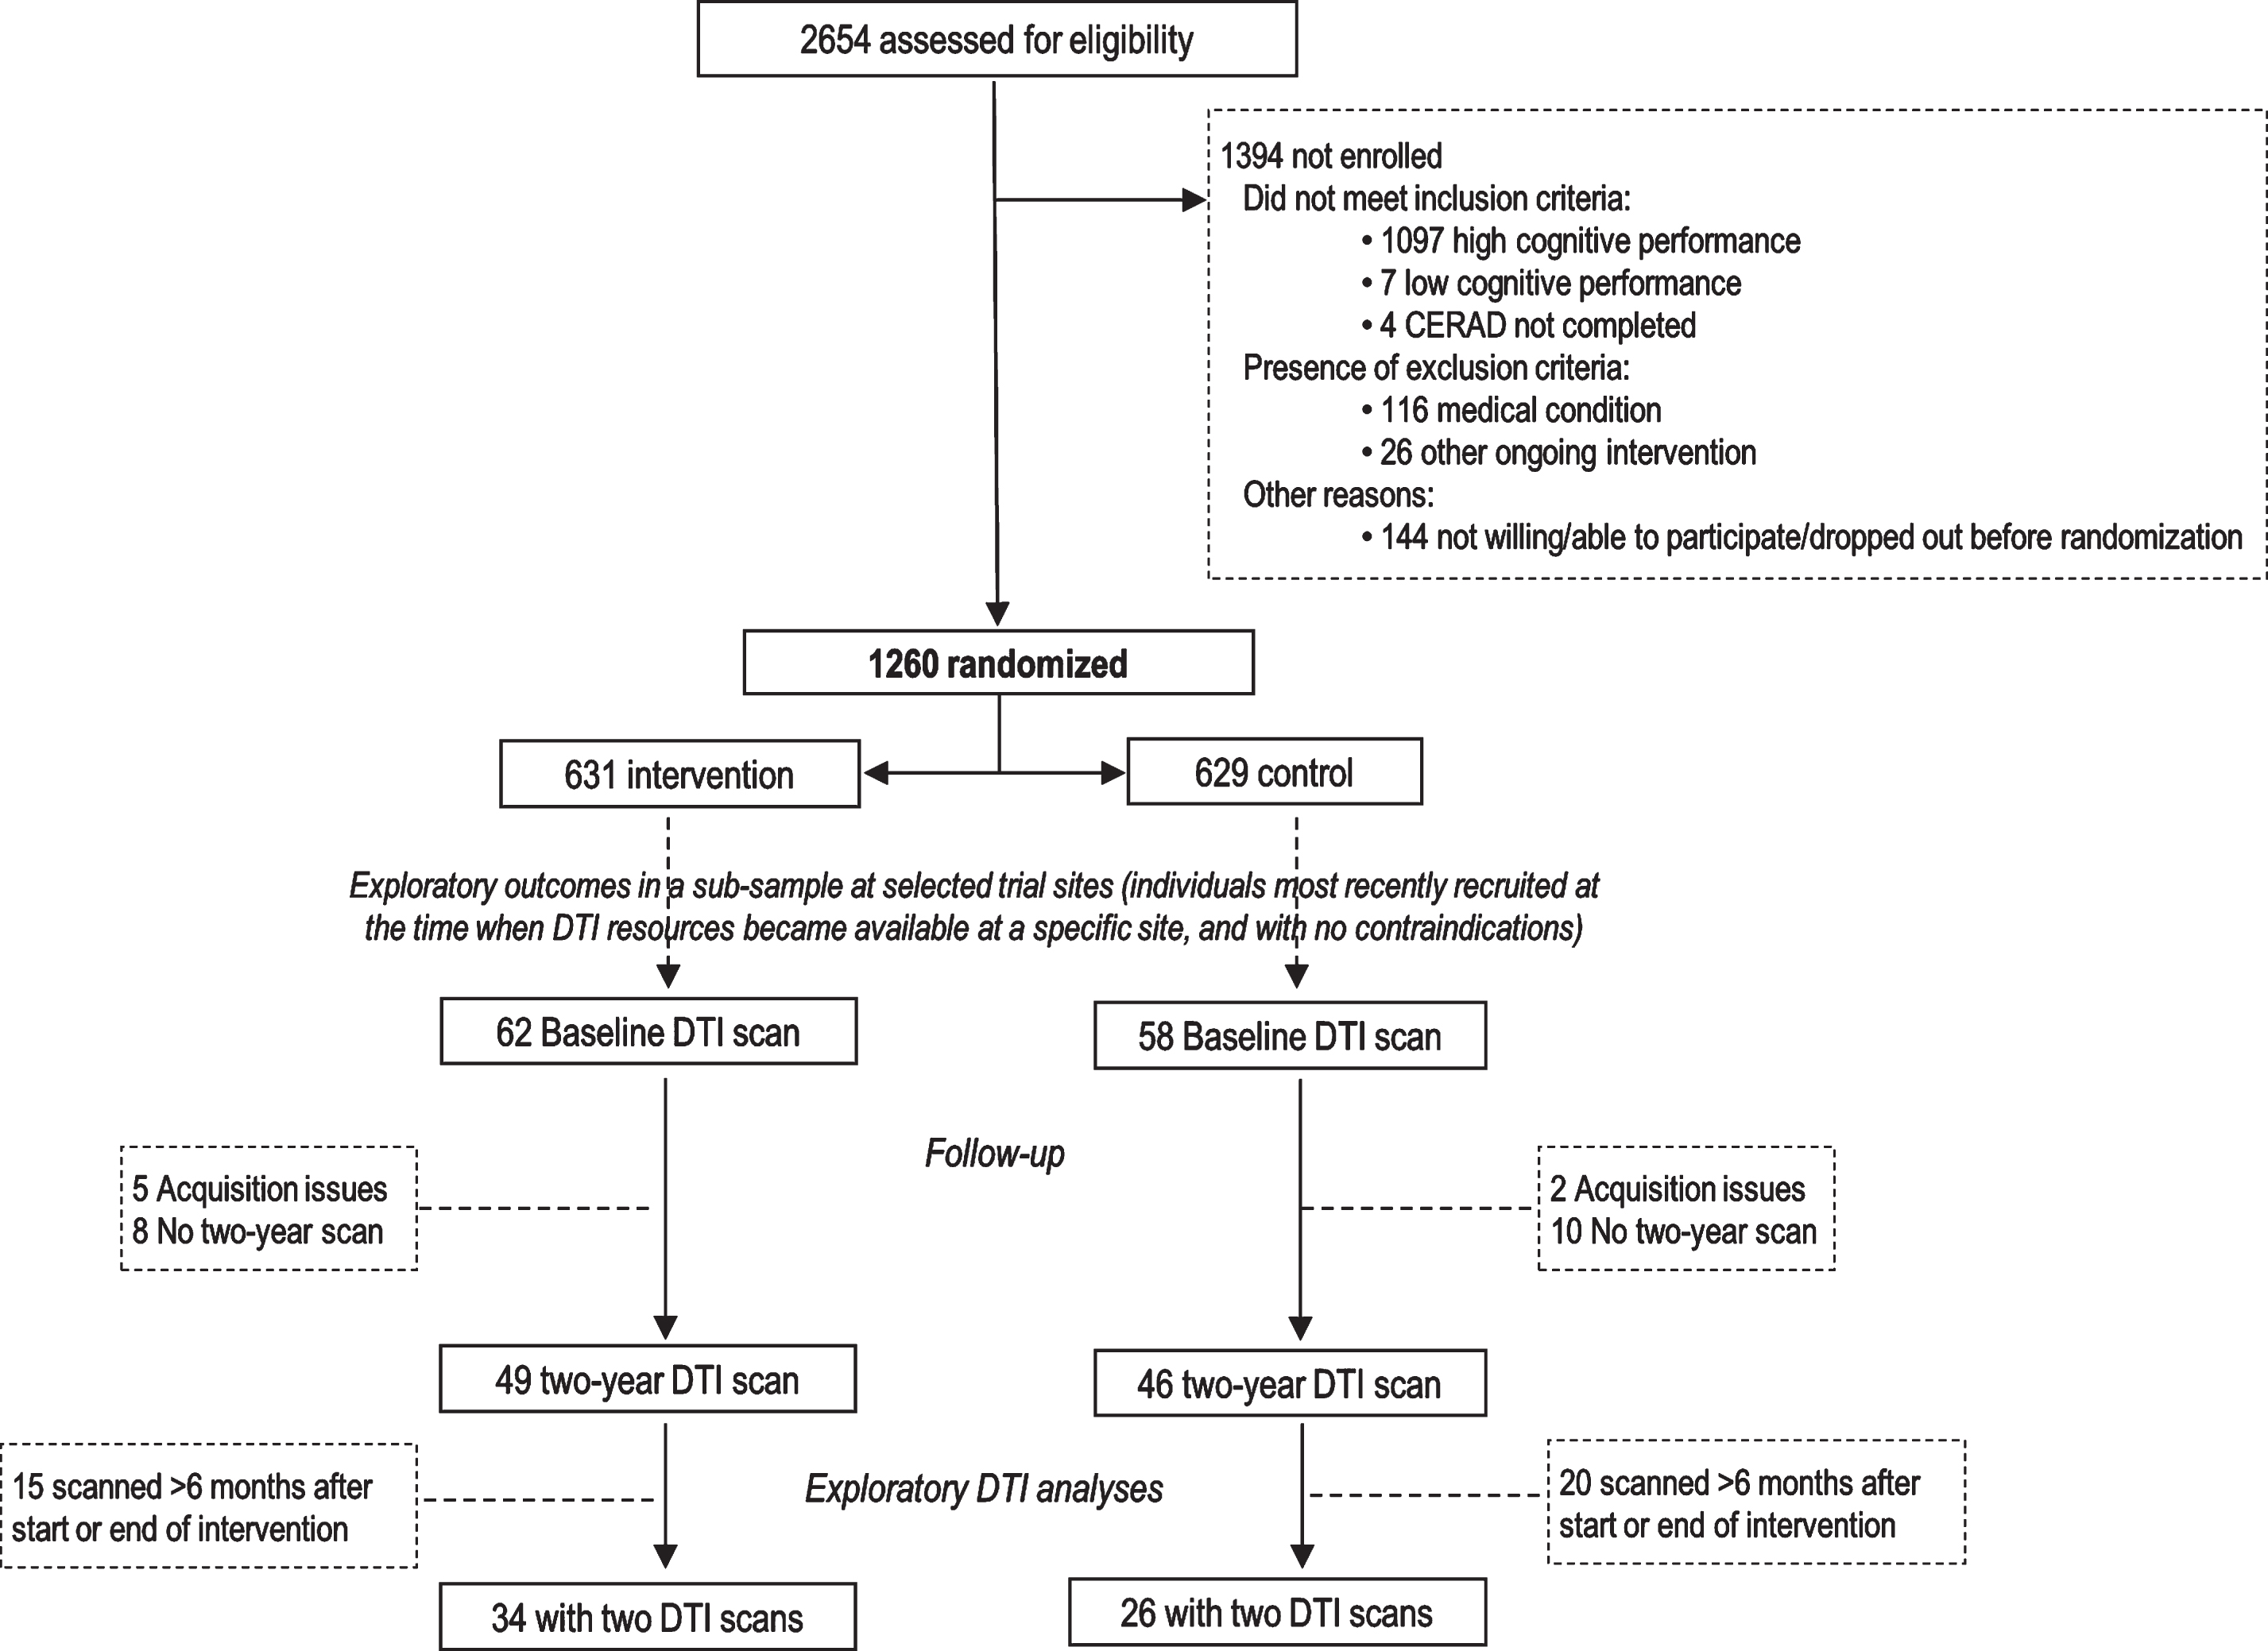
The FINGER trial protocol [4], baseline population characteristics [21], and primary trial results [3] for all 1,260 FINGER participants have been previously reported. For inclusion, participants had to be 60 to 77 years old, with the CAIDE (Cardiovascular Risk Factors, Aging, and Incidence of Dementia) Risk Score ≥6 points, and cognitive performance at the mean level or slightly lower than expected for age according to Finnish population norms for Consortium to Establish a Registry for Alzheimer’s Disease (CERAD) neuropsychological battery [22]. Individuals with substantial cognitive impairment and dementia were excluded. Participants were randomized into the intensive multidomain intervention (diet, cognitive training, physical exercise, monitoring of vascular and metabolic factors) [4] or regular health advice group (control group) in a 1:1 ratio (computer-generated allocation in blocks of four). Outcome assessors were blinded to allocation, and group allocation was not actively disclosed to participants.
MRI acquisition
Imaging protocol included three-dimensional T1WI, FLAIR, and DTI. All participants in the present study underwent DTI at baseline and 2-year follow-up with either 1.5 T (n = 56 Avanto, Siemens, Erlangen, Germany) or 3.0 tesla MR scanner (n = 4, Ingenuity TF PET/MR, Philips Medical Systems, Netherlands). For 1.5 tesla MRI, imaging parameters were as follows: Imaging matrix 128*128, voxel: 2×2×2 mm3, TE 101 ms, TR 12500 ms, average 2, b values 0 and 1000 s/mm2, 20 diffusion directions, and 81 slices covering whole brain. For 3.0 T MRI, imaging matrix 128×128, voxel: 1.75×1.75×2 mm3 TE 70 ms, TR 7796 ms, average 1, b values 0 and 800 s/mm2, 32 diffusion directions, and 72 slices covering whole brain.
Imaging analysis
WM hyperintensities were visually rated on FLAIR images according to the Fazekas scale [23] by an experienced neuroradiologist (YL). Baseline and follow-up DTI data were first processed with the standard procedure of Tract-Based Spatial Statistics analysis (TBSS) [24, 25] provided in FSL software package (version 5.09, https://fsl.fmrib.ox.ac.uk/fsl/). After the eddy-current correction, the maps of FA, MD, AxD, and RD were calculated with the DTIFIT program for whole brain volumes. The baseline and follow-up FA data for all subjects was aligned to the 1×1×1 mm FMRIB58 FA standard space with nonlinear registration. A mean FA skeleton representing the centers of all tracts was created by averaging the FA images and thresholding at FA > 0.2. The aligned baseline and follow-up FA volumes of each subject were then projected onto the common FA skeleton, and a 4D spatially normalized skeletonized FA was created. Each 4D DTI derived volume was then split into multiple 3D volumes with fslsplit, and subtractions were performed (baseline volumes –follow-up volumes) for each subject with fslmaths, then a new 4D volume with all the FA differences between baseline and follow-up was assembled. The DTI derived MD, AxD, and RD were also respectively projected onto the mean skeleton by using nonlinear registration and projection vectors from the FA images. New 4D volumes of differences in MD, AxD, and RD between baseline and follow-up were created similarly to 4D volume with FA differences. Crossing fiber analyses were performed using the FSL [20]. Two diffusion estimates were conducted for each fiber orientation (domain F1and non-domain F2) per voxel. 4D volumes of differences in F1 and F2 were then created using the same method as creating 4D volumes of differences in MD, AxD, and RD. Each new 4D volume was fed into voxel wise statistical analyses with the following group comparisons: 1) DTI parameter (FA, F1, F2, MD, AxD, and RD) change in control > DTI parameter change in intervention group; 2) DTI parameter change in control < DTI parameter change in intervention; 3) DTI parameter change in control >0; 4) DTI parameter change in control <0; 5) DTI parameter change in intervention >0; and 6) DTI parameter change in intervention <0. If significant differences in DTI parameter change were identified in the intragroup analyses, the DTI parameters were then extracted from those regions in each case and were used to test the relationship between DTI changes and cognitive changes with Pearson correlation coefficient. The null distribution was built up over 5000 permutations, and significance was tested at p < 0.05 with correction for family-wise error with Threshold-Free Cluster Enhancement. TBSS analyses with controlling study sites were performed. The FINGER participants were at-risk for dementia and were selected based on a risk score including cardiovascular factors [26]. White matter hyperintensities (WMH) have been associated with cardiovascular risk factors, and they may also impact FA measures. Therefore, the TBSS analyses were conducted again, controlling for study sites and WMH (visually rated according to the Fazekas scale) [23].
Cognitive assessments in the FINGER study
An extended version of the neuropsychological test battery (NTB) [27] was used for cognitive assessments. NTB total score (primary cognitive outcome) was calculated as a composite score based on results from 14 tests (Z scores standardized to the baseline mean and SD, with higher scores suggesting better performance) [4]. Executive functioning score (secondary outcome) was similarly calculated from Z scores for category fluency test, digit span, concept shifting test, trail making test (shifting score B–A) [22], and a shortened 40-stimulus version of the original Stroop test [28]. Processing speed score (secondary outcome) was calculated from Z scores for letter digit substitution test, concept shifting test, and Stroop test. Memory score (secondary outcome) was calculated using Z scores for visual paired associates test immediate and delayed recall, logical memory immediate and delayed recall, and word list learning and delayed recall [3].
Statistical analysis
Statistical analyses were done using Stata software version 12. The level of statistical significance was p < 0.05 in all analyses. Characteristics of intervention and control groups were compared using t-test and chi-square tests. Intergroup differences in cognitive changes were tested with mixed-effects regression models with maximum likelihood estimation.
RESULTS
Clinical characteristics of the intervention and control groups are shown in Table 1, with no significant baseline differences. Baseline DTI parameters were not different between groups, except for smaller AxD in the control group at tract connecting to the right postcentral gyrus (data not shown).
Table 1
Characteristics of the intervention and control groups in the DTI population
| Characteristic | N | Intervention | Control | p |
| (n = 34) | (n = 26) | |||
| Baseline age, y | 60 | 70.02 (4.2) | 69.55 (3.9) | 0.66 |
| Number of Men, (n%) | 60 | 20/34 (59) | 13/26 (50) | 0.60 |
| Education, y | 60 | 9.26 (2.4) | 8.61 (3.0) | 0.36 |
| APOE ɛ4 carriers, n (%) | 53 | 7/31 (23) | 9/22 (41) | 0.15 |
| Baseline vascular &lifestyle factors | ||||
| Systolic blood pressure, mmHg | 57 | 140.8 (16.6) | 141.2 (15.2) | 0.94 |
| Diastolic blood pressure, mmHg | 57 | 80.1 (9.04) | 79.2 (9.3) | 0.71 |
| BMI, kg/m2 | 57 | 27.6 (3.98) | 27.1 (3.08) | 0.66 |
| Total cholesterol, mmol/l | 60 | 4.94 (1.03) | 4.94 (0.99) | 0.99 |
| Fasting plasma glucose, mmol/l | 60 | 6.21 (0.74) | 6.20 (1.01) | 0.96 |
| Physically inactive n (%) | 60 | 27/34 (79) | 24/26 (92) | 0.16 |
| Current smokers, n (%) | 60 | 34/34 (100) | 24/26 (92) | 0.18 |
| Alcohol drinking at least once per week, n (%) | 60 | 17/34 (50) | 12/26 (46) | 0.09 |
| Fish intake at least twice per week, n (%) | 60 | 11/34 (32) | 12/26 (46) | 0.29 |
| Daily intake of vegetables, n (%) | 60 | 11/34 (32) | 10/26 (38) | 0.78 |
| Self-reported baseline medical history | ||||
| Hypertension, n (%) | 60 | 25/34 (73) | 16/25 (64) | 0.56 |
| Hypercholesterolemia, n (%) | 59 | 26/34 (76) | 20/25 (80) | 1.00 |
| Diabetes, n (%) | 59 | 32/34 (94) | 23/25 (92) | 1.00 |
| History of myocardial infarction, n (%) | 59 | 0 | 0 | |
| History of stroke, n (%) | 58 | 0 | 0 | |
| Baseline cognition | ||||
| NTB Total score | 60 | –0.080 (0.43) | –0.085 (0.55) | 0.97 |
| NTB Executive functioning | 60 | –0.06 (0.52) | –0.090 (0.64) | 0.84 |
| NTB Processing speed | 60 | –0.099 (0.67) | 0.001 (0.87) | 0.61 |
| NTB Memory | 60 | –0.0892 (0.55) | –0.12 (0.56) | 0.80 |
| Baseline MRI | ||||
| Visually rated white matter hyperintensities | 60 | 1.00 (0–3) | 1.00 (0–3) | 0.30 |
Values are means (SD) unless otherwise specified; BMI, body mass index; MRI, magnetic resonance imaging; NTB, neuropsychological test battery.
Changes in DTI parameters
Brain regions with significant intragroup changes in DTI parameters during the 2-year trial are shown in Figs. 2–3. Significant reduction in FA (within group) was found for both control (Fig. 2) and intervention (Fig. 3) groups. The FA reduction was limited in the genu of corpus callosum in the control group, but it was more widespread in the intervention group, covering WM tracts of both hemispheres. F1 tended to decrease in the corpus callosum in the control group (p = 0.08, corrected for family-wise error), and significantly decreased in the splenium part of corpus callosum in the intervention group. F2 reduction was detected in the bilateral occipital and parietal WM and right posterior cingulum and temporal WM in the control group, but only in right optical radiation in the intervention group (Figs. 2 and 3). AxD increased in right frontal WM tracts and RD increase in the genus of corpus callosum in the control group (Fig. 2), while AxD increase in a very tiny area and widespread RD increase in both hemispheres were detected in the intervention group. A significant MD increase in only a tiny region was detected in the control group, while the intervention group had a widespread MD increase in the WM tracts in the frontal lobes bilaterally, internal and external capsules, and partial right parietal lobe (Fig. 3). In addition, the intervention group showed a decrease in AxD in part of right optical radiation. No AxD or RD decrease was found in the control group.
Fig. 2
Control group: regions of significant changes in diffusivity parameters during the 2-year trial are projected on the skeleton (green) of the white matter (p < 0.05, corrected for family-wise error). Decreasing FA, diffusivity along domain (F1, trend p < 0.08), and non-domain diffusion orientation (F2), and increasing mean diffusivity (MD), axial diffusivity (AxD), and radial diffusivity (RD) shown in red-yellow.
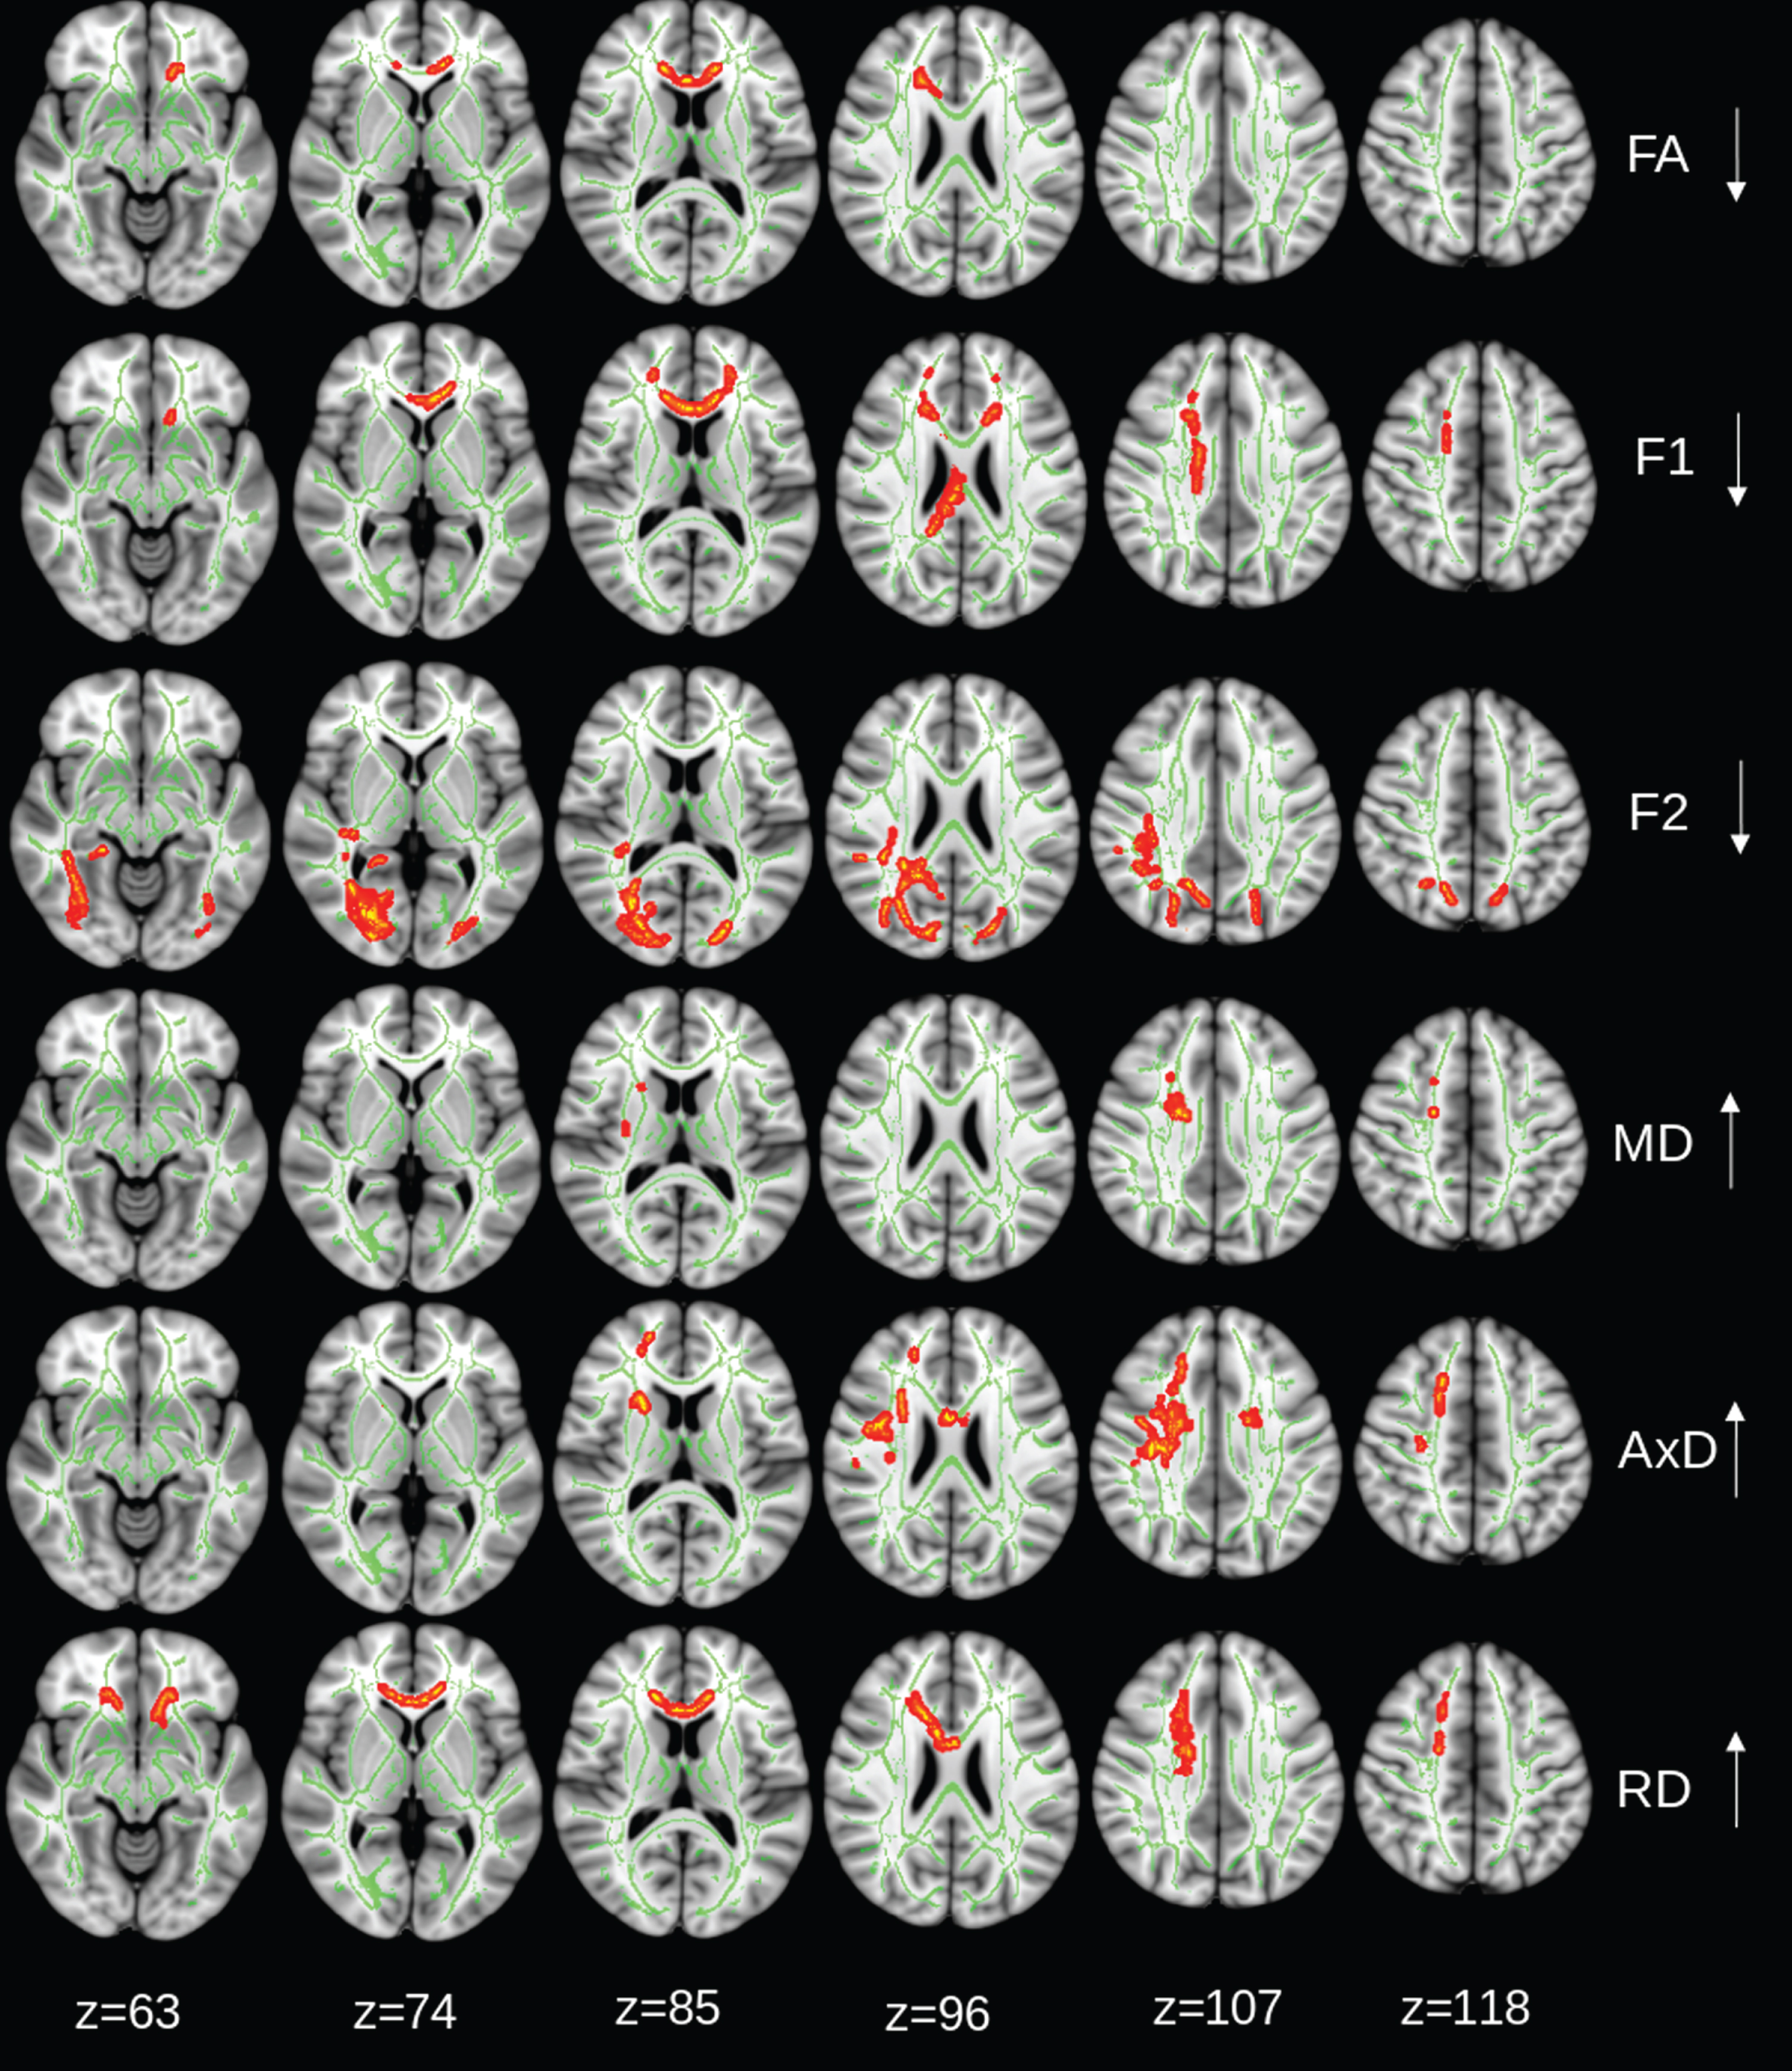
Fig. 3
Intervention group: regions of significant changes in diffusivity parameters during the 2-year trial are projected on the white matter skeleton (green) (p < 0.05, corrected for family-wise error). Decreasing fractional anisotropy (FA), diffusivity along domain (F1), and non-domain diffusion orientation (F2), and increasing mean diffusivity (MD), axial diffusivity (AxD), and radial diffusivity (RD) are shown in red-yellow.

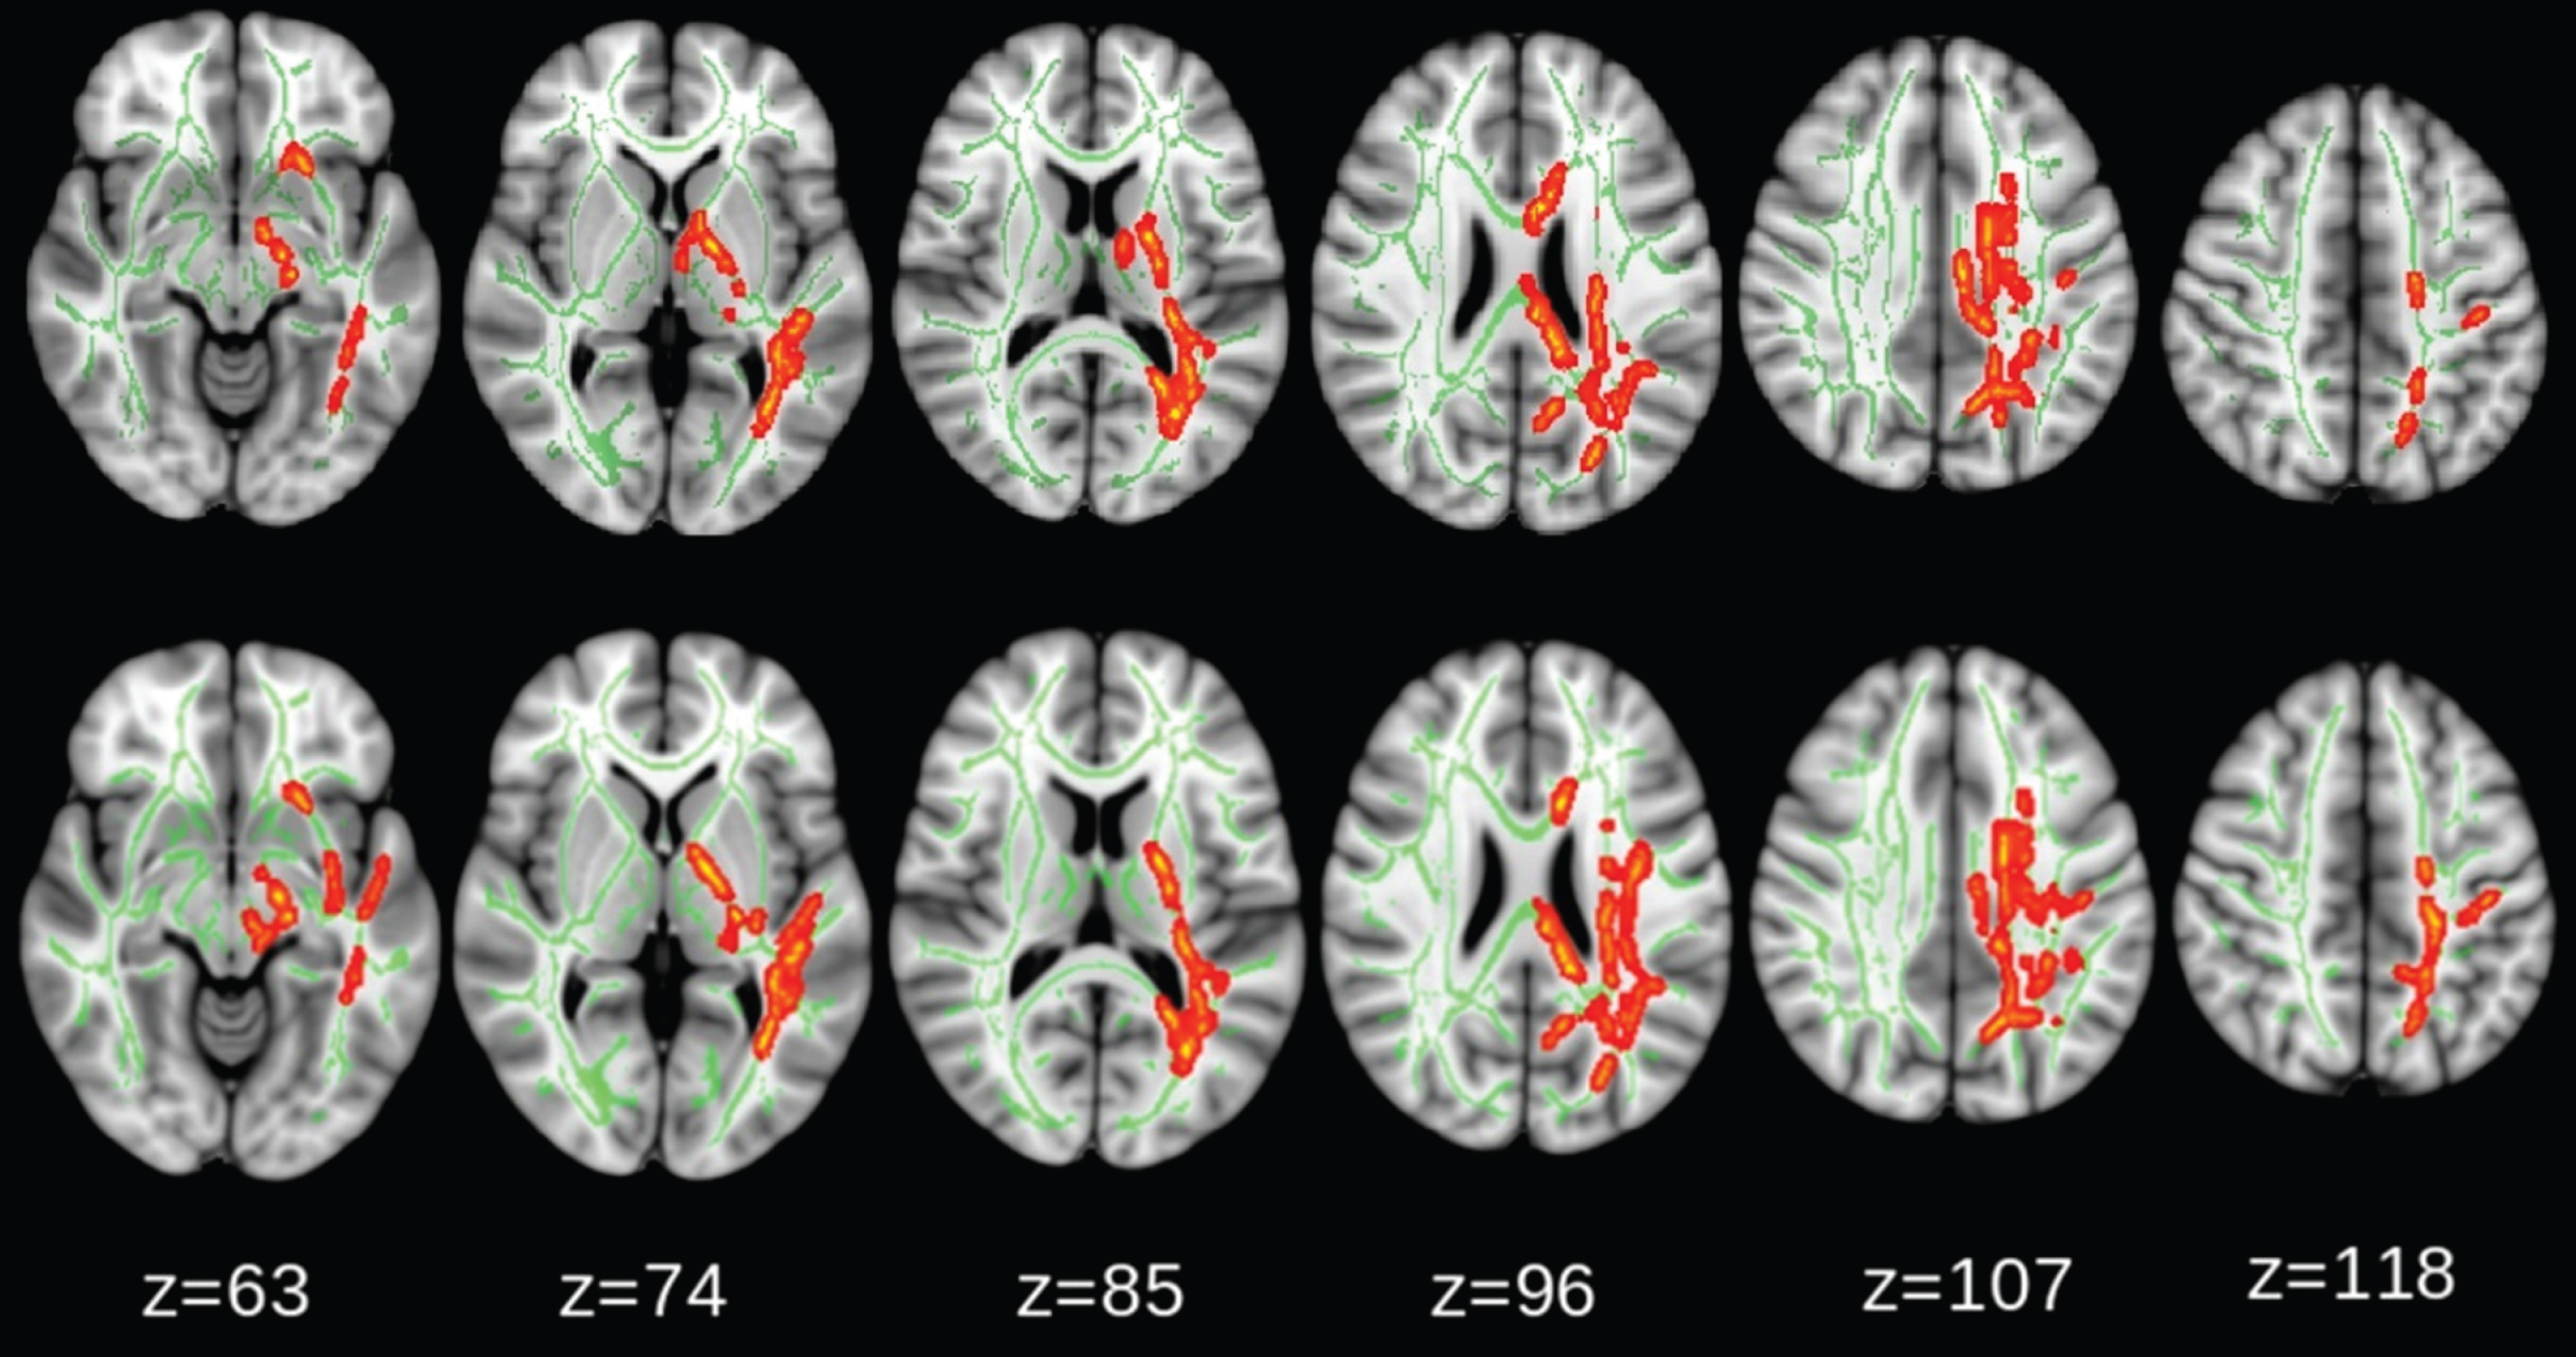
Intergroup comparisons showed that the magnitude of FA reduction was significantly larger in the intervention group than in the control group, even after adjusting for study sites and WMH (Fig. 4). However, the changes in F1, F2, MD, AxD, and RD were not significantly different between groups.
Fig. 4
Comparison between intervention and control groups: fractional anisotropy (FA) reduction (red-yellow) was significantly larger in the intervention group (p < 0.05, corrected for family-wise error). No significant differences were found for change in diffusivity along domain (F1) and non-domain diffusion orientation (F2), mean diffusivity (MD), axial diffusivity (AxD), or radial diffusivity (RD). The upper row shows the TBSS analysis adjusted for study sites and white matter hyperintensity, the lower row shows TBSS analysis with adjusted for study sites only.
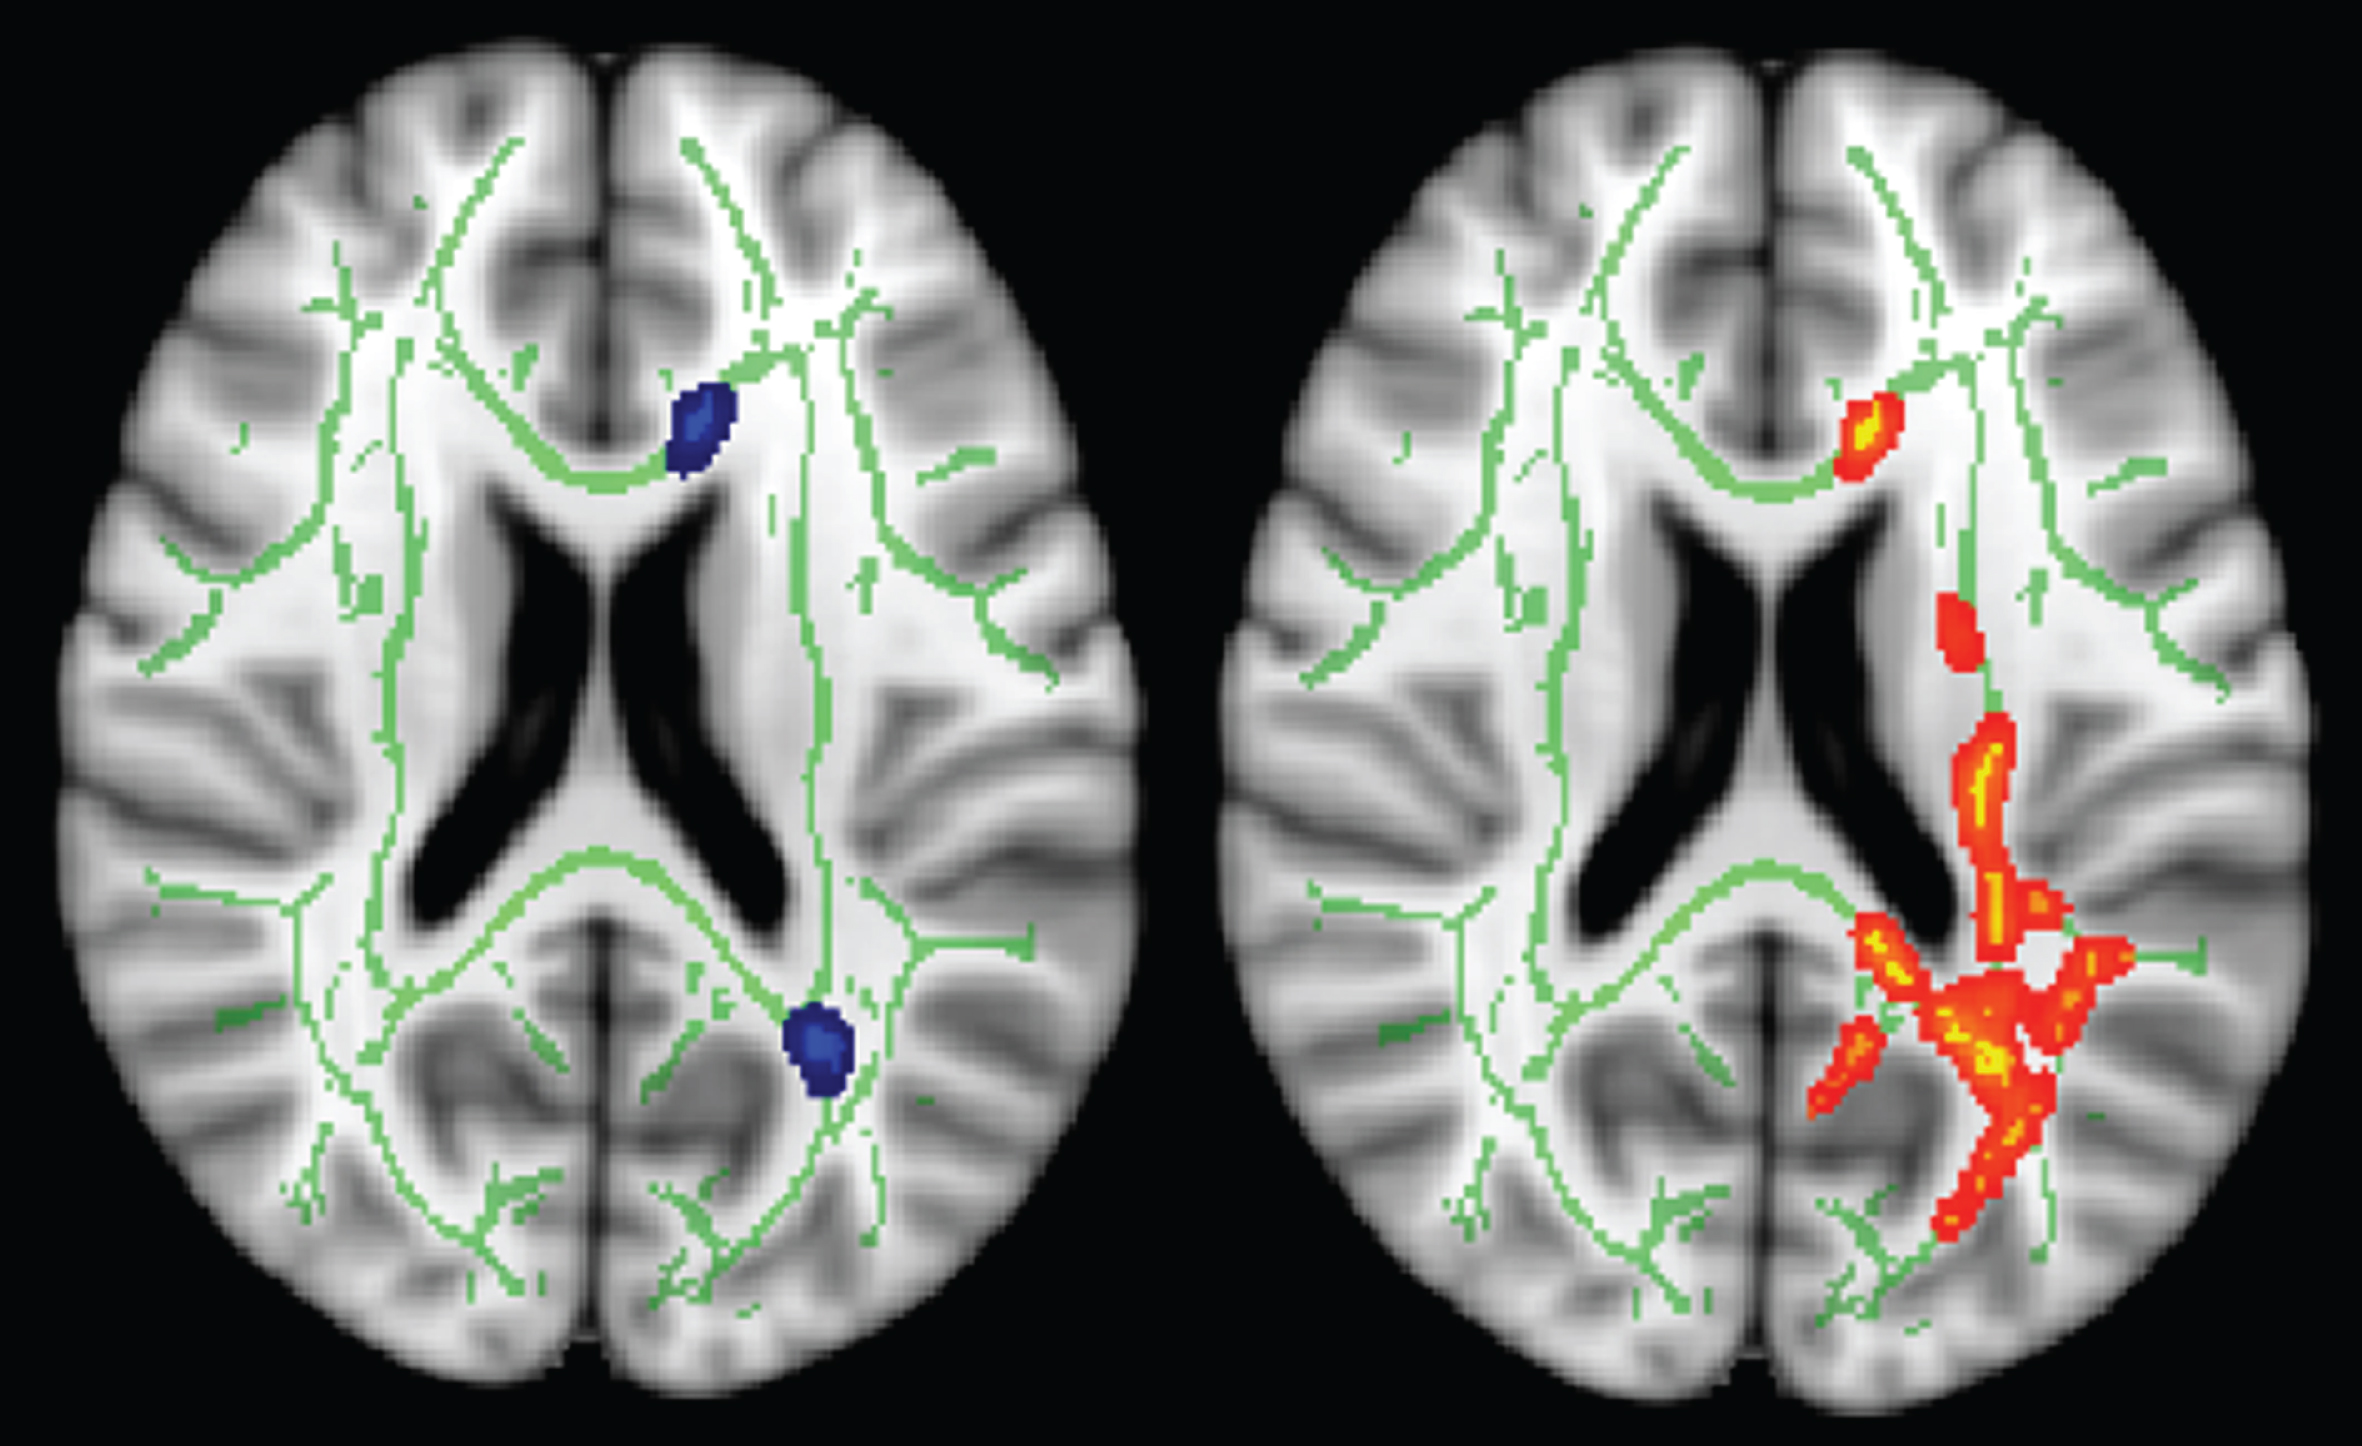
To confirm these findings in the TBSS analysis, we performed a region of interest (ROI)-analysis. Two ROIs were drawn on the FA skeleton at anterior and posterior-periventricle regions based on the TBSS longitudinal analysis (Fig. 5). Each ROI was larger than 5 mm in x, y, and z directions. The FA values of the two ROIs at baseline and follow-up were extracted, and the FA values were then used to test the longitudinal changes in FA. Results were similar, as shown in Fig. 5.
Fig. 5
Additional ROI analysis where Fraction anisotropy (FA) values at baseline and follow-up were measured from anterior- and posterior-periventricular regions (left, blue). The red-yellow (right) areas indicate the tracts with significant difference in longitudinal FA changes between control and intervention groups.
Changes in cognition and DTI parameters
In the control group, the cognition did not change significantly during the 2-year trial (p≥0.061). However, in the intervention group, all cognitive domains improved (p≤0.047). The intervention group improved significantly more than the control group in the total NTB score (p = 0.033). A trend for more improvement in executive functioning was also observed for the intervention compared to group (p = 0.075) (Table 2).
Table 2
Primary and secondary cognitive end points from baseline to 2-years, DTI population
| Cognitive end point | Control | Intervention | Difference between intervention and control groups per year | |
| Mean change (SE) | Mean change (SE) | Estimate (95% CI) | p | |
| Primary | ||||
| NTB total score | 0.103 (0.060) | 0.276 (0.053) | 0.087 (0.007 –0.165) | 0.033 |
| Secondary | ||||
| Executive functioning | –0.051 (0.079) | 0.137 (0.077) | 0.094 (–0.009 –0.197) | 0.075 |
| Processing speed | 0.067 (0.077) | 0.170 (0.068) | 0.052 (–0.050 –0.153) | 0.316 |
| Memory | 0.246 (0.120) | 0.453 (0.105) | 0.104 (–0.053 –0.260) | 0.195 |
Mixed-model repeated-measures analyses were used to assess between-group differences (group×time interaction) in the changes from baseline to 24 months based. Scores on the NTB total score and memory, executive functioning and processing speed domain scores are estimated mean values (standard errors) of z scores of the cognitive tests included in each cognitive outcome with higher scores indicating better performance. A positive value of the estimate of the between-group differences indicates the effect is in favor of the intervention group.
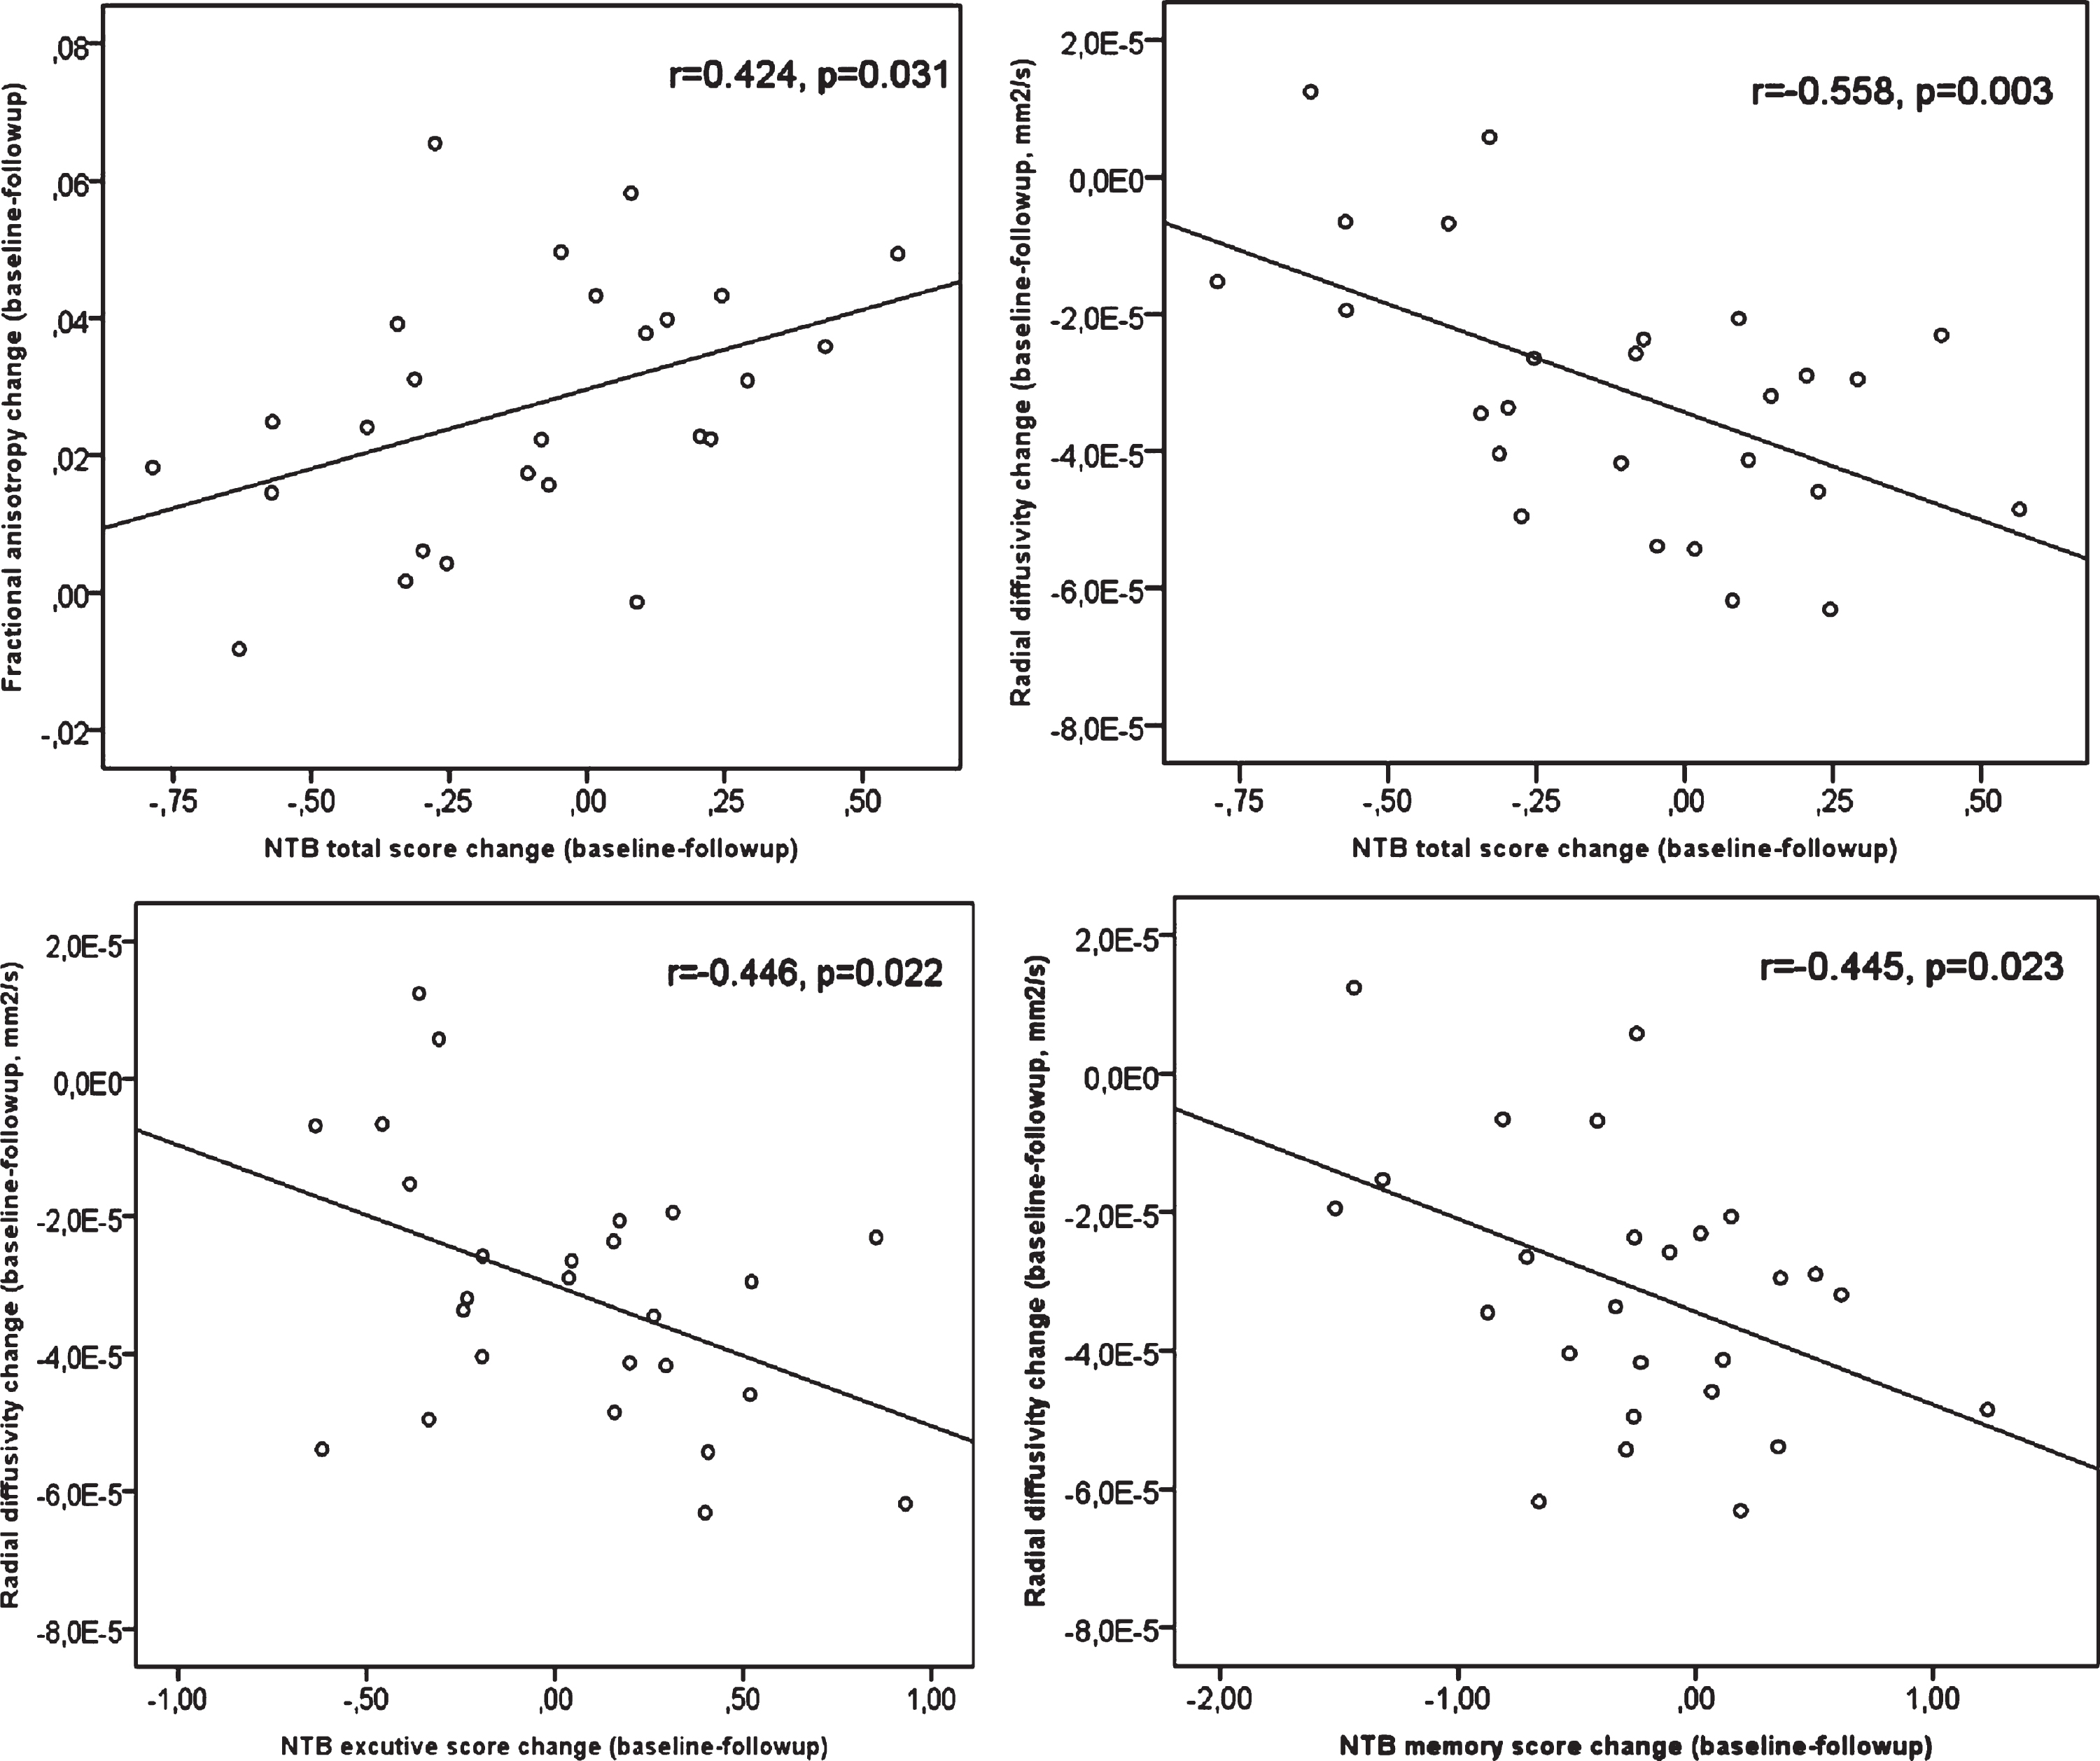
In the control group, change in total NTB score positively correlated with FA change (r = 0.424, p = 0.031), and negatively correlated with RD change (r = –0.558, p = 0.003). The change in executive functioning and memory was negatively correlated with RD change (r = –0.446, p = 0.022; r = -0.445, p = 0.023, respectively, Fig. 6). No correlations between cognitive changes and F1, F2, MD, or AxD change were found (p≥0.189).
Fig. 6
Control group: NTB (neuropsychological test battery) total score change (baseline-follow-up) positively correlated with fractional anisotropy (FA) change (baseline-follow-up), and negatively correlated with radial diffusivity (RD) change. NTB executive score change and memory score change negatively correlated with RD change. No correlation between cognitive changes and mean diffusivity (MD) or axial diffusivity (AxD) changes were found (p≥0.189).
However, in the intervention group, no significant correlations between cognitive changes and DTI parameter changes were found (p≥0.085).
DISCUSSION
Results of the present study indicate that the 2-year FINGER multidomain intervention was related to WM changes on DTI. FA decreased more in the intervention group compared with control group. The intervention group also had a significant benefit on the NTB total score (primary cognitive outcome), with a similar trend for executive functioning (secondary cognitive outcome).
The intervention group exhibited FA decrease in widespread WM tracts, which is surprisingly contrary to our expectation. However, the FA decrease in the intervention group was not associated with cognitive decline, and the intervention group had significant cognitive benefits. This suggests that FA decrease in the intervention group was not related to demyelination, but more likely to other pathophysiological changes. When other DTI-derived parameters, F1 and F2 changes were checked, these too could not explain the FA decrease in the intervention group.
RD increase was also detected in the WM areas corresponding to FA change. Also, little increase in AxD, suggests that the RD increase may be the main reason of FA decrease (where water molecules moved more freely perpendicular to axonal fibers, i.e., the inter-space between axonal fibers was increased). Neuropathological studies have shown that in the very early phases of the dementia spectrum, pathological WM changes start from synaptic damage, astrocytic hypertrophy, and swelling of axons [7, 14, 15]. It has been well known that most axons are entirely wrapped by astrocyte cytoplasmic processes. The astrocytic hypertrophy can affect FA and RD has been shown in animal models [29]. Astrocytic hypertrophy and axonal swelling can decrease the inter-space between axons (dense axonal packing), and consequently can result in FA increase and RD decrease [16, 30].
FA increases have been reported among cognitively normal individuals with family history of AD, or with more pronounced amyloid deposition [31–33], and among asymptomatic carriers of the PSEN1 mutation involved in autosomal dominant AD [34]. In AD mouse models, DTI studies have also found FA increase in the corpus callosum, cingulum, anterior commissure, internal and external capsule [35–37]. In post-DTI histological analyses, those regions with increased FA revealed axonal swelling [35], damage to axons and dendrites [36], and little to no effects on myelination [35, 37]. On the other hand, FA decrease has been consistently reported in MCI and AD studies [6]. Such findings may imply that FA in early disease stages or at-risk states (like the FINGER) may initially increase, and then decrease in the later stages. In the stage with increased FA (probably axon swelling and astrocytic hypertrophy), pathophysiological changes may be reversible. This may also explain why in later AD stages with FA decrease and RD increase (demyelination and axon loss), it becomes too difficult or impossible to modify the disease process. Elevated vascular risk contributes to astrocytic hypertrophy [14] and cellular swelling [38]. Given that FINGER participants had an elevated vascular-based risk score, if the FINGER multi-domain intervention could reverse astrocytic hypertrophy and axonal swelling, then DTI would show increase in RD and decrease in FA, as observed in this study.
FA reduction in the intervention group was extensive and did not occur in the specific degenerative regions in MCI and AD patients. Several animal studies have shown profound local and global structural changes, including synaptic size and density, complexity and extent of dendritic arbors, size and number of glial processes, vascular density, and rate of neurogenesis, in the brain produced by complex or enriched environments [39–41]. Another study demonstrated that aerobic activity levels in elderly human subjects correlate with both the number and tortuosity of blood vessels throughout the brain on MR angiography [42]. Also, whole-brain studies on human have reported physical activity levels [43] or an exercise intervention [44] can increase gray matter density in frontal, temporal, and cingulate areas of the brain. The multi-domain FINGER intervention targeted several risk factors simultaneously (unhealthy diet, physical inactivity, insufficient cognitive activity, and vascular and metabolic risk factors), thus beneficial effects may manifest as extensive FA and RD changes in the intervention group.
Another feature of FA reduction in the intervention group was left dominant, indicating the asymmetric response to FINGER intervention. It was reported by another study that significant vascular alterations with aging were limited to the left middle cerebral distribution on MR angiography [42]. The vascular system in the left hemisphere of ageing people might have more space for perfusion improvement by intervention, as seen in the present study.
However, the small FINGER DTI sample size is a major limitation of this study, and larger longitudinal DTI studies in prevention trials are needed to verify these findings. The multi-domain intervention targeted several risk factors simultaneously, thus potentially covering multiple mechanisms involved in both pathological WM changes and development of cognitive decline and dementia. The exact mechanisms behind the intervention effects on changes in DTI parameters are difficult to ascertain. Because both demyelination in age-related WM degeneration and possible FINGER intervention-related reverse astrocytic hypertrophy and axonal swelling could cause similar DTI changes (FA decrease and RD increase), using advanced DTI techniques such as diffusion basis spectrum imaging [45] may help to differentiate the two types of pathophysiological changes. Also, due to the relatively short follow-up period for an at-risk general population without substantial impairment at baseline, progression to dementia could not be assessed. The extended follow-up of the FINGER population will allow the investigation of potential longer-term intervention effects.
In conclusion, FINGER intervention-related effects included a decrease in FA only, and significant cognitive improvement. These findings indicate that the 2-year multidomain lifestyle intervention may modulate microstructural alterations. FA and RD measures seem to be sensitive biomarkers to evaluate FINGER intervention effects on WM microstructure.
ACKNOWLEDGMENTS
The authors sincerely thank all participants in the FINGER study, and all members of the FINGER study group for their cooperation in data collection and management.
This study was supported by funding from Academy of Finland, European Research Council grant 804371; Finnish Social Insurance Institution, Alzheimer’s Research and Prevention Foundation, Juho Vainio Foundation, EVO/VTR grants of University Hospitals of Kuopio, Oulu and Turku, Seinäjoki Central hospital and Oulu City Hospital; MIND-AD and EURO-FINGERS Joint Programme - Neurodegenerative Disease Research (JPND); Center for Innovative Medicine (CIMED) at Karolinska Institutet Sweden; Stiftelsen Stockholms sjukhem Sweden; Knut and Alice Wallenberg Foundation (Sweden); Konung Gustaf V:s och Drottning Victorias Frimurarstiftelse Sweden; Alzheimerfonden Sweden; Swedish Research Council; Region Stockholm ALF and NSV grants.
Authors’ disclosures available online (https://www.j-alz.com/manuscript-disclosures/20-0423r1).
REFERENCES
[1] | Prince M , Wimo A , Guerchet M , Ali G-C , Wu Y-T , Prina M ((2015) ) World Alzheimer Report 2015. The global impact of dementia: An analysis of prevalence, incidence, cost and trends. Alzheimer’s Disease International, London. |
[2] | Norton S , Matthews FE , Barnes DE , Yaffe K , Brayne C ((2014) ) Potential for primary prevention of Alzheimer’s disease: An analysis of population-based data. Lancet Neurol 13: , 788–794. |
[3] | Ngandu T , Lehtisalo J , Solomon A , Levälahti E , Ahtiluoto S , Antikainen R , Bäckman L , Hänninen T , Jula A , Laatikainen T , Lindström J , Mangialasche F , Paajanen T , Pajala S , Peltonen M , Rauramaa R , Stigsdotter-Neely A , Strandberg T , Tuomilehto J , Soininen H , Kivipelto M ((2015) ) A 2 year multidomain intervention of diet, exercise, cognitive training, and vascular risk monitoring versus control to prevent cognitive decline in at-risk elderly people (FINGER): A randomised controlled trial. Lancet 385: , 2255–2263. |
[4] | Kivipelto M , Solomon A , Ahtiluoto S , Ngandu T , Lehtisalo J , Antikainen R , Bäckman L , Hänninen T , Jula A , Laatikainen T , Lindström J , Mangialasche F , Nissinen A , Paajanen T , Pajala S , Peltonen M , Rauramaa R , Stigsdotter-Neely A , Strandberg T , Tuomilehto J , Soininen H ((2013) ) The Finnish Geriatric Intervention Study to Prevent Cognitive Impairment and Disability (FINGER): Study design and progress. Alzheimers Dement 9: , 657–665. |
[5] | Le Bihan D ((2006) ) Looking into the functional architecture of the brain with diffusion MRI. Nat Rev Neurosci 4: , 469–480. |
[6] | Sexton CE , Kalu UG , Filippini N , Mackay CE , Ebmeier KP ((2011) ) A meta-analysis of diffusion tensor imaging in mild cognitive impairment and Alzheimer’s disease. Neurobiol Aging 32: , 2322.e5–18. |
[7] | Sachdev PS , Zhuang L , Braidy N , Wen W ((2013) ) Is Alzheimer’s a disease of the white matter? Curr Opin Psychiatry 26: , 244–251. |
[8] | Van Hecke W , Emsell L , Sunaert S ((2016) ) Diffusion Tensor Imaging: A Practical Handbook. Springer, New York |
[9] | Kantarci K , Murray ME , Schwarz CG , Reid RI , Przybelski SA , Lesnick T , Zuk SM , Raman MR , Senjem ML , Gunter JL , Boeve BF , Knopman DS , Parisi JE , Petersen RC , Jack CR Jr , Dickson DW ((2017) ) White-matter integrity on DTI and the pathologic staging of Alzheimer’s disease. Neurobiol Aging 56: , 172–179. |
[10] | Elshafey R , Hassanien O , Khalil M ((2014) ) Diffusion tensor imaging for characterizing white matter changes in multiple sclerosis. Egypt J Radiol Nucl Med 45: , 881–888. |
[11] | Tuor UI , Morgunov M , Sule M , Qiao M , Clark D , Rushforth D , Foniok T , Kirton A ((2014) ) Cellular correlates of longitudinal diffusion tensor imaging of axonal degeneration following hypoxic-ischemic cerebral infarction in neonatal rats. Neuroimage Clin 6: , 32–42. |
[12] | Harsan LA , Poulet P , Guignard B , Steibel J , Parizel N , de Sousa PL , Boehm N , Grucker D , Ghandour MS ((2006) ) Brain dysmyelination and recovery assessment by noninvasive in vivo diffusion tensor magnetic resonance imaging. J Neurosci Res 83: , 392–402. |
[13] | Sun SW , Liang HF , Trinkaus K , Cross AH , Armstrong RC , Song SK ((2006) ) Noninvasive detection of cuprizone induced axonal damage and demyelination in the mouse corpus callosum. Magn Reson Med 55: , 302–308. |
[14] | Sloane JA , Hollander W , Rosene DL , Moss MB , Kemper T , Abraham CR ((2000) ) Astrocytic hypertrophy and altered GFAP degradation with age in subcortical white matter of the rhesus monkey. Brain Res 862: , 1–10. |
[15] | Avila-Muñoz E , Arias C ((2014) ) When astrocytes become harmful: Functional and inflammatory responses that contribute to Alzheimer’s disease. Ageing Res Rev 18: , 29–40. |
[16] | Aung WY , Mar S , Benzinger TL ((2013) ) Diffusion tensor MRI as a biomarker in axonal and myelin damage. Imaging Med 5: , 427–440. |
[17] | Madden DJ , Bennett IJ , Burzynska A , Potter GG , Chen NK , Song AW ((2012) ) Diffusion tensor imaging of cerebral white matter integrity in cognitive aging. Biochim Biophys Acta 1822: , 386–400. |
[18] | Meng JZ , Guo LW , Cheng H , Chen YJ , Fang L , Qi M , Jia ZY , Mohammed W , Hong XN ((2012) ) Correlation between cognitive function and the association fibers in patients with Alzheimer’s disease using diffusion tensor imaging. J Clin Neurosci 19: , 1659–1663. |
[19] | O’Sullivan M , Jones DK , Summers PE , Morris RG , Williams SC , Markus HS ((2001) ) Evidence for cortical “disconnection” as a mechanism of age-related cognitive decline. Neurology 57: , 632–638. |
[20] | Behrens TEJ , Berg HJ , Jbabdi S , Rushworth MF , Woolrich MW ((2007) ) Probabilistic diffusion tractography with multiple fibre orientations: What can we gain? Neuroimage 34: , 144–155. |
[21] | Ngandu T , Lehtisalo J , Levälahti E , Laatikainen T , Lindström J , Peltonen M , Solomon A , Ahtiluoto S , Antikainen R , Hänninen T , Jula A , Mangialasche F , Paajanen T , Pajala S , Rauramaa R , Strandberg T , Tuomilehto J , Soininen H , Kivipelto M ((2014) ) Recruitment and baseline characteristics of participants in the Finnish Geriatric Intervention Study to Prevent Cognitive Impairment and Disability (FINGER): A randomized controlled lifestyle trial. Int J Environ Res Public Health 11: , 9345–9360. |
[22] | Morris JC , Heyman A , Mohs RC , Hughes JP , van Belle G , Fillenbaum G , Mellits ED , Clark C ((1989) ) The Consortium to Establish a Registry for Alzheimer’s Disease (CERAD). Part I. Clinical and neuropsychological assessment of Alzheimer’s disease. Neurology 39: , 1159–1165. |
[23] | Fazekas F , Chawluk JB , Alavi A , Hurtig HI , Zimmerman RA ((1987) ) MR signal abnormalities at 1.5-T in Alzheimer dementia and normal aging. Am J Roentgenol 149: , 351–356. |
[24] | Smith SM , Jenkinson M , Johansen-Berg H , Rueckert D , Nichols TE , Mackay CE , Watkins KE , Ciccarelli O , Cader MZ , Matthews PM , Behrens TE ((2006) ) Tract-based spatial statistics: Voxelwise analysis of multi-subject diffusion data. Neuroimage 31: , 1487–505. |
[25] | Smith SM , Johansen-Berg H , Jenkinson M , Rueckert D , Nichols TE , Miller KL , Robson MD , Jones DK , Klein JC , Bartsch AJ , Behrens TE ((2007) ) Acquisition and voxelwise analysis of multi-subject diffusion data with tract-based spatial statistics. Nat Protoc 2: , 499–503. |
[26] | Kivipelto M , Ngandu T , Laatikainen T , Winblad B , Soininen H , Tuomilehto J ((2006) ) Risk score for the prediction of dementia risk in 20 years among middle aged people: A longitudinal, population-based study. Lancet Neurol 5: , 735–741. |
[27] | Harrison J , Minassian SL , Jenkins L , Black RS , Koller M , Grundman M ((2007) ) A neuropsychological test battery for use in Alzheimer disease clinical trials. Arch Neurol 64: , 1323–1329. |
[28] | Golden CJ ((1976) ) Identification of brain disorders by the Stroop color and word test. J Clin Psychol 32: , 654–658. |
[29] | Harsan LA , Poulet P , Guignard B , Parizel N , Skoff RP , Ghandour MS ((2007) ) Astrocytic hypertrophy in dysmyelination influences the diffusion anisotropy of white matter. J Neurosci Res 85: , 935–944. |
[30] | Alexander AL , Hurley SA , Samsonov AA , Adluru N , Hosseinbor AP , Mossahebi P , Tromp do PM , Zakszewski E , Field AS ((2011) ) Characterization of cerebral white matter properties using quantitative magnetic resonance imaging stains. Brain Connect 1: , 423–446. |
[31] | Pfefferbaum A , Adalsteinsson E , Sullivan EV ((2005) ) Frontal circuitry degradation marks healthy adult aging: Evidence from diffusion tensor imaging. Neuroimage 26: , 891–899. |
[32] | Adluru N , Destiche DJ , Lu SYF , Doran ST , Birdsill AC , Melah KE , Okonkwo OC , Alexander AL , Dowling NM , Johnson SC , Sager MA , Bendlin BB ((2014) ) White matter microstructure in late middle-age: Effects of apolipoprotein E4 and parental family history of Alzheimer’s disease. Neuroimage Clin 4: , 730–742. |
[33] | Racine AM , Adluru N , Alexander AL , Christian BT , Okonkwo OC , Oh J , Cleary CA , Birdsill A , Hillmer AT , Murali D , Barnhart TE , Gallagher CL , Carlsson CM , Rowley HA , Dowling NM , Asthana S , Sager MA , Bendlin BB , Johnson SC ((2014) ) Associations between white matter microstructure and amyloid burden in preclinical Alzheimer’s disease: A multimodal imaging investigation. Neuroimage Clin 4: , 604–614. |
[34] | Ryan NS , Keihaninejad S , Shakespeare TJ , Lehmann M , Crutch SJ , Malone IB , Thornton JS , Mancini L , Hyare H , Yousry T , Ridgway GR , Zhang H , Modat M , Alexander DC , Rossor MN , Ourselin S , Fox NC ((2013) ) Magnetic resonance imaging evidence for presymptomatic change in thalamus and caudate in familial Alzheimer’s disease. Brain 136: , 1399–1414. |
[35] | Qin YY , Li MW , Zhang S , Zhang Y , Zhao LY , Lei H , Oishi K , Zhu WZ ((2013) ) In vivo quantitative whole-brain diffusion tensor imaging analysis of APP/PS1 transgenic mice using voxel-based and atlas-based methods. Neuroradiology 55: , 1027–1038. |
[36] | Shu X , Qin YY , Zhang S , Jiang JJ , Zhang Y , Zhao LY , Shan D , Zhu WZ ((2013) ) Voxel-based diffusion tensor imaging of an APP/PS1 mouse model of Alzheimer’s disease. Mol Neurobiol 48: , 78–83. |
[37] | Zerbi V , Kleinnijenhuis M , Fang X , Jansen D , Veltien A , Van Asten J , Timmer N , Dederen PJ , Kiliaan AJ , Heerschap A ((2013) ) Gray and white matter degeneration revealed by diffusion in an Alzheimer mouse model. Neurobiol Aging 34: , 1440–1450. |
[38] | Liang D , Bhatta S , Gerzanich V , Simard JM ((2007) ) Cytotoxic edema: Mechanisms of pathological cell swelling. Neurosurg Focus 22: , E2. |
[39] | Thomas AG , Dennis A , Bandettini PA , Johansen-Berg H ((2012) ) The effects of aerobic activity on brain structure. Front Psychol 3: , 86. |
[40] | Dishman RK , Berthoud HR , Booth FW , Cotman CW , Edgerton VR , Fleshner MR , Gandevia SC , Gomez-Pinilla F , Greenwood BN , Hillman CH , Kramer AF , Levin BE , Moran TH , Russo-Neustadt AA , Salamone JD , Van Hoomissen JD , Wade CE , York DA , Zigmond MJ ((2006) ) Neurobiology of exercise. Obesity (Silver Spring) 14: , 345–356. |
[41] | Markham JA , Greenough WT ((2004) ) Experience-driven brain plasticity: Beyond the synapse. Neuron Glia Biol 1: , 351–363. |
[42] | Bullitt E , Zeng D , Mortamet B , Ghosh A , Aylward SR , Lin W , Marks BL , Smith K ((2010) ) The effects of healthy aging on intracerebral blood vessels visualized by magnetic resonance angiography. Neurobiol Aging 31: , 290–300. |
[43] | Flöel A , Ruscheweyh R , Krüger K , Willemer C , Winter B , Völker K , Lohmann H , Zitzmann M , Mooren F , Breitenstein C , Knecht S ((2010) ) Physical activity and memory functions: Are neurotrophins and cerebral gray matter volume the missing link? Neuroimage 49: , 2756–2763. |
[44] | Colcombe SJ , Erickson KI , Scalf PE , Kim JS , Prakash R , McAuley E , Elavsky S , Marquez DX , Hu L , Kramer AF ((2006) ) Aerobic exercise training increases brain volume in aging humans. J Gerontol A Biol Sci Med Sci 61: , 1166–1170. |
[45] | Cross AH , Song SK ((2017) ) A new imaging modality to non-invasively assess multiple sclerosis pathology. J Neuroimmunol 304: , 81–85. |


