
Cortical Complexity Analyses and Their Cognitive Correlate in Alzheimer’s Disease and Frontotemporal Dementia
Abstract
Background:
The changes of cortical structure in Alzheimer’s disease (AD) and frontotemporal dementia (FTD) are usually described in terms of atrophy. However, neurodegenerative diseases may also affect the complexity of cortical shape, such as the fractal dimension of the brain surface.
Objective:
In this study, we aimed at assessing the regional patterns of cortical thickness and fractal dimension changes in a cross-sectional cohort of patients with AD and FTD.
Methods:
Thirty-two people with symptomatic AD-pathology (clinically probable AD, n = 18, and amyloid-positive mild cognitive impairment, n = 14), 24 with FTD and 28 healthy controls underwent high-resolution 3T structural brain MRI. Using surface-based morphometry, we created vertex-wise cortical thickness and fractal dimension maps for group comparisons and correlations with cognitive measures in AD and FTD.
Results:
In addition to the well-established pattern of cortical thinning encompassing temporoparietal regions in AD and frontotemporal areas in FTD, we observed reductions of fractal dimension encompassing cingulate areas and insula for both conditions, but specifically involving orbitofrontal cortex and paracentral gyrus for FTD (FDR p < 0.05). Correlational analyses between fractal dimension and cognition showed that these regions were particularly vulnerable with regards to memory and language impairment, especially in FTD.
Conclusion:
While the present study demonstrates globally similar patterns of fractal dimension changes in AD and FTD, we observed distinct cortical complexity correlates of cognitive domains impairment. Further studies are required to assess cortical complexity measures at earlier disease stages (e.g., in prodromal/asymptomatic carriers of FTD-related gene mutations) and determine whether fractal dimension represents a sensitive imaging marker for prevention and diagnostic strategies.
INTRODUCTION
Considering the expected dramatic increase of patients affected by dementia and the anticipated costs to the society, efficient prevention strategies—including early imaging markers—are paramount to tackle this major socioeconomic issue. Late-onset Alzheimer’s disease (AD) accounts for more than half of the cases of dementia [1] and is characterized by episodic memory impairment in association with executive dysfunctions and visuospatial disturbances [2, 3], reflecting amyloid plaques and neurofibrillary tangles deposition in medial temporal and parietal regions [4]. While frontotemporal dementia (FTD) is less frequent in the older-age population, its prevalence has been reported as similar to AD in patients aged 45–64 [5]. FTD encompasses a group of clinical syndromes characterized by behavioral and language changes, due to degeneration in frontal and temporal lobes, with pathologic diagnosis based on abnormal accumulation of three major proteins: microtubule-associated protein tau (MAPT, 40%), TAR DNA-binding protein of 43 kD (TDP-43, 50%), and fused in sarcoma protein (FUS, 10%). FTD includes a behavioral variant (bvFTD) and a primary progressive aphasia (PPA) further divided in a semantic variant (svPPA) and non-fluent type (nfPPA) [6, 7].
Structural MRI imaging studies have identified a distinct pattern of grey matter (GM) atrophy and cortical thinning in AD and FTD [8, 9]. While medial temporal and parietal lobes are primarily involved in AD, FTD is characterized by cortical thinning encompassing the frontal and anterior temporal lobes. The FTD subtypes also exhibit anatomical alterations in distinct regional pattern, with cortical thinning more specifically involving the orbitofrontal cortex in bvFTD [10], the left anterior temporal cortex in svPPA [11], and the inferior frontal gyrus in nfPPA [12]. These neuroanatomical patterns also adhere to the clinical syndromes and partly explain the characteristic clinical and neuropsychological features of each variant.
In addition to cortical thickness, other surface-based morphometry (SBM) indices can characterize cortical folding patterns. One measure is the local gyrification index, defined as the ratio between the inner surface size to the outer surface size of a convex hull. However, this measure suffers from several drawbacks, including between-subject brain size differences normalization and noise in surface reconstruction [13]. Another recently introduced measure of cortical complexity is the fractal dimension, which does not rely on defining an explicit outer hull and thus avoiding the possible confounds encountered when estimating local gyrification index. Based on the idea that the brain structure can be mathematically described as a fractal [14], fractal dimension can be used to measure cortical folding complexity, even at the vertex level [15]. Recent studies have shown significant differences of regional fractal dimension in a variety of neuropsychiatric and neurological conditions, including schizophrenia and multiple sclerosis [16, 17]. In AD and mild cognitive impairment (MCI), reduction in fractal dimension has been observed in the insula, medial temporal lobe, and cingulate cortex [18]. In addition, Sheelakumari et al. showed that whole-brain fractal dimension was reduced in behavioral and aphasic variants of FTD compared to controls [19]. However, the vertex-wise regional pattern of fractal dimension reductions in FTD has remained largely unknown. Moreover, whereas fractal dimension reduction in AD was related to global cognitive impairment according to the Alzheimer Disease Assessment Scale cognitive (ADAS-cog) scale [20], the correlation between cortical complexity analysis and specific cognitive subdomains has not yet been evaluated.
In this study, we aimed at assessing the regional patterns of cortical thickness and fractal dimension changes in a cross-sectional cohort of patients with AD and FTD. In addition to the previously described cortical thinning encompassing the temporoparietal areas in AD and frontotemporal regions in FTD [8–10, 21], the present study will explore whether the two disease groups would exhibit a distinct pattern of changes in fractal dimension. Based on a previous study [18], we expected AD subjects to show a reduced fractal dimension in medial temporal regions. As the pattern of altered fractal dimension in AD broadly follows that of cortical thinning, we hypothesized that FTD would also present a fractal dimension reduction in disease-specific regions, including the “epicenter” of pathogenesis in the insula [22] and orbitofrontal cortex.
METHODS
Participants
The present study is part of the Neuroimaging of Inflammation in MemoRy and Other Disorders (NIMROD) protocol [23]. We included 18 participants with clinically probable AD according to McKhann’s criteria [24]. In addition, we recruited 14 patients with MCI defined by a Mini-Mental State Examination (MMSE) score >24/30, memory impairment at least 1.5 standard deviation (SD) below that expected for age and education, and in vivo evidence of amyloid pathology (positive 11C-Pittsburgh compound B (PiB) PET imaging). AD and MCI patients were combined on the basis that these two subgroups represent a clinical continuum of the same pathological spectrum.
We also included 24 patients with FTD (8 bvFTD, 9 svPPA, and 7 nfPPA) diagnosed according to published consensus criteria [6, 7]. Twenty-eight similarly aged healthy participants were recruited as controls, with MMSE > 26/30, absence of regular memory complaints, and no history of major neurological, psychiatric, or significant medical illness. Patients were identified from the memory clinic at the Cambridge University Hospitals NHS Trust. Controls were recruited via the Dementias and Neurodegenerative Diseases Research Network (DeNDRON) volunteer register. Informed written consent was obtained in accordance with the Declaration of Helsinki. The study received a favorable opinion from the East of England Ethics Committee (Cambridge Central Research, Ref. 13/EE/0104). Clinical and cognitive assessment included MMSE and revised Addenbrooke’s Cognitive Examination (ACE-R) [25].
MRI acquisition and preprocessing
Participants underwent MRI imaging acquired on a 3T scanner (Siemens Magnetom Tim Trio) using a magnetization-prepared rapid gradient echo (MPRAGE) T1-weighted sequence with the following parameters: repetition time = 2300 ms, echo time = 2.98 ms, field of view = 240×256 mm2, 176 slices, flip angle = 9°, isotropic 1 mm3 voxels.
SBM analyses were performed using the Computational Anatomy Toolbox 12 (CAT12, Structural Brain Imaging Group, University of Jena, Germany) in Matlab R2019a version 9.6 (MathWorks Inc., Sherborn, MA, USA). Cortical thickness and central surface of the left and right hemispheres were assessed using a projection-based thickness method [26]. Using a tissue segmentation to estimate the white matter distance, the software projects the local maxima (which is equal to the cortical thickness) to other GM voxels by using a neighbor relationship described by the white matter distance. Projection-based thickness allows the handling of partial volume information, sulcal blurring, and sulcal asymmetries without explicit sulcus reconstruction [26], which results in a significant reduction of processing time compared to other SBM softwares. Topological correction, spherical mapping, and spherical registration are performed in order to obtain vertex-wise cortical thickness. Cortical thickness surface maps were smoothed using a 15 mm-full-width-at-half-maximum (FWHM) kernel. Similarly, CAT12 can extract fractal dimension values at the global (whole-brain), regional (based on regions of interest of an atlas), and local (vertex) level, based on a spherical harmonic reconstruction method described in a previous study [15]. At variance with the box-counting approach, spherical harmonic reconstruction allows to maintain an identical number of vertices for all reconstructed surfaces, which reduces the influence of individual vertex alignment, resampling and interpolation, resulting in more accurate reconstructions [15]. In that context, the maximum l-value (or degree) of the reconstruction is used, and the slope may be found by regressing log (area) versus log (max l-value). For that purpose, the spherical harmonic coefficients of the central surface up to a maximum l-value of 1024 were extracted for each hemisphere. In order to reduce computation time, CAT12 processes 10 separate reconstructions using maximum l-values of 11 to 29. This allows optimal surface area reconstruction, resulting in surface areas of 40 to 75% of the maximum surface area. Point-wise complexity values are then obtained by averaging the values from all neighboring polygons. Subsequently, the area values for the spherical harmonic reconstructions were normalized by the area values in the full-coefficient reconstruction (l-value = 1024). After obtaining individual vertex-wise fractal dimension maps, smoothing was performed with a 20 mm-FWHM kernel as recommended. Labelling of the significant regions of interest determined in group comparisons and correlations was based on the Desikan-Killiany atlas included in the CAT12 SBM toolbox.
Statistical analyses
Demographic data were analyzed with Stata software Version 14.2 (College Station, TX). Assessment of distribution for continuous variables was performed with Shapiro–Wilk test and visualization of histogram plots, followed by ANOVA or Kruskal-Wallis test, and post hoc Tukey/Dunn test, accordingly. Categorical variables were compared with Chi-squared test. Statistical significance was considered when p < 0.05.
Global (whole-brain) cortical thickness and fractal dimension values were calculated for each group, and correlation between cortical thickness and fractal dimension were performed with Pearson correlation. Between-group local (vertex-wise) cortical thickness and fractal dimension comparisons were performed in CAT12 with a general linear model using age and sex as covariates. Vertex-wise correlations between SBM maps and ACE-R cognitive subscores were performed using multiple regressions also with age and sex as covariates. All tests were performed with non-parametric permutations (n = 5,000) and threshold-free cluster enhancement (TFCE), using a significant statistical threshold of false discovery rate (FDR)-corrected p < 0.05.
RESULTS
Demographics
Demographic and clinical characteristics of patients with AD, FTD, and control participants are shown in Table 1. An age difference was observed (p = 0.01, ANOVA), with FTD patients being significantly younger than AD patients (p = 0.01, post hoc Tukey test), as expected based on the demographic characteristics of these neurodegenerative disorders. Sex distribution and education attainment were similar across groups, whereas, as expected, MMSE and ACE-R scores were significantly lower in the AD and FTD groups compared to Controls (p < 0.0001, Kruskal-Wallis with post hoc Dunn test). Each of the five ACE-R cognitive subdomains was assessed separately for AD and FTD (including its variants). A significant impairment was considered when the mean group subscore was >1.5 SD below the score of Controls, adjusted for age and education. While AD showed an impairment in memory and fluency, FTD group including its variants had a significant degree of impairment in language over and above memory and verbal fluency impairment. Attention/orientation and visuospatial subscores were only mildly reduced in both dementia groups (mean subscores <1.5 SD below controls), and therefore were not used for further analyses of clinical-imaging correlations.
Table 1
Baseline characteristics of included subjects
| AD (n = 32) | FTD (n = 24) | Controls (n = 28) | pval | Posthoc test | |
| Age (y) | 72.3±8.2 (53–86) | 66.2±9.2 (50–84) | 70.3±5.6 (59–84) | 0.01* | FTD < AD |
| Male participants | 56.3% (18/32) | 50% (12/24) | 53.6% (15/28) | 0.9§ | |
| Education (y) | 13.1±3.0 (10–19) | 13.5±2.8 (10–18) | 14.6±2.5 (10–19) | 0.12# | |
| MMSE | 24.9±3.4 (12–30) | 25.2±4.9 (14–30) | 29.0±1.0 (27–30) | 0.0001# | FTD and AD < Controls |
| ACE-R | 75.7±11.0 (43–91) | 67.7±17.1 (38–93) | 93.7±4.8 (79–100) | 0.0001# | FTD and AD < Controls |
| Whole-brain mean cortical thickness (mm) | 2.50±0.14 | 2.50±0.12 | 2.64±0.10 | 0.0001* | FTD and AD < Controls |
| Whole-brain mean fractal dimension | 2.54±0.02 | 2.54±0.03 | 2.56±0.02 | 0.0007* | FTD and AD < Controls |
*ANOVA, §Chi-squared test, #Kruskal-Wallis.
Cortical thickness/FD group comparisons
As shown in Table 1, whole-brain cortical thickness and fractal dimension values were significantly lower in AD and FTD relative to controls (p < 0.001, ANOVA with all post hoc Tukey test p < 0.001). There was also a significant positive correlation between mean cortical thickness and mean fractal dimension (rho = 0.30, p < 0.006, Pearson correlation).
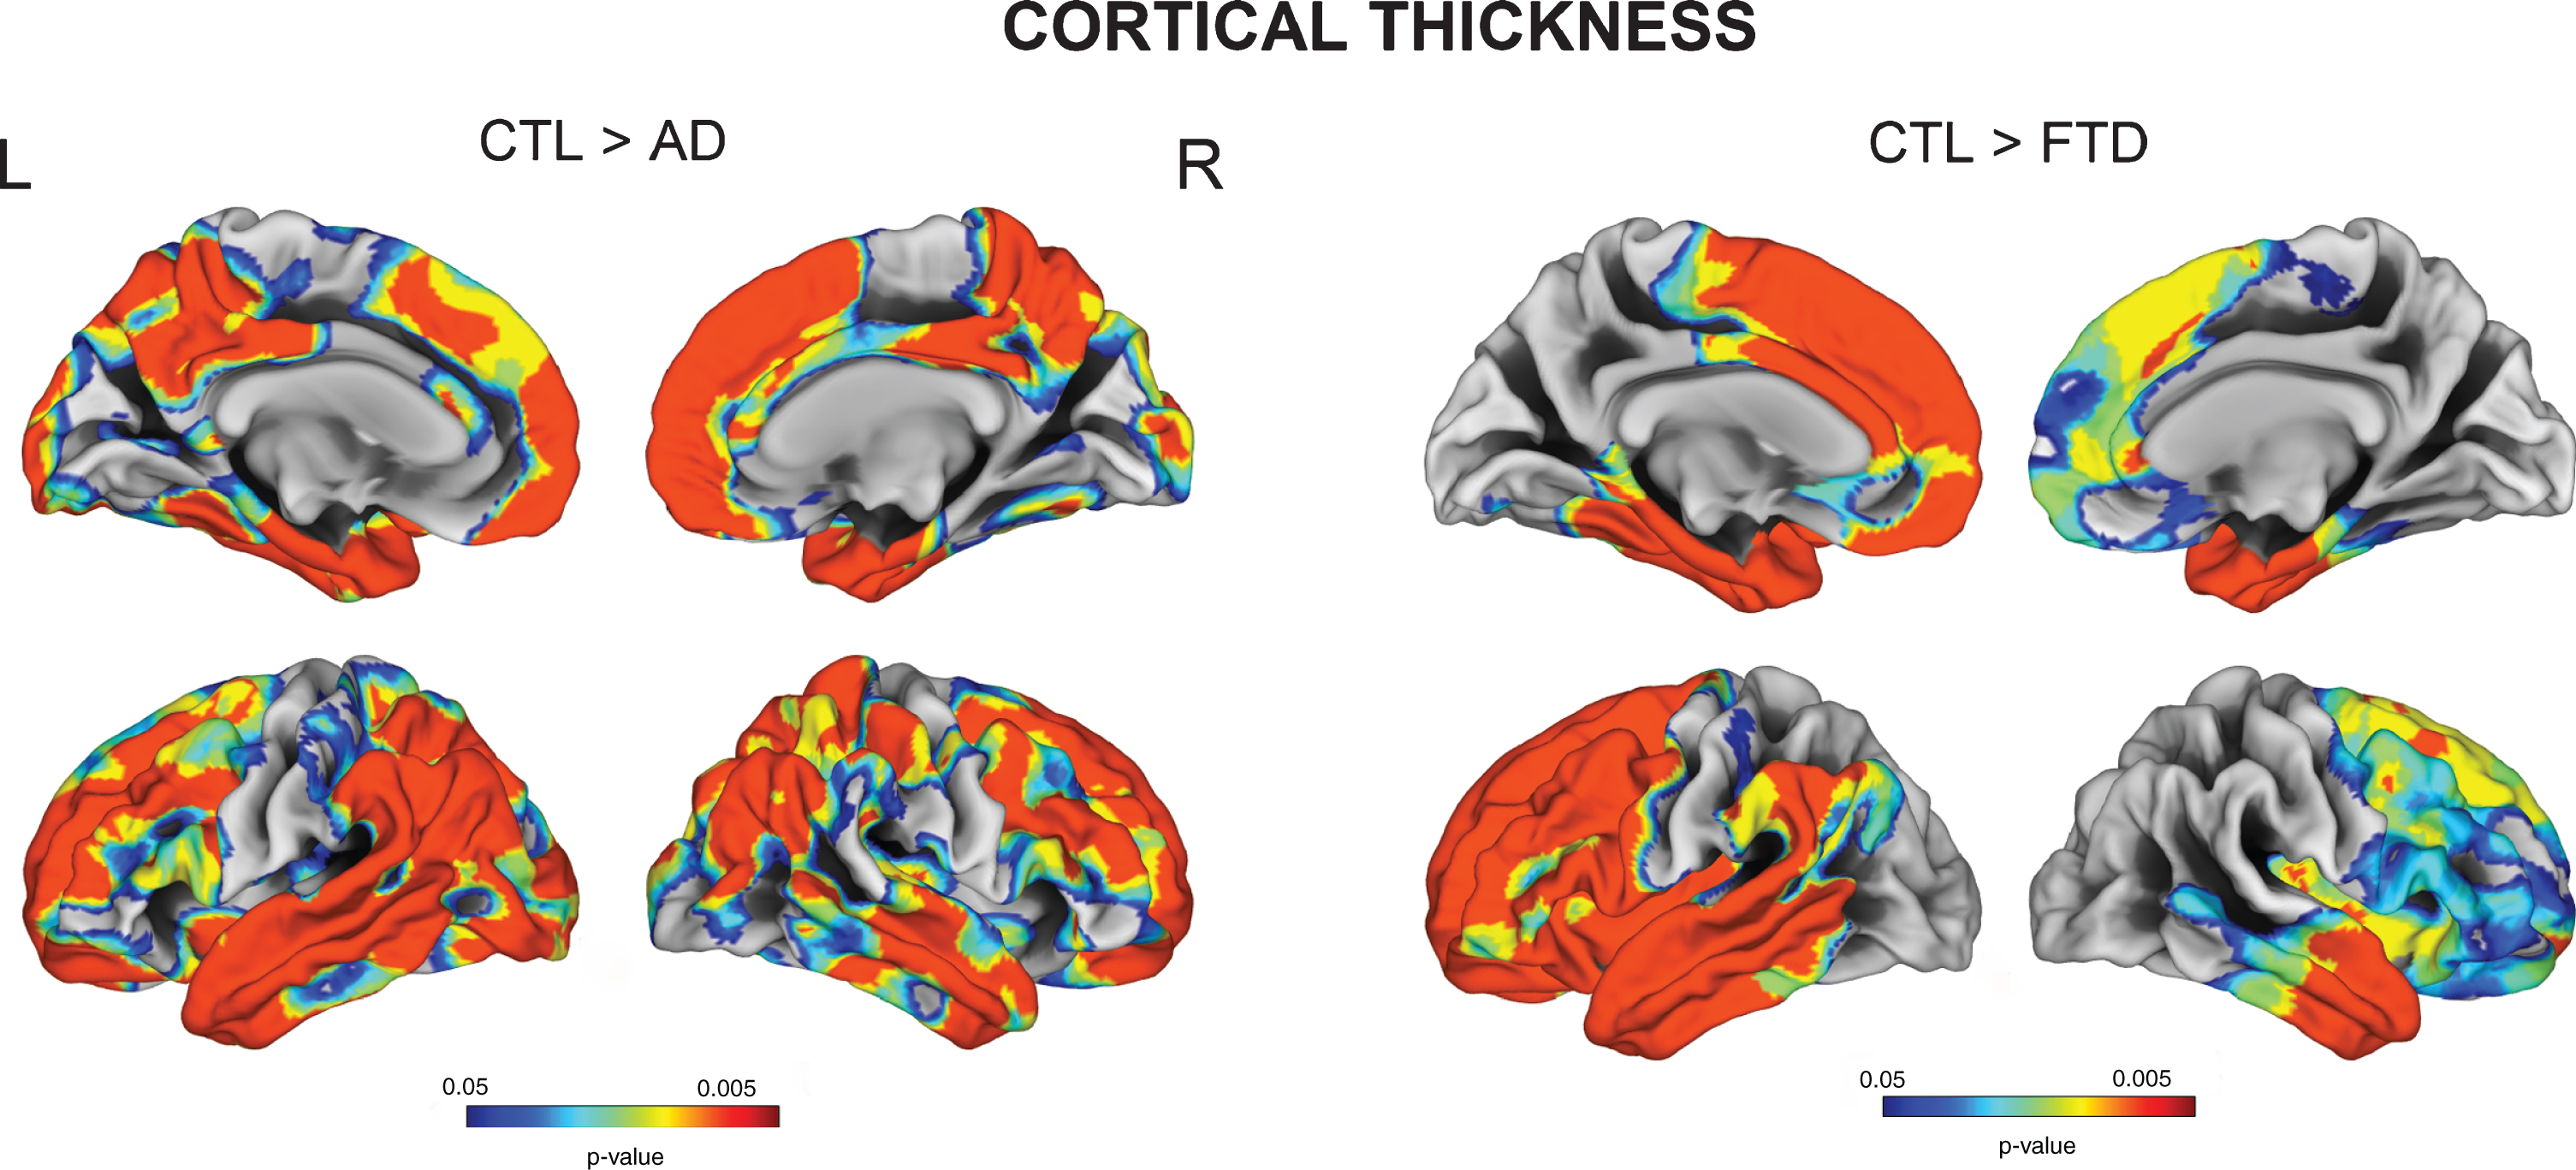
Vertex-wise cortical thickness group comparisons showed that AD subjects had significant cortical thinning in extensive frontal, temporal, parietal and cingulate cortices, while FTD patients exhibited cortical thickness reduction mainly in frontal and anterior temporal regions (FDR p < 0.05) (Fig. 1). FTD subgroup analyses revealed that the superior frontal cortex was particularly affected in bvFTD and nfPPA, whereas the left anterior temporal regions were more severely affected in svPPA (all FDR p < 0.05) (Supplementary Figure 1).
Fig. 1
Vertex-wise cortical thickness group comparisons between Controls, AD, and FTD (FDR-corrected p < 0.05).
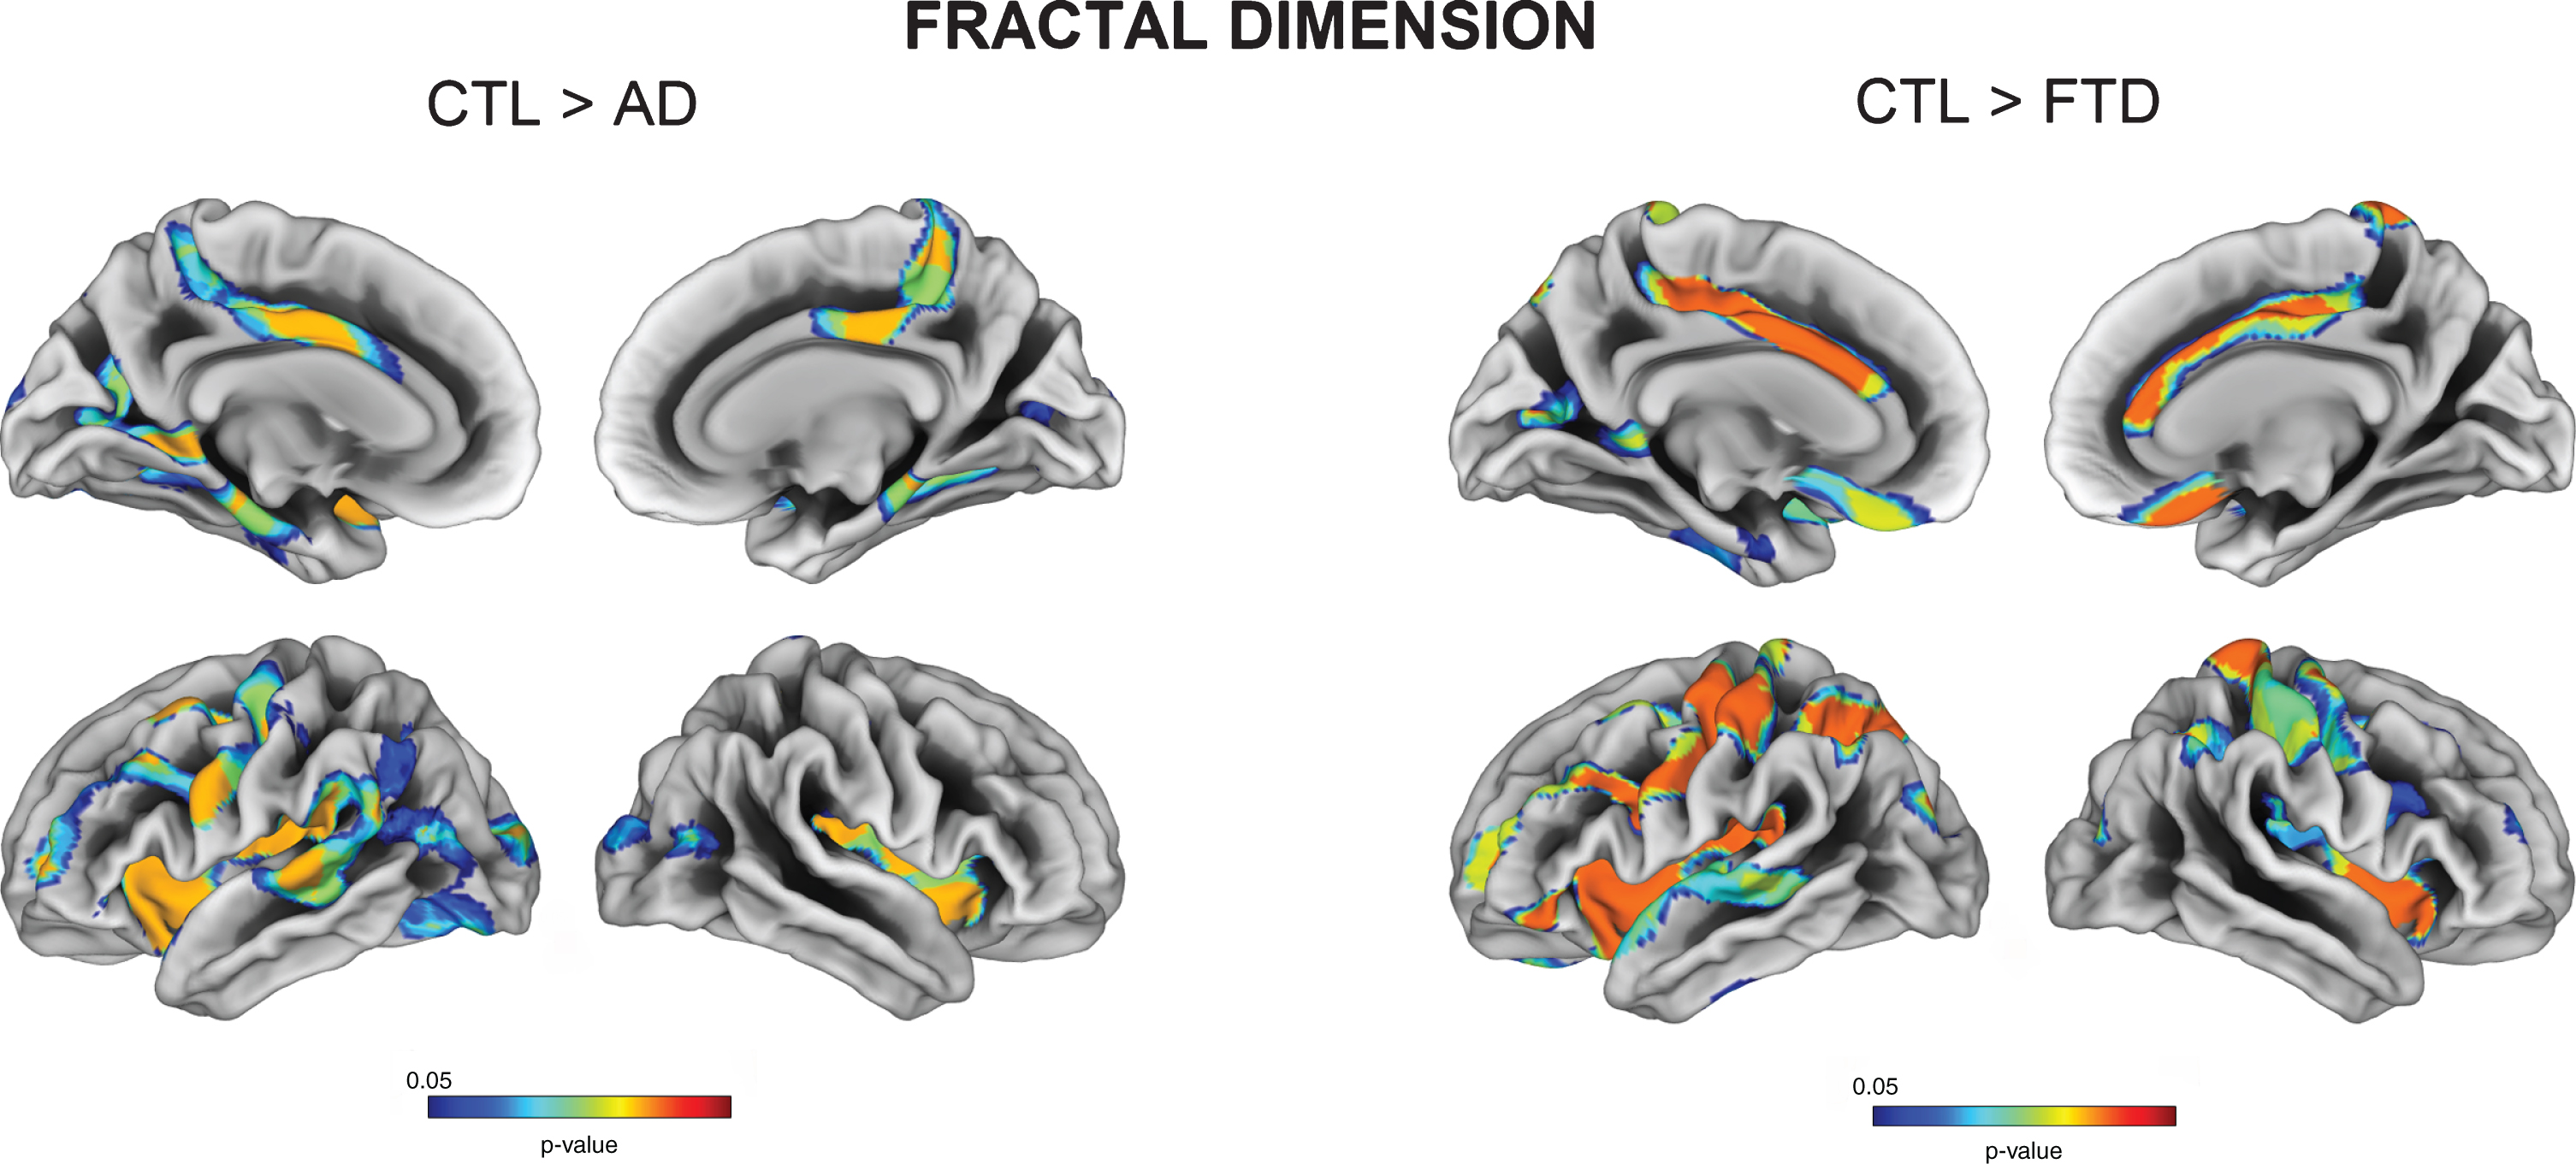
We also observed decreased fractal dimension for both AD and FTD relative to controls in regions encompassing the insula, posterior cingulate, pre- and postcentral gyri. More specifically, AD had decreased cortical complexity measures in bilateral parahippocampal gyri, while FTD had reduced values in right postcentral gyrus (all FDR p < 0.05) (Fig. 2). FTD subtypes showed a variable degree of fractal dimension reduction in the insula, orbitofrontal and middle frontal regions.
Fig. 2
Vertex-wise fractal dimension group comparisons between Controls, AD, and FTD (FDR-corrected p < 0.05).
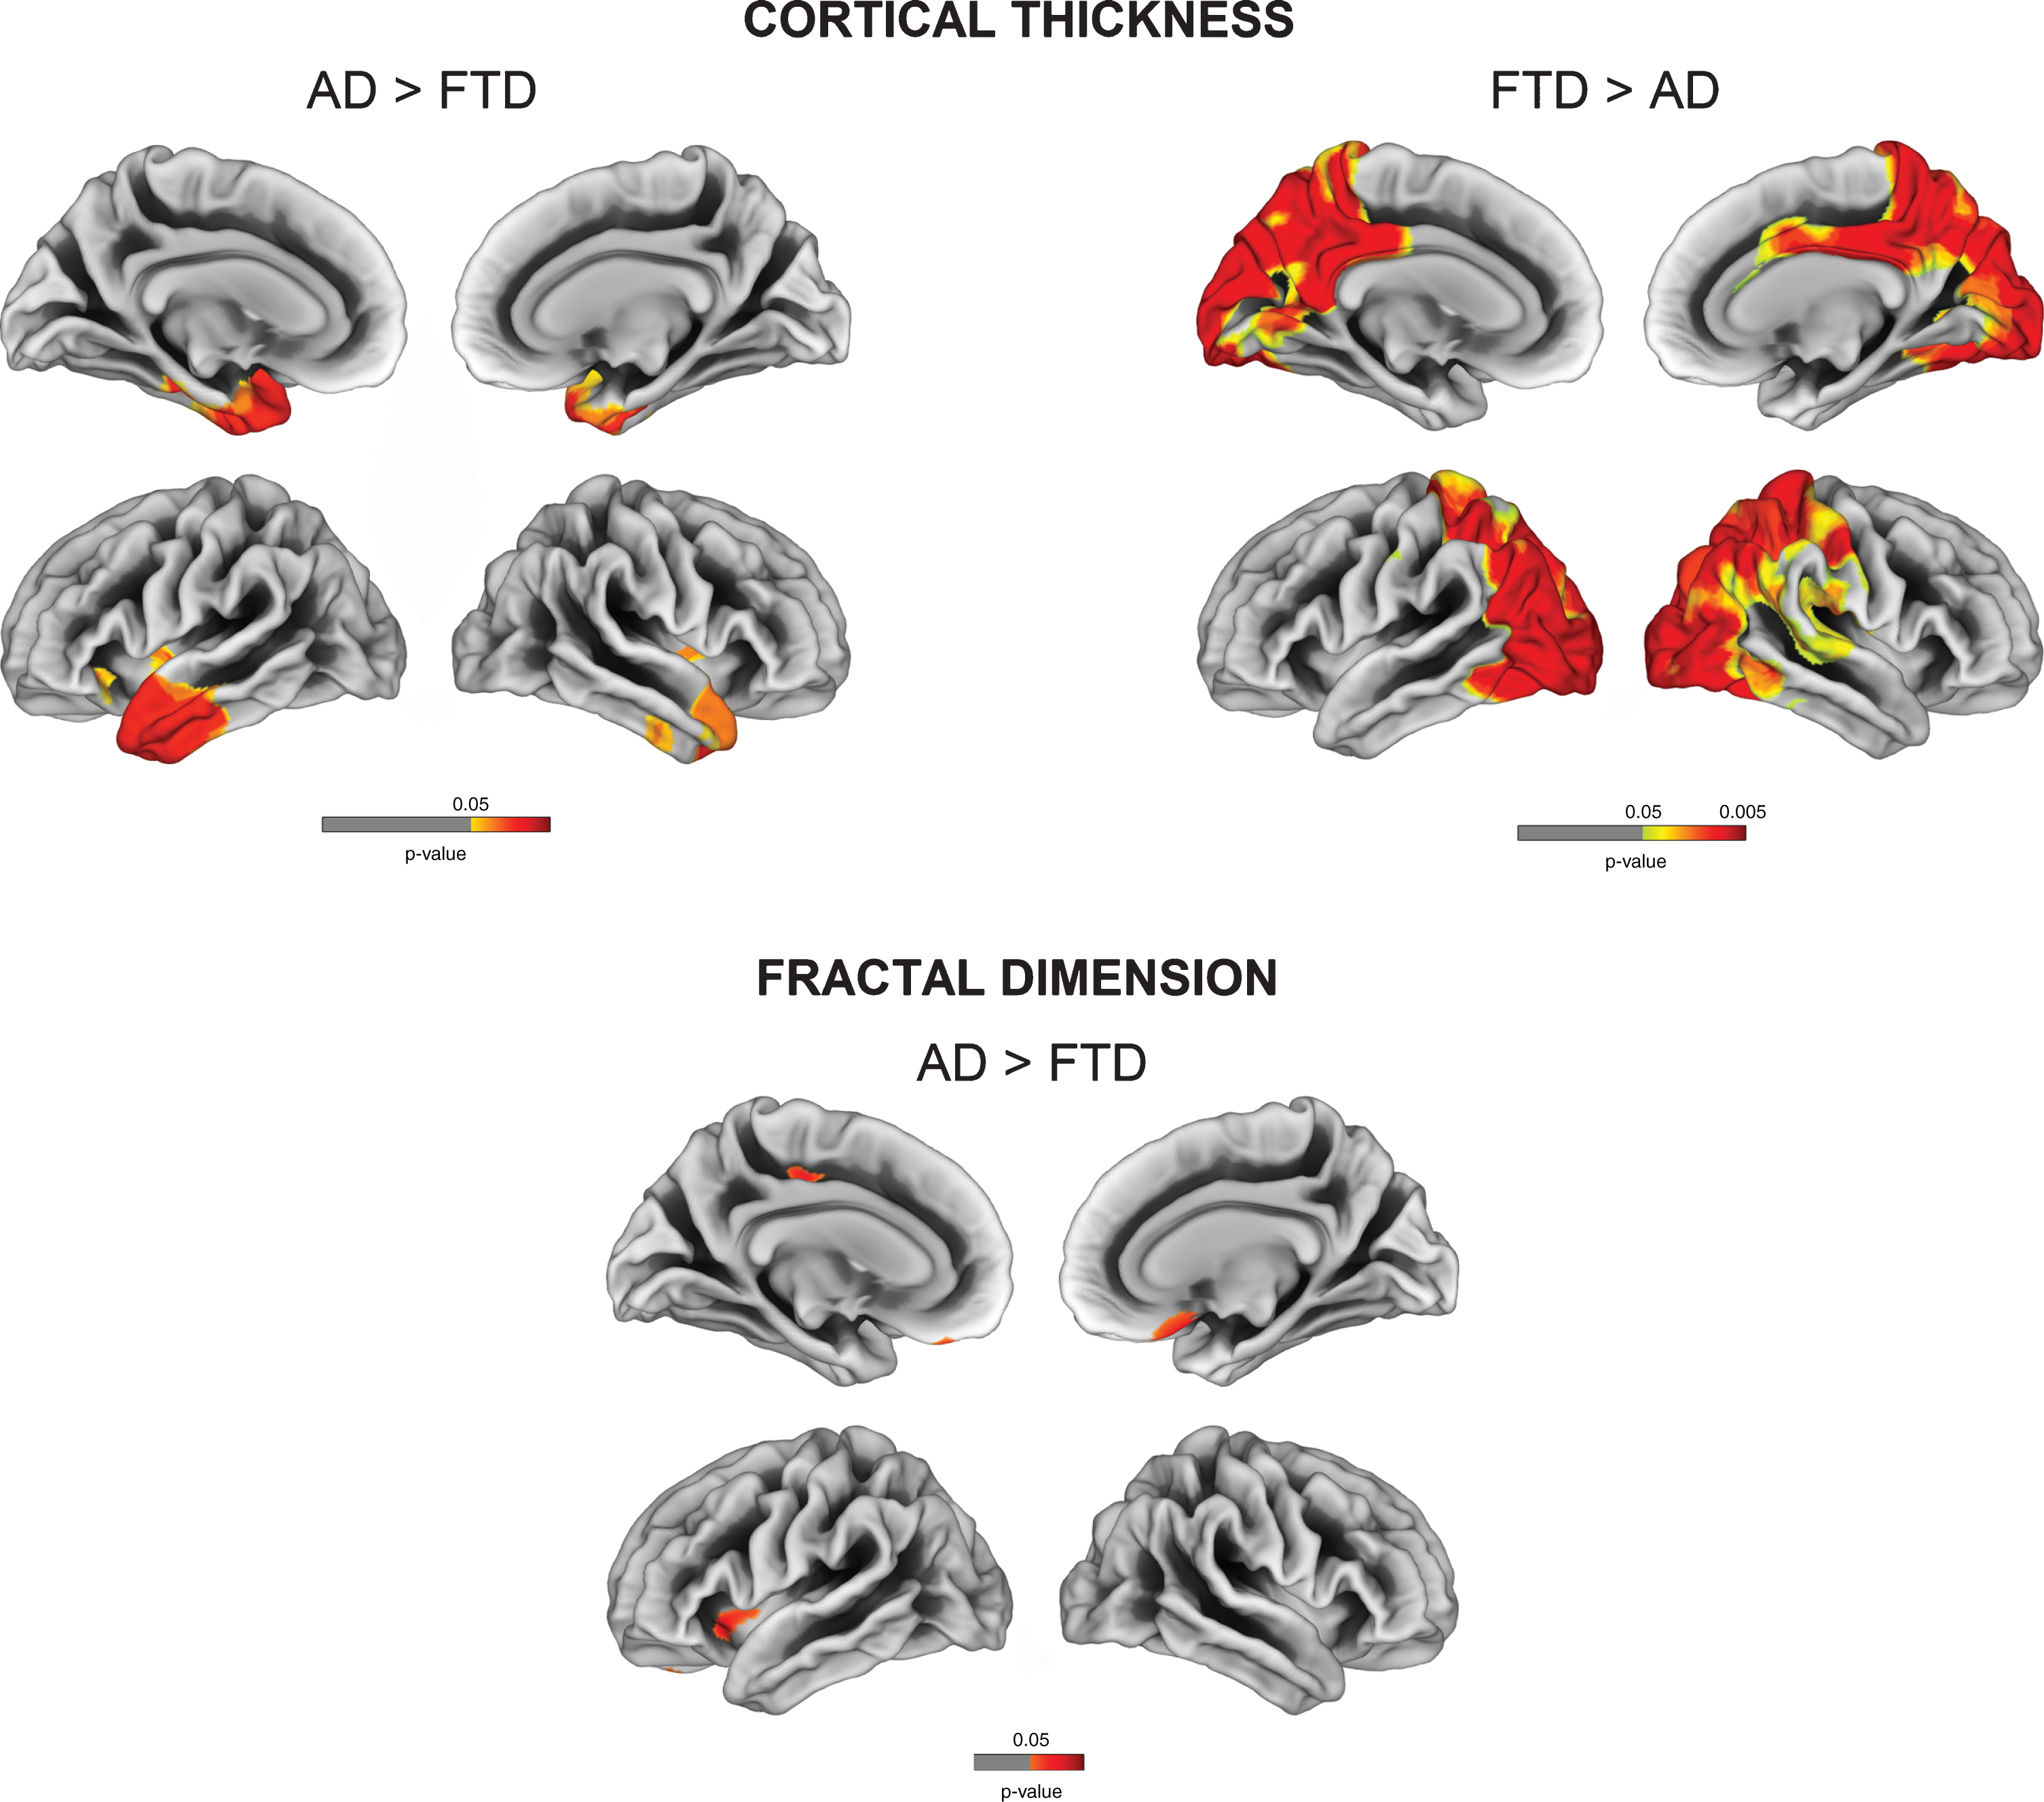
Comparisons between AD and FTD revealed decreased cortical thickness for AD in posterior cingulate, precuneus, parietal and occipital regions, while FTD had cortical thinning in anterior temporal cortices (FDR-corrected p < 0.05). Relative to AD, FTD patients had decreased fractal dimension in bilateral orbitofrontal cortex, left anterior insula, and paracentral gyrus (Fig. 3). No significant reduction in fractal dimension was observed for AD in comparison to FTD.
Fig. 3
Vertex-wise cortical thickness and fractal dimension comparisons between AD and FTD (FDR-corrected p < 0.05).
Vertex-wise correlation of cortical complexity measures and cognition
Memory impairment was correlated with cortical thinning in the left entorhinal, parahippocampal and middle temporal gyrus as well as right temporal pole in both AD and FTD subjects. Language and fluency impairment was associated with a reduced cortical thickness for FTD in left mediotemporal and anterior temporal regions (all FDR-corrected p < 0.05). No significant correlation was observed between cortical thinning and language subdomain in AD (Figs. 4 and 5).
Fig. 4
Vertex-wise cortical thickness and fractal dimension correlate of memory impairment for the AD group (FDR-corrected p < 0.05). L, left; R, right.
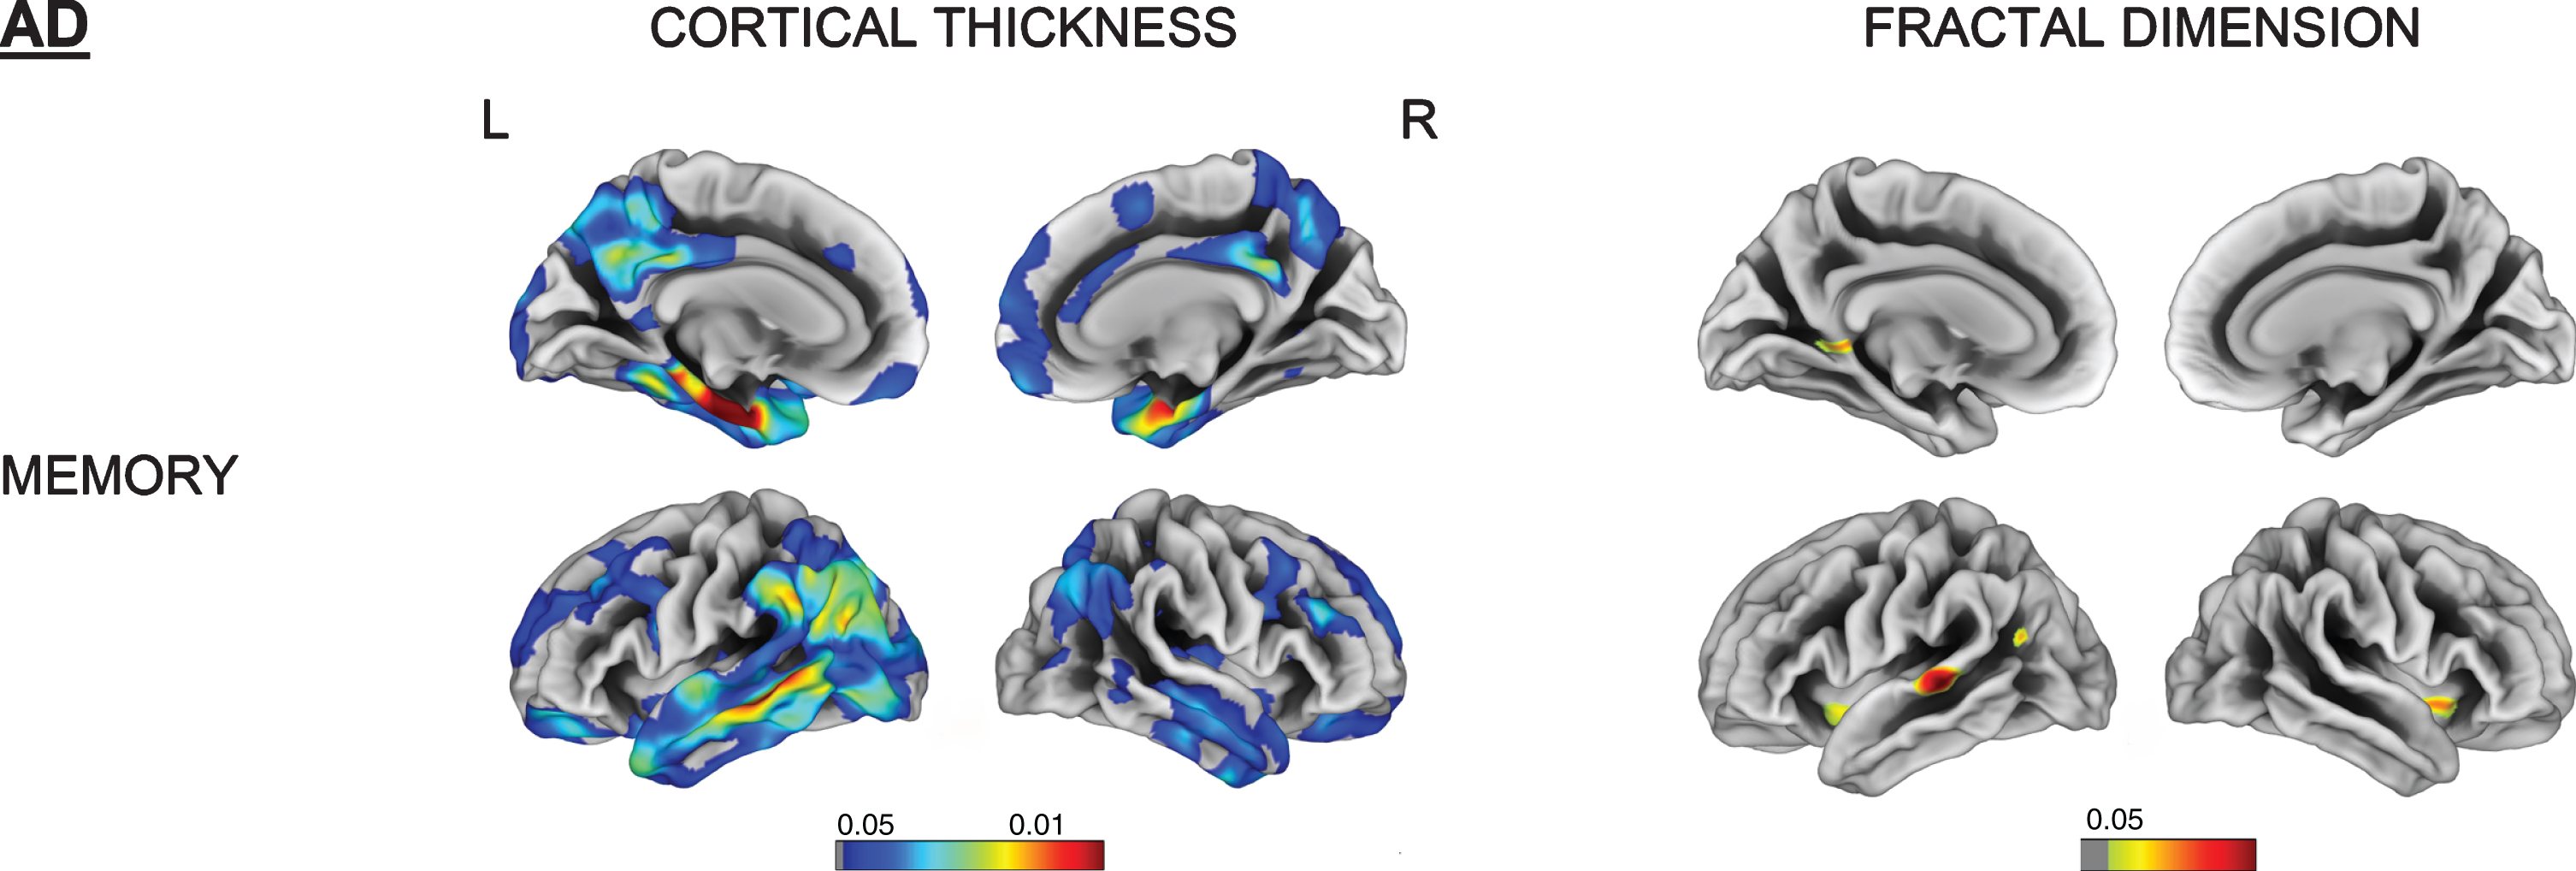
Fig. 5
Vertex-wise cortical thickness and fractal dimension correlate of memory, language and fluency impairment for the FTD group (FDR-corrected p < 0.05). L, left; R, right.
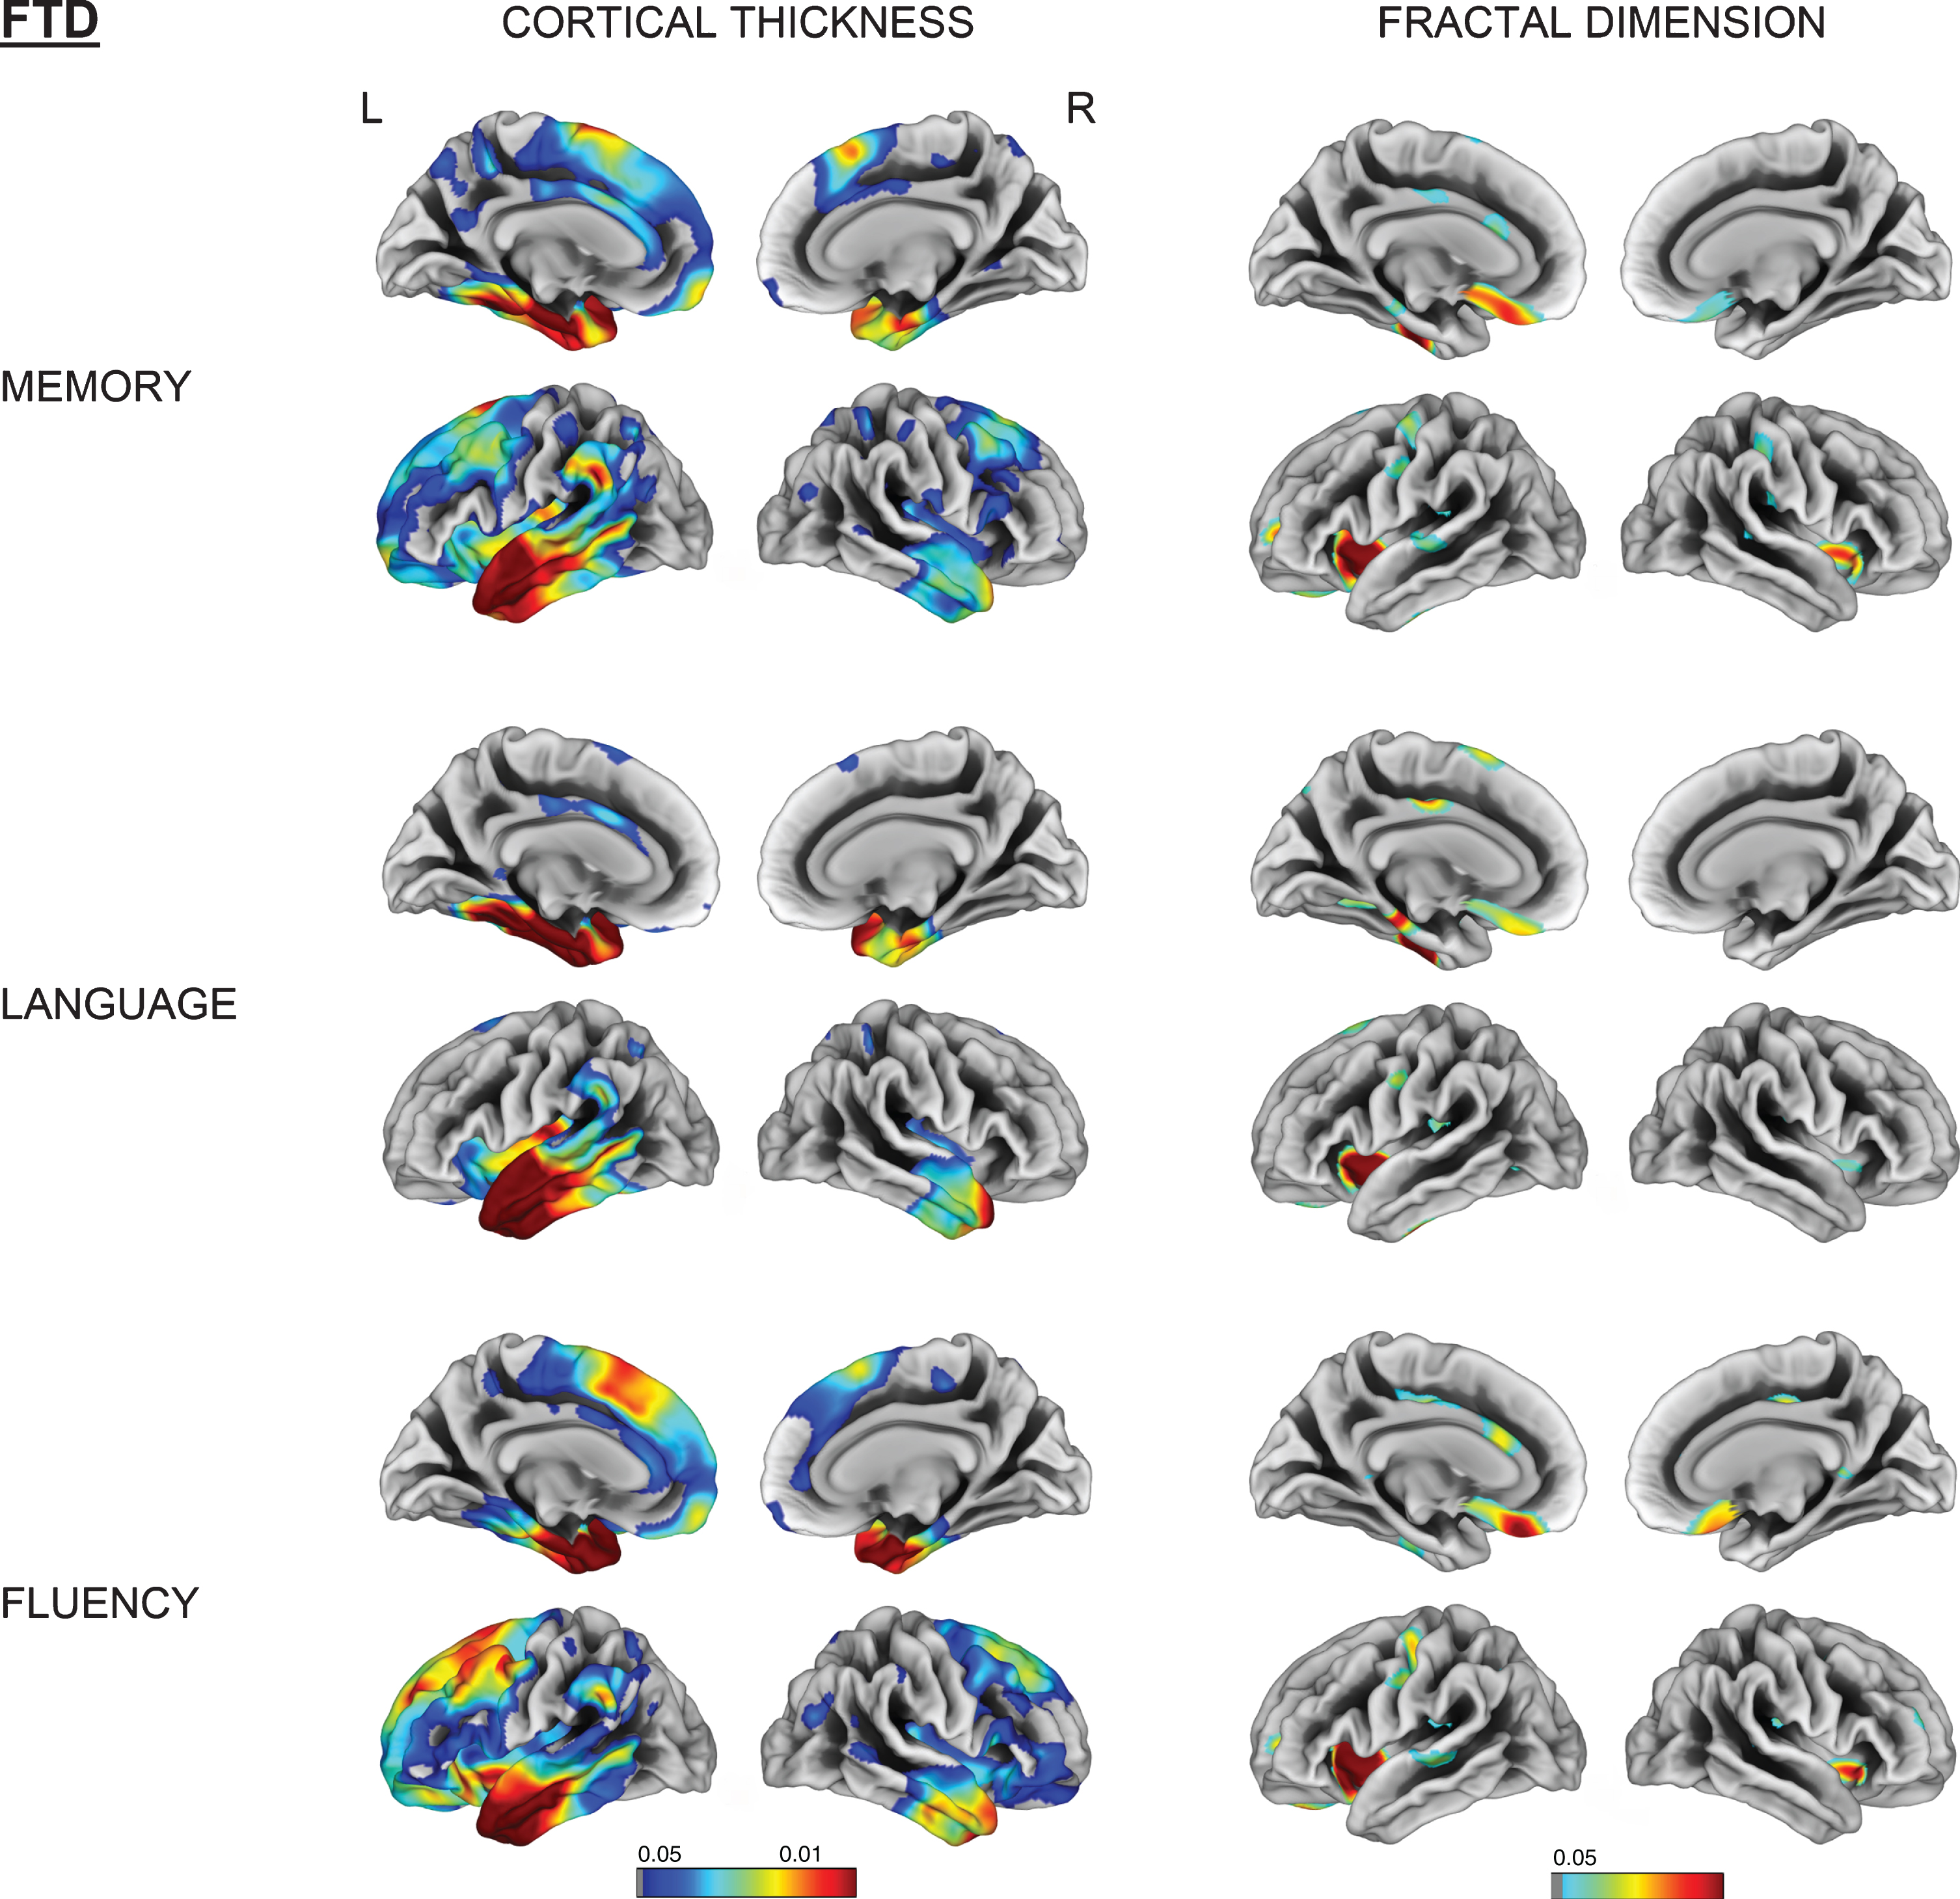
Memory impairment was associated with reduced fractal dimension in bilateral insula, left superior temporal, and isthmus cingulate for AD. Impaired memory, language, and fluency subscores for FTD were all associated with reduced fractal dimension in left insula, inferior temporal, and medial orbitofrontal gyri (Figs. 4 and 5).
DISCUSSION
Neurodegeneration changes cortical complexity. This study demonstrates that the fractal dimension of cortical complexity is a promising imaging tool to assess specific morphological patterns of grey matter damage in degenerative conditions, namely AD and FTD. The fractal dimension in disease-related regions was also associated with the severity of cognitive impairment.
We confirmed the typical cortical thinning signature of both AD (temporoparietal regions) and FTD (frontal and anterior temporal regions). In addition, these two conditions have distinct features regarding fractal dimension: whereas both AD and FTD have a variable reduction of fractal dimension in the middle frontal cortex and superior temporal gyrus compared to controls, direct comparisons between groups revealed that the precuneus was particularly vulnerable in AD, while orbitofrontal gyrus and anterior insula showed a more pronounced fractal dimension reduction for FTD subjects. Recently, Ruiz de Miras et al. showed that white matter fractal dimension (but not pial surface fractal dimension) was reduced for AD subjects in medial temporal lobe, insula, and posterior cingulate [18]. Using a similar spherical harmonic reconstruction proposed by Yotter et al. [15] natively embedded in the CAT12 toolbox, we were able to observe similar regional changes at the cortical level.
Our identification of vertex-wise changes in fractal dimension for FTD expands findings from Sheelakumari et al. [19] who found a decrease in fractal dimension at the whole-brain and hemispheric level: a decrease in the general fractal structure was observed for bvFTD, while PPA subjects had more prominent impairment in the left hemisphere. We found that FTD had reduced fractal dimension in the insula, middle and inferior frontal, orbitofrontal, and anterior cingulate gyrus compared to controls. In addition, we repeated these analyses for the different FTD variants and observed common cortical complexity changes involving the inferior frontal and insula. bvFTD and svPPA variants showed fractal dimension reductions in orbitofrontal areas, while only svPPA had a decreased fractal dimension in (mostly left) parahippocampal cortex (Supplementary Figure 1). These findings support the insula as being a major hub in speech production and socio-emotional functioning [22, 27].
When comparing the SBM maps of AD/FTD patients with controls, we observed that cortical thickness represented a more sensitive measure to detect cortical changes in dementia. In fact, larger areas showing a decreased cortical thickness in AD and FTD were observed (Fig. 1), while fractal dimension changes were mostly localized in limbic and cingulate areas (Fig. 2).
One explanation could be that fractal dimension can decrease or increase in degenerative conditions according to how the structural impairment involves the pial surface. In fact, a change in the pial surface decreasing the folding area would more likely decrease complexity. Conversely, if the change involves an increase in sulcal depth, the complexity (and thus fractal dimension) would increase.
Cortical complexity changes in fractal dimension correlated well with cognitive dysfunction. Memory impairment in AD was associated with a reduction of fractal dimension in the left isthmus cingulate and superior temporal gyrus, whereas impaired memory, language, and fluency in the FTD group were all related to reduced cortical complexity in the insula, orbitofrontal and anterior cingulate gyri (Figs. 4 and 5). These findings add credence to the hypothesis that orbitofrontal area, whose rostral region is primarily linked to medial temporal limbic structures, plays a major role in memory encoding [28, 29].
The study has several limitations. First, its cross-sectional design impeded further analyses regarding how cortical complexity evolves longitudinally. In addition, we enrolled FTD subjects at the dementia stage, while the AD group included patients with clinically probable AD as well as MCI with biomarker evidence of amyloid pathology. Further studies should assess fractal dimension changes in earlier cases, e.g., presymptomatic mutation carriers, especially in FTD. This would test whether MRI-based fractal dimension is a sensitive measure to detect early cortical alterations. Finally, our FTD subtype analysis had small group sizes, limiting power, although the significant results were convergent in the insula across the different subtypes.
This study has identified the impact of AD and FTD pathologies on cortical patterns of fractal dimension. Further work will determine when these changes emerge and how quickly they progress, in relation to other biomarkers, and in relation to the cellular and molecular features of neurodegenerative diseases.
ACKNOWLEDGMENTS
Thanks to our volunteers for participating in this study and to the radiographers at the Wolfson Brain Imaging Centre, University of Cambridge, UK, for their invaluable support in data acquisition. We thank the NIHR Dementias and Neurodegenerative Diseases Research Network for help with subject recruitment.
This study was funded by the National Institute for Health Research (NIHR, RG64473) Cambridge Biomedical Research Centre and Biomedical Research Unit in Dementia, the Wellcome Trust (JBR 103838), the Medical Research Council of Cognition and Brain Sciences Unit, Cambridge (MC-A060-5PQ30) and Cambridge Center for Parkinson Plus.
Authors’ disclosures available online (https://www.j-alz.com/manuscript-disclosures/20-0246r2).
SUPPLEMENTARY MATERIAL
[1] The supplementary material is available in the electronic version of this article: https://dx.doi.org/10.3233/JAD-200246.
REFERENCES
[1] | Barker WW , Luis CA , Kashuba A , Luis M , Harwood DG , Loewenstein D , Waters C , Jimison P , Shepherd E , Sevush S , Graff-Radford N , Newland D , Todd M , Miller B , Gold M , Heilman K , Doty L , Goodman I , Robinson B , Pearl G , Dickson D , Duara R ((2002) ) Relative frequencies of Alzheimer disease, Lewy body, vascular and frontotemporal dementia, and hippocampal sclerosis in the State of Florida Brain Bank, Alzheimer Dis Assoc Disord 16: , 203–212. |
[2] | Greene JD , Hodges JR , Baddeley AD ((1995) ) Autobiographical memory and executive function in early dementia of Alzheimer type, Neuropsychologia 33: , 1647–1670. |
[3] | Hodges JR , Patterson K , Ward R , Garrard P , Bak T , Perry R , Gregory C ((1999) ) The differentiation of semantic dementia and frontal lobe dementia (temporal and frontal variants of frontotemporal dementia) from early Alzheimer’s disease: A comparative neuropsychological study, Neuropsychology 13: , 31–40. |
[4] | Braak H , Thal DR , Ghebremedhin E , Del Tredici K ((2011) ) Stages of the pathologic process in Alzheimer disease: Age categories from 1 to 100 years, J Neuropathol Exp Neurol 70: , 960–969. |
[5] | Ratnavalli E , Brayne C , Dawson K , Hodges JR ((2002) ) The prevalence of frontotemporal dementia, Neurology 58: , 1615–1621. |
[6] | Gorno-Tempini ML , Hillis AE , Weintraub S , Kertesz A , Mendez M , Cappa SF , Ogar JM , Rohrer JD , Black S , Boeve BF , Manes F , Dronkers NF , Vandenberghe R , Rascovsky K , Patterson K , Miller BL , Knopman DS , Hodges JR , Mesulam MM , Grossman M ((2011) ) Classification of primary progressive aphasia and its variants, Neurology 76: , 1006–1014. |
[7] | Rascovsky K , Hodges JR , Knopman D , Mendez MF , Kramer JH , Neuhaus J , van Swieten JC , Seelaar H , Dopper EG , Onyike CU , Hillis AE , Josephs KA , Boeve BF , Kertesz A , Seeley WW , Rankin KP , Johnson JK , Gorno-Tempini ML , Rosen H , Prioleau-Latham CE , Lee A , Kipps CM , Lillo P , Piguet O , Rohrer JD , Rossor MN , Warren JD , Fox NC , Galasko D , Salmon DP , Black SE , Mesulam M , Weintraub S , Dickerson BC , Diehl-Schmid J , Pasquier F , Deramecourt V , Lebert F , Pijnenburg Y , Chow TW , Manes F , Grafman J , Cappa SF , Freedman M , Grossman M , Miller BL ((2011) ) Sensitivity of revised diagnostic criteria for the behavioural variant of frontotemporal dementia, Brain 134: , 2456–2477. |
[8] | Du AT , Schuff N , Kramer JH , Rosen HJ , Gorno-Tempini ML , Rankin K , Miller BL , Weiner MW ((2007) ) Different regional patterns of cortical thinning in Alzheimer’s disease and frontotemporal dementia, Brain 130: , 1159–1166. |
[9] | Singh V , Chertkow H , Lerch JP , Evans AC , Dorr AE , Kabani NJ ((2006) ) Spatial patterns of cortical thinning in mild cognitive impairment and Alzheimer’s disease, Brain 129: , 2885–2893. |
[10] | Moller C , Hafkemeijer A , Pijnenburg YAL , Rombouts S , van der Grond J , Dopper E , van Swieten J , Versteeg A , Steenwijk MD , Barkhof F , Scheltens P , Vrenken H , van der Flier WM ((2016) ) Different patterns of cortical gray matter loss over time in behavioral variant frontotemporal dementia and Alzheimer’s disease, Neurobiol Aging 38: , 21–31. |
[11] | Routier A , Habert MO , Bertrand A , Kas A , Sundqvist M , Mertz J , David PM , Bertin H , Belliard S , Pasquier F , Bennys K , Martinaud O , Etcharry-Bouyx F , Moreaud O , Godefroy O , Pariente J , Puel M , Couratier P , Boutoleau-Bretonniere C , Laurent B , Migliaccio R , Dubois B , Colliot O , Teichmann M ((2018) ) Structural, microstructural, and metabolic alterations in primary progressive aphasia variants, Front Neurol 9: , 766. |
[12] | Agosta F , Ferraro PM , Canu E , Copetti M , Galantucci S , Magnani G , Marcone A , Valsasina P , Sodero A , Comi G , Falini A , Filippi M ((2015) ) Differentiation between subtypes of primary progressive aphasia by using cortical thickness and diffusion-tensor MR imaging measures, Radiology 276: , 219–227. |
[13] | Lopes R , Betrouni N ((2009) ) Fractal and multifrl analysis: A review, Med Image Anal 13: , 634–649. |
[14] | Kiselev VG , Hahn KR , Auer DP ((2003) ) Is the brain cortex a fractal? Neuroimage 20: , 1765–1774. |
[15] | Yotter RA , Nenadic I , Ziegler G , Thompson PM , Gaser C ((2011) ) Local cortical surface complexity maps from spherical harmonic reconstructions, Neuroimage 56: , 961–973. |
[16] | Esteban FJ , Sepulcre J , de Mendizabal NV , Goni J , Navas J , de Miras JR , Bejarano B , Masdeu JC , Villoslada P ((2007) ) Fractal dimension and white matter changes in multiple sclerosis, Neuroimage 36: , 543–549. |
[17] | Narr KL , Bilder RM , Kim S , Thompson PM , Szeszko P , Robinson D , Luders E , Toga AW ((2004) ) Abnormal gyral complexity in first-episode schizophrenia, Biol Psychiatry 55: , 859–867. |
[18] | Ruiz de Miras J , Costumero V , Belloch V , Escudero J , Avila C , Sepulcre J ((2017) ) Complexity analysis of cortical surface detects changes in future Alzheimer’s disease converters, Hum Brain Mapp 38: , 5905–5918. |
[19] | Sheelakumari R , Venkateswaran R , Chandran A , Varghese T , Zhang L , Yue GH , Mathuranath PS , Kesavadas C ((2018) ) Quantitative analysis of grey matter degeneration in FTD patients using fractal dimension analysis, Brain Imaging Behav 12: , 1221–1228. |
[20] | King RD , Brown B , Hwang M , Jeon T , George AT , Alzheimer’s Disease Neuroimaging I ((2010) ) Fractal dimension analysis of the cortical ribbon in mild Alzheimer’s disease, Neuroimage 53: , 471–479. |
[21] | Wang L , Goldstein FC , Veledar E , Levey AI , Lah JJ , Meltzer CC , Holder CA , Mao H ((2009) ) Alterations in cortical thickness and white matter integrity in mild cognitive impairment measured by whole-brain cortical thickness mapping and diffusion tensor imaging, AJNR Am J Neuroradiol 30: , 893–899. |
[22] | Seeley WW ((2010) ) Anterior insula degeneration in frontotemporal dementia, Brain Struct Funct 214: , 465–475. |
[23] | Bevan-Jones WR , Surendranathan A , Passamonti L , Vazquez Rodriguez P , Arnold R , Mak E , Su L , Coles JP , Fryer TD , Hong YT , Williams G , Aigbirhio F , Rowe JB , O’Brien JT ((2017) ) Neuroimaging of Inflammation in Memory and Related Other Disorders (NIMROD) study protocol: A deep phenotyping cohort study of the role of brain inflammation in dementia, depression and other neurological illnesses, BMJ Open 7: , e013187. |
[24] | McKhann GM , Knopman DS , Chertkow H , Hyman BT , Jack CR Jr. , Kawas CH , Klunk WE , Koroshetz WJ , Manly JJ , Mayeux R , Mohs RC , Morris JC , Rossor MN , Scheltens P , Carrillo MC , Thies B , Weintraub S , Phelps CH ((2011) ) The diagnosis of dementia due to Alzheimer’s disease: Recommendations from the National Institute on Aging-Alzheimer’s Association workgroups on diagnostic guidelines for Alzheimer’s disease, Alzheimers Dement 7: , 263–269. |
[25] | Mioshi E , Dawson K , Mitchell J , Arnold R , Hodges JR ((2006) ) The Addenbrooke’s Cognitive Examination Revised (ACE-R): A brief cognitive test battery for dementia screening, Int J Geriatr Psychiatry 21: , 1078–1085. |
[26] | Dahnke R , Yotter RA , Gaser C ((2013) ) Cortical thickness and central surface estimation, Neuroimage 65: , 336–348. |
[27] | Mandelli ML , Vitali P , Santos M , Henry M , Gola K , Rosenberg L , Dronkers N , Miller B , Seeley WW , Gorno-Tempini ML ((2016) ) Two insular regions are differentially involved in behavioral variant FTD and nonfluent/agrammatic variant PPA, Cortex 74: , 149–157. |
[28] | Frey S , Petrides M ((2000) ) Orbitofrontal cortex: A key prefrontal region for encoding information, Proc Natl Acad Sci U S A 97: , 8723–8727. |
[29] | Duarte A , Henson RN , Knight RT , Emery T , Graham KS ((2010) ) Orbito-frontal cortex is necessary for temporal context memory, J Cogn Neurosci 22: , 1819–1831. |


