
Homocysteic Acid in Blood Can Detect Mild Cognitive Impairment: A Preliminary Study
Abstract
Background:
In the treatment of Alzheimer’s disease (AD), it is thought to be most effective to intervene at the earliest and mildest stages. For diagnosis at the earliest and mildest stages, it is desirable to use a biomarker that can be detected by a minimally invasive, cost-effective technique. Recent research indicates the potential clinical usefulness of plasma amyloid-β (Aβ) biomarkers in predicting brain Aβ burden at an individual level. However, it is as yet unproven that accumulation of Aβ necessarily leads to the development of AD.
Objective:
Homocysteic acid (HCA) is useful as an early diagnostic marker for mild cognitive impairment (MCI), a pre-stage of AD.
Methods:
We measured the concentration of HCA, tumor necrosis factor alpha, cortisol, tau, and phosphorylated tau (p-tau) in patients’ plasma of 22 AD, 23 MCI, and 9 negative control (NC) cases.
Results:
Plasma HCA was shown to be very high in areas under the receiver operating characteristic curves (AUC), distinguished between MCI and NC; when 0.116μM was chosen as the analyte concentration cut-off, the sensitivity was 95.7% and the specificity was 70%.
Conclusion:
Our results suggest that plasma HCA may be a useful indicator as an early diagnostic marker for MCI. HCA seems to be upstream from neurodegeneration in the AD pathology because it is known that an overactive NMDA receptor promotes amyloid polymerization and tau phosphorylation in AD.
INTRODUCTION
In the treatment of Alzheimer’s disease (AD), it is important to begin care in the earliest and mildest stages. Thus, there is a trial that initiates care in the preclinical phase of AD, in order to prevent development of this disease [1]. However, it is not well known what causes amyloid pathology, or what connects tau pathology with amyloid pathology. In recent research, it has been shown that the NMDA receptor interacts with amyloid-β (Aβ), and probably plays a role in Aβ production and Aβ oligomerization. It has also been shown that the activation of extrasynaptic NMDA (eNMDA) receptors induces tau overexpression, with simultaneous neuronal degeneration and decreased neuronal survival. Additionally, Jinping et al. (2019) suggest that the drugs targeting NMDA receptor function, or downstream signaling cascades, can restore the network and may be effective in treating AD [2]. However, the detailed causative mechanism of NMDA receptor overactivity is unknown. Therefore, we searched for a biomarker in blood that could trigger NMDA receptor overactivity and, thus, could detect AD at an earlier stage.
We focused on homocysteic acid (HCA) that is produced by oxidative stress. HCA is produced from homocysteine by oxidation. It is also produced from methionine by superoxide oxidation. Therefore, HCA is derived not only from elevated homocysteine but also from direct synthetic pathway. Homocysteine is an analog of glutamic acid that activates the NMDA receptor. HCA exhibits very high brain toxicity at low concentration and overactivates the NMDA receptor [3]. We reported that HCA could induce a memory disorder in 3×Tg-AD mice by showing that anti-HCA antibody ameliorates development of AD pathology and cognitive decline in these mice [4]. Usually, 3×Tg-AD mice have been developed for the familiar AD model, i.e., APP, Presenilin, and the Tau gene were activated in 3×Tg-AD mice, and these mice showed an AD-like memory disorder due to amyloid abnormality. However, we have found that abnormally increased HCA levels induced memory problems in these model mice [4], and a decrease in urinary HCA levels and an increase in blood HCA levels in patients with dementia [5].
Thus, in this study we were attempting to show the relationship between AD and HCA. We clarified the usefulness of HCA measurement in the early diagnosis marker for AD.
MATERIALS AND METHODS
Subjects
The participants of our study were between 60 to 90 years. The data set consisted of 12 participants with AD, 12 with mild cognitive impairment (MCI), and 9 cognitively normal individuals as negative control (NC) (33 in total). Subjects with AD fulfilled the diagnostic criteria of DSM-5 [6] and the presence of AD was confirmed by brain imaging. Subjects with MCI fulfilled the diagnostic criteria proposed by Petersen in 2004 [7]. NC subjects had no organic disease of the central nervous system and a Mini-Mental State Examination (MMSE) score of 28∼30. The study was approved by the research ethics committee of KUDOH Clinic for Neurosurgery and Neurology.
Blood processing and plasma storage
Participants’ blood was collected using 2 mL vacuum blood collection tubes containing heparin for measuring tumor necrosis factor alpha (TNF-α), HCA, phosphorylated tau (p-tau), and cortisol, and those containing EDTA for measuring adrenocorticotropic hormone (ACTH). The blood was centrifuged at approximately 1500 G for 10 min, and the collected plasma was dispensed into the tubes and stored frozen at –20°C immediately.
Plasma biomarker measurements
In the study, we measured TNF-α, cortisol, and ACTH by ELISA, and measured HCA, tau, and p-tau by CLEIA. In measuring TNF-α, we used a TNF-alpha Quantikine HS ELISA KIT (R & D Systems) and measured according to the manufacturer’s instruction. In measuring cortisol, we used a CORTISOL ELISA KIT (Alpha Diagnostic International) and measured according to the manufacturer’s instruction. In measuring ACTH, we used ACTH ELISA (MD Biosciences) and measured according to the manufacturer’s instruction.
To measure HCA, we used the antigen binding on a polystyrene plate we had made and an alkaline phosphatase (ALP) labeled antibody. As the antigen, we used HCA binding bovine serum albumin (BSA), combined with glutaraldehyde, and we fixed this on a polystyrene plate. We also used the antibody that recognized HCA binding protein (Gene Tex) as the ALP labeled antibody. In measuring HCA, 50μL of plasma, 50μL of PBS, and 100μL of labeled antibody solution were mixed and incubated, initially at 37°C. Next, the mixed solution was added to the antigen-binding polystyrene plate and incubated at 37°C. After washing with wash buffer, we added luminescent substrate and measured the decrease in light emission with a plate reader. BSA-bound HCA was used as a standard solution, and light emission was converted to a measured value.
In our preliminary experiment, the coefficient of variation of HCA measurement was within 15%, and the error of the sample concentration was within 20%, when measurement was done immediately after thawing, or done after keeping at 4°C or 25°C for 24 h after thawing. So, HCA in plasma is stable during sample processing, and we expected that it is stable in frozen conditions.
Table 1
The data of measured values
| Sample | MMSE | Age | TNF-α | Cortisol | ACTH | HCA | tau | p-tau |
| pg/mL | μg/dL | pg/mL | μM | pg/mL | pg/mL | |||
| NC1 | 28 | 79 | 1.194 | 26.6 | 79.4 | 0.068 | 15.33 | 5.08 |
| NC2 | 29 | 74 | 0.587 | 29.3 | 36.7 | 0.086 | 9.49 | 4.15 |
| NC3 | 30 | 77 | 0.946 | 22.5 | 37.4 | 0.096 | 11.31 | 3.88 |
| NC4 | 30 | 69 | 0.432 | 34.0 | 88.9 | 0.078 | 9.95 | 4.66 |
| NC5 | 30 | 68 | 0.815 | 9.4 | 28.5 | 0.077 | 11.11 | 4.21 |
| NC6 | 29 | 64 | 0.660 | 33.3 | 4.0 | 0.327 | 8.85 | 2.68 |
| NC7 | 30 | 70 | 0.799 | 17.3 | 37.4 | 0.319 | 11.53 | 3.70 |
| NC8 | 29 | 83 | 0.960 | 19.9 | 48.8 | 0.091 | 22.73 | 9.67 |
| NC9 | 30 | 77 | 0.484 | 49.1 | 8.4 | 0.112 | 7.48 | 2.39 |
| MCI1 | 27 | 69 | 1.152 | 33.5 | 4.0 | 0.366 | 13.95 | 5.07 |
| MCI2 | 25 | 75 | 0.627 | 35.6 | 31.3 | 0.465 | 12.27 | 4.04 |
| MCI3 | 24 | 74 | 3.626 | 27.6 | 33.6 | 0.136 | 13.77 | 5.72 |
| MCI4 | 30 | 84 | 0.969 | 19.7 | 12.4 | 0.121 | 15.53 | 6.03 |
| MCI5 | 25 | 78 | 0.806 | 39.6 | 7.4 | 0.181 | 13.07 | 7.61 |
| MCI6 | 30 | 77 | 0.654 | 27.9 | 49.4 | 0.336 | 14.29 | 8.31 |
| MCI7 | 26 | 71 | 2.113 | 49.4 | 134.5 | 0.344 | 19.59 | 5.87 |
| MCI8 | 30 | 68 | 0.865 | 35.6 | 8.4 | 0.184 | 11.33 | 4.50 |
| MCI9 | 28 | 67 | 0.904 | 16.6 | 7.9 | 0.506 | 10.56 | 5.89 |
| MCI10 | 24 | 83 | 0.907 | 31.6 | 25.6 | 0.200 | 14.82 | 3.80 |
| MCI11 | 26 | 82 | 0.543 | 32.4 | 26.1 | 0.069 | 8.70 | 2.69 |
| MCI12 | 26 | 79 | 0.687 | 9.5 | 20.7 | 0.264 | 8.70 | 4.45 |
| AD1 | 30 | 79 | 0.813 | 18.9 | 30.2 | 0.130 | 10.20 | 5.44 |
| AD2 | 0 | 86 | 6.446 | 80.2 | 70.5 | 0.539 | 37.44 | 12.84 |
| AD3 | 15 | 88 | 1.017 | 16.6 | 5.4 | 0.348 | 18.00 | 5.93 |
| AD4 | 14 | 76 | 1.356 | 33.2 | 46.1 | 0.060 | 20.65 | 13.64 |
| AD5 | 12 | 77 | 0.916 | 39.9 | 20.4 | 0.116 | 20.13 | 13.65 |
| AD6 | 13 | 83 | 0.527 | 27.7 | 41.3 | 0.168 | 18.28 | 11.43 |
| AD7 | 24 | 81 | 0.609 | 22.1 | 11.3 | 0.825 | 18.64 | 7.55 |
| AD8 | 15 | 83 | 0.622 | 24.6 | 44.0 | 0.085 | 21.57 | 12.31 |
| AD9 | 17 | 76 | 1.418 | 52.0 | 62.3 | 0.366 | 17.55 | 8.74 |
| AD10 | 17 | 77 | 1.382 | 30.4 | 16.2 | 0.463 | 27.69 | 12.14 |
| AD11 | 12 | 76 | 0.682 | 18.6 | 65.8 | 1.072 | 11.80 | 5.90 |
| AD12 | 6 | 79 | 0.992 | 13.1 | 68.4 | 0.715 | 21.65 | 7.18 |
Mini-Mental State Examination (MMSE) scores, age, and measured values of each biomarker are shown for each sample in 9 negative control (NC), 12 mild cognitive impairment (MCI), and 12 Alzheimer disease (AD) cases. TNF-α, tumor necrosis factor alpha; ACTH, adrenocorticotropic hormone; HCA, homocysteic acid.
To measure tau and p-tau, we used the antibody binding magnetic beads we had made and an ALP labeled antibody. In measuring tau, we used the antibody, recognizing aa16–24 of tau441 as the antibody binding magnetic beads, and used the antibody recognizing aa218–225 of tau441 as the ALP labeled antibody. In measuring p-tau, we used the antibody recognizing pT181 of p-tau as the antibody binding magnetic beads, and we used the antibody recognizing aa16–24 of tau441 as the ALP labeled antibody. At first, 12.5μL of plasma, 37.5μL of PBS, 50μL of magnetic beads solution and 50μL of labeled antibody solution were mixed and incubated at 37°C. After bound/free separation, and washing with wash buffer, we added luminescent substrate and measured the increase in light emission. In converting the light emission of tau to tau, we used recombinant tau as a standard solution. In converting the light emission of p-tau, we used antigen peptide as a standard solution.
Statistical analyses
Statistical analyses were performed using Origin Pro9.1 (OriginLab). For numerical data, group differences were analyzed by Student’s t-test or Welch’s t-test. The biomarker performance was assessed using Receiver Operating Characteristic (ROC) analyses. The area under curve (AUC), and the representative best values for the sensitivity, specificity and accuracy at an optimal cut-off point, were used for the evaluation of diagnostic markers. All the tests were two-tailed, and the significance level of difference was set at p-value <0.05.
RESULTS
The results of measuring the participant plasma
The results of measuring the participant plasma are shown in Table 1. At first, we confirmed the correlation coefficients between the measured values and MMSE to evaluate the link between the plasma marker and cognitive decline. The measured values of tau and p-tau had a strong relationship with MMSE. This result indicated that an increase in plasma tau and p-tau measured values has a link to cognitive decline. But other markers did not have a strong relationship with MMSE.
Fig.1
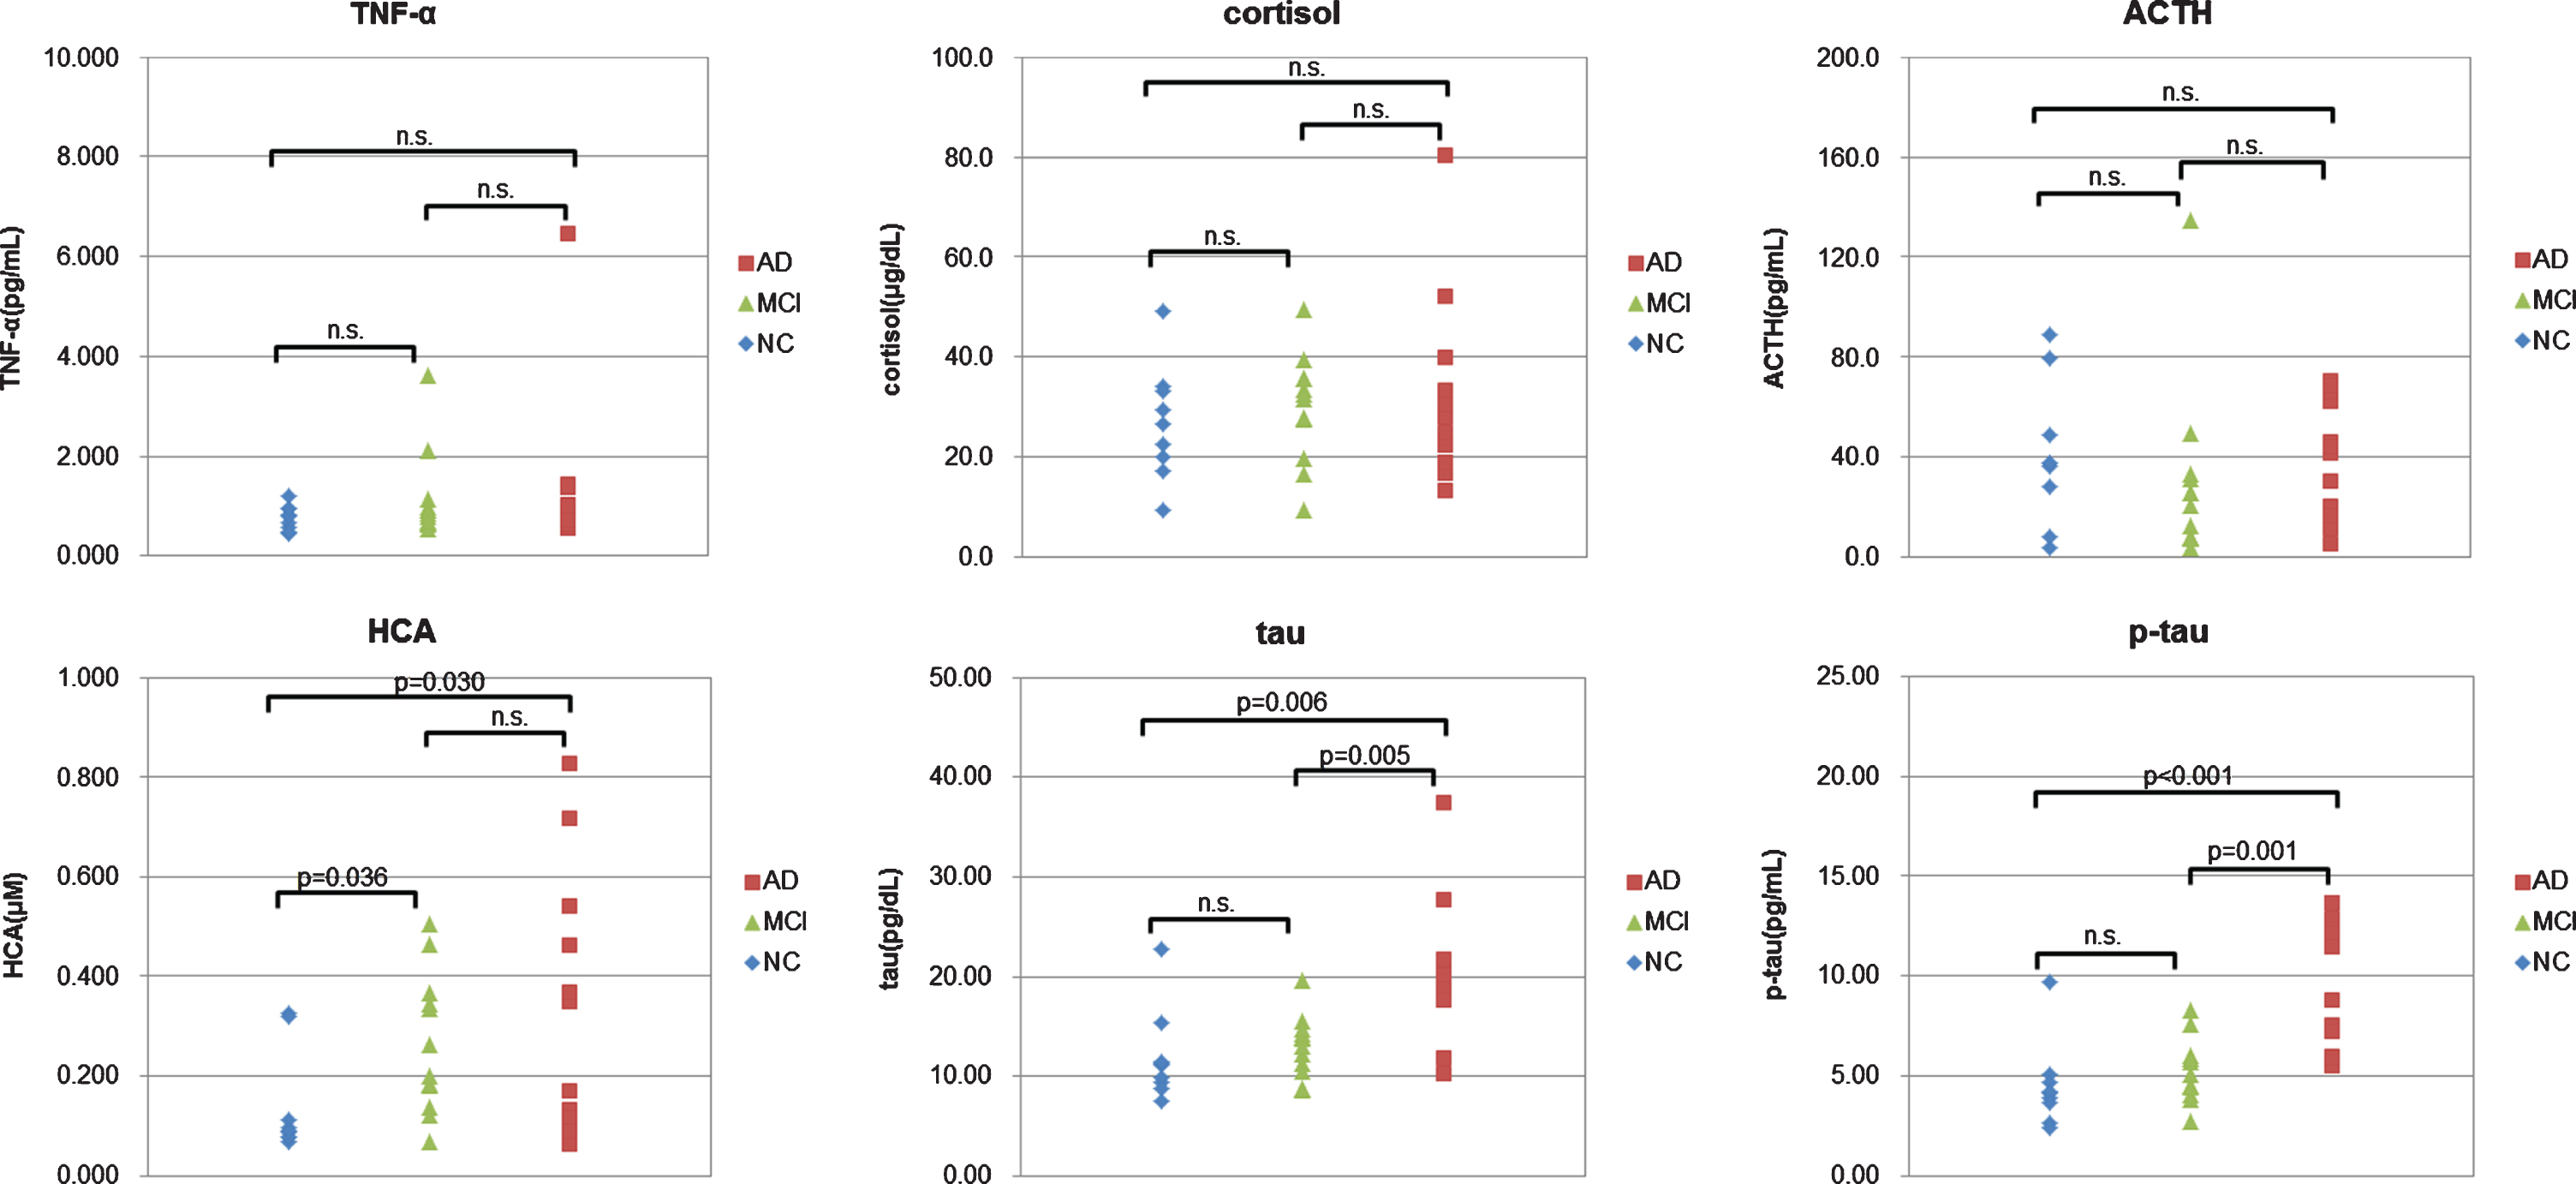
Comparison between measured values and diagnosis. For each biomarker, the measured value was plotted against the diagnosis. NC (negative control, blue); MCI (mild cognitive impairment, green); AD (Alzheimer disease, red). The p-values between each diagnosis are calculated by T test. When the p-values are larger than 0.05, they are shown as n.s.
Comparing measured values with diagnosis
Next, we compared measured values with diagnosis. When we confirmed which items had a significant difference between NC and MCI by T test, we were able to confirm that the item of HCA had a significant difference. When we confirmed which items had a significant difference between MCI and AD by T test, we were able to confirm that the items of tau and p-tau had a significant difference (Fig. 1). This result indicated that the measured values of plasma HCA increase greatly in the MCI stage, and the measured values of plasma tau and p-tau increase greatly in the AD stage.
Receiver operating characteristic analysis
Fig.2
ROC analysis to the measured values (NC versus MCI). For each biomarker, the results of the ROC analysis between NC and MCI are plotted. As shown, HCA is the best to distinguish the two.
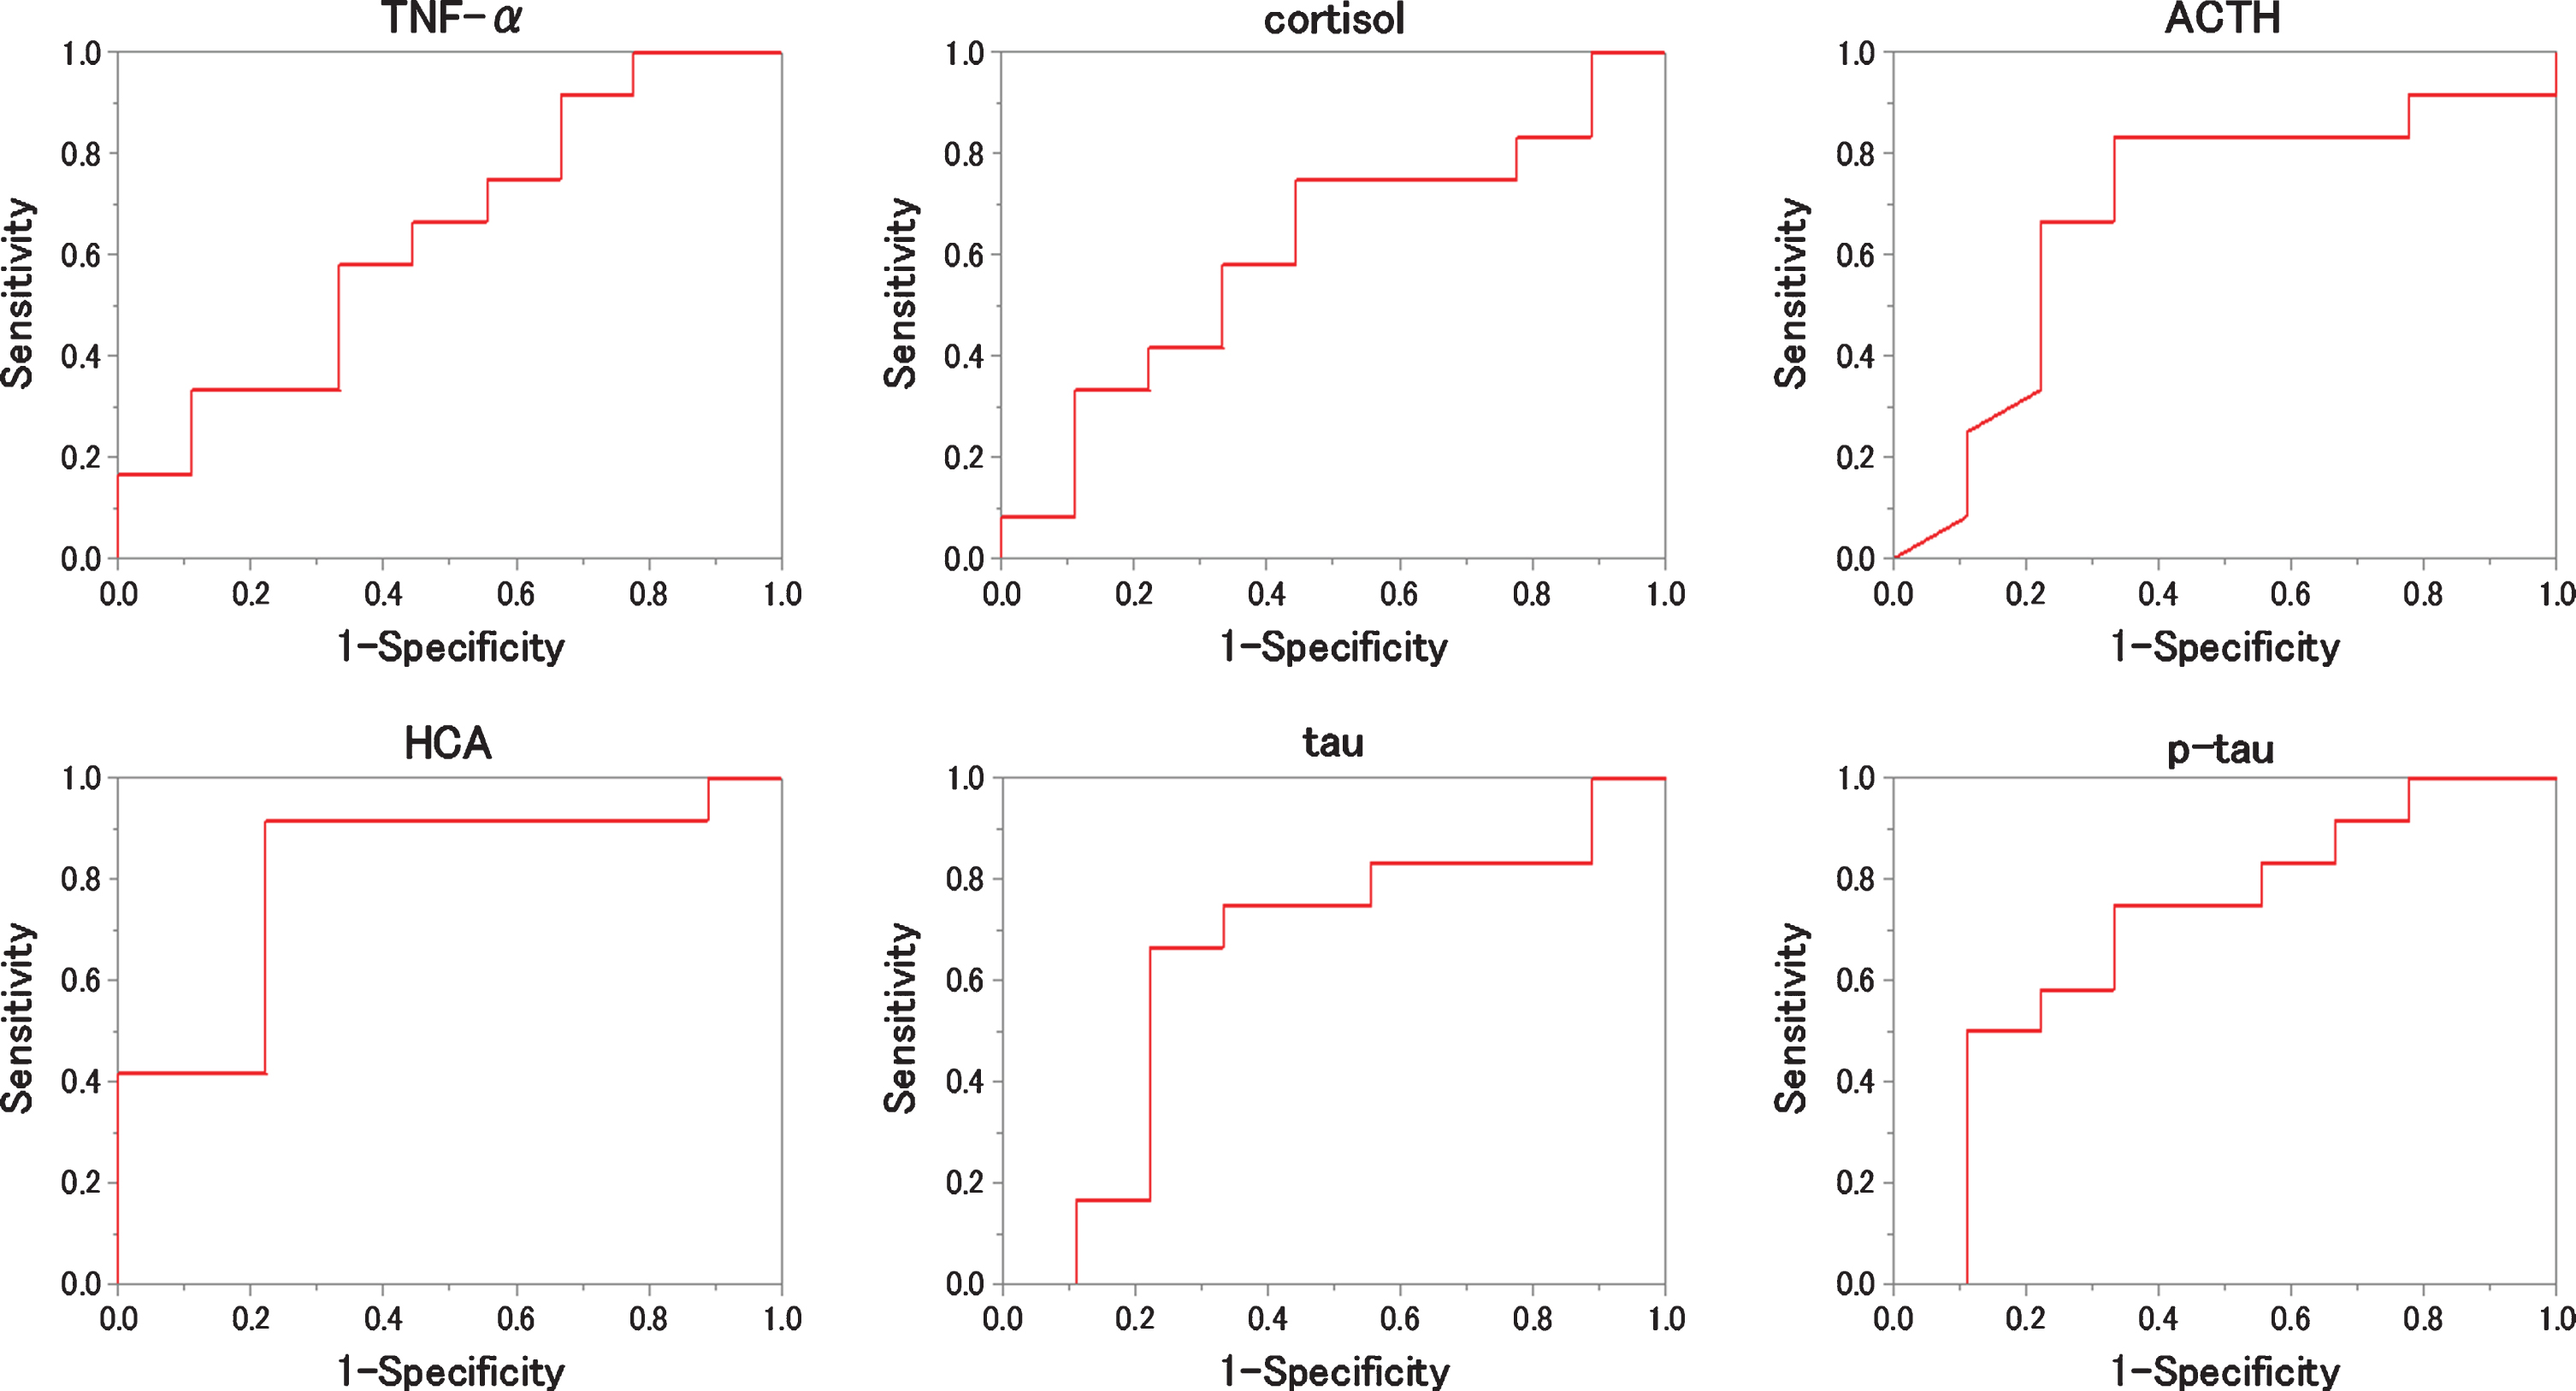
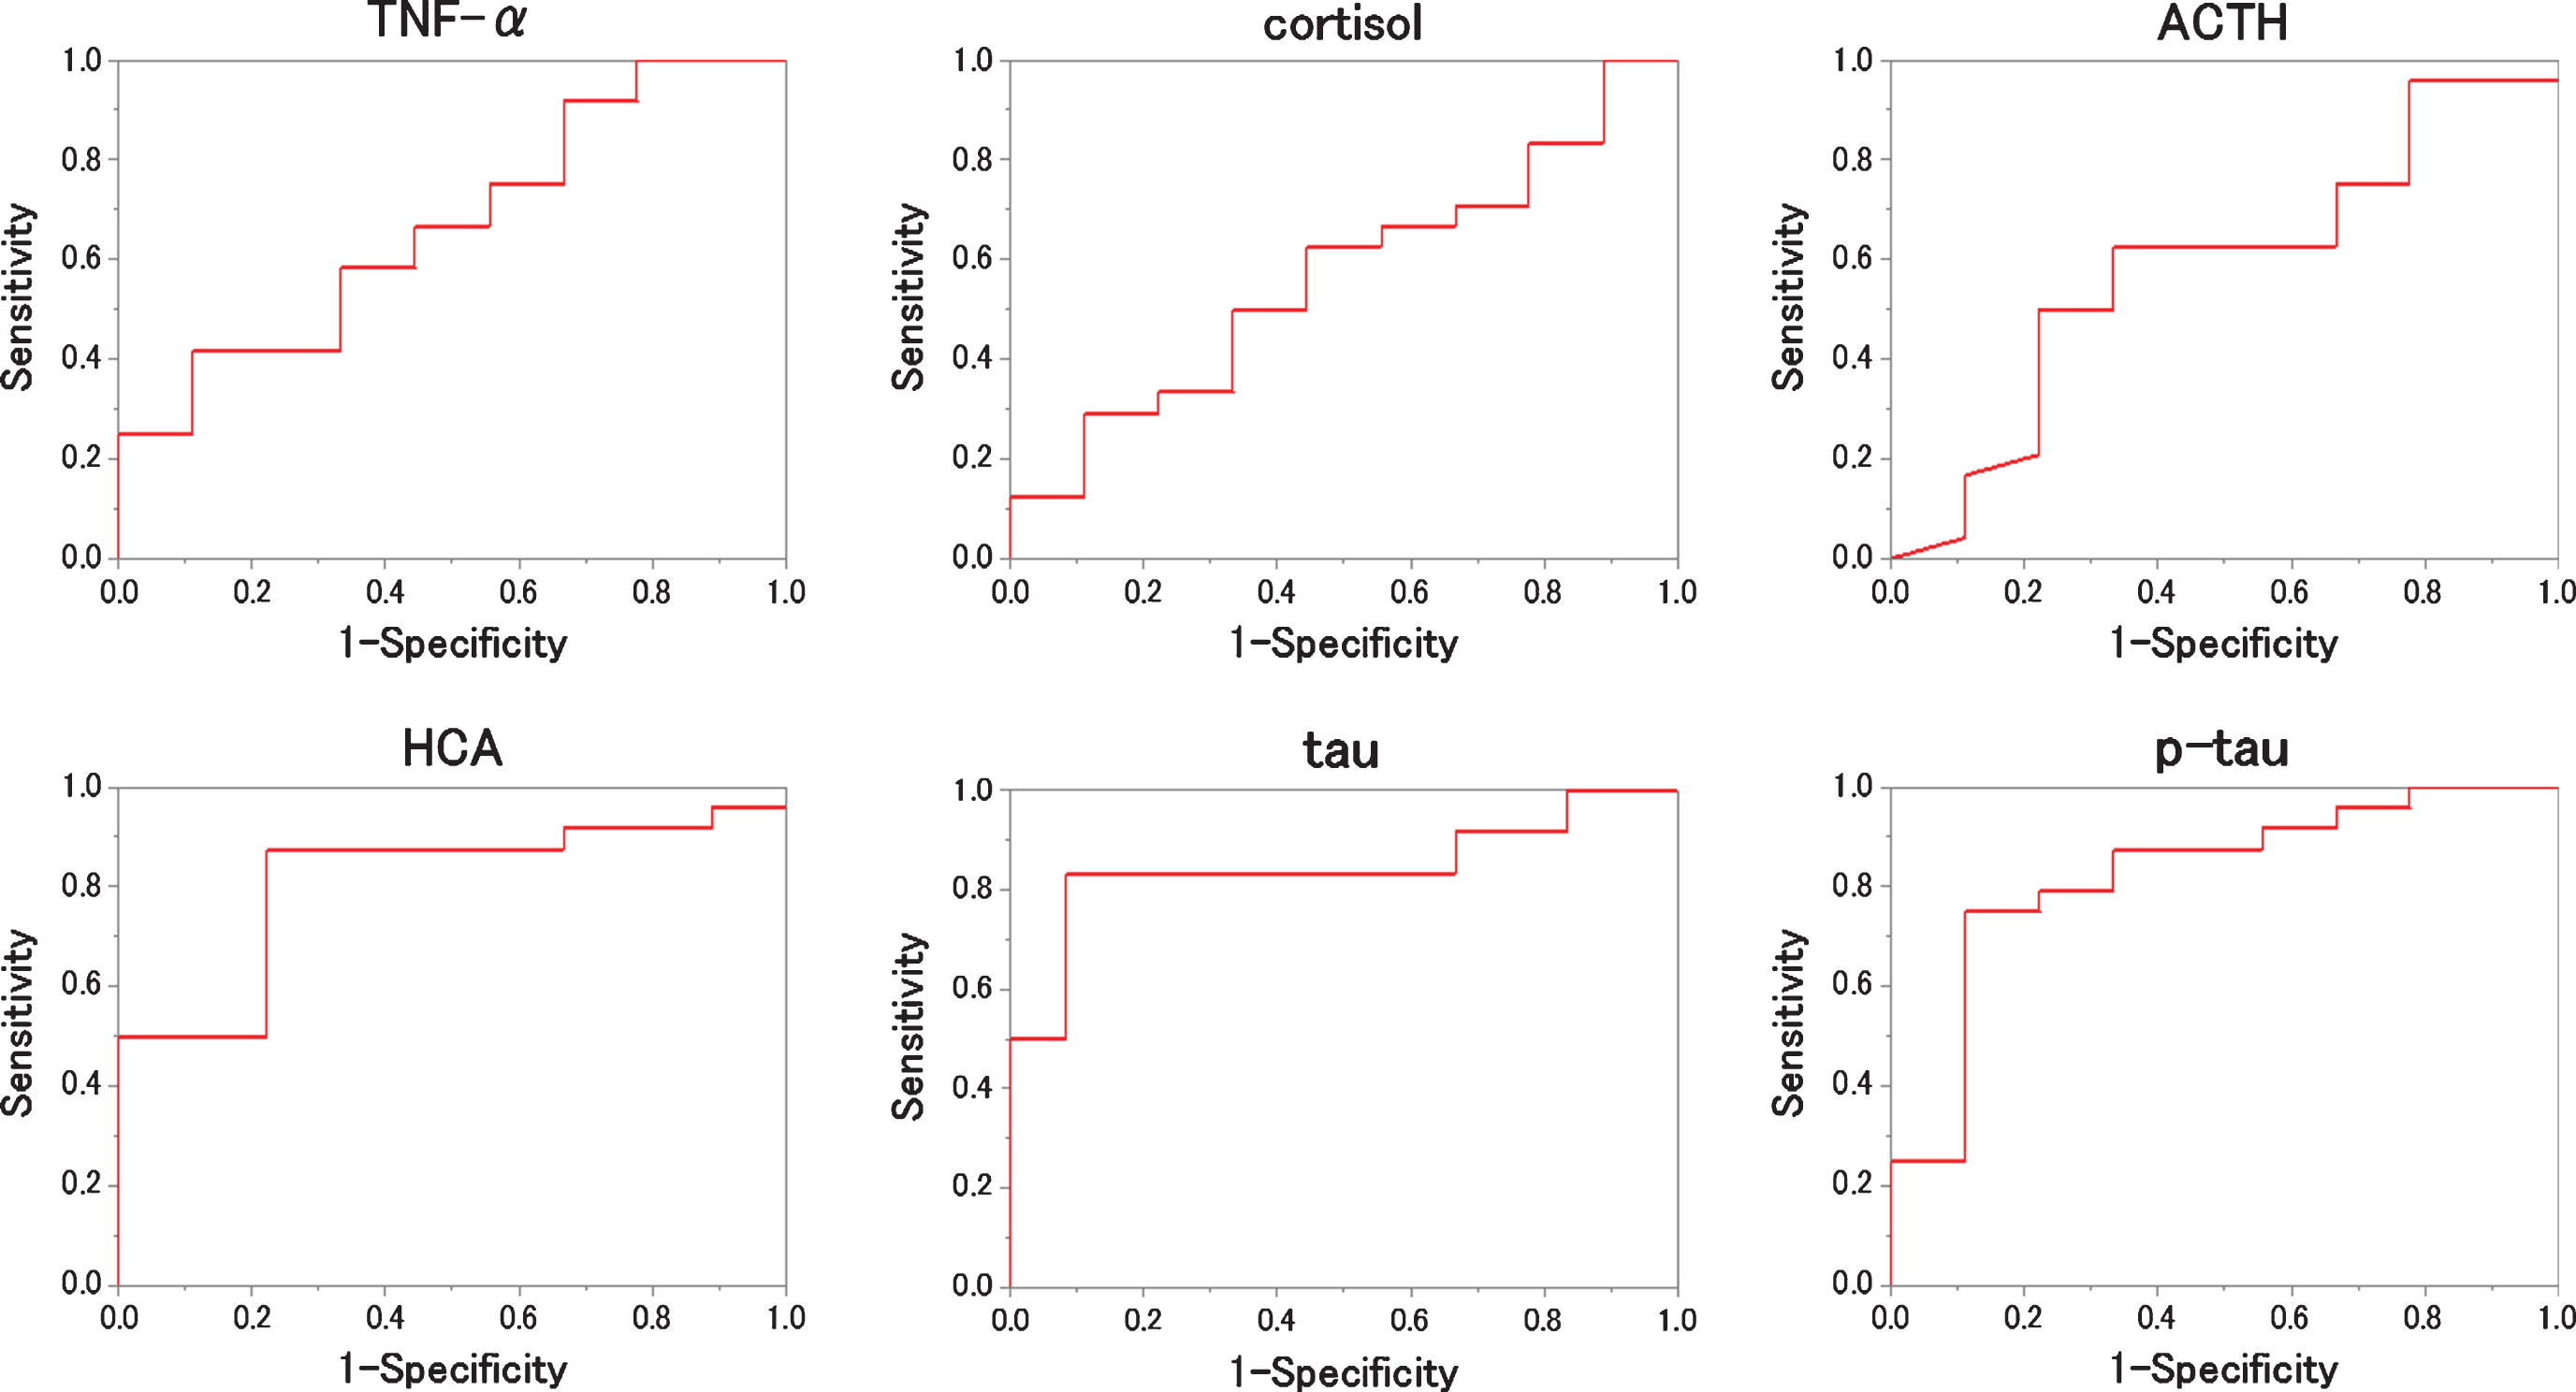
We evaluated which items were useful as diagnostic markers for MCI and AD byROC analysis. In ROC analyses, for distinguishing diagnostic markers between NC and MCI, the ROC curve of HCA showed a very high AUC (Fig. 2). That AUC was 0.815±0.103 (p = 0.016). Also, that sensitivity was 91.7% and that specificity was 77.8 % when 0.116μM of HCA was chosen as the cut-off (Table 2). In ROC analyses, for distinguishing diagnostic markers between NC and AD, the ROC curve of HCA, tau, and p-tau showed a very high AUC (Fig. 3). Those AUCs were 0.806±0.111 (p = 0.019), 0.861±0.088 (p = 0.006), and 0.944±0.051 (p = 0.001). When 0.116μM of HCA, 17.00 pg/mL of tau, and 5.30 pg/mL of p-tau are chosen as the cut-off, those sensitivity were 83.3%, 83.3%, and 100.0%, and those specificity were 77.8%, 88.9%, and 88.9% (Table 3). In ROC analyses, for distinguishing diagnostic markers between NC and MCI + AD, the ROC curve of HCA, tau, and p-tau showed a very high AUC (Fig. 4). Those AUCs were 0.810±0.099 (p = 0.007), 0.755±0.098 (p = 0.026), and 0.824±0.084 (p = 0.005). When 0.116μM of HCA, 12.00 pg/mL of tau, and 5.10 pg/mL of p-tau were chosen as the cut-off, those sensitivity were 87.5%, 79.1%, and 75.0%, and those specificity were 77.8%, 77.8%, and 77.8% (Table 4). In ROC analyses, for distinguishing diagnostic markers between MCI and AD, the ROC curve of tau and p-tau showed a very high AUC (Fig. 5). Those AUCs were 0.847±0.088 (p = 0.004) and 0.889±0.065 (p = 0.001). When 17.0 pg/mL of tau and 5.9 pg/mL of p-tau were chosen as the cut-off, the sensitivity is 83.3%, 91.7% and the specificity is 91.7%, 75.0%, respectively (Table 5). In our results, the item of HCA was the most useful as a diagnostic marker for MCI and the items of tau and p-tau were the most useful as a diagnostic marker for AD.
DISCUSSION
Our results suggested that plasma HCA levels are useful as early diagnostic markers of AD; this is because measured values of HCA increase in the stage of MCI, and are thus useful as a diagnostic marker for MCI. On the other hand, our results suggested that plasma tau and p-tau are useful diagnostic markers for confirming disease progression, because their measured values are linked to the transition to AD and, thus, they are useful as diagnostic markers for AD.
Table 2
The result of ROC analysis distinguishes between NC and MCI for each item
| AUC | SE | p | Cut off | Specificity | Sensitivity | |
| TNF-α | 0.639 | 0.123 | 0.286 | 0.800 pg/mL | 55.6% | 66.7% |
| cortisol | 0.611 | 0.129 | 0.394 | 27.0μg/dL | 55.6% | 75.0% |
| ACTH | 0.685 | 0.126 | 0.156 | 35.0 pg/mL | 66.7% | 83.3% |
| HCA | 0.815 | 0.103 | 0.016 | 0.116μM | 77.8% | 91.7% |
| tau | 0.648 | 0.129 | 0.256 | 11.32 pg/mL | 66.7% | 75.0% |
| p-tau | 0.704 | 0.118 | 0.118 | 4.30 pg/mL | 66.7% | 75.0% |
The area under the curve (AUC) of the Receiver Operating Characteristic (ROC) curve and the optimal cutoff when writing the ROC curve that distinguish between NC and MCI, and the sensitivity and specificity at that time are shown.
Fig.3
ROC analysis to the measured values (NC versus AD). For each biomarker, the results of the ROC analysis between NC and AD are plotted. As shown, HCA, tau and phosphorylated tau (p-tau) are better to distinguish the two.
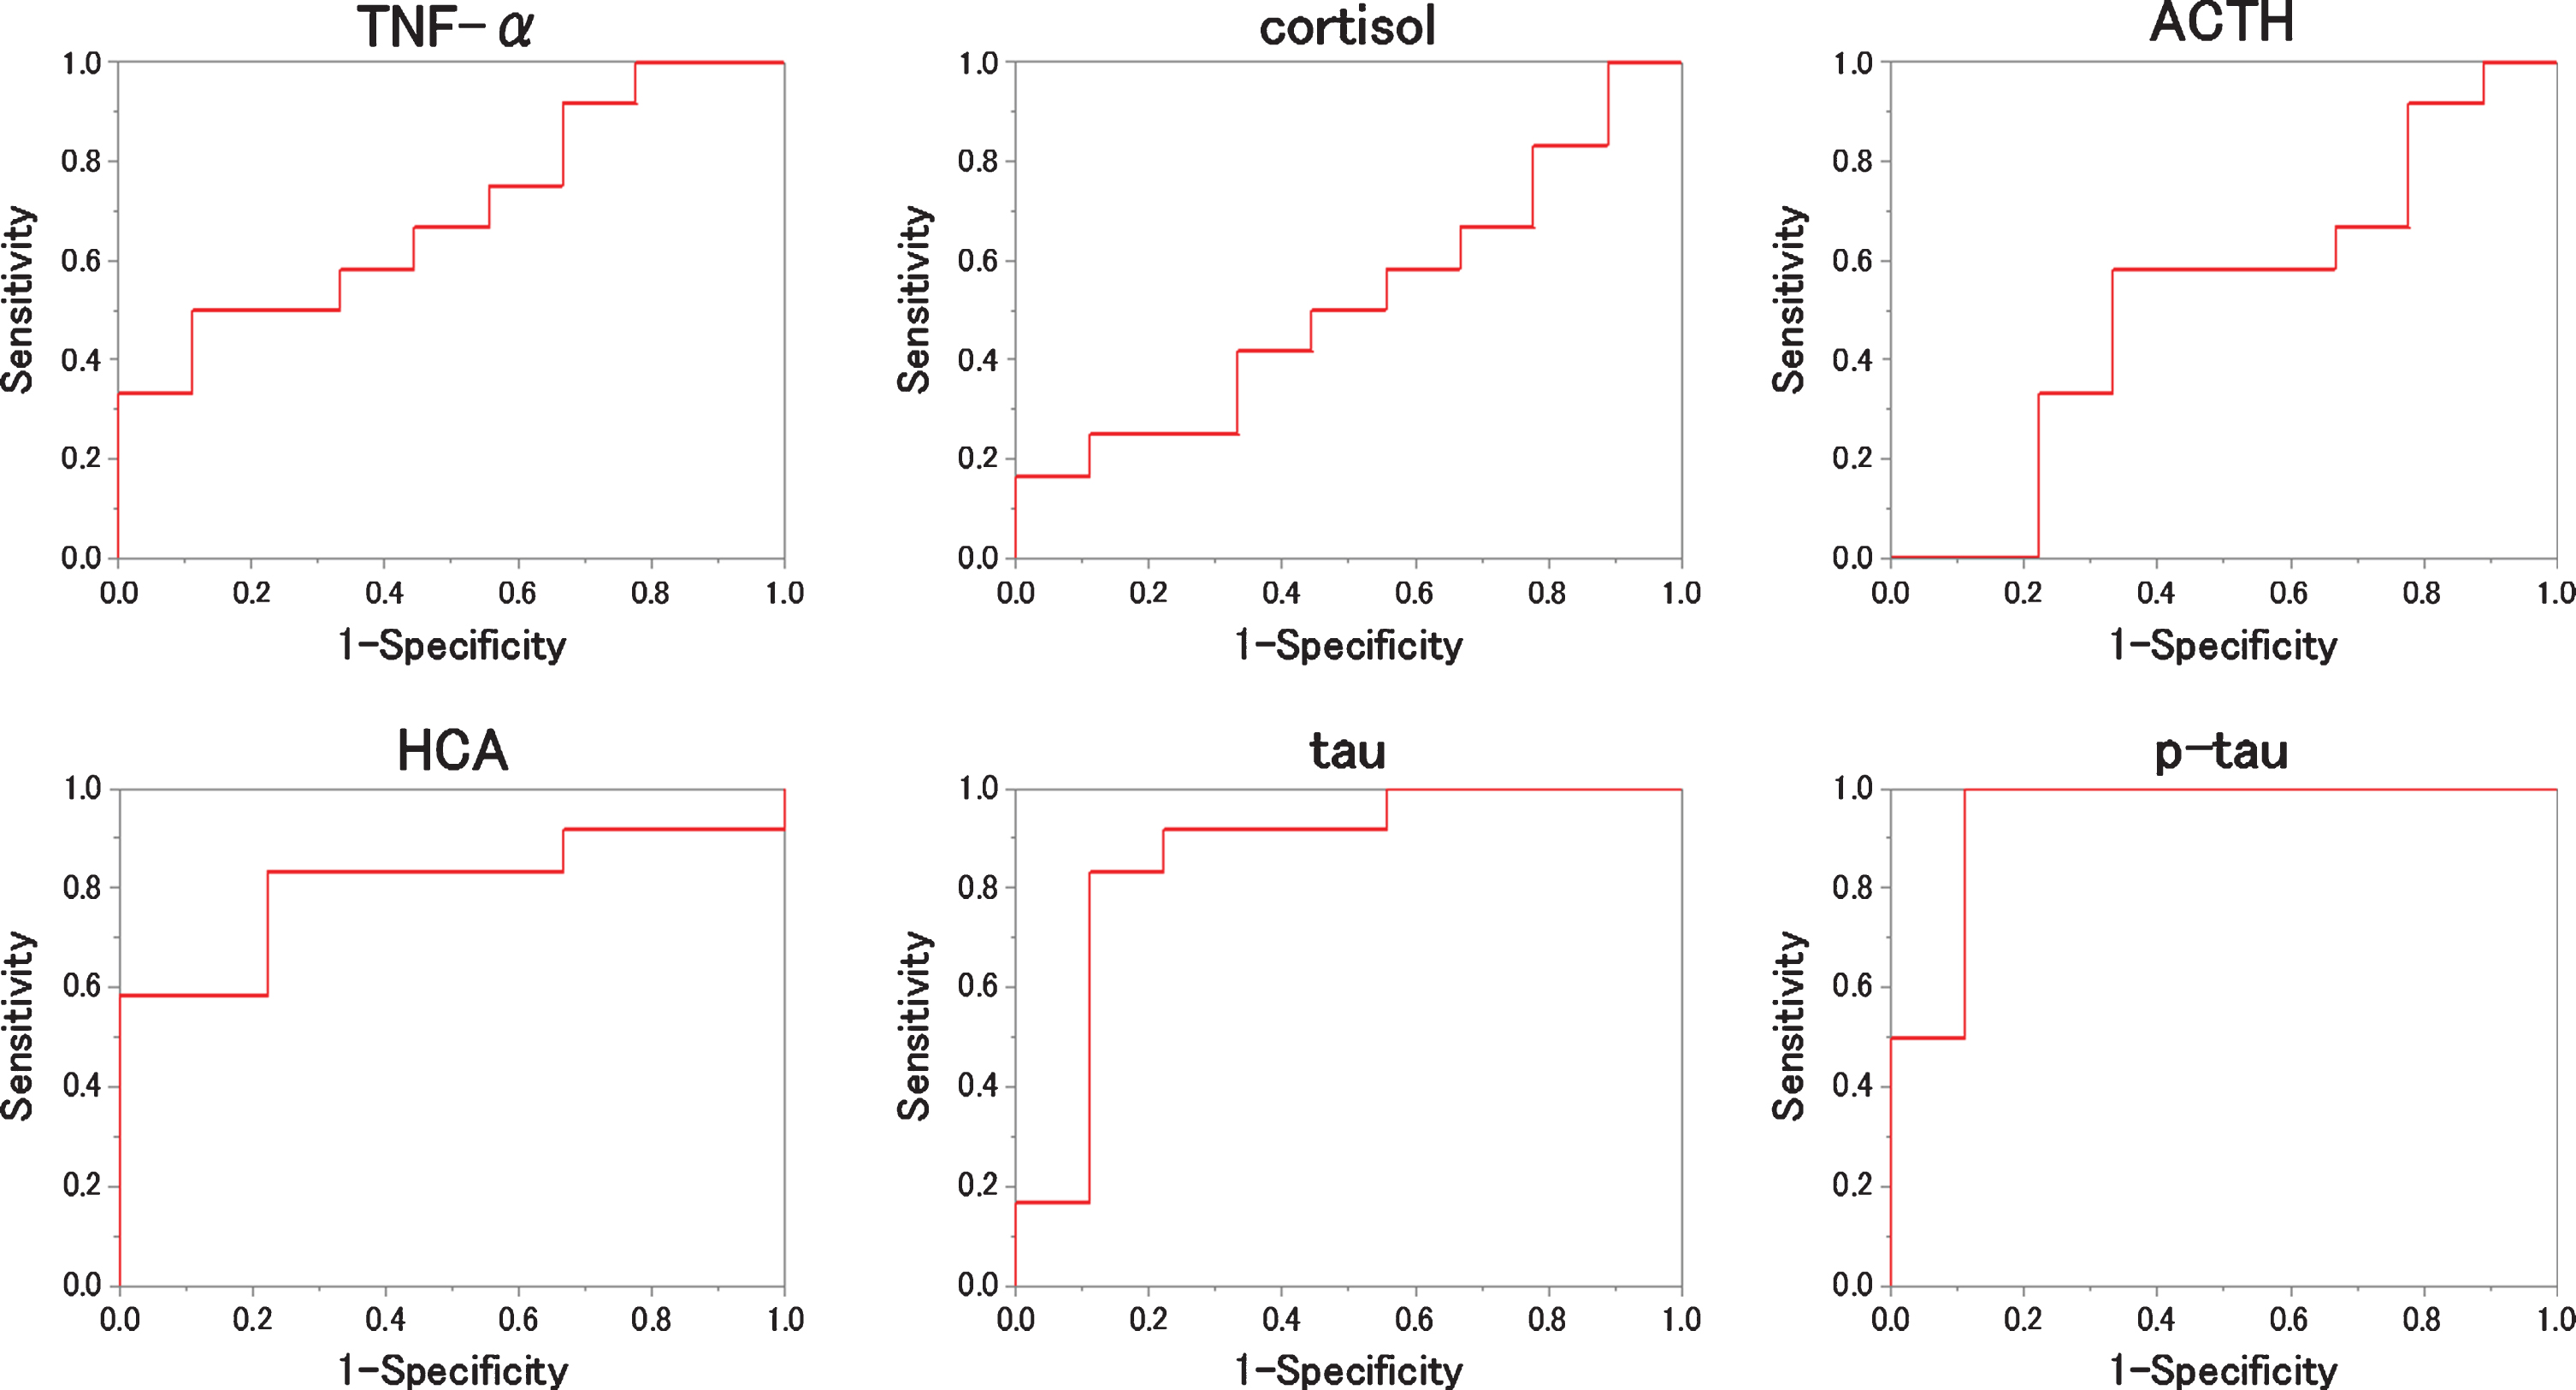
Table 3
The result of ROC analysis distinguishes between NC and AD for each item
| AUC | SE | p | Cut off | Specificity | Sensitivity | |
| TNF-α | 0.694 | 0.120 | 0.136 | 0.810 pg/mL | 55.6% | 66.7% |
| cortisol | 0.519 | 0.133 | 0.887 | 27.0μg/dL | 55.6% | 50.0% |
| ACTH | 0.519 | 0.132 | 0.887 | 38.0 pg/mL | 66.7% | 58.3% |
| HCA | 0.806 | 0.111 | 0.019 | 0.116μM | 77.8% | 83.3% |
| tau | 0.861 | 0.088 | 0.006 | 17.00 pg/mL | 88.9% | 83.3% |
| p-tau | 0.944 | 0.051 | 0.001 | 5.30 pg/mL | 88.9% | 100.0% |
The AUC and the optimal cutoff when writing the ROC curve that distinguish between NC and AD are shown with the sensitivity and specificity at that time.
Fig.4
ROC analysis to the measured values (NC versus MCI+AD). For each biomarker, the results of the ROC analysis between NC and MCI + AD are plotted. As shown, HCA, tau and p-tau are better to distinguish the two.
The recent research reported that the objective subtle-cognitive decline could be observed before amyloid accumulation [8] and that adult hippocampal neurogenesis was inhibited before earlier stage of amyloid and tau accumulation [9]. Our previous findings [4] indicate that HCA levels in brain increased at 4 months before amyloid plaque accumulation and these mice showed the cognitive decline. So, it is possible that HCA can be detected earlier than MCI.
In this research, we did not prove that HCA can detect MCI to AD pathological changes. But HCA is a strong agonist of the eNMDA receptor, whose toxicity can be increased by Aβ and produces tau and p-tau pathology. Therefore, it is expected that HCA may be useful in detecting changes from MCI to AD in future.
However, there remains the question of HCA as a biomarker. Why is a glutamate not a good biomarker for MCI? A possible reason is that HCA is a stronger agonist than glutamate for an eNMDA receptor. For example, neuronal death in vitro can be induced by 1μM of HCA, but glutamate can induce neuronal degeneration only with over 100μM of it [10].
Homocysteine, an HCA analog was reported as a risk factor for AD, but was not reported as a useful biomarker for detecting MCI [11]. We consider that the toxicity of homocysteine to the NMDA receptor is lower than HCA [12]. Additionally, a clinical trial of homocysteine-reducing vitamins was not successful in AD patients [13]. However, antibodies to HCA could recover the 3×Tg-AD mice cognitive problem [4]. In addition, a preliminary open label study demonstrated that ferulic acid, a presumed competitive inhibitor of HCA to the NMDA receptor and hydrogen gas, a presumed reducer of HCA to homocysteine improved cognitive functions in AD patients [14]. We therefore believe that HCA is more important than homocysteine.
It is thought that measuring HCA is useful for detecting MCI. According to our results, plasma HCA levels rise earlier than plasma tau and p-tau levels, such as Aβ. Since HCA has the ability to overactivate the NMDA receptor, and recent research has indicated that the NMDA receptor interacts with Aβ, and probably plays a role in Aβ production and Aβ oligomerization, the following model can be proposed. In this model, methionine and homocysteine, oxidized by stress, become HCA; the brain NMDA receptor becomes overactive as the concentration of HCA increases in the blood; amyloid polymerization and tau phosphorylation are promoted by the overaction of the brain NMDA receptor; and, finally, there is progression of the transition to AD by amyloid polymerization and tau phosphorylation. If HCA has this role, HCA is the causal substance of AD, and HCA exists upstream from neurodegeneration in the AD pathogenesis. HCA may be useful for early detection of AD and as a therapeutic target.
Table 4
The result of ROC analysis distinguishes between NC and MCI + AD for each item
| AUC | SE | p | Cut off | Specificity | Sensitivity | |
| TNF-α | 0.667 | 0.108 | 0.146 | 0.805 pg/mL | 55.6% | 66.7% |
| cortisol | 0.565 | 0.118 | 0.571 | 27.5μg/dL | 55.6% | 62.5% |
| ACTH | 0.583 | 0.114 | 0.467 | 35.0 pg/mL | 62.5% | 66.7% |
| HCA | 0.810 | 0.099 | 0.007 | 0.116μM | 77.8% | 87.5% |
| tau | 0.755 | 0.098 | 0.026 | 12.00 pg/mL | 77.8% | 79.1% |
| p-tau | 0.824 | 0.084 | 0.005 | 5.10 pg/mL | 77.8% | 75.0% |
The AUC and the optimal cutoff when writing the ROC curve that distinguish between NC and MCI + AD are shown with the sensitivity and specificity at that time.
Fig.5
ROC analysis to the measured values (MCI versus AD). For each biomarker, the results of the ROC analysis between MCI and AD are plotted. As shown, tau and phosphorylated tau (p-tau) are the best to distinguish the two.
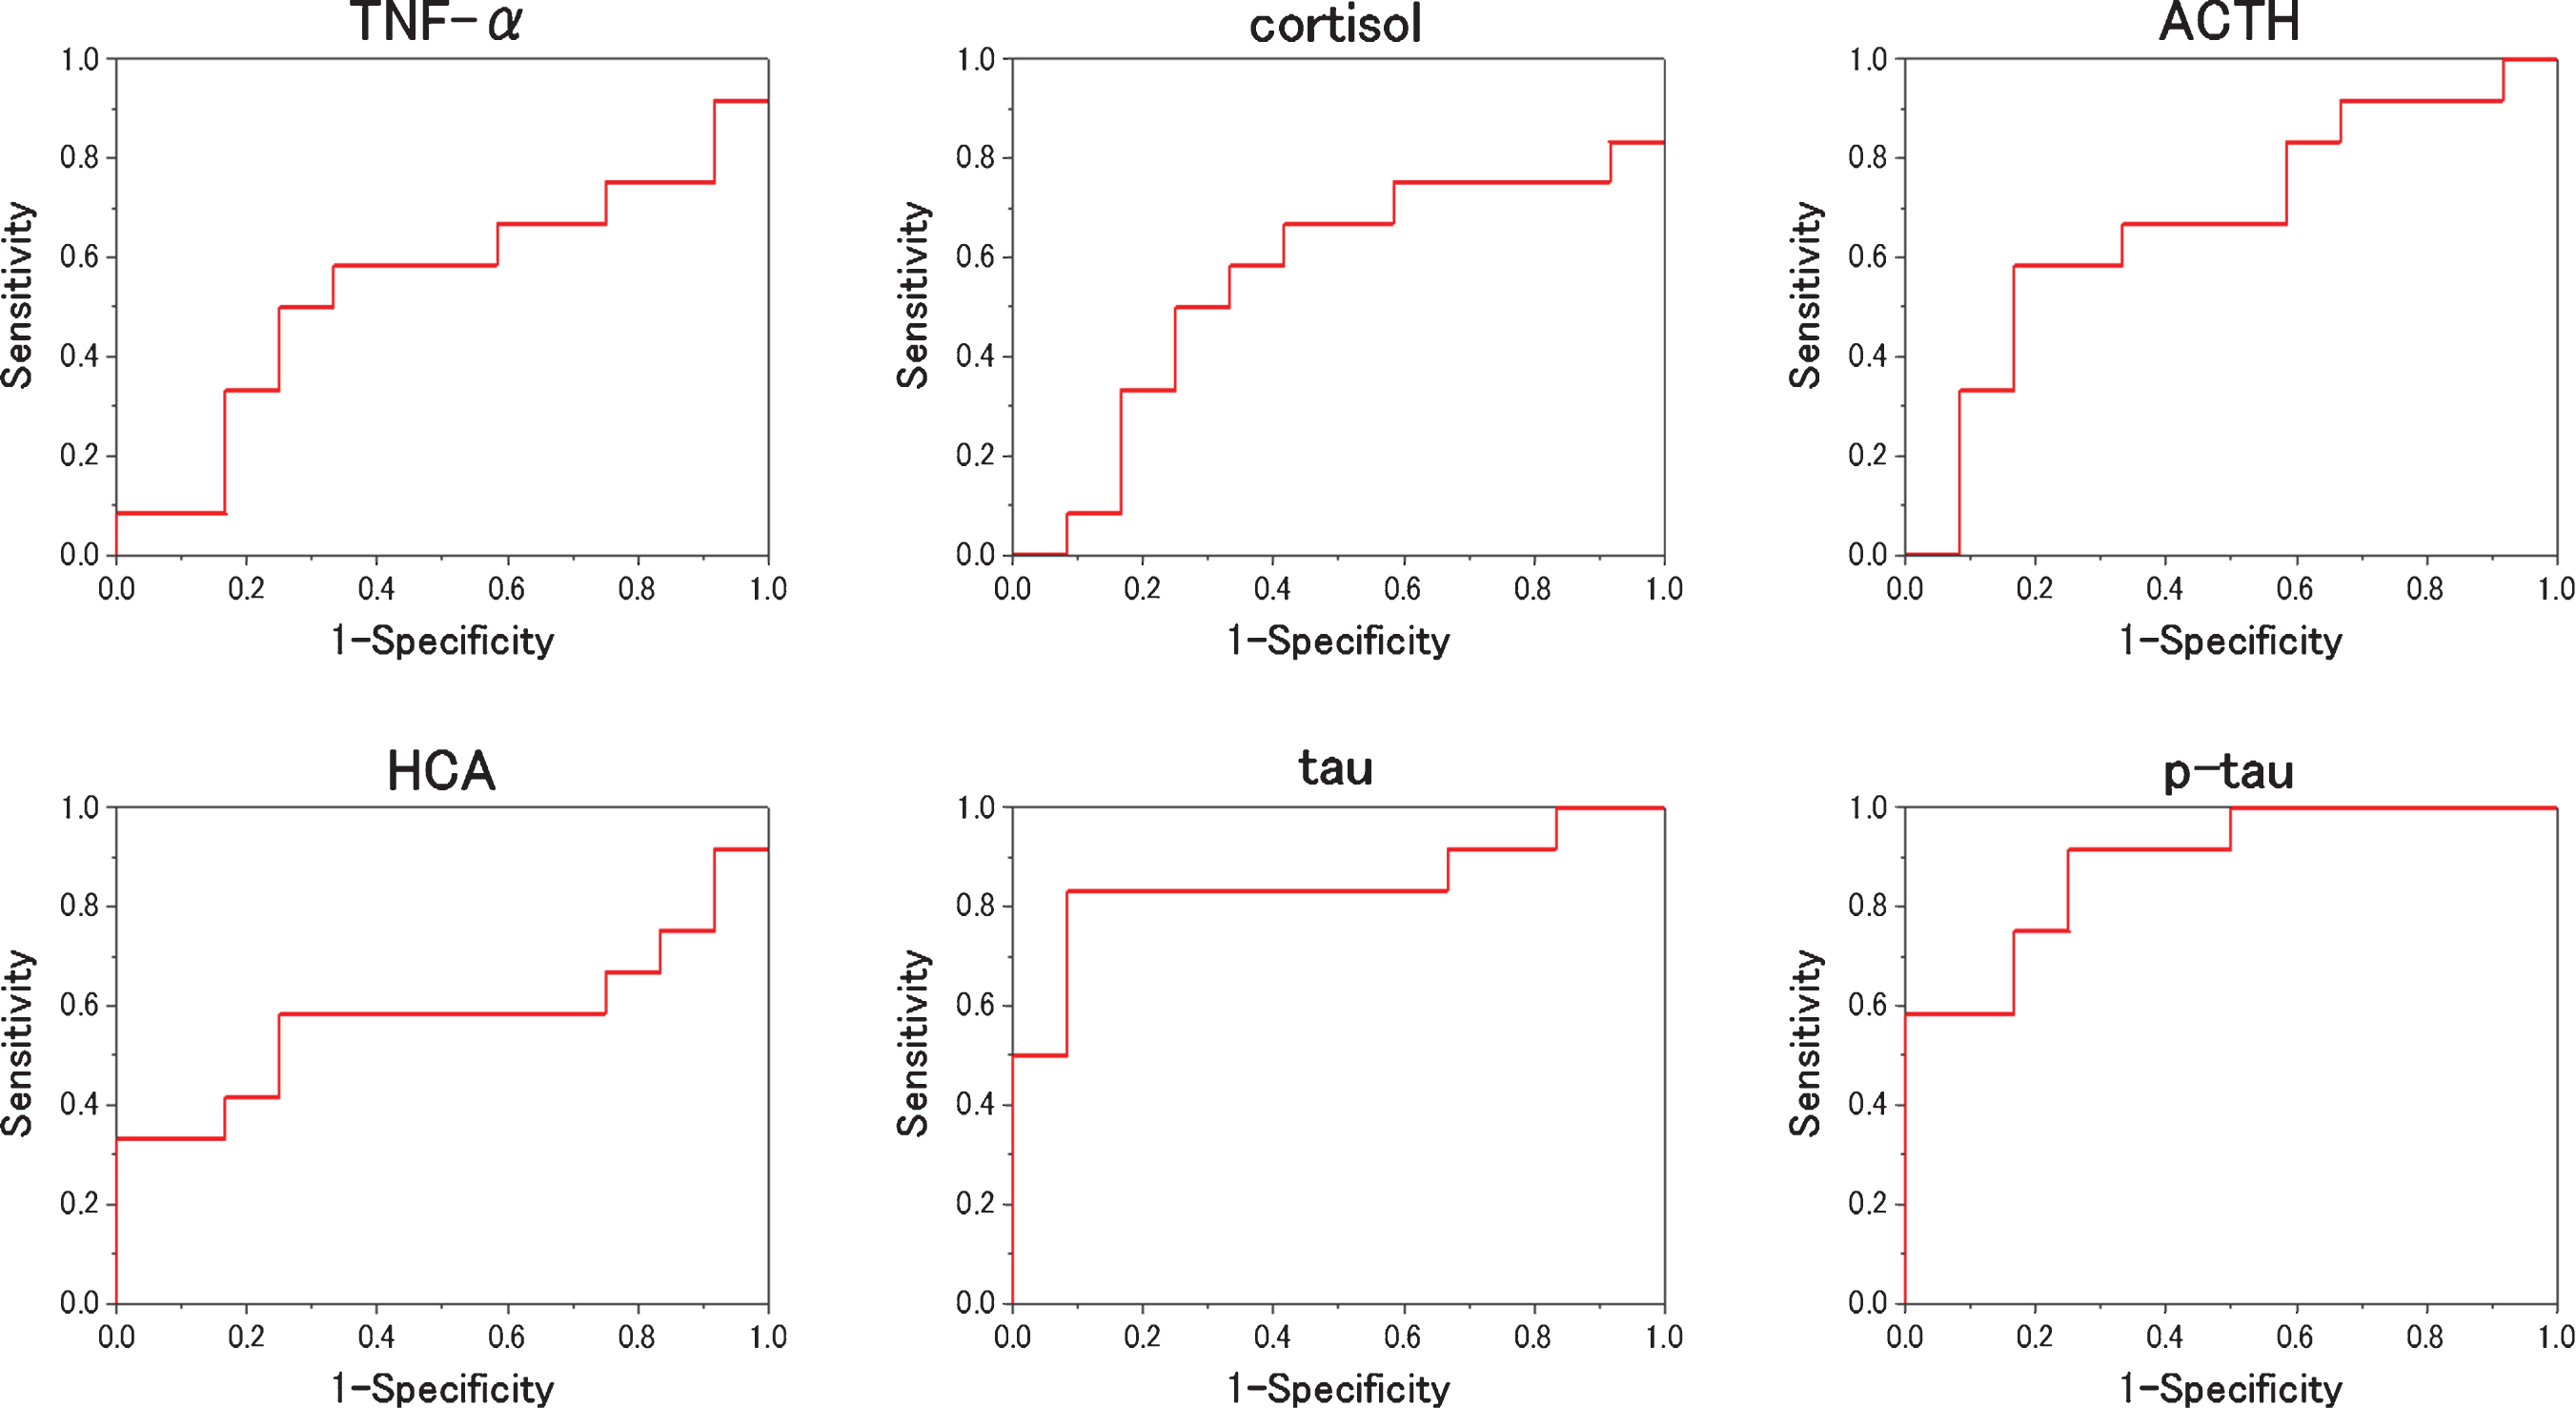
Table 5
The result of ROC analysis distinguishes between MCI and AD for each item
| AUC | SE | p | Cut off | Specificity | Sensitivity | |
| TNF-α | 0.542 | 0.123 | 0.729 | 0.910 pg/mL | 66.7% | 58.3% |
| cortisol | 0.556 | 0.124 | 0.644 | 31.0μg/dL | 58.3% | 66.7% |
| ACTH | 0.674 | 0.114 | 0.149 | 28.0 pg/mL | 66.7% | 66.7% |
| HCA | 0.576 | 0.126 | 0.525 | 0.345μM | 75.0% | 58.3% |
| tau | 0.847 | 0.088 | 0.004 | 17.00 pg/mL | 91.7% | 83.3% |
| p-tau | 0.889 | 0.065 | 0.001 | 5.90 pg/mL | 75.0% | 91.7% |
The AUC and the optimal cutoff when writing the ROC curve that distinguish between MCI and AD are shown with the sensitivity and specificity at that time.
In conclusion, HCA is a good candidate of a biomarker of MCI and a good target for treatment of AD. Further studies are warranted using large clinical samples to confirm this result and hypothesis.
ACKNOWLEDGMENTS
Financial support for this study is from Nipro Co.
Authors’ disclosures available online (https://www.j-alz.com/manuscript-disclosures/20-0234r3)
REFERENCES
[1] | David CH , Gad Mar A ((2017) ) Primary and secondary prevention trials in Alzheimer disease: Looking back, moving forward. Curr Alzheimer Res 14: . 426–440. |
[2] | Liu J , Chang L , Song Y , Li H , Wu Y ((2019) ) The role of NMDA receptors in Alzheimer’s disease. Front Neurosci 13: , 43. |
[3] | Olney JW , Price MT , Salles KS , Labruyere J , Ryerson R , Mahan K , Friendich G , Samson L ((1987) ) L-homocysteic acid: An endogenous excitotoxic ligand of the NMDA receptor. Brain Res Bull 19: , 597–602. |
[4] | Hasegawa T , Mikoda N , Kitazawa M , Laferla FM ((2010) ) Treatment of Alzheimer’s disease with anti-homocysteic acid antibody in 3×Tg-AD male mice. PLoS One 5: , e8593. |
[5] | Hasegawa T , Ichiba M , Matsumoto S , Kasanuki K , Hatano T , Fijishiro H , Iseki E , Hattori N , Yamada T , Tabira T ((2012) ) Urinary homocysteic acid levels correlate with Mini-Mental State Examination scores in Alzheimer’s disease patients. J Alzheimers Dis 31: , 59–64. |
[6] | American Psychiatric Association ((2013) ) Diagnostic and Statistical Manual of Mental Disorders, Fifth Edition, Washington, DC. |
[7] | Petersen R C ((2004) ) Mild cognitive impairment as a diagnostic entity. J Intern Med 256: , 183–194. |
[8] | Thomas KR , Bangen KJ , Weigand AJ , Edmonds EC , Wong CG , Cooper S , Deleno-Wood L , Bondi MW ((2020) ) Objective subtle cognitive difficulties predict future amyloid accumulation and neurodegeneration. Neurology 94: , e397–e406. |
[9] | Moreno-Jimenez EP , Flor-Garcia M , Terreros-Roncal J , Rabano A , Cafini F , Pallas-azarra N , Avila J , Liorens-Martin M ((2019) ) Adult hippocampal neurogenesis is abundant in neurologically healthy subjects and drops sharply in patients with Alzheimer’s disease. Nat Med 25: , 554–560. |
[10] | Hasegawa T , Ukai W , Jo DG , Xu X , Mattoson MP , Nakagawa M , Araki W , Saito T , Yamada T ((2005) ) Homocysteic acid induces intraneuronal accumulation of neurotoxic Aβ42: Implication for the pathogenesis of Alzheimer’s disease. J Neurosci Res 80: , 869–876. |
[11] | Reitz C , Tang M , Miller J , Green R , Luchsinger JA ((2009) ) Tang plasma homocysteine and risk of mild cognitive impairment. Dement Geriatr Cogn Disord 27: , 11–17. |
[12] | Lipton SA , Kim WK , Choi YB , Kumar S , D’Emilia DM , Rayudu PV , Amelle DR , Stamler JS ((1997) ) Neurotoxicity associated with dual actions of homocysteine at the N-methyl-d-aspartate receptor . Proc Natl Acad Sci U S A 94: , 5923–5928. |
[13] | Aisen PS , Schneider LS , Sano M , Diaz-Arrestia R , Dyck CH , Weiner MF , Bottiglieri T , Jin S , Stokes KT , Thomas BG , Thal LJ ((2008) ) High dose B vitamin supplementation and cognitive decline in Alzheimer’s disease: A randomized controlled trial. JAMA 300: , 1774–1783. |
[14] | Hasegawa T , Uchida Y ((2017) ) Open label clinical trial of hydrogen brain food for 91 Alzheimer’s patients. Int J Clin Res Trials 2: , 111. |


