
Gene Ontology Curation of Neuroinflammation Biology Improves the Interpretation of Alzheimer’s Disease Gene Expression Data
Abstract
Background:
Gene Ontology (GO) is a major bioinformatic resource used for analysis of large biomedical datasets, for example from genome-wide association studies, applied universally across biological fields, including Alzheimer’s disease (AD) research.
Objective:
We aim to demonstrate the applicability of GO for interpretation of AD datasets to improve the understanding of the underlying molecular disease mechanisms, including the involvement of inflammatory pathways and dysregulated microRNAs (miRs).
Methods:
We have undertaken a systematic full article GO annotation approach focused on microglial proteins implicated in AD and the miRs regulating their expression. PANTHER was used for enrichment analysis of previously published AD data. Cytoscape was used for visualizing and analyzing miR-target interactions captured from published experimental evidence.
Results:
We contributed 3,084 new annotations for 494 entities, i.e., on average six new annotations per entity. This included a total of 1,352 annotations for 40 prioritized microglial proteins implicated in AD and 66 miRs regulating their expression, yielding an average of twelve annotations per prioritized entity. The updated GO resource was then used to re-analyze previously published data. The re-analysis showed novel processes associated with AD-related genes, not identified in the original study, such as ‘gliogenesis’, ‘regulation of neuron projection development’, or ‘response to cytokine’, demonstrating enhanced applicability of GO for neuroscience research.
Conclusions:
This study highlights ongoing development of the neurobiological aspects of GO and demonstrates the value of biocuration activities in the area, thus helping to delineate the molecular bases of AD to aid the development of diagnostic tools and treatments.
INTRODUCTION
There are currently no effective methods for prevention or treatment of Alzheimer’s disease (AD) and other dementias [1–3], and the development of biomarker panels, which could be used in non-invasive detection methods, is in its early stages [4]. Insufficient understanding of the underlying molecular bases and mechanisms of disease development, including the involvement of inflammatory pathways [5–10] as well as dysregulated microRNAs (miR) [11–16], contributes to this lack of effectiveness in managing these debilitating conditions. The challenge in delineating the molecular mechanisms, which are key to healthy brain homeostasis and are disrupted during development of AD, is that the majority of cases are likely to be caused by multiple genetic and environmental factors [17–19]. Nonetheless, several genes implicated in monogenic AD have been identified [20, 21]. To delineate the genetic risk factors contributing to polygenic AD, high-throughput experimental approaches, such as transcriptomic, proteomic and genome-wide association studies, resulting in sets of ‘big data’, are being used [18, 22–28]. In order to be able to navigate this knowledge and use it for data analyses in an efficient way, researchers rely on bioinformatic resources, such as Gene Ontology (GO) [29, 30].
The GO resource is a biomedical ontology that uses a controlled vocabulary of GO terms to describe the normal physiological roles of biological entities, such as proteins and non-coding RNAs (ncRNAs), across all species and biological fields, in a consistent and computer-accessible manner. GO terms are associated with biological entities manually by scientific biocurators, based on published experimental information, and automatically by electronic pipelines, using carefully designed similarity criteria. The resulting links between GO terms and biological entities are known as ‘annotations’. The GO resource comprises three categories of terms, describing ‘molecular functions’ (e.g., ‘protein kinase activity’), the ‘biological processes’ toward which the functions contribute (e.g., ‘microglial cell activation’), and ‘cellular components’ or locations (e.g., ‘plasma membrane’, or ‘axon’) [29, 30].
Annotation of proteins and ncRNAs serves to bridge the gap between data collection and data analyses by providing knowledge about their cellular roles in a format accessible to both systems biology and genomic investigators [22, 31]. In addition to GO [29, 30], other resources that provide annotations of biological entities’ roles include Reactome [32], the Kyoto Encyclopedia of Genes and Genomes (KEGG) [33], and molecular interaction databases [34]. One use of annotations provided by these resources is to identify gene groups that are represented at a higher (or lower) than expected frequency within a given gene list. Annotations are imported into independent enrichment or gene-set analysis tools, such as g:Profiler [35], the WEB-based Gene SeT AnaLysis Toolkit (WebGestalt) [36], the VisuaL Annotation Display (VLAD) tool [37], the Biological Network Gene Ontology (BiNGO) tool [38], the Protein Analysis Through Evolutionary Relationships (PANTHER) tool [39], or the Multi-marker Analysis of GenoMic Annotation (MAGMA) tool [40]. These analysis tools group genes with shared characteristics (such as an involvement in the same pathway or located in the same part of the cell) and apply appropriate statistical parameters to identify enriched or underrepresented gene groups, defined by their associated GO terms, pathways, or interactions. Thus, functional gene annotation data is used to interpret datasets from genome-wide association, proteomic, and transcriptomic studies [27, 41–43].
In order to improve the GO resource for enrichment analyses relevant to neurobiological conditions, we previously annotated the biological roles of proteins implicated in AD [44], Parkinson’s disease [45], and autism [46], in addition to contributing to the synapse annotation project [47]. The AD-focused GO annotation initiative has already captured the roles of proteins and complexes interacting with either amyloid-β or the microtubule-associated protein tau [44], the pathological hallmarks of AD [48–51]. Furthermore, we have pioneered the functional annotation of miRs using GO [52, 53]. Our continued, focused, and systematic full article annotation approach, described here, has led to an enhanced GO resource, with more descriptive GO terms associated with AD-relevant microglial proteins [54, 55] and the miRs that regulate their expression. Our annotations have led to an improved interpretation of a previously published AD transcriptomic dataset [43] and can be used to create a network of miR-mRNA interactions. Thus, our work has potential implications for research dedicated to preventing and/or treating neuroinflammation implicated in AD.
As previously, annotations resulting from this University College London (UCL)-based project, funded by the Alzheimer’s Research UK (ARUK) foundation, are labelled in GO browsers and/or secondary resources as contributed by ARUK-UCL [44]. GO data (ontology and annotations) are freely available and can be downloaded from the AmiGO [56] and QuickGO [57] browsers.
MATERIALS AND METHODS
Community engagement
Collaborations were established between members of the GO Consortium [29, 30] and neuroscience and neuroinflammation community experts to ensure that our biocuration efforts align with the needs of the AD research community. Project progress and direction were discussed and, if required, revised and updated during biannual scientific advisory panel meetings and through regular correspondence.
Curation priorities
A list of 40 human AD-relevant microglial proteins (Supplementary Table 1) implicated in neuroinflammation was compiled based on recent review articles [54, 55]. The microRNA-Target interactions dataBase (miRTarBase) resource [58] and scientific literature, indexed in PubMed [59], were subsequently searched for human miRs involved in silencing of genes encoding these 40 AD-relevant microglial proteins; this resulted in a list of 66 human miRs (Supplementary Table 2). Collectively, the 40 proteins and the 66 miRs comprised the 106 biological entities prioritized for annotation as a part of this project.
Identification of publications describing priority proteins
The PubMed database [59] was used to identify research articles that contained experimental data suitable for annotation. For each of the 40 priority proteins, PubMed searches were performed using the HUGO Gene Nomenclature Committee approved gene symbol (HGNC symbol) [60], protein name or synonym. If the search retrieved more than 100 papers, then the volume of papers was reduced by the inclusion of additional keywords (one at a time): ‘microglia’, ‘microglial’, ‘glia’, ‘glial’, ‘dementia’, ‘Alzheimer’s’, ‘Alzheimer’, ‘AD’, ‘neuroinflammation’, ‘neurology’, ‘neurological’, ‘neurobiology’, ‘neurodegeneration’, ‘nerve’, ‘nervous’, ‘brain’, ‘synapse’, ‘synaptic’, ‘memory’, ‘cognition’, ‘age-related’ or ‘aging’. Research articles describing the human proteins were then selected for annotation based on the relevance of their title or abstract. If no, or insufficient, information on a human entity was found, then papers describing mammalian orthologues, identified using the HGNC orthologue prediction tool ‘HCOP’ [61], were curated.
Identification of publications describing priority miRs
Regulatory miRs (Supplementary Table 2) were identified in two ways: firstly, using the miRTarBase [58] by searching for a priority protein (Supplementary Table 1) and selecting research articles based on reporter assay evidence, or western blot and qRT-PCR evidence; and secondly, by searching the PubMed database [59] using the priority protein (Supplementary Table 1) HGNC approved gene symbol [60], protein name, or synonym plus ‘miR’, ‘miRNA’, or ‘microRNA’. In contrast to the annotation of only carefully selected articles describing the priority proteins, all identified articles, which described an experimentally verified molecular interaction between a priority miR and a messenger RNA (mRNA) transcript of a priority protein, were annotated, irrespectively of whether they were describing neuroinflammation or other biological processes. This approach helped to reduce the chances of creating a set of miR annotations biased toward neuroinflammation.
Curation procedure
Research articles were read by skilled GO biocurators and biological roles and cellular locations of proteins and miRs were captured using GO terms, following established standard GO annotation procedures [53, 62–64]. Molecular interactions between miRs and mRNA transcripts of their experimentally validated target genes were captured using the guidelines for GO curation of miRs [53]. Additional contextual information was provided in the GO annotation extension using terms from GO or other ontologies [64]. The Universal Protein (UniProt) KnowledgeBase [65], RNAcentral [66], Complex Portal [67], and Ensembl [68] identifiers were used for annotation of, respectively: proteins, ncRNAs including miRs, macromolecular protein complexes and targets of gene silencing by miRs. Specific Evidence and Conclusion Ontology (ECO) [69] codes were included in each biocurator-generated annotation, based on the type of experimental data reported in the research article (e.g., ‘IPI’: physical interaction evidence used in manual assertion (ECO:0000353), or ‘IMP’: mutant phenotype evidence used in manual assertion (ECO:0000315)), or to infer evidence from statements made in reviews (e.g., ‘TAS’: author statement supported by traceable reference used in manual assertion (ECO:000030)). In order to maximize the value of the annotations to the research community, selected research papers were annotated using the full article annotation method. This approach ensures that GO annotations are contributed for not only the priority entities (Supplementary Tables 1 and 2), but also for any other protein, miR, or protein complex described in those articles, thus increasing the biocuration scope and reducing annotation bias. Experimentally supported GO annotations associated with rodent or other mammalian proteins, miRs and complexes were transferred by biocurators to human orthologues using the ECO code [69] ‘ISS’ (sequence similarity evidence used in manual assertion; ECO:0000250), following established GO Consortium guidelines [29, 30, 53, 62]. This biocuration process was consistently applied for all annotated entities.
Availability of GO annotations
The annotations contributed by this project to the GO resource are attributed to ARUK-UCL and included in the GO Consortium annotation files [29, 30]. Consequently, our annotations are made available through various http and ftp sites (e.g., http://geneontology.org/page/download-ontology and ftp://ftp.ebi.ac.uk/pub/databases/GO/goa/) and the GO browsers QuickGO [57] and AmiGO [56] and propagated to other major biological databases, including NCBI Gene [70], Ensembl [68], UniProt [65], miRBase [71], and RNAcentral [66]. The miR-target and protein-protein interactions captured by our GO annotations are included in the European Bioinformatics Institute (EBI) GO Annotation (GOA) datasets, respectively, in the EBI-GOA-miRNA [52] and EBI-GOA-nonIntAct datasets available from the PSICQUIC [72] web service (http://www.ebi.ac.uk/Tools/webservices/psicquic/view/home.xhtml), the QuickGO web service (http://www.ebi.ac.uk/QuickGO/psicquic-rna/webservices/current/search/interactor/*), or from directly within Cytoscape [73], as described previously [52, 53].
PANTHER functional GO term enrichment analysis of genes differentially expressed in AD
The PANTHER version 14.1 Online Tool [39, 74] was used to perform functional enrichment re-analyses on two transcriptomic datasets previously analyzed by Avramopoulos et al., 2011 [43]. In the Avramopoulos et al. study, RNA was extracted from the superior temporal lobe of late onset AD and control brains. Two gene groups were identified within the AD versus control dataset: one overexpressed in AD (‘Higher is AD’, 505 genes), and one underexpressed in AD (‘Lower in AD’, 527 genes). UniProt identifiers were used in the PANTHER re-analysis of these datasets with the Fisher’s Exact test and the Bonferroni correction for multiple testing and significance level of 0.05 applied. The human reference proteome (released April 2018) was used as the reference set, with ontology and annotation GO files (released 3 July 2019).
MiR-target molecular interaction networks construction
Two miR-target molecular interaction networks were constructed in Cytoscape 3.7.1 [73]. In the first network the HGNC approved gene symbols [60], corresponding to the priority proteins (Supplementary Table 1), were used as seeds and molecular interaction data were imported from the EBI-GOA-miRNA file [52] (accessed 1 July 2019); this network is referred to as the ‘target-centered’ network. The second network was created by using the RNAcentral identifiers [66] of the prioritized miRs (Supplementary Table 2) as seeds and importing molecular interaction data from the EBI-GOA-miRNA file [52] (accessed 19 August 2019); this network is referred to as the ‘miR-centered’ network. The ‘yFiles Organic Layout’ was applied and adjusted manually.
Functional GO term enrichment analysis of miR-target interaction networks
GO term enrichment analyses were performed on the miR-target networks using the Cytoscape plugins GOlorize [75] and BiNGO [38]. The selected BiNGO settings included ‘Cluster from Network’, ‘Overrepresentation’, and ‘No Visualization’. The Hypergeometric statistical test with the Benjamini & Hochberg FDR correction for multiple testing and a significance level of 0.05 were applied. The GOlorize plugin [75] was used for visualization of selected overrepresented categories after correction. The human entities annotated to the GO term ‘biological process’ or its descendants were used as reference set. The Gene Ontology file (go-basic.obo) (released 1 July 2019) was downloaded from the GO Consortium website (http://geneontology.org/page/download-ontology). The gene association files for human proteins (goa_human.gaf), ncRNAs (goa_human_rna.gaf), protein isoforms (goa_human_isoform.gaf), and complexes (goa_human_complex.gaf) were downloaded from the European Bioinformatics Institute ftp site (ftp://ftp.ebi.ac.uk/pub/databases/GO/goa/HUMAN/) (released 17 July 2019) and merged into a single file called ‘gene_association.goa_human’. No evidence codes were discarded.
RESULTS
Gene Ontology annotation outcomes
Annotation priorities
Forty human microglial proteins relevant to AD were identified and prioritized for annotation based on the review by Simon et al. [55] and the perspective by Deczkowska et al. [54] (Supplementary Table 1). This was followed by database and literature searches, which identified 66 human microRNAs (miRs) that have been shown experimentally to regulate the expression of these 40 proteins, and they were also prioritized for annotation (Supplementary Table 2). Therefore, in total 106 human entities, including proteins and miRs, were identified and prioritized for GO annotation.
Increasing curation breadth through the full article annotation approach
GO was used for annotation of 379 research articles (Table 1), capturing the roles of these 40 microglial priority proteins and the 66 miRs regulating their expression (or their orthologues) as described in the methods section. Importantly, the curation process was based on the full article annotation approach; consequently, the total number of annotated entities is not limited to just the prioritized proteins and miRs, but it also includes their isoforms and orthologues as well as other entities described in the annotated articles. Consequently, the total number of 341 annotated human entities was over triple the number of the 106 prioritized entities, whereas the total number of human and non-human entities annotated was 494, almost five times the number of the prioritized entities (Table 2, section A). Hence, the full article annotation approach allowed us to ensure that we capture the breadth of the biology associated with the prioritized entities by annotating other proteins, miRs, and macromolecular complexes implicated in the same processes and pathways.
Table 1
Number of published research articles annotated using GO as a part of this project
| Number of articles annotated | Number of articles | ||
| All entities* | Human entities* | Human priority entities* | |
| Total | 379 | 286 | 217 |
| Describing proteins | 269 | 201 | 126 |
| Describing ncRNAs | 171 | 130 | 108 |
| Describing complexes | 11 | 9 | n/a |
Data from QuickGO [57] (accessed 18 August 2019). *The term ‘entity’ is used to describe proteins, ncRNAs (including miRs) and macromolecular protein-containing complexes.
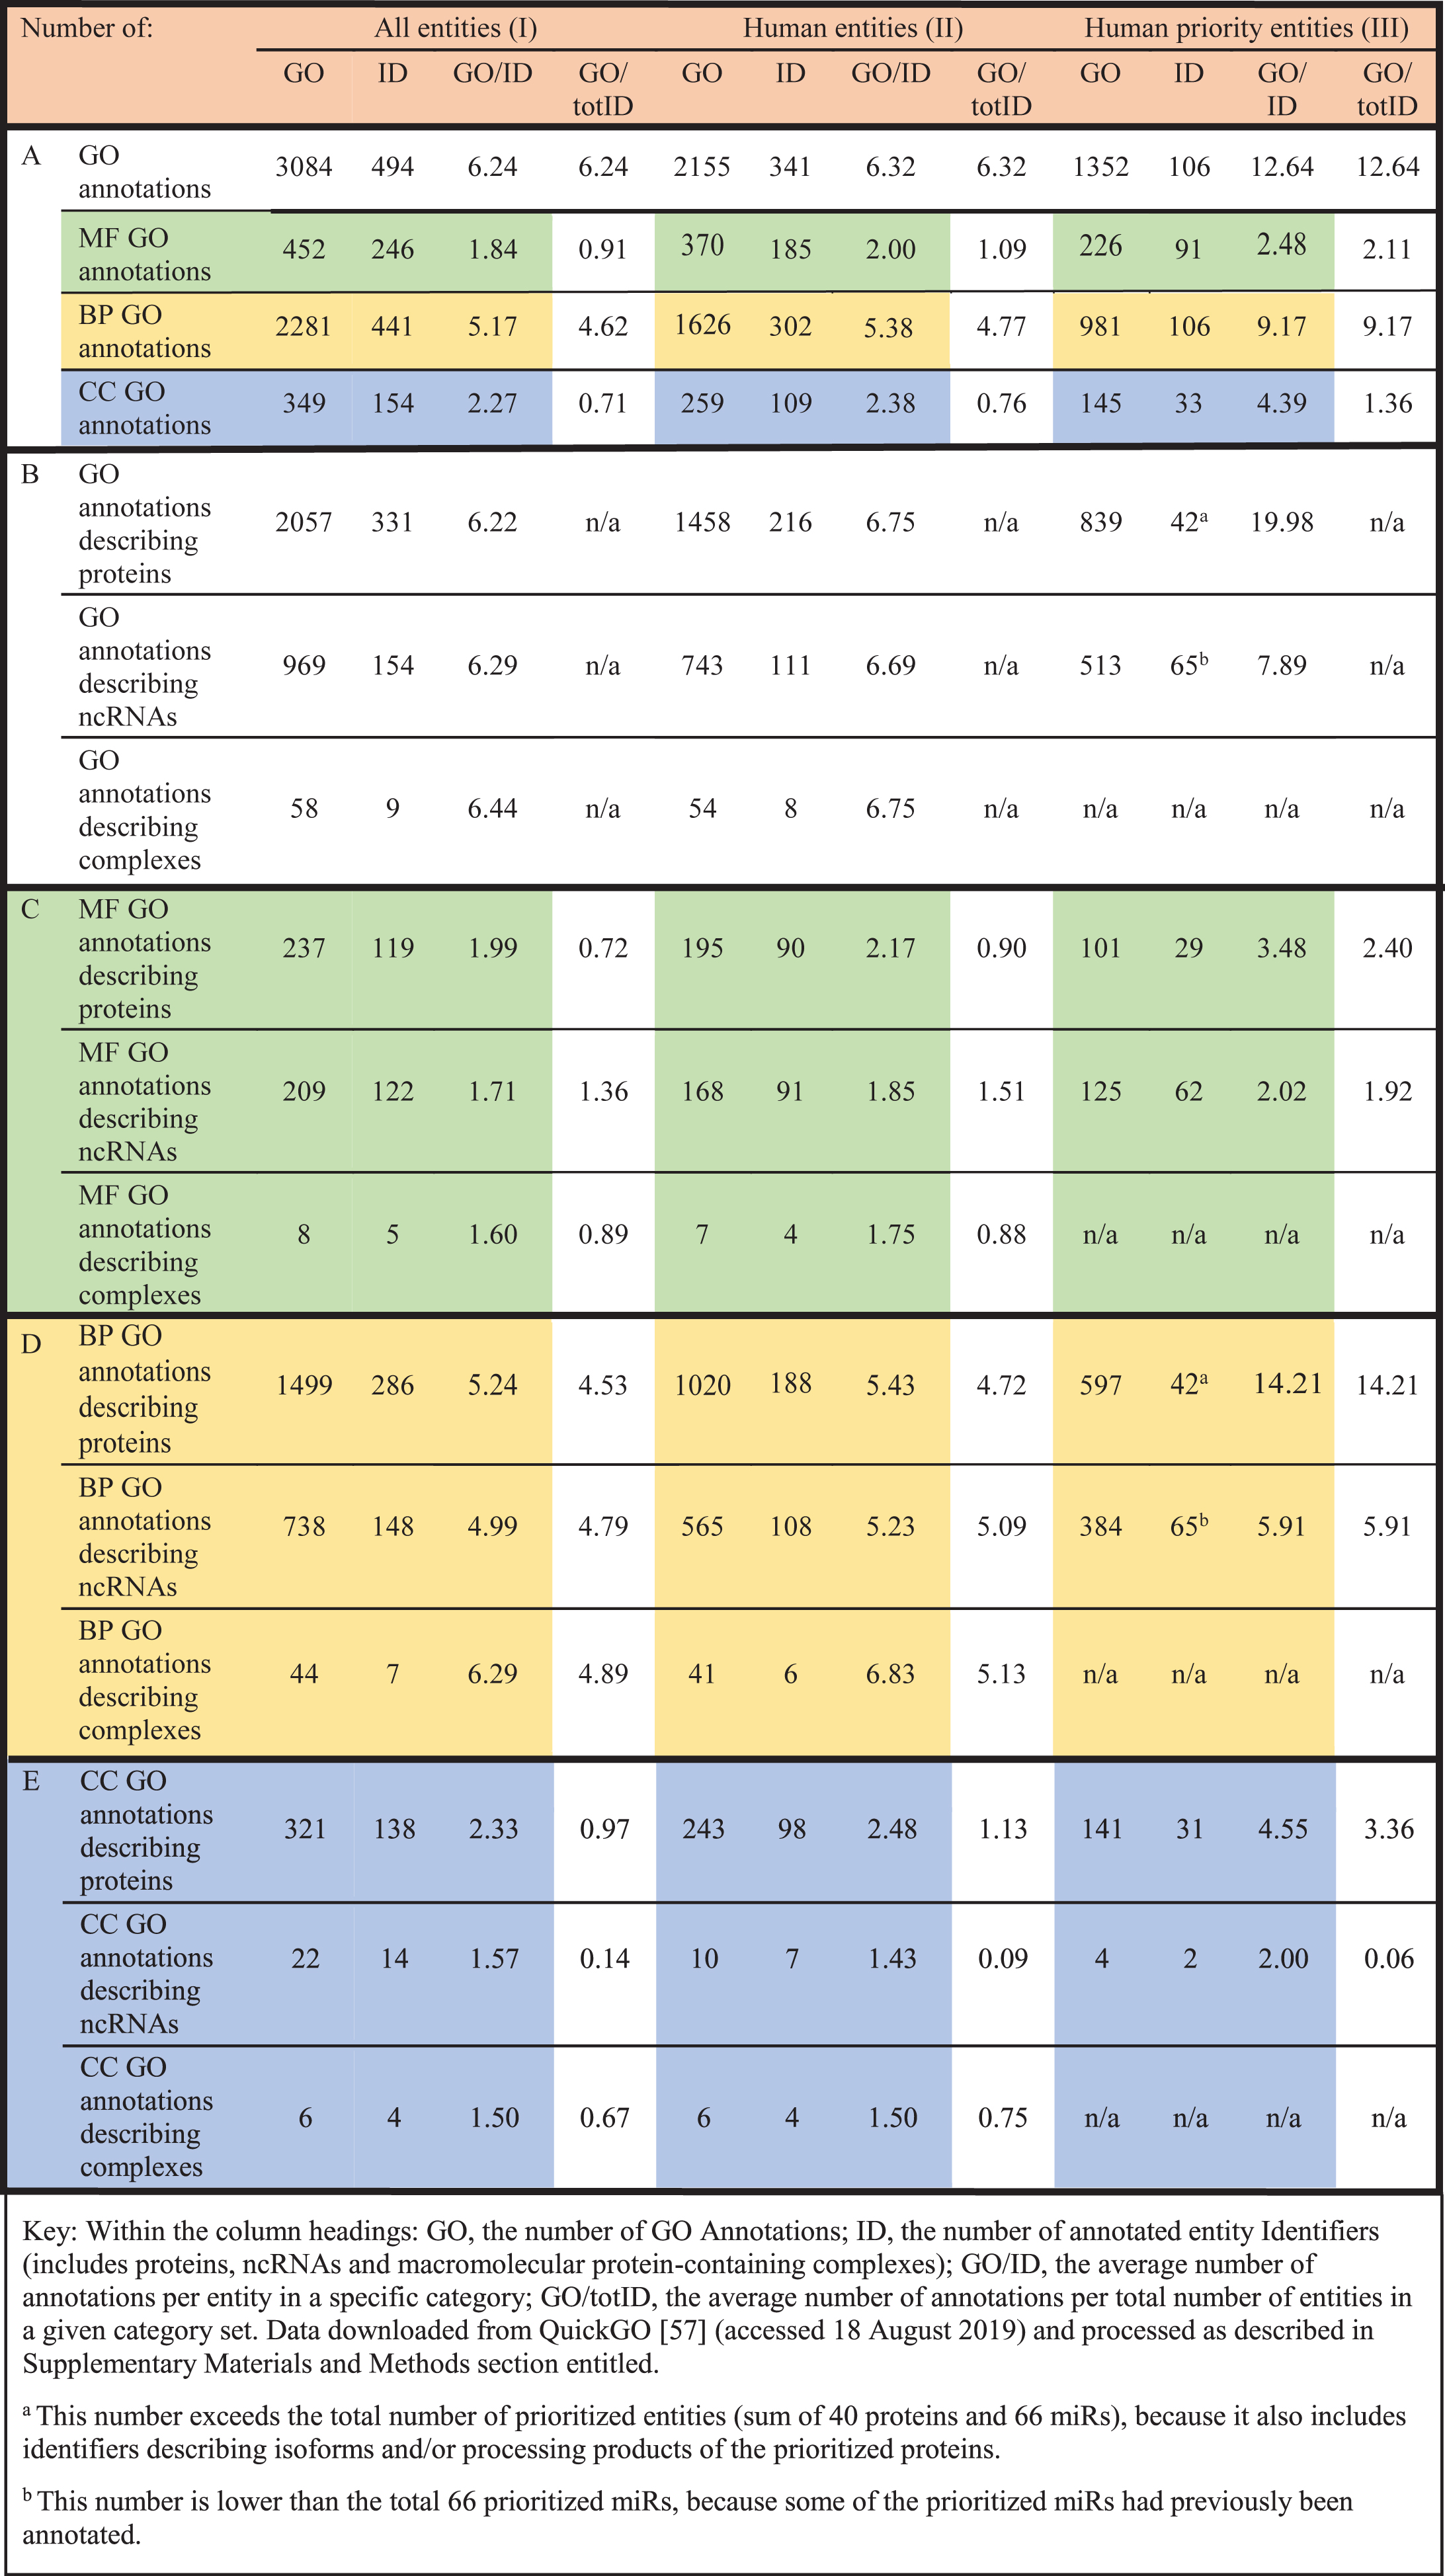
Table 2
Summary of the GO annotations resulting from this project. In the table, the rows are organized into sets: A) all GO annotations for all entity types; B) all GO annotations separated into entity type (protein, ncRNA, complexes); C) molecular function (MF) GO annotations separated into entity type; D) biological process (BP) GO annotations separated into entity type; E) cellular component (CC) GO annotations separated into entity type. The columns are also grouped according to (I) totals for all entities; (II) totals for all human entities; (III) totals for human prioritized entities
 |
Systematic in-depth annotation of prioritized entities
Based on the number of GO annotations and annotated entities (Table 2, columns I, section A), it is apparent that far more biological process (BP) annotations were created (2,281, with an average of > 4 BP terms per entity: 2,281/494) than annotations using the two other GO aspects (452 using molecular function (MF) terms and 349 cellular component (CC) terms). For the prioritized entities, we contributed an average of 12 annotations per entity (1352/106), which is considerably higher than the number of annotations we contributed for all entities during this project, with an average of six annotations per entity (3,084/494) (Table 2A, section A; column III and column I, respectively). The majority of annotations for prioritized entities were made for proteins with an average of 20 annotations per protein (839/42, Table 2, column III, section B). Almost 600 of these were BP annotations (an average of 14 BP terms per protein: 597/42, Table 2, column III, section D). Additionally, 101 MF and 141 CC GO terms were associated with the priority proteins (Table 2, column III, sections C and E, respectively).
The greatest number of annotations per prioritized miR was also in the BP category with just under six GO terms per miR (384/65, Table 2, column III, sections B and D), again more than the average of nearly 5 BP GO terms per total annotated ncRNAs (738/154, Table 2, column I, sections B and D). The average number of MF annotations per miR is just under two (Table 2, column III, sections B and C; 125/65), i.e., proportionately higher than for all annotated ncRNAs (Table 2, column I, sections B and C; 209/154).
The amount of cellular location information captured for all annotated ncRNAs, as well as the prioritized miRs, is low overall (Table 2, greater row E). This was expected, since most experimental data describing miRs involves reporter assays, or experiments demonstrating changes in expression levels, and not localization studies [76–79].
In summary, our focused annotation approach has considerably enriched GO information content about the roles of the prioritized entities, including proteins as well as miRs. This result has been achieved despite the fact that miRs have not been studied as broadly as proteins, with proportionately less experimental data published to date.
Association of prioritized entities with neuroinflammatory processes
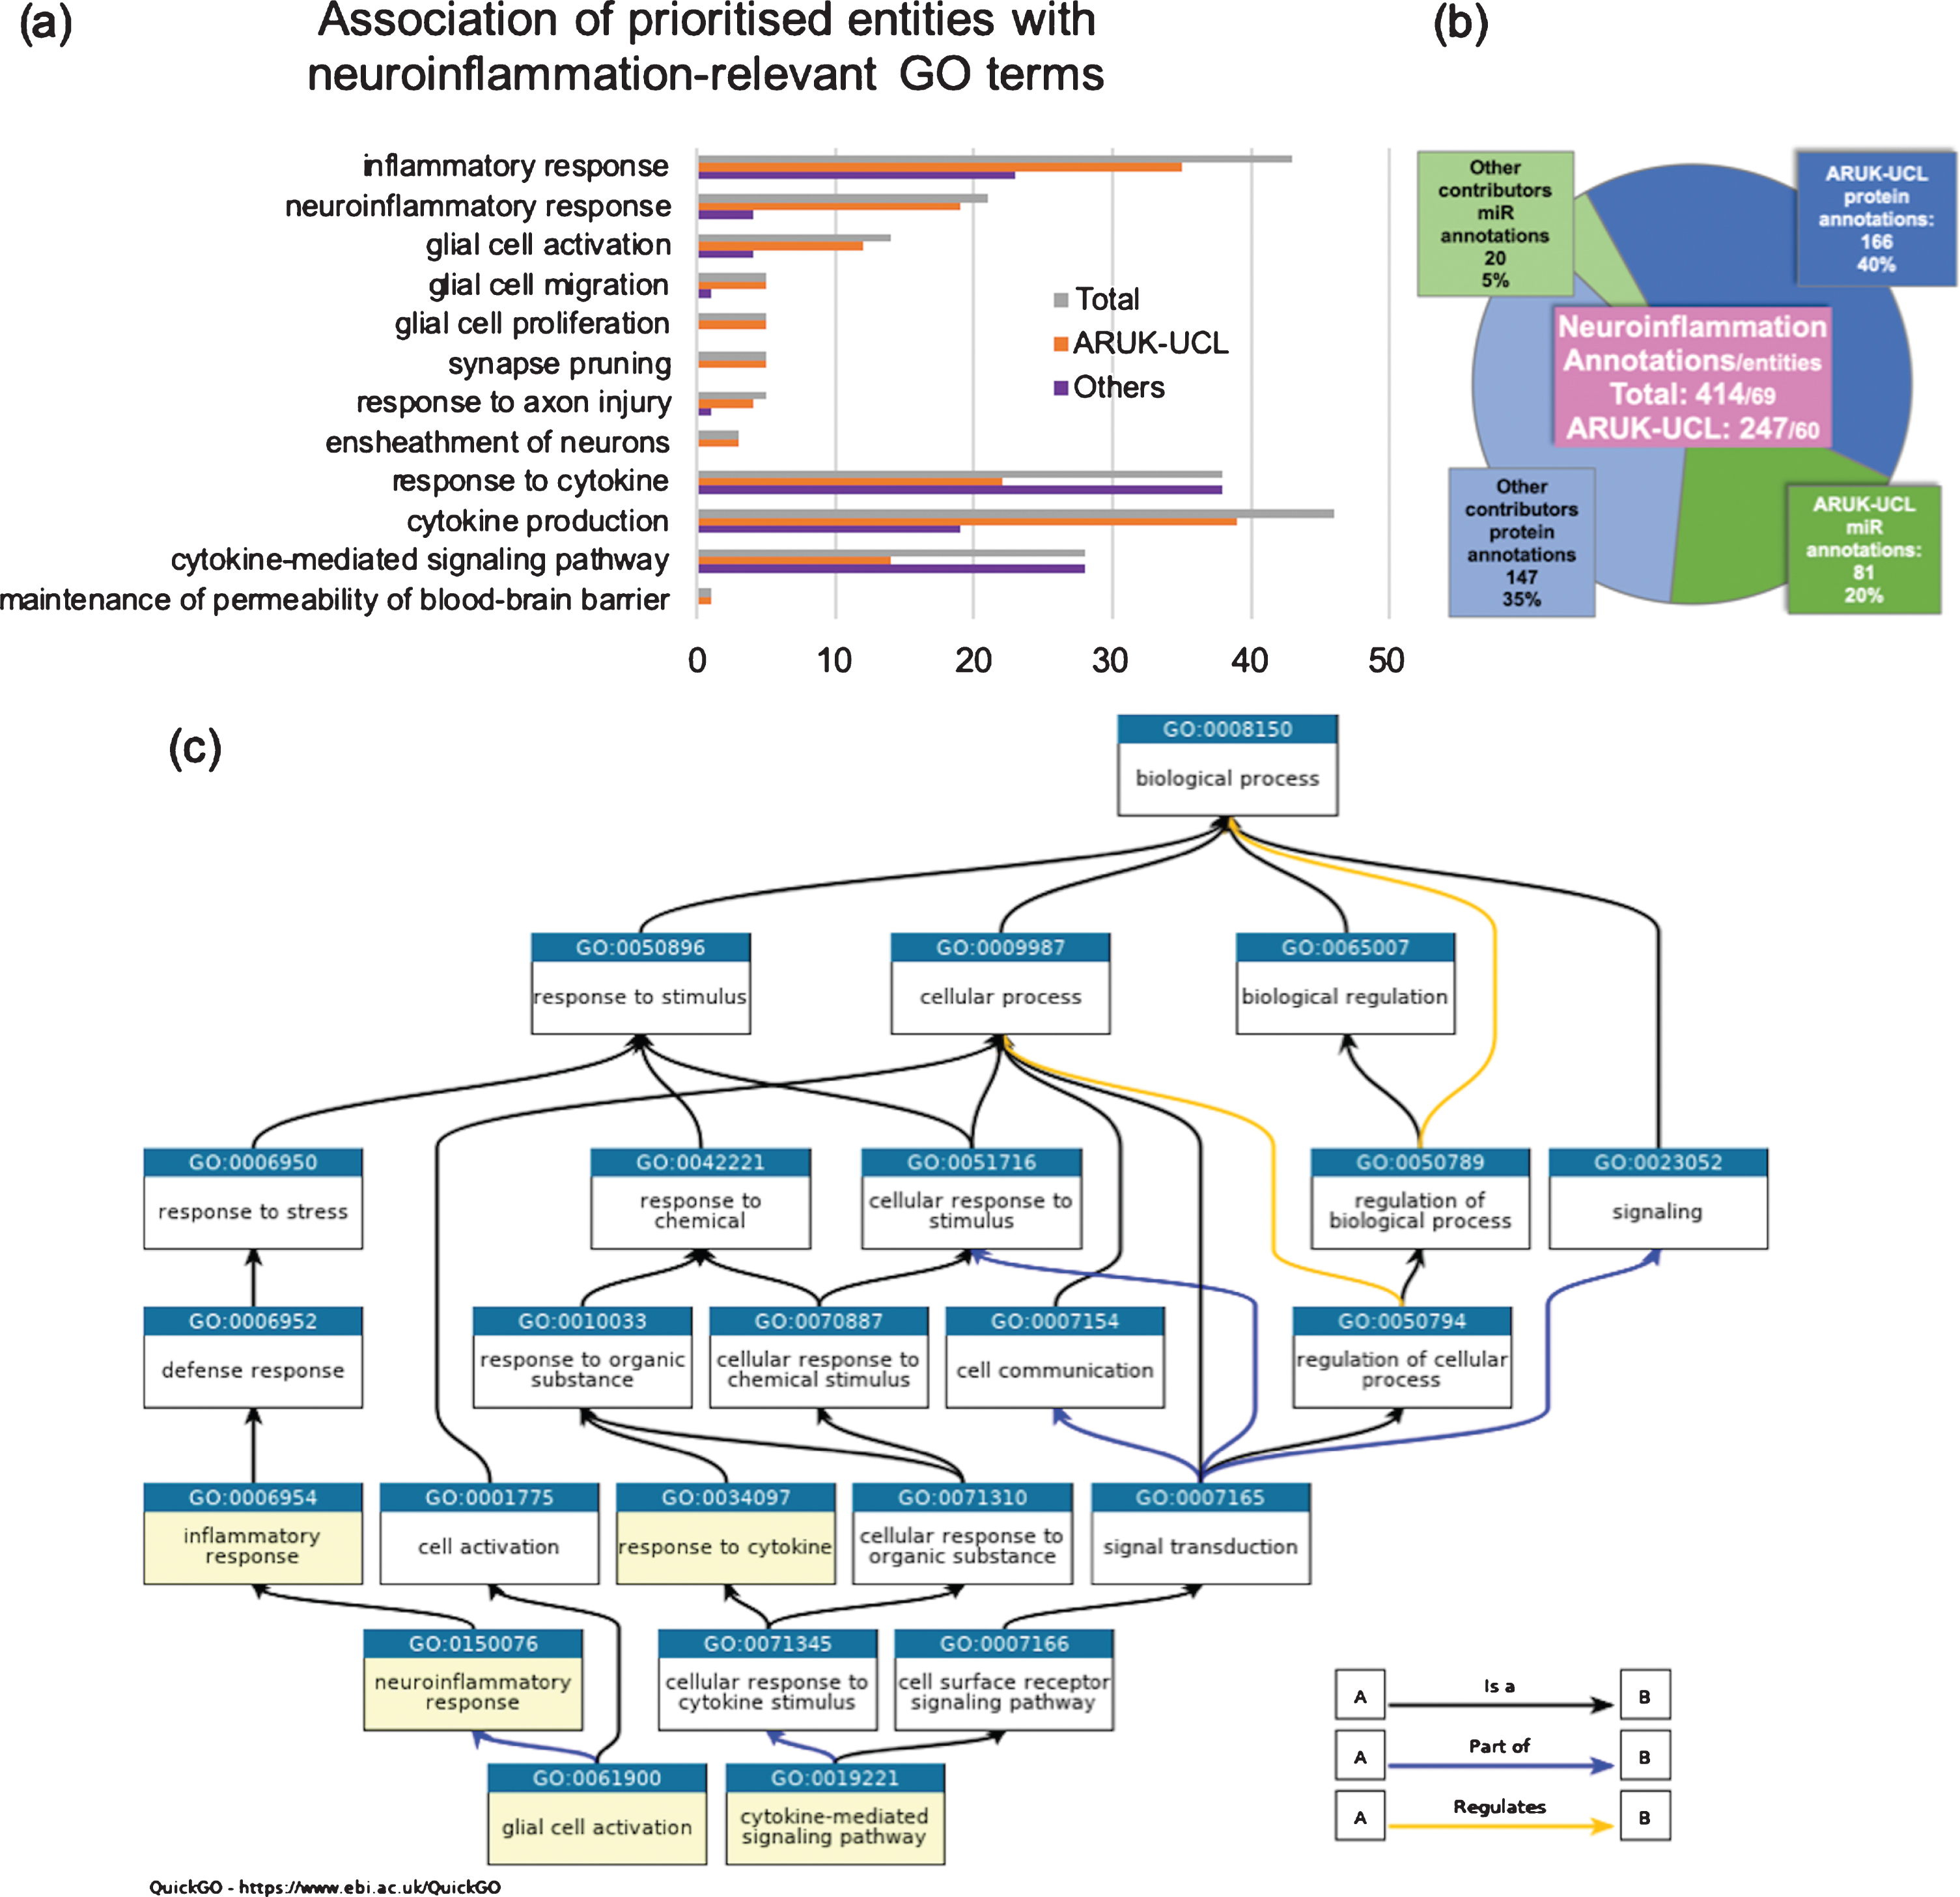
As a result of this project, 60 of the 106 prioritized entities have been associated with a biological process GO term relevant to neuroinflammation (Fig. 1A, B), such as ‘glial cell activation’, ‘response to axon injury’, or ‘cytokine production’, and/or their child terms (Supplementary Table 3). Among these 60 prioritized entities, 31 were proteins and 29 were miRs (data not shown); if a prioritized entity has not been associated with a neuroinflammation-relevant GO term, this indicates that no supporting published experimental data had been identified at the time of GO annotation. For the prioritized entities this project has led to an increase in the number of annotations to GO terms, such as ‘inflammatory response’, ‘neuroinflammatory response’, ‘glial cell activation’, ‘synapse pruning’, ‘response to axon injury’, ‘ensheathment of neurons’, ‘cytokine production’, ‘maintenance of permeability of blood-brain barrier’, and/or their child terms, many of which had not been associated with these GO terms before (Fig. 1A). Among these the terms ‘neuroinflammatory response’ and ‘glial cell activation’, shown in Fig. 1C as descendants of ‘inflammatory response’, had not existed in the ontology prior to this project. However, GO terms describing processes involving cytokines, synapses, migration, and proliferation of glial cells, as well as ‘response to axon injury’ and ‘ensheathment of neurons’ had all been available for annotation previously. The overall number of annotations to the neuroinflammation-relevant GO terms associated with the prioritized proteins or miRs by ARUK-UCL was 247, which constituted 60% of all annotations to these processes for the prioritized entities (Fig. 1B).
Fig. 1
Association of prioritized entities with neuroinflammation-relevant GO terms. a) Number of prioritized entities associated with the listed GO terms and their descendants, bars indicate total number of entities (1st bars), number of entities annotated by ARUK-UCL (2nd bars) or other contributors (3rd bars). b) Number of annotations for the prioritized entities, contributed by ARUK-UCL or other groups, categorized by entity type. c) A fragment of GO, representing the relationships among some of the terms selected for analyses shown in (a) and (b). (Data from QuickGO: accessed 18 September 2019, filtered by prioritized entities, GO terms listed in Supplementary Table 3 and their descendants, evidence used in manual assertion and contributor).
Impact of improved annotation on clinical data analysis
Re-analyses of AD-associated genes
In order to demonstrate how our annotation approach, focused on neuroinflammation in AD, can contribute to a more informative analysis and interpretation of disease expression data, a functional GO analysis of previously published AD-relevant datasets was undertaken. Avramopoulos et al. [43] had identified two groups of genes in a transcriptomic analysis of the superior temporal lobe, a brain region usually greatly affected by the AD pathology, of late onset AD and control brain samples: one overexpressed in AD (‘Higher in AD’, Supplementary Table 4A), and one underexpressed in AD (‘Lower in AD’, Supplementary Table 4B), relative to age-matched healthy controls [43]. A functional enrichment of these datasets, by Avramopoulos et al., had identified some highly AD-relevant processes, for example, ‘synaptic transmission’. However, numerous, less informative, high-level GO terms, such as ‘mRNA transcription’, and ‘developmental process’, were also identified as enriched in these datasets (Table 1 in Avramopoulos et al. [43]), suggesting a limited depth of annotation information associated with the genes differentially expressed in AD.
The previous analysis of the ‘Higher in AD’ and ‘Lower in AD’ datasets, by Avramopoulos et al. [43], was undertaken using the functional enrichment online analysis tool PANTHER version 6 [39, 74] with Fisher’s test and Bonferroni correction for multiple testing. Therefore, our re-analysis used the same tool and these same parameters, but with more recent GO ontology and annotation data. Genes ‘Higher in AD’ were enriched (overrepresented) for GO terms such as ‘gliogenesis’, ‘regulation of cell migration’, ‘response to cytokine’, and ‘response to stress’ (Table 3A and Supplementary Table 5A), suggesting that there is an increase in neuroinflammatory processes in the analyzed AD cases. Other GO terms identified in the ‘Higher in AD’ group include the highly descriptive ‘regulation of neuron projection development’ as well as the broader GO term ‘nervous system development’, both of which can potentially be indicative of attempted regeneration processes occurring in AD brains. The re-analysis also revealed enrichment of genes associated with more general processes relevant to brain function, for example, ‘establishment or maintenance of cell polarity’ and ‘regulation of signal transduction’ (Supplementary Table 5A); overexpression of genes associated with these ‘house-keeping’ roles in AD brains suggests that these may be compensatory mechanisms, triggered by AD-related stresses. Even though these GO terms had existed in the ontology at the time of the original analysis (data from QuickGO: GO term Change Logs, accessed 7 November 2019), they had not been identified by Avramopoulos et al. [43], restricting data interpretation at the time.
Table 3
Selection of GO terms enriched in a re-analysis of an AD transcriptomic dataset. Selected GO terms identified by PANTHER enrichment analysis of genes differentially expressed in AD. Two groups of genes, identified as ‘Higher in AD’ (A) and ‘Lower in AD’ (B) in Avramopoulos et al., 2011 [43], were analyzed using the PANTHER overrepresentation Test [39, 74]. The full set of enriched GO terms is available in Supplementary Table 5
| A) Enrichment analysis of transcripts expressed at a higher level in AD | |||||
| GO BP | n (N = 20996) | x (X = 487) | Expected | Fold Enrichment | p |
| gliogenesis | 219 | 19 | 5.08 | 3.74 | 2.06E02 |
| regulation of neuron projection development | 501 | 35 | 11.62 | 3.01 | 2.18E-04 |
| regulation of cell migration | 847 | 49 | 19.65 | 2.49 | 1.19E-04 |
| nervous system development | 2351 | 119 | 54.53 | 2.18 | 5.35E-12 |
| response to cytokine | 1114 | 54 | 25.84 | 2.09 | 6.71E-03 |
| response to stress | 3535 | 127 | 81.99 | 1.55 | 3.24E-03 |
| B) Enrichment analysis of transcripts expressed at a lower level in AD | |||||
| GO BP | n (N = 20996) | x (X = 497) | Expected | Fold Enrichment | p |
| regulation of cation channel activity | 180 | 19 | 4.26 | 4.46 | 1.81E-03 |
| regulation of ion transmembrane transporter activity | 263 | 22 | 6.23 | 3.53 | 8.17E-03 |
| synaptic signaling | 459 | 30 | 10.87 | 2.76 | 1.25E-02 |
| behavior | 576 | 34 | 13.63 | 2.49 | 2.59E-02 |
| cellular component organization | 5658 | 182 | 133.93 | 1.36 | 2.85E-02 |
The p-value was adjusted using the Bonferroni correction for multiple testing (significance level < 0.05); N, the total number of human protein-coding genes associated with a GO BP term (background dataset); n, number of protein-coding genes in the background dataset associated with a given GO ID; X, the total number of protein-coding genes in the query dataset; x, number of protein-coding genes in the query dataset associated with a given GO ID; Expected, the number of genes in the query dataset expected to be associated with a given GO term by chance; Fold Enrichment, the ratio of the obtained versus expected number of genes associated with a given GO term in the analyzed group of genes.
This re-analysis of genes ‘Lower in AD’, i.e., having higher levels in healthy brains when compared to AD brains, revealed they were enriched (overrepresented) for GO terms relevant to maintenance of normal neurological functions and processes impaired in AD, such as ‘regulation of cation channel activity’, ‘synaptic signaling’, and ‘behavior’ (Table 3B and Supplementary Table 5B). More general GO terms, identified in this re-analysis and relevant to AD biology, included ‘cellular component organization’. Plausibly, impairments in these processes would hinder any potential regenerative events in inflamed AD brains. In comparison, the original analysis had resulted in identification of the GO terms ‘synaptic transmission’ and ‘ion channel activity’ as enriched in the ‘Lower in AD’ datasets [43], confirming that in 2011 neurological processes impaired in AD had been annotated to a greater extent than neuroinflammatory processes elevated in AD.
Network analysis and bioinformatics-based prediction of neuroinflammatory genes
Two GO term enrichment analyses were performed in Cytoscape 3.7.1 [73] on networks of the prioritized human proteins and miRs, and their interacting partners, in order to delineate more specific roles of these entities in neuroinflammation.
Analysis of the target-centered miR-target network
Firstly, we constructed a network of miR-target associations centered around the prioritized microglial protein-coding genes. We seeded the network with the 40 priority genes (Supplementary Table 1) and imported the associated miR-target molecular interaction data into Cytoscape [73], from the EBI-GOA-miRNA file [52] containing experimentally-validated miR-target interaction data contributed by the British Heart Foundation (BHF)-UCL [80] and ARUK-UCL GO annotation initiatives [52, 81]. The resulting network included a total of 77 nodes, of which only 17 represented mRNA transcripts of the protein-coding genes and 60 represented miRs targeting these mRNAs (Fig. 2, Supplementary Table 6). The low number of mRNAs included in the network reflects the fact that, at the time of GO annotation, we did not find any published experimental evidence demonstrating miR-mediated gene silencing of the remaining 23 protein-coding genes.
Fig. 2
Target-centered miR-target molecular interaction network. This network describes interactions between miRs and the mRNAs encoding AD-relevant microglial proteins. The network was constructed in Cytoscape [73] by seeding with 40 AD-relevant microglial gene symbols (Supplementary Table 1) and importing molecular interaction data from the EBI-GOA-miR file (accessed 1 July 2019). The protein-protein interactions (PPIs) edges were added to the network manually, based on data from another network seeded with the 17 AD-relevant microglial proteins shown in this Figure 2 (Supplementary Figure 1, Supplementary Table 7). The colors of node fragments correspond to GO terms (see key). Data associated with the enriched GO terms displayed in this figure is summarized in Table 4.
![Target-centered miR-target molecular interaction network. This network describes interactions between miRs and the mRNAs encoding AD-relevant microglial proteins. The network was constructed in Cytoscape [73] by seeding with 40 AD-relevant microglial gene symbols (Supplementary Table 1) and importing molecular interaction data from the EBI-GOA-miR file (accessed 1 July 2019). The protein-protein interactions (PPIs) edges were added to the network manually, based on data from another network seeded with the 17 AD-relevant microglial proteins shown in this Figure 2 (Supplementary Figure 1, Supplementary Table 7). The colors of node fragments correspond to GO terms (see key). Data associated with the enriched GO terms displayed in this figure is summarized in Table 4.](https://ip.ios.semcs.net:443/media/jad/2020/75-4/jad-75-4-jad200207/jad-75-jad200207-g002.jpg)
The target-centered miR-target network contained 75 edges representing associations between miRs and the targets of their regulation. As this network only included miR-target interactions, four additional edges, corresponding to protein-protein interactions (PPIs) were manually added, which increased the association between the 5 isolated sub-networks. In order to identify these PPIs, we constructed a network of PPIs only (Supplementary Fig. 1, Supplementary Table 7) by using the 17 protein-coding genes from Fig. 2, as seed nodes, and importing PPI data meeting the International Molecular Exchange standard [82].
GO term enrichment analysis, performed in Cytoscape [73], using the BiNGO [38] and GOlorize [75] plugins (Supplementary Table 8, Table 4, and Fig. 2), demonstrates that among the 60 miRs, regulating the expression of the prioritized protein-coding genes, 17 are overrepresented in ‘regulation of inflammatory response’ (Fig. 2). Of those 17, four are enriched specifically in ‘regulation of neuroinflammatory response’ and one, miR-155-5p, was also in a group of entities overrepresented in ‘regulation of microglial cell activation’.
Table 4
Selection of GO terms enriched in the Cytoscape BiNGO analysis of the target-centered molecular interaction network. The network, shown in Fig. 2, was constructed in Cytoscape [73] by seeding with the 40 prioritized AD-relevant microglial genes (Supplementary Table 1) and importing molecular interaction data from the EBI-GOA-miRNA file [52] (accessed 1 July 2019). All results of the BiNGO enrichment analysis are provided in Supplementary Table 8
| Gene Ontology term | n (N = 52563) | x (X = 77) | Expected | Fold Enrichment | p |
| neuroinflammatory response | 48 | 7 | 0.07 | 99.55 | 8.26E-12 |
| regulation of neuroinflammatory response | 44 | 11 | 0.06 | 170.66 | 5.57E-21 |
| inflammatory response | 570 | 9 | 0.83 | 10.78 | 9.33E-07 |
| regulation of inflammatory response | 407 | 28 | 0.60 | 46.96 | 1.22E-37 |
| microglial cell activation | 37 | 6 | 0.05 | 110.70 | 1.70E-10 |
| regulation of microglial cell activation | 21 | 5 | 0.03 | 162.53 | 1.02E-09 |
| cytokine-mediated signaling pathway | 875 | 11 | 1.28 | 8.58 | 3.82E-07 |
| regulation of cytokine-mediated signaling pathway | 181 | 12 | 0.27 | 45.26 | 9.10E-16 |
| regulation of cytokine production | 793 | 35 | 1.16 | 30.13 | 4.73E-41 |
Key: Gene Ontology (GO) term name; n, number of entities associated with a given GO ID in the whole reference set of 52563 human entities annotated with GO (N); x, number of entities associated with a given GO ID in the analyzed network of a total number of 410 entities (X); Expected, the number of genes in the query dataset expected to be associated with a given GO term by chance; Fold Enrichment, the ratio of the obtained versus expected number of genes associated with a given GO term in the analyzed group of genes; p-value, corrected p-value obtained using the Benjamini & Hochberg False Discovery Rate (FDR) correction (significance level chosen as 0.05).
In context of protein (mRNA target) nodes, the GO term enrichment analysis revealed that seven of the 17 prioritized proteins (CX3CL1, GRN, IFNG, IL6, TNF, TREM2, TYROBP) were associated with the GO term ‘microglial cell activation’ or one of its regulation terms (Fig. 2). Furthermore, additional two (IL1B, MMP9) and four (CD47, CSF1 R, LPL, SIRPA) proteins were associated with the more general, but related, parent (or regulatory parent) terms ‘neuroinflammatory response’ and ‘inflammatory response’, respectively.
Other GO terms, identified in the enrichment analysis and highlighted in Fig. 2, represent ‘cytokine-mediated signaling pathway’ and its regulation and also ‘regulation of cytokine production’. Fourteen of the protein-coding genes and 27 of the sixty miRs in the network are enriched for at least one of these cytokine-related GO terms (Fig. 2).
Several highly evolutionarily conserved miRs are encoded as polycistronic clusters containing paralogous genes [83]. We hypothesized that some miRs in the miR-target network, involved in silencing of the same gene, may indeed be encoded by the same polycistron. Interestingly, the gene encoding the SIRPA protein is silenced by two miRs from the hsa-miR-17~92 cluster, hsa-miR-17-5p, and hsa-miR-20a-5p, which are also paralogues of each other [83]. Moreover, hsa-miR-17-5p regulates the expression of TNF, which is also regulated by one more member of the hsa-miR-17~92 cluster, hsa-miR-19a-3p [83]. In agreement with previous suggestions [83], results presented in Fig. 2 support the hypothesis that miRs encoded on one cluster cooperate with each other to regulate the same downstream processes.
While, several of the miRs in this network have not yet been associated with the highlighted AD-relevant inflammatory processes, this is likely due to either a lack of experimental data supporting their role, or a need for further curation of these miRs. A good example of this is the hub miR node hsa-miR-29b-3p, which has not been enriched in any of the highlighted processes (grey triangle node in Fig. 2). This miR has been shown to regulate cell migration and differentiation [84] and regulates the expression of three proteins (CX3CL1, GRN, IFNG) overrepresented in ‘microglial cell activation’ and ‘neuroinflammatory response’ (of which two are also enriched in cytokine-relevant processes), as well as one protein (LPL) overrepresented in ‘regulation of inflammatory response’ and ‘regulation of cytokine production’. It could be inferred from this network that hsa-miR-29b-3p is also likely to be involved in regulating these neuroinflammation-relevant processes; however, relevant GO terms have not been associated with hsa-miR-29b-3p, because we had not found published experimental evidence to support the direct role of hsa-miR-29b-3p in these neuroinflammatory processes, at the time of GO annotation.
Analysis of the miR-centered miR-target network
A network of miR-target associations centered around the 66 human miRs, prioritized for annotation as a part of this project was also constructed (Supplementary Table 9). The network was seeded with the prioritized miRs and miR-target interaction data from the EBI-GOA-miRNA file [52] was imported into Cytoscape [73]. This resulted in a network of 415 nodes and 524 edges (Supplementary Figure 2).
A GO term enrichment analysis, performed in Cytoscape [73], using the BiNGO [38] and GOlorize [75] plugins, reveals that 14 entities were overrepresented for the ‘neuroinflammatory response’ and 13 for its regulation GO term (Supplementary Table 10, Supplementary Figure 2, Table 5). Four of the entities enriched for ‘regulation of neuroinflammatory response’ were miRs (hsa-miR-26a-5p, hsa-miR-155-5p, hsa-miR-181b-5p, hsa-miR-195-5p). A sub-network of these miRs was extracted from the complete network in order to identify the targets of their regulation with putative new roles in (regulation of) neuroinflammatory processes. The sub-network shows that the four miRs collectively regulate the expression of sixty target entities (Fig. 3). Twenty of the regulation targets have not yet been associated with a neuroinflammatory process. This may be either because these entities do not in fact have any roles in neuroinflammation, or, if they are involved in these processes, then there has not been any published experimental evidence available to support these roles, or, even if published information is available, it has not been annotated yet. Consequently, this group of protein-coding genes, silenced by miRs implicated in regulating neuroinflammation, might include candidates with novel putative roles in neuroinflammatory response.
Table 5
Selection of GO terms enriched in the Cytoscape BiNGO analysis of the miR-centered molecular interaction network. The network, shown in Supplementary Figure 2, was constructed in Cytoscape [73] by seeding with the 66 miRs prioritized for annotation (Supplementary Table 2) and importing molecular interaction data from the EBI-GOA-miRNA file [52] (accessed 19 August 2019). All results of the BiNGO enrichment analysis are provided in Supplementary Table 10
| Gene Ontology term | n (N = 52563) | x (X = 410) | Expected | Fold enrichment | p |
| neuroinflammatory response | 48 | 14 | 0.37 | 37.39 | 1.12E-17 |
| regulation of neuroinflammatory response | 44 | 13 | 0.34 | 37.88 | 1.53E-16 |
| inflammatory response | 570 | 49 | 4.45 | 11.02 | 4.09E-34 |
| regulation of inflammatory response | 407 | 60 | 3.17 | 18.90 | 7.87E-56 |
| microglial cell activation | 37 | 10 | 0.29 | 34.65 | 1.81E-12 |
| regulation of microglial cell activation | 21 | 6 | 0.16 | 36.63 | 5.81E-08 |
| cytokine-mediated signaling pathway | 53 | 6 | 0.41 | 14.51 | 1.40E-05 |
| regulation of cytokine-mediated signaling pathway | 181 | 28 | 1.41 | 19.83 | 1.48E-26 |
| regulation of cytokine production | 793 | 84 | 6.19 | 13.58 | 7.80E-67 |
Key: Gene Ontology (GO) term name; n, number of entities associated with a given GO ID in the whole reference set of 52563 human entities annotated with GO (N); x, number of entities associated with a given GO ID in the analyzed network of a total number of 410 entities (X); Expected, the number of genes in the query dataset expected to be associated with a given GO term by chance; Fold Enrichment, the ratio of the obtained versus expected number of genes associated with a given GO term in the analyzed group of genes; p-value, corrected p-value obtained using the Benjamini & Hochberg False Discovery Rate (FDR) correction (significance level chosen as 0.05).
Fig. 3
MiR-centered miR-target molecular interaction sub-network constructed by selecting four miRs enriched for ‘regulation of neuroinflammatory response’ and their direct targets. The sub-network was constructed in Cytoscape [73]. BiNGO [38] results (Supplementary Figure 2 and Supplementary Table 10) were used to identify relevant nodes and the first neighbors of the selected nodes. The four hub nodes represent miRs. The hub nodes are linked to the target nodes by the dashed edges, which represent experimentally demonstrated associations between miRs and their targets shown as nodes labelled with the HGNC-approved gene symbols. The purple cap at the end of each edge faces the target of miR silencing. The BiNGO enrichment analysis had been performed on the original large network of 415 nodes, shown in Supplementary Figure 2 and Supplementary Table 9. Key BiNGO analysis results are shown Table 5; all of the analysis results are provided in Supplementary Table 10. The background colors of the nodes’ fragments correspond to GO terms shown on the same background colors in the ‘Key to background colors’ text box.
![MiR-centered miR-target molecular interaction sub-network constructed by selecting four miRs enriched for ‘regulation of neuroinflammatory response’ and their direct targets. The sub-network was constructed in Cytoscape [73]. BiNGO [38] results (Supplementary Figure 2 and Supplementary Table 10) were used to identify relevant nodes and the first neighbors of the selected nodes. The four hub nodes represent miRs. The hub nodes are linked to the target nodes by the dashed edges, which represent experimentally demonstrated associations between miRs and their targets shown as nodes labelled with the HGNC-approved gene symbols. The purple cap at the end of each edge faces the target of miR silencing. The BiNGO enrichment analysis had been performed on the original large network of 415 nodes, shown in Supplementary Figure 2 and Supplementary Table 9. Key BiNGO analysis results are shown Table 5; all of the analysis results are provided in Supplementary Table 10. The background colors of the nodes’ fragments correspond to GO terms shown on the same background colors in the ‘Key to background colors’ text box.](https://ip.ios.semcs.net:443/media/jad/2020/75-4/jad-75-4-jad200207/jad-75-jad200207-g003.jpg)
This evaluation implies that a GO term enrichment network analysis can be a helpful tool for identifying candidate entities for future functional studies and/or knowledge curation initiatives in a highly targeted manner. Additionally, our re-analyses demonstrate how the GO resource has been improved in the area of neuroinflammation and now allows for a better interpretation and understanding of neurobiological studies.
DISCUSSION
The main finding of the present study is that recent improvements to the GO resource, focusing on aspects relevant to neuroinflammation, have allowed for a more informative re-analysis and interpretation of a decade-old dataset of genes differentially expressed in AD [43]. Additionally, we demonstrate that a GO term enrichment analysis performed on a network of miR-target interactions is a useful tool for identification and prioritization of biological entities with probable novel roles in neuroinflammation, thus, informing future studies.
The first goal of our GO annotation project was to identify microglial proteins with roles in AD [54, 55] (Supplementary Table 1), which subsequently paved the way for identification of miRs involved in their silencing (Supplementary Table 2). Protein annotation using GO began over 20 years ago [29, 30] resulting in a breadth of information having already being captured for the microglial proteins, which we prioritized for this project. Consequently, our annotation objective was to associate more descriptive GO terms with these proteins and to capture experimental support for their fundamental molecular activities, e.g., whether a protein was a kinase, or a transmembrane transporter, etc., as well as their roles specifically in neuroinflammatory processes, for instance, ‘regulation of microglial cell activation’. It was also important for this project to curate the role of these proteins in other processes relevant to AD, such as ‘memory or learning’, ‘modulation of age-related behavioral decline’, and ‘regulation of synaptic plasticity’.
On the other hand, since scientific interest in ncRNAs is more recent, and so fewer articles describing their roles in cellular events have been published to date, our second objective was to annotate every article we could find, which described an interaction between a miR and the mRNA transcript of a protein-coding gene from the priority list (Supplementary Table 1). A total of 379 articles describing the prioritized proteins and miRs were thoroughly curated using the full article annotation approach, thus increasing the breadth of the captured biological knowledge and reducing annotation bias (Table 1). This led to an increase in the number of GO terms associated with the prioritized entities and other proteins, ncRNAs and molecular complexes, with a total of 3,000 GO terms associated with almost 500 entities. We additionally achieved a greater specificity of annotations for the prioritized entities, as indicated by double the number of annotations per prioritized entity in comparison to any other entity annotated as a part of this project (Table 2:>12 annotations per prioritized entity versus > 6 annotations per any entity). Moreover, through our process-focused annotation approach we substantially increased the number of entities associated with neuroinflammatory GO terms (Supplementary sTable 3); now over a third of all GO annotations relevant to neuroinflammation will have resulted from this project. Consequently, 60% of neuroinflammation-relevant annotations associated with the 106 prioritized entities were created by this project (Fig. 1).
Our next aim was to demonstrate how our contribution to the neuroinflammatory process branch of GO has led to a more meaningful interpretation of AD gene expression data. A previously published transcriptomic study, which had identified two groups of genes: ‘Higher in AD’ and ‘Lower in AD’ (Supplementary Table 4) and had analyzed the data using PANTHER [39, 43] was selected for re-analysis. The GO term enrichment analysis of these datasets was repeated using the same tool and statistical parameters in order to faithfully reproduce their research method, but with the current GO data version. This led to a substantially more informative analysis in comparison to findings published nearly a decade ago [43]. For instance, we found that the genes ‘Higher in AD’ were associated with ‘gliogenesis’, ‘regulation of neuron projection development’, or ‘response to cytokine’ (Table 3A and Supplementary Table 5A), indicating an increase in neuroinflammation in the AD cases. These GO terms had not been identified in the original analysis [43], even though they had existed in GO at the time (data from QuickGO: GO term Change Logs, accessed 7 November 2019). On the other hand, genes ‘Lower in AD’ were enriched for GO terms, such as ‘regulation of ion transmembrane transporter activity’, or ‘behavior’ (Table 3B and Supplementary Table 5B), i.e., key processes perturbed in AD. Thus, this re-analysis demonstrates how continuous enhancements of the GO resource, including our most recent contributions, have improved the applicability of GO for analyses of AD data.
Another objective of this study was to show the applicability of performing functional GO term enrichment analyses of miR-target interaction networks for identification of entities with putative novel roles. Previous studies revealed a number of miRs implicated in dementia (reviewed in [15, 85, 86]). Our analyses revealed that at least 66 miRs (Fig. 2) regulate mRNAs encoding the 40 AD-relevant priority proteins involved in inflammatory and neuroinflammatory processes. However, only 17 of these 66 miRs have to date been associated with GO terms describing the regulation of neuroinflammatory processes. Given our thorough and systematic approach to miR annotation, this allows us to infer that these miRs have not yet been studied in context of neuroinflammation, or even systemic inflammation, yet they are likely implicated in these processes. This hypothesis refers especially to hsa-miR-29b-3p, which regulates the expression of three proteins involved in ‘microglial cell activation’ (CX3CL1, GRN, IFNG; Fig. 2). Hence, this investigation demonstrates how functional analyses of molecular interaction networks can be used to reveal knowledge gaps, thus allowing for a better targeted design of future functional experiments and/or prioritization of biological entities for data curation initiatives.
The current project, focusing on biocuration of microglial proteins involved in AD and miRs regulating their expression, is a continuation of our previous work on GO annotation of proteins interacting with amyloid-β and tau [44]. It must be emphasized that GO is a controlled biological vocabulary, or ontology, which describes the normal physiological roles of biological entities [29, 30], such as proteins or ncRNAs. Therefore, similarly to a previous project [87], we have been capturing normal roles of entities implicated in AD, which complements other collaborative initiatives aiming to semantically describe disease phenotypes and processes occurring during AD [88–91]. The advantage of GO is that it is a well-established, regularly updated, and quality-controlled ontology [29, 30], imported by a variety of tools [35–39, 92], which has been used for analyses of data across a wide range of biomedical fields [43, 62, 93–95], including in clinical practice [96].
In conclusion, through our focused and systematic full article annotation approach, we have contributed a breadth of new knowledge about neuroinflammation and related biological aspects to the GO resource by capturing 3,084 new annotations for 494 entities, i.e., on average six new annotations per entity. This included a total of 1,352 annotations for 40 prioritized microglial proteins implicated in AD and 66 miRs regulating their expression, yielding an average of twelve annotations per prioritized entity. All of the GO data is freely available and can be downloaded from the GO browsers, QuickGO [57, 97], or AmiGO [56].
We subsequently demonstrated how our contributions to the GO resource have rendered it a more helpful tool for meaningful interpretation of AD datasets by re-analyzing gene expression data published a decade ago, using the publicly available PANTHER tool [39, 74], which had been used in the original study [43].
Finally, our GO term enrichment analysis of a network of miR-target interactions, validated the applicability of the GO resource for identification of potential novel roles of these biological entities, using the freely available Cytoscape tool [73] with BiNGO [38] and GOlorize [75] plugins.
Collectively, our previous, current and future biocuration activities, concentrated on GO annotation of normal biological processes and entities perturbed in AD, will help to improve the understanding of molecular bases of this disease, thus providing a more solid foundation for development of diagnostic tools and treatments.
ACKNOWLEDGMENTS
This project was supported by Alzheimer’s Research United Kingdom grants ARUK-NAS2017A-1 and ARUK-NSG2018-003 and by the National Institute for Health Research University College London Hospitals Biomedical Research Centre. Many of the Gene Ontology annotations included in this work were provided by the Gene Ontology Consortium (supported by a grant from the National Human Genome Research Institute; grant U41 HG002273 to J.A. Blake, J.M. Cherry, C.J. Mungall, P.W. Sternberg, P.D. Thomas) and the UniProt Consortium (supported by a grant from the National Eye Institute, National Human Genome Research Institute, National Heart, Lung, and Blood Institute, National Institute on Aging, National Institute of Allergy and Infectious Diseases, National Institute of Diabetes and Digestive and Kidney Diseases, National Institute of General Medical Sciences, and National Institute of Mental Health of the National Institutes of Health).
The funders had no role in the design of the study; in the collection, analyses, or interpretation of data; in the writing of the manuscript, or in the decision to publish the results.
We thank our expert advisors: John Hardy, Paul Whiting, and Dervis Salih (UCL), Elizabeth Wu, Kelly Dakin, Kathleen Zahs, and Marina Chicurel (ALZFORUM), for sharing their knowledge and helpful discussions on annotation priorities. We also thank the many biocurators, editors, and other members of the Gene Ontology Consortium who have contributed to the annotation of AD-relevant proteins and miRs and the development of the Gene Ontology: with special thanks to Pascale Gaudet (Swiss Institute of Bioinformatics), David P. Hill (The Jackson Laboratory), and Kimberly M. Van Auken (California Institute of Technology) for their support with Gene Ontology development and revisions as well as annotation reviews and guidelines, and Huaiyu Mi (University of Southern California) for his help with PANTHER. We also thank the MSc project students at UCL who contributed miR annotations for projects funded by the British Heart Foundation: Zara Umrao, Vanessa Acquaah, and Hao Chen. Thanks also go to Beatrice Costa, who attended our Bioinformatics Resources workshop at UCL in spring 2019, for her insightful comments on using Cytoscape.
Authors’ disclosures available online (https://www.j-alz.com/manuscript-disclosures/20-0207r1).
SUPPLEMENTARY MATERIAL
[1] The supplementary material is available in the electronic version of this article: https://dx.doi.org/10.3233/JAD-200207.
REFERENCES
[1] | Lane CA , Hardy J , Schott JM ((2018) ) Alzheimer’s disease. Eur J Neurol 25: , 59–70. |
[2] | Griffiths HH , Morten IJ , Hooper NM ((2008) ) Emerging and potential therapies for Alzheimer’s disease. Expert Opin Ther Targets 12: , 693–704. |
[3] | Loera-Valencia R , Cedazo-Minguez A , Kenigsberg P , Page G , Duarte A , Giusti P , Zusso M , Robert P , Frisoni GB , Cattaneo A , Zille M , Boltze J , Cartier N , Buee L , Johansson G , Winblad B ((2019) ) Current and emerging avenues for Alzheimer’s disease drug targets.398-437. J Intern Med 286: . |
[4] | Watanabe Y , Hirao Y , Kasuga K , Tokutake T , Semizu Y , Kitamura K , Ikeuchi T , Nakamura K , Yamamoto T ((2019) ) Molecular network analysis of the urinary proteome of Alzheimer’s disease patients. Dement Geriatr Cogn Dis Extra 9: , 53–65. |
[5] | White CS , Lawrence CB , Brough D , Rivers-Auty J ((2017) ) Inflammasomes as therapeutic targets for Alzheimer’s disease. Brain Pathol 27: , 223–234. |
[6] | Lénárt N , Brough D , Dénes Á ((2016) ) Inflammasomes link vascular disease with neuroinflammation and brain disorders. J Cereb Blood Flow Metab 36: , 1668–1685. |
[7] | Guerriero F , Sgarlata C , Francis M , Maurizi N , Faragli A , Perna S , Rondanelli M , Rollone M , Ricevuti G ((2017) ) Neuroinflammation, immune system and Alzheimer disease: Searching for the missing link. Aging Clin Exp Res 29: , 821–831. |
[8] | Villegas-Llerena C , Phillips A , Garcia-Reitboeck P , Hardy J , Pocock JM ((2016) ) Microglial genes regulating neuroinflammation in the progression of Alzheimer’s disease. Curr Opin Neurobiol 36: , 74–81. |
[9] | Keren-Shaul H , Spinrad A , Weiner A , Matcovitch-Natan O , Dvir-Szternfeld R , Ulland TK , David E , Baruch K , Lara-Astaiso D , Toth B , Itzkovitz S , Colonna M , Schwartz M , Amit I ((2017) ) A unique microglia type associated with restricting development of Alzheimer’s disease. Cell 169: , 1276–1290.e1217. |
[10] | Hammond TR , Dufort C , Dissing-Olesen L , Giera S , Young A , Wysoker A , Walker AJ , Gergits F , Segel M , Nemesh J , Marsh SE , Saunders A , Macosko E , Ginhoux F , Chen J , Franklin RJM , Piao X , McCarroll SA , Stevens B ((2019) ) Single-cell RNA sequencing of microglia throughout the mouse lifespan and in the injured brain reveals complex cell-state changes. Immunity 50: , 253–271.e256. |
[11] | Landau SM , Frosch MP ((2014) ) Tracking the earliest pathologic changes in Alzheimer disease. Neurology 82: , 1576–1577. |
[12] | Swarbrick S , Wragg N , Ghosh S , Stolzing A ((2019) ) Systematic review of miRNA as biomarkers in Alzheimer’s disease. Mol Neurobiol 56: , 6156–6167. |
[13] | Veremeyko T , Starossom SC , Weiner HL , Ponomarev ED ((2012) ) Detection of microRNAs in microglia by real-time PCR in normal CNS and during neuroinflammation. J Vis Exp, doi: 10.3791/4097. |
[14] | Putteeraj M , Fairuz YM , Teoh SL ((2017) ) MicroRNA dysregulation in Alzheimer’s disease. CNS Neurol Disord Drug Targets 16: , 1000–1009. |
[15] | Ramakrishna S , Muddashetty RS ((2019) ) Emerging role of microRNAs in dementia. J Mol Biol 431: , 1743–1762. |
[16] | Jaber V , Zhao Y , Lukiw WJ ((2017) ) Alterations in micro RNA-messenger RNA (miRNA-mRNA) Coupled signaling networks in sporadic Alzheimer’s disease (AD) hippocampal CA1. J Alzheimers Dis Parkinsonism 7: , 312. |
[17] | Barnes DE , Yaffe K ((2011) ) The projected effect of risk factor reduction on Alzheimer’s disease prevalence. Lancet Neurol 10: , 819–828. |
[18] | Sassi C , Nalls MA , Ridge PG , Gibbs JR , Ding J , Lupton MK , Troakes C , Lunnon K , Al-Sarraj S , Brown KS , Medway C , Clement N , Lord J , Turton J , Bras J , Almeida MR , ARUK Consortium, Holstege H , Louwersheimer E , van der Flier WM , Scheltens P , Van Swieten JC , Santana I , Oliveira C , Morgan K , Powell JF , Kauwe JS , Cruchaga C , Goate AM , Singleton AB , Guerreiro R , Hardy J ((2016) ) ABCA7 p.G215S as potential protective factor for Alzheimer’s disease. Neurobiol Aging 46: , 235.e231–239. |
[19] | Sala Frigerio C , Wolfs L , Fattorelli N , Thrupp N , Voytyuk I , Schmidt I , Mancuso R , Chen WT , Woodbury ME , Srivastava G , Möller T , Hudry E , Das S , Saido T , Karran E , Hyman B , Perry VH , Fiers M , De Strooper B ((2019) ) The major risk factors for Alzheimer’s disease: Age, sex, and genes modulate the microglia response to Aβ plaques. Cell Rep 27: , 1293–1306.e1296. |
[20] | Van Cauwenberghe C , Van Broeckhoven C , Sleegers K ((2016) ) The genetic landscape of Alzheimer disease: Clinical implications and perspectives. Genet Med 18: , 421–430. |
[21] | Carmona S , Hardy J , Guerreiro R ((2018) ) The genetic landscape of Alzheimer disease. Handb Clin Neurol 148: , 395–408. |
[22] | Cooper-Knock J , Kirby J , Ferraiuolo L , Heath PR , Rattray M , Shaw PJ ((2012) ) Gene expression profiling in human neurodegenerative disease. Nat Rev Neurol 8: , 518–530. |
[23] | Guerreiro R , Wojtas A , Bras J , Carrasquillo M , Rogaeva E , Majounie E , Cruchaga C , Sassi C , Kauwe JS , Younkin S , Hazrati L , Collinge J , Pocock J , Lashley T , Williams J , Lambert JC , Amouyel P , Goate A , Rademakers R , Morgan K , Powell J , St George-Hyslop P , Singleton A , Hardy J , Alzheimer Genetic Analysis Group ((2013) ) TREM2 variants in Alzheimer’s disease. N Engl J Med 368: , 117–127. |
[24] | Kang MG , Byun K , Kim JH , Park NH , Heinsen H , Ravid R , Steinbusch HW , Lee B , Park YM ((2015) ) Proteogenomics of the human hippocampus: The road ahead. Biochim Biophys Acta 1854: , 788–797. |
[25] | Adlakha YK , Saini N ((2014) ) Brain microRNAs and insights into biological functions and therapeutic potential of brain enriched miRNA-128. Mol Cancer 13: , 33. |
[26] | Jansen IE , Savage JE , Watanabe K , Bryois J , Williams DM , Steinberg S , Sealock J , Karlsson IK , Hägg S , Athanasiu L , Voyle N , Proitsi P , Witoelar A , Stringer S , Aarsland D , Almdahl IS , Andersen F , Bergh S , Bettella F , Bjornsson S , Brækhus A , Bråthen G , de Leeuw C , Desikan RS , Djurovic S , Dumitrescu L , Fladby T , Hohman TJ , Jonsson PV , Kiddle SJ , Rongve A , Saltvedt I , Sando SB , Selbæk G , Shoai M , Skene NG , Snaedal J , Stordal E , Ulstein ID , Wang Y , White LR , Hardy J , Hjerling-Leffler J , Sullivan PF , van der Flier WM , Dobson R , Davis LK , Stefansson H , Stefansson K , Pedersen NL , Ripke S , Andreassen OA , Posthuma D ((2019) ) Genome-wide meta-analysis identifies new loci and functional pathways influencing Alzheimer’s disease risk. Nat Genet 51: , 404–413. |
[27] | Kunkle BW , Grenier-Boley B , Sims R , Bis JC , Damotte V , Naj AC , Boland A , Vronskaya M , van der Lee SJ , Amlie-Wolf A , Bellenguez C , Frizatti A , Chouraki V , Martin ER , Sleegers K , Badarinarayan N , Jakobsdottir J , Hamilton-Nelson KL , Moreno-Grau S , Olaso R , Raybould R , Chen Y , Kuzma AB , Hiltunen M , Morgan T , Ahmad S , Vardarajan BN , Epelbaum J , Hoffmann P , Boada M , Beecham GW , Garnier JG , Harold D , Fitzpatrick AL , Valladares O , Moutet ML , Gerrish A , Smith AV , Qu L , Bacq D , Denning N , Jian X , Zhao Y , Del Zompo M , Fox NC , Choi SH , Mateo I , Hughes JT , Adams HH , Malamon J , Sanchez-Garcia F , Patel Y , Brody JA , Dombroski BA , Naranjo MCD , Daniilidou M , Eiriksdottir G , Mukherjee S , Wallon D , Uphill J , Aspelund T , Cantwell LB , Garzia F , Galimberti D , Hofer E , Butkiewicz M , Fin B , Scarpini E , Sarnowski C , Bush WS , Meslage S , Kornhuber J , White CC , Song Y , Barber RC , Engelborghs S , Sordon S , Voijnovic D , Adams PM , Vandenberghe R , Mayhaus M , Cupples LA , Albert MS , De Deyn PP , Gu W , Himali JJ , Beekly D , Squassina A , Hartmann AM , Orellana A , Blacker D , Rodriguez-Rodriguez E , Lovestone S , Garcia ME , Doody RS , Munoz-Fernadez C , Sussams R , Lin H , Fairchild TJ , Benito YA , Holmes C , Karamujić-Čomić H , Frosch MP , Thonberg H , Maier W , Roschupkin G , Ghetti B , Giedraitis V , Kawalia A , Li S , Huebinger RM , Kilander L , Moebus S , Hernández I , Kamboh MI , Brundin R , Turton J , Yang Q , Katz MJ , Concari L , Lord J , Beiser AS , Keene CD , Helisalmi S , Kloszewska I , Kukull WA , Koivisto AM , Lynch A , Tarraga L , Larson EB , Haapasalo A , Lawlor B , Mosley TH , Lipton RB , Solfrizzi V , Gill M , Longstreth WT , Montine TJ , Frisardi V , Diez-Fairen M , Rivadeneira F , Petersen RC , Deramecourt V , Alvarez I , Salani F , Ciaramella A , Boerwinkle E , Reiman EM , Fievet N , Rotter JI , Reisch JS , Hanon O , Cupidi C , Andre Uitterlinden AG , Royall DR , Dufouil C , Maletta RG , de Rojas I , Sano M , Brice A , Cecchetti R , George-Hyslop PS , Ritchie K , Tsolaki M , Tsuang DW , Dubois B , Craig D , Wu CK , Soininen H , Avramidou D , Albin RL , Fratiglioni L , Germanou A , Apostolova LG , Keller L , Koutroumani M , Arnold SE , Panza F , Gkatzima O , Asthana S , Hannequin D , Whitehead P , Atwood CS , Caffarra P , Hampel H , Quintela I , Carracedo Á , Lannfelt L , Rubinsztein DC , Barnes LL , Pasquier F , Frölich L , Barral S , McGuinness B , Beach TG , Johnston JA , Becker JT , Passmore P , Bigio EH , Schott JM , Bird TD , Warren JD , Boeve BF , Lupton MK , Bowen JD , Proitsi P , Boxer A , Powell JF , Burke JR , Kauwe JSK , Burns JM , Mancuso M , Buxbaum JD , Bonuccelli U , Cairns NJ , McQuillin A , Cao C , Livingston G , Carlson CS , Bass NJ , Carlsson CM , Hardy J , Carney RM , Bras J , Carrasquillo MM , Guerreiro R , Allen M , Chui HC , Fisher E , Masullo C , Crocco EA , DeCarli C , Bisceglio G , Dick M , Ma L , Duara R , Graff-Radford NR , Evans DA , Hodges A , Faber KM , Scherer M , Fallon KB , Riemenschneider M , Fardo DW , Heun R , Farlow MR , Kölsch H , Ferris S , Leber M , Foroud TM , Heuser I , Galasko DR , Giegling I , Gearing M , Hüll M , Geschwind DH , Gilbert JR , Morris J , Green RC , Mayo K , Growdon JH , Feulner T , Hamilton RL , Harrell LE , Drichel D , Honig LS , Cushion TD , Huentelman MJ , Hollingworth P , Hulette CM , Hyman BT , Marshall R , Jarvik GP , Meggy A , Abner E , Menzies GE , Jin LW , Leonenko G , Real LM , Jun GR , Baldwin CT , Grozeva D , Karydas A , Russo G , Kaye JA , Kim R , Jessen F , Kowall NW , Vellas B , Kramer JH , Vardy E , LaFerla FM , Jöckel KH , Lah JJ , Dichgans M , Leverenz JB , Mann D , Levey AI , Pickering-Brown S , Lieberman AP , Klopp N , Lunetta KL , Wichmann HE , Lyketsos CG , Morgan K , Marson DC , Brown K , Martiniuk F , Medway C , Mash DC , Nöthen MM , Masliah E , Hooper NM , McCormick WC , Daniele A , McCurry SM , Bayer A , McDavid AN , Gallacher J , McKee AC , van den Bussche H , Mesulam M , Brayne C , Miller BL , Riedel-Heller S , Miller CA , Miller JW , Al-Chalabi A , Morris JC , Shaw CE , Myers AJ , Wiltfang J , O’Bryant S , Olichney JM , Alvarez V , Parisi JE , Singleton AB , Paulson HL , Collinge J , Perry WR , Mead S , Peskind E , Cribbs DH , Rossor M , Pierce A , Ryan NS , Poon WW , Nacmias B , Potter H , Sorbi S , Quinn JF , Sacchinelli E , Raj A , Spalletta G , Raskind M , Caltagirone C , Bossù P , Orfei MD , Reisberg B , Clarke R , Reitz C , Smith AD , Ringman JM , Warden D , Roberson ED , Wilcock G , Rogaeva E , Bruni AC , Rosen HJ , Gallo M , Rosenberg RN , Ben-Shlomo Y , Sager MA , Mecocci P , Saykin AJ , Pastor P , Cuccaro ML , Vance JM , Schneider JA , Schneider LS , Slifer S , Seeley WW , Smith AG , Sonnen JA , Spina S , Stern RA , Swerdlow RH , Tang M , Tanzi RE , Trojanowski JQ , Troncoso JC , Van Deerlin VM , Van Eldik LJ , Vinters HV , Vonsattel JP , Weintraub S , Welsh-Bohmer KA , Wilhelmsen KC , Williamson J , Wingo TS , Woltjer RL , Wright CB , Yu CE , Yu L , Saba Y , Pilotto A , Bullido MJ , Peters O , Crane PK , Bennett D , Bosco P , Coto E , Boccardi V , De Jager PL , Lleo A , Warner N , Lopez OL , Ingelsson M , Deloukas P , Cruchaga C , Graff C , Gwilliam R , Fornage M , Goate AM , Sanchez-Juan P , Kehoe PG , Amin N , Ertekin-Taner N , Berr C , Debette S , Love S , Launer LJ , Younkin SG , Dartigues JF , Corcoran C , Ikram MA , Dickson DW , Nicolas G , Campion D , Tschanz J , Schmidt H , Hakonarson H , Clarimon J , Munger R , Schmidt R , Farrer LA , Van Broeckhoven C , C O’Donovan M , DeStefano AL , Jones L , Haines JL , Deleuze JF , Owen MJ , Gudnason V , Mayeux R , Escott-Price V , Psaty BM , Ramirez A , Wang LS , Ruiz A , van Duijn CM , Holmans PA , Seshadri S , Williams J , Amouyel P , Schellenberg GD , Lambert JC , Pericak-Vance MA , Alzheimer Disease Genetics Consortium (ADGC); European Alzheimer’s Disease Initiative (EADI); Cohorts for Heart and Aging Research in Genomic Epidemiology Consortium (CHARGE); Genetic and Environmental Risk in AD/Defining Genetic, Polygenic and Environmental Risk for Alzheimer’s Disease Consortium (GERAD/PERADES) ((2019) ) Genetic meta-analysis of diagnosed Alzheimer’s disease identifies new risk loci and implicates Aβ, tau, immunity and lipid processing. Nat Genet 51: , 414–430. |
[28] | Salih DA , Bayram S , Guelfi S , Reynolds RH , Shoai M , Ryten M , Brenton JW , Zhang D , Matarin M , Botia JA , Shah R , Brookes KJ , Guetta-Baranes T , Morgan K , Bellou E , Cummings DM , Escott-Price V , Hardy J ((2019) ) Genetic variability in response to amyloid beta deposition influences Alzheimer’s disease risk. Brain Commun 1: , fcz022. |
[29] | Ashburner M , Ball CA , Blake JA , Botstein D , Butler H , Cherry JM , Davis AP , Dolinski K , Dwight SS , Eppig JT , Harris MA , Hill DP , Issel-Tarver L , Kasarskis A , Lewis S , Matese JC , Richardson JE , Ringwald M , Rubin GM , Sherlock G ((2000) ) Gene ontology: Tool for the unification of biology. The Gene Ontology Consortium. Nat Genet 25: , 25–29. |
[30] | The Gene Ontology Consortium ((2019) ) The Gene Ontology Resource: 20 years and still GOing strong. Nucleic Acids Res 47: , D330–D338. |
[31] | Cambiaghi A , Ferrario M , Masseroli M ((2017) ) Analysis of metabolomic data: Tools, current strategies and future challenges for omics data integration. Brief Bioinform 18: , 498–510. |
[32] | Fabregat A , Sidiropoulos K , Garapati P , Gillespie M , Hausmann K , Haw R , Jassal B , Jupe S , Korninger F , McKay S , Matthews L , May B , Milacic M , Rothfels K , Shamovsky V , Webber M , Weiser J , Williams M , Wu G , Stein L , Hermjakob H , D’Eustachio P ((2016) ) The Reactome pathway Knowledgebase. Nucleic Acids Res 44: , D481–487. |
[33] | Kanehisa M , Sato Y , Kawashima M , Furumichi M , Tanabe M ((2016) ) KEGG as a reference resource for gene and protein annotation. Nucleic Acids Res 44: , D457–462. |
[34] | Orchard S , Ammari M , Aranda B , Breuza L , Briganti L , Broackes-Carter F , Campbell NH , Chavali G , Chen C , del-Toro N , Duesbury M , Dumousseau M , Galeota E , Hinz U , Iannuccelli M , Jagannathan S , Jimenez R , Khadake J , Lagreid A , Licata L , Lovering RC , Meldal B , Melidoni AN , Milagros M , Peluso D , Perfetto L , Porras P , Raghunath A , Ricard-Blum S , Roechert B , Stutz A , Tognolli M , van Roey K , Cesareni G , Hermjakob H ((2014) ) The MIntAct project–IntAct as a common curation platform for 11 molecular interaction databases. Nucleic Acids Res 42: , D358–363. |
[35] | Reimand J , Arak T , Adler P , Kolberg L , Reisberg S , Peterson H , Vilo J ((2016) ) g:Profiler-a web server for functional interpretation of gene lists (2016 update). Nucleic Acids Res 44: , W83–89. |
[36] | Wang J , Vasaikar S , Shi Z , Greer M , Zhang B ((2017) ) WebGestalt 2017: A more comprehensive, powerful, flexible and interactive gene set enrichment analysis toolkit. Nucleic Acids Res 45: , W130–W137. |
[37] | Richardson JE , Bult CJ ((2015) ) Visual annotation display (VLAD): A tool for finding functional themes in lists of genes. Mamm Genome 26: , 567–573. |
[38] | Maere S , Heymans K , Kuiper M ((2005) ) BiNGO: A Cytoscape plugin to assess overrepresentation of gene ontology categories in biological networks. Bioinformatics 21: , 3448–3449. |
[39] | Mi H , Muruganujan A , Ebert D , Huang X , Thomas PD ((2019) ) PANTHER version 14: More genomes, a new PANTHER GO-slim and improvements in enrichment analysis tools. Nucleic Acids Res 47: , D419–D426. |
[40] | de Leeuw CA , Mooij JM , Heskes T , Posthuma D ((2015) ) MAGMA: Generalized gene-set analysis of GWAS data. PLoS Comput Biol 11: , e1004219. |
[41] | Holmans P , Green EK , Pahwa JS , Ferreira MA , Purcell SM , Sklar P , Wellcome Trust Case-Control Consortium, Owen MJ , O’Donovan MC , Craddock N ((2009) ) Gene ontology analysis of GWA study data sets provides insights into the biology of bipolar disorder. Am J Hum Genet 85: , 13–24. |
[42] | Holmans P , Moskvina V , Jones L , Sharma M , International Parkinson’s Disease Genomics Consortium, Vedernikov A , Buchel F , Saad M , Sadd M , Bras JM , Bettella F , Nicolaou N , Simón-Sánchez J , Mittag F , Gibbs JR , Schulte C , Durr A , Guerreiro R , Hernandez D , Brice A , Stefánsson H , Majamaa K , Gasser T , Heutink P , Wood NW , Martinez M , Singleton AB , Nalls MA , Hardy J , Morris HR , Williams NM ((2013) ) A pathway-based analysis provides additional support for an immune-related genetic susceptibility to Parkinson’s disease. Hum Mol Genet 22: , 1039–1049. |
[43] | Avramopoulos D , Szymanski M , Wang R , Bassett S ((2011) ) Gene expression reveals overlap between normal aging and Alzheimer’s disease genes. Neurobiol Aging 32: , 2319.e2327–2334. |
[44] | Kramarz B , Roncaglia P , Meldal BHM , Huntley RP , Martin MJ , Orchard S , Parkinson H , Brough D , Bandopadhyay R , Hooper NM , Lovering RC ((2018) ) Improving the Gene Ontology resource to facilitate more informative analysis and interpretation of Alzheimer’s disease data. Genes (Basel) 9: , E593. |
[45] | Foulger RE , Denny P , Hardy J , Martin MJ , Sawford T , Lovering RC ((2016) ) Using the Gene Ontology to annotate key players in Parkinson’s disease. Neuroinformatics 14: , 297–304. |
[46] | Patel S , Roncaglia P , Lovering RC ((2015) ) Using Gene Ontology to describe the role of the neurexin-neuroligin-SHANK complex in human, mouse and rat and its relevance to autism. BMC Bioinformatics 16: , 186. |
[47] | Koopmans F , van Nierop P , Andres-Alonso M , Byrnes A , Cijsouw T , Coba MP , Cornelisse LN , Farrell RJ , Goldschmidt HL , Howrigan DP , Hussain NK , Imig C , de Jong APH , Jung H , Kohansalnodehi M , Kramarz B , Lipstein N , Lovering RC , MacGillavry H , Mariano V , Mi H , Ninov M , Osumi-Sutherland D , Pielot R , Smalla KH , Tang H , Tashman K , Toonen RFG , Verpelli C , Reig-Viader R , Watanabe K , van Weering J , Achsel T , Ashrafi G , Asi N , Brown TC , De Camilli P , Feuermann M , Foulger RE , Gaudet P , Joglekar A , Kanellopoulos A , Malenka R , Nicoll RA , Pulido C , de Juan-Sanz J , Sheng M , Südhof TC , Tilgner HU , Bagni C , Bayés À , Biederer T , Brose N , Chua JJE , Dieterich DC , Gundelfinger ED , Hoogenraad C , Huganir RL , Jahn R , Kaeser PS , Kim E , Kreutz MR , McPherson PS , Neale BM , O’Connor V , Posthuma D , Ryan TA , Sala C , Feng G , Hyman SE , Thomas PD , Smit AB , Verhage M ((2019) ) SynGO: An evidence-based, expert-curated knowledge base for the synapse. Neuron 103: , 217–234.e4. |
[48] | Ittner LM , Ke YD , Delerue F , Bi M , Gladbach A , van Eersel J , Wölfing H , Chieng BC , Christie MJ , Napier IA , Eckert A , Staufenbiel M , Hardeman E , Götz J ((2010) ) Dendritic function of tau mediates amyloid-beta toxicity in Alzheimer’s disease mouse models. Cell 142: , 387–397. |
[49] | Iqbal K , Liu F , Gong CX , Grundke-Iqbal I ((2010) ) Tau in Alzheimer disease and related tauopathies. Curr Alzheimer Res 7: , 656–664. |
[50] | Butterfield DA , Boyd-Kimball D ((2004) ) Amyloid beta-peptide(1-42) contributes to the oxidative stress and neurodegeneration found in Alzheimer disease brain. Brain Pathol 14: , 426–432. |
[51] | Nelson PT , Braak H , Markesbery WR ((2009) ) Neuropathology and cognitive impairment in Alzheimer disease: A complex but coherent relationship. J Neuropathol Exp Neurol 68: , 1–14. |
[52] | Huntley RP , Kramarz B , Sawford T , Umrao Z , Kalea A , Acquaah V , Martin MJ , Mayr M , Lovering RC ((2018) ) Expanding the horizons of microRNA bioinformatics. RNA 24: , 1005–1017. |
[53] | Huntley RP , Sitnikov D , Orlic-Milacic M , Balakrishnan R , D’Eustachio P , Gillespie ME , Howe D , Kalea AZ , Maegdefessel L , Osumi-Sutherland D , Petri V , Smith JR , Van Auken K , Wood V , Zampetaki A , Mayr M , Lovering RC ((2016) ) Guidelines for the functional annotation of microRNAs using the Gene Ontology. RNA 22: , 667–676. |
[54] | Deczkowska A , Keren-Shaul H , Weiner A , Colonna M , Schwartz M , Amit I ((2018) ) Disease-associated microglia: A universal immune sensor of neurodegeneration. Cell 173: , 1073–1081. |
[55] | Simon E , Obst J , Gomez-Nicola D ((2018) ) The evolving dialogue of microglia and neurons in Alzheimer’s disease: Microglia as necessary transducers of pathology. Neuroscience 405: , 24–34. |
[56] | Carbon S , Ireland A , Mungall CJ , Shu S , Marshall B , Lewis S , AmiGO Hub; Web Presence Working Group ((2009) ) AmiGO: Online access to ontology and annotation data. Bioinformatics 25: , 288–289. |
[57] | Binns D , Dimmer E , Huntley R , Barrell D , O’Donovan C , Apweiler R ((2009) ) QuickGO: A web-based tool for Gene Ontology searching. Bioinformatics 25: , 3045–3046. |
[58] | Chou CH , Shrestha S , Yang CD , Chang NW , Lin YL , Liao KW , Huang WC , Sun TH , Tu SJ , Lee WH , Chiew MY , Tai CS , Wei TY , Tsai TR , Huang HT , Wang CY , Wu HY , Ho SY , Chen PR , Chuang CH , Hsieh PJ , Wu YS , Chen WL , Li MJ , Wu YC , Huang XY , Ng FL , Buddhakosai W , Huang PC , Lan KC , Huang CY , Weng SL , Cheng YN , Liang C , Hsu WL , Huang HD ((2018) ) miRTarBase update 2018: A resource for experimentally validated microRNA-target interactions. Nucleic Acids Res 46: , D296–D302. |
[59] | National Center for Biotechnology Information. PubMed. Available online: https://www.ncbi.nlm.nih.gov/pubmed/ |
[60] | Gray KA , Yates B , Seal RL , Wright MW , Bruford EA ((2015) ) Genenames.org: The HGNC resources in 2015. Nucleic Acids Res 43: , D1079–1085. |
[61] | Eyre TA , Wright MW , Lush MJ , Bruford EA ((2007) ) HCOP: A searchable database of human orthology predictions. Brief Bioinform 8: , 2–5. |
[62] | Denny P , Feuermann M , Hill DP , Lovering RC , Plun-Favreau H , Roncaglia P ((2018) ) Exploring autophagy with Gene Ontology. Autophagy 14: , 419–436. |
[63] | Balakrishnan R , Harris MA , Huntley R , Van Auken K , Cherry JM ((2013) ) A guide to best practices for Gene Ontology (GO) manual annotation. Database (Oxford) 2013: , bat054. |
[64] | Huntley RP , Harris MA , Alam-Faruque Y , Blake JA , Carbon S , Dietze H , Dimmer EC , Foulger RE , Hill DP , Khodiyar VK , Lock A , Lomax J , Lovering RC , Mutowo-Meullenet P , Sawford T , Van Auken K , Wood V , Mungall CJ ((2014) ) A method for increasing expressivity of Gene Ontology annotations using a compositional approach. BMC Bioinformatics 15: , 155. |
[65] | The UniProt Consortium ((2019) ) UniProt: A worldwide hub of protein knowledge. Nucleic Acids Res 47: , D506–D515. |
[66] | The RNAcentral Consortium ((2019) ) RNAcentral: A hub of information for non-coding RNA sequences. Nucleic Acids Res 47: , D221–D229. |
[67] | Meldal BH , Forner-Martinez O , Costanzo MC , Dana J , Demeter J , Dumousseau M , Dwight SS , Gaulton A , Licata L , Melidoni AN , Ricard-Blum S , Roechert B , Skyzypek MS , Tiwari M , Velankar S , Wong ED , Hermjakob H , Orchard S ((2015) ) The complex portal–an encyclopaedia of macromolecular complexes. Nucleic Acids Res 43: , D479–484. |
[68] | Zerbino DR , Achuthan P , Akanni W , Amode MR , Barrell D , Bhai J , Billis K , Cummins C , Gall A , Girón CG , Gil L , Gordon L , Haggerty L , Haskell E , Hourlier T , Izuogu OG , Janacek SH , Juettemann T , To JK , Laird MR , Lavidas I , Liu Z , Loveland JE , Maurel T , McLaren W , Moore B , Mudge J , Murphy DN , Newman V , Nuhn M , Ogeh D , Ong CK , Parker A , Patricio M , Riat HS , Schuilenburg H , Sheppard D , Sparrow H , Taylor K , Thormann A , Vullo A , Walts B , Zadissa A , Frankish A , Hunt SE , Kostadima M , Langridge N , Martin FJ , Muffato M , Perry E , Ruffier M , Staines DM , Trevanion SJ , Aken BL , Cunningham F , Yates A , Flicek P ((2018) ) Ensembl 2018. Nucleic Acids Res 46: , D754–D761. |
[69] | Giglio M , Tauber R , Nadendla S , Munro J , Olley D , Ball S , Mitraka E , Schriml LM , Gaudet P , Hobbs ET , Erill I , Siegele DA , Hu JC , Mungall C , Chibucos MC ((2019) ) ECO, the Evidence & Conclusion Ontology: Community standard for evidence information. Nucleic Acids Res 47: , D1186–D1194. |
[70] | Brown GR , Hem V , Katz KS , Ovetsky M , Wallin C , Ermolaeva O , Tolstoy I , Tatusova T , Pruitt KD , Maglott DR , Murphy TD ((2015) ) Gene: A gene-centered information resource at NCBI. Nucleic Acids Res 43: , D36–42. |
[71] | Kozomara A , Birgaoanu M , Griffiths-Jones S ((2019) ) miRBase: From microRNA sequences to function. Nucleic Acids Res 47: , D155–D162. |
[72] | del-Toro N , Dumousseau M , Orchard S , Jimenez RC , Galeota E , Launay G , Goll J , Breuer K , Ono K , Salwinski L , Hermjakob H ((2013) ) A new reference implementation of the PSICQUIC web service. Nucleic Acids Res 41: , W601–606. |
[73] | Shannon P , Markiel A , Ozier O , Baliga NS , Wang JT , Ramage D , Amin N , Schwikowski B , Ideker T ((2003) ) Cytoscape: A software environment for integrated models of biomolecular interaction networks. Genome Res 13: , 2498–2504. |
[74] | Mi H , Muruganujan A , Huang X , Ebert D , Mills C , Guo X , Thomas PD ((2019) ) Protocol Update for large-scale genome and gene function analysis with the PANTHER classification system (v.14.0). Nat Protoc 14: , 703–721. |
[75] | Garcia O , Saveanu C , Cline M , Fromont-Racine M , Jacquier A , Schwikowski B , Aittokallio T ((2007) ) GOlorize: A Cytoscape plug-in for network visualization with Gene Ontology-based layout and coloring. Bioinformatics 23: , 394–396. |
[76] | Huang XH , Chen JS , Wang Q , Chen XL , Wen L , Chen LZ , Bi J , Zhang LJ , Su Q , Zeng WT ((2011) ) miR-338-3p suppresses invasion of liver cancer cell by targeting smoothened. J Pathol 225: , 463–472. |
[77] | Wu Q , Ye X , Xiong Y , Zhu H , Miao J , Zhang W , Wan J ((2016) ) The protective role of microRNA-200c in Alzheimer’s disease pathologies is induced by beta amyloid-triggered endoplasmic reticulum stress. Front Mol Neurosci 9: , 140. |
[78] | Iwaniuk KM , Schira J , Weinhold S , Jung M , Adjaye J , Müller HW , Wernet P , Trompeter HI ((2011) ) Network-like impact of MicroRNAs on neuronal lineage differentiation of unrestricted somatic stem cells from human cord blood. Stem Cells Dev 20: , 1383–1394. |
[79] | Zhang R , Tian A , Wang J , Shen X , Qi G , Tang Y ((2015) ) miR26a modulates Th17/T reg balance in the EAE model of multiple sclerosis by targeting IL6. Neuromolecular Med 17: , 24–34. |
[80] | Lovering RC , Dimmer EC , Talmud PJ ((2009) ) Improvements to cardiovascular gene ontology. Atherosclerosis 205: , 9–14. |
[81] | Huntley RP , Kramarz B , Sawford T , Martin MJ , Brough D , Lovering RC ((2019) ) Functional annotation of dementia-related miRNAs using Gene Ontology. In The 12th International Biocuration Conference, Cambridge, UK. doi:10.7490/f1000research.1116568.1. |
[82] | Orchard S , Kerrien S , Abbani S , Aranda B , Bhate J , Bidwell S , Bridge A , Briganti L , Brinkman FS , Brinkman F , Cesareni G , Chatr-aryamontri A , Chautard E , Chen C , Dumousseau M , Goll J , Hancock RE , Hancock R , Hannick LI , Jurisica I , Khadake J , Lynn DJ , Mahadevan U , Perfetto L , Raghunath A , Ricard-Blum S , Roechert B , Salwinski L , Stümpflen V , Tyers M , Uetz P , Xenarios I , Hermjakob H ((2012) ) Protein interaction data curation: The International Molecular Exchange (IMEx) consortium. Nat Methods 9: , 345–350. |
[83] | Concepcion CP , Bonetti C , Ventura A ((2012) ) The microRNA-17-92 family of microRNA clusters in development and disease. Cancer J 18: , 262–267. |
[84] | Wang B , Li W , Liu H , Yang L , Liao Q , Cui S , Wang H , Zhao L ((2014) ) miR-29b suppresses tumor growth and metastasis in colorectal cancer via downregulating Tiam1 expression and inhibiting epithelial-mesenchymal transition. Cell Death Dis 5: , e1335. |
[85] | Ayers D , Scerri C ((2018) ) Non-coding RNA influences in dementia. Noncoding RNA Res 3: , 188–194. |
[86] | Lemche E ((2018) ) Early life stress and epigenetics in late-onset Alzheimer’s dementia: A systematic review. Curr Genomics 19: , 522–602. |
[87] | Patel S , Park MT , Chakravarty MM , Knight J , Alzheimer’s Disease Neuroimaging Initiative ((2016) ) Gene prioritization for imaging genetics studies using Gene Ontology and a stratified false discovery rate approach. Front Neuroinform 10: , 14. |
[88] | Malhotra A , Younesi E , Gündel M , Müller B , Heneka MT , Hofmann-Apitius M ((2014) ) ADO: A disease ontology representing the domain knowledge specific to Alzheimer’s disease. Alzheimers Dement 10: , 238–246. |
[89] | Dramé K , Diallo G , Delva F , Dartigues JF , Mouillet E , Salamon R , Mougin F ((2014) ) Reuse of termino-ontological resources and text corpora for building a multilingual domain ontology: An application to Alzheimer’s disease. J Biomed Inform 48: , 171–182. |
[90] | Refolo LM , Snyder H , Liggins C , Ryan L , Silverberg N , Petanceska S , Carrillo MC ((2012) ) Common Alzheimer’s disease research ontology: National Institute on Aging and Alzheimer’s Association collaborative project. Alzheimers Dement 8: , 372–375. |
[91] | Reynolds RH , Hardy J , Ryten M , Gagliano Taliun SA ((2019) ) Informing disease modelling with brain-relevant functional genomic annotations. Brain 142: , 3694–3712. |
[92] | Huang dW , Sherman BT , Lempicki RA ((2009) ) Systematic and integrative analysis of large gene lists using DAVID bioinformatics resources. Nat Protoc 4: , 44–57. |
[93] | Lovering RC , Roncaglia P , Howe DG , Laulederkind SJF , Khodiyar VK , Berardini TZ , Tweedie S , Foulger RE , Osumi-Sutherland D , Campbell NH , Huntley RP , Talmud PJ , Blake JA , Breckenridge R , Riley PR , Lambiase PD , Elliott PM , Clapp L , Tinker A , Hill DP ((2018) ) Improving interpretation of cardiac phenotypes and enhancing discovery with expanded knowledge in the Gene Ontology. Circ Genom Precis Med 11: , e001813. |
[94] | Ferrari R , Grassi M , Salvi E , Borroni B , Palluzzi F , Pepe D , D’Avila F , Padovani A , Archetti S , Rainero I , Rubino E , Pinessi L , Benussi L , Binetti G , Ghidoni R , Galimberti D , Scarpini E , Serpente M , Rossi G , Giaccone G , Tagliavini F , Nacmias B , Piaceri I , Bagnoli S , Bruni AC , Maletta RG , Bernardi L , Postiglione A , Milan G , Franceschi M , Puca AA , Novelli V , Barlassina C , Glorioso N , Manunta P , Singleton A , Cusi D , Hardy J , Momeni P ((2015) ) A genome-wide screening and SNPs-to-genes approach to identify novel genetic risk factors associated with frontotemporal dementia. Neurobiol Aging 36: , 2904.e2913–2926. |
[95] | Welton JL , Loveless S , Stone T , von Ruhland C , Robertson NP , Clayton A ((2017) ) Cerebrospinal fluid extracellular vesicle enrichment for protein biomarker discovery in neurological disease; multiple sclerosis. J Extracell Vesicles 6: , 1369805. |
[96] | Hirsch T , Rothoeft T , Teig N , Bauer JW , Pellegrini G , De Rosa L , Scaglione D , Reichelt J , Klausegger A , Kneisz D , Romano O , Secone Seconetti A , Contin R , Enzo E , Jurman I , Carulli S , Jacobsen F , Luecke T , Lehnhardt M , Fischer M , Kueckelhaus M , Quaglino D , Morgante M , Bicciato S , Bondanza S , De Luca M ((2017) ) Regeneration of the entire human epidermis using transgenic stem cells. Nature 551: , 327–332. |
[97] | Huntley RP , Binns D , Dimmer E , Barrell D , O’Donovan C , Apweiler R ((2009) ) QuickGO: A user tutorial for the web-based Gene Ontology browser. Database (Oxford) 2009: , bap010. |


